Article

Low Temperature Effect on Different Varieties of Corchorus capsularis and Corchorus olitorius at Seedling Stage

1
Annual Bast Fiber Breeding Laboratory, Institute of Bast Fiber Crops, Chinese Academy of Agricultural Sciences, Changsha 410205, China
2
Department of Chemistry, Institute of Bast Fiber Crops, Chinese Academy of Agricultural Sciences, Changsha 410205, China
*
Authors to whom correspondence should be addressed.
Agronomy 2021, 11(12), 2547; https://doi.org/10.3390/agronomy11122547
Submission received: 11 November 2021 / Revised: 12 December 2021 / Accepted: 13 December 2021 / Published: 15 December 2021

Abstract

:
To address the demand for natural fibers, developing new varieties that are resistant to abiotic stress is necessary. The present study was designed to investigate the physiological and biochemical traits of three varieties of C. capularis (Y49, Y38, and Y1) and four varieties C. olitorius (T8, W57, M33, M18) under low temperature to identify the cold-tolerant varieties and elucidate the mechanisms involved in enhancing cold tolerance. Research findings revealed that the varieties Y49 and M33 exhibited the highest chlorophyll and carotenoid content. Biochemical profiles revealed that varieties Y49 and M33 were found to be able to withstand low-temperature stress by accumulating different enzymatic and non-enzymatic antioxidants, such as superoxide dismutase (SOD), peroxidase (POD), catalase (CAT), ascorbate peroxidase (APx), glutathione (GSH), and phenolics, which participated in reducing the content of malondialdehyde (MDA) and hydrogen peroxide (H2O2) caused by low temperature. Osmolytes compounds, such as total soluble sugar, significantly increased in Y49 and M33; and proline content decreased in all varieties except Y49 and M33 after low-temperature exposure. The rise in these osmolytes molecules can be a defense mechanism for the jute’s osmotic readjustment to reduce the oxidative damage induced by low temperature. Furthermore, PCA and hierarchical cluster analysis distinguished the seven varieties into three separate groups. Results confirmed that group I (Y49 and M33 varieties) were low-temperature tolerant, group II (M18, W57) were intermediate, whereas III groups (Y38, T8, and Y1) were low temperature susceptible. PCA also explained 88.36% of the variance of raw data and clearly distinguished three groups that are similar to the cluster heat map. The study thus confirmed the tolerance of selected varieties that might be an efficient adaptation strategy and utilized them for establishing breeding programs for cold tolerance.

1. Introduction

Low temperature is a significant abiotic factor in China limiting plant dispersion on land, impeding plant growth and crop productivity, yield, and quality, and limiting the geographical area suited for cultivating a specific plant species [1,2,3]. Crops are exposed to periods of intense cold in many parts of the world [4], and tropical plants are more susceptible to chilling than plants growing in cold climates [5].
Jute is an annual herb in the Malvaceae family, with two commercial species, C. capsularis and C. olitorious [6]. Jute is produced in twenty countries, although Bangladesh, India, and China account for 85% of global production [7,8]. Jute fiber is naturally occurring, soft, shiny, longest, strongest, and most recyclable derived from stem bark [8]. Recently, jute has gained popularity as herbal medicine, renewable biofuel, and paper fiber [8,9,10]. Thus, the global demand for jute is increasing [11]. As global environmental awareness rises, more people are actively purchasing environmentally friendly products. While jute is a natural fiber, they have many composite-like properties like rigidity and flexibility. Jute would be a unique source to supply the global demand for eco-friendly fibers.
It provides luxuriant growth in a warm and humid climate with temperatures between 24 °C and 37 °C for optimum fiber yield, and the growth rate gradually slows down when temperatures fall below this range [12]. It has been reported that jute is a short-day fiber plant. The majority of biological responses that occur in jute are temperature dependent. Any early planting provides premature flowering and reduces plant growth and yield of fiber due to thermal sensitivity. It was reported that some varieties can be planted early with the absence of premature flowering in appropriate sowing time [12]. In China’s subtropics, where cold weather is unpredictable, extending the growing season (early planting and late harvesting) is crucial. Intensive cropping during late March and early April could make jute more profitable in China’s subtropics and warm temperate zones, as well as in jute growing countries. It was proved that appropriate sowing and harvesting could allow facilities to fit the crop in three cropped patterns [12]. If an intensive cropping pattern could be established in which jute is produced from late February to early March, it is believed that jute could be more profitably cultivated in Asia’s jute producing countries [13]. For this purpose, new varieties that are tolerant to low temperatures will be required; therefore, new varieties should be developed to endure various biotic and abiotic stresses.
However, there is no proof of physiological or biochemical investigation for jute’s cold tolerance mechanism. In a previous study carried out only on the molecular level, where DNA fingerprinting randomly amplified polymorphic DNA (RAPD) and automated amplified fragment length, polymorphism (AFLP) was used to detect or distinguish between cold-tolerant and cold-sensitive jute species was assessed [13]. Findings indicated that eight primer combinations distinguished the two cold-sensitive and four cold-tolerant jute populations using 93 polymorphic fragments. Understanding low-temperature adaptation is crucial to developing cold-tolerant crops. It has been reported that extreme temperature can cause changes in numerous physiological, biochemical, molecular, and metabolic processes, including membrane fluidity, enzyme activity, and homeostatic metabolism, which can impact agriculture [14] by overproducing reactive oxygen species (ROS), such as superoxide anions (O2) and hydrogen peroxide (H2O2). Interestingly, plants have antioxidant systems with various enzymatic and non-enzymatic components to protect them from the injury caused by reactive oxygen species ROS [15]. Plants have evolved many antioxidant systems and osmolytes to cope with stress. These include superoxide dismutase (SOD), peroxidase (POD), catalase (CAT), glutathione (GSH), and proline, all of which contribute to scavenging H2O2 with different mechanisms under stressful conditions and avoid oxidative damage [16,17,18]. Understanding low-temperature adaption processes are crucial for the development of cold-tolerant crops. This research report summarizes the physiological responses of a representative sample of jute varieties to cold stress, as ascertained by quantification of photosynthetic parameters, ROS-mediated damage, antioxidant accumulation, and osmolyte accumulation, all of which differentiate the sensitive and tolerance jute phenomes. The main purpose of the present study was to evaluate low temperature physiological, biochemical, and antioxidant defense responses to verify the tolerance level of seven selected C. capsularis and C. olitorius varieties from earlier experiments.

2. Materials and Methods

2.1. Plant Materials, Growth Conditions, and Cold Stress Treatment

Seeds of Corchorus capularis (Y49, Y38, and Y1) and Corchorus olitorius (T8, W57, M33, M18) varieties were collected from the Institute of Bast Fiber Crops (IBFC), Chinese Academy of Agricultural Sciences (CAAS) Changsha, Hunan (Table 1). These varieties were previously screened out from large populations by studying low-temperature stress based on their germination rate, survival rate, visual scoring under cold stress and physiological, and biochemical parameters. The selected jute varieties were distinguished as tolerant (Y49 and M33), intermediate (W57 and M18), and sensitive (Y38, T8 and Y1) to low temperature and used in this present study. Seeds of all varieties were carefully rinsed with sterile deionized water after 10 min of surface sterilization with 10% NaClO. Then seeds were placed in a 19 × 14.5 × 6 cm germination box with three layers of sterile filter paper. The box was placed in a brightly illuminated incubator set at 25 °C with daily water top ups for germination. After three days of sprouting, seedlings were moved to quarter-strength Hoagland nutritional solution containing 5.79 mmol L−1 calcium and placed in culture pots (40 × 20 cm) (NO3)2, 8.02 µmmol L−1 KNO3, 1.35 mmol L−1 NH4H2PO4, 4.17 mmol L−1 MgSO4, 8.90 µmol L−1 MnSO4, 48.3 µmol L−1 H3BO3, 0.94 µmol L−1 ZnSO4, 0.20 µmol L−1 CuSO4, 0.015 µmol L−1 (NH4)2MoO4, and 72.6 µmol L−1 Fe-EDTA for subsequent growth [19]. Seedlings were grown in a culture room with a day/night temperature regime of 28/16 °C, a photoperiod of 16 h/8 h (light/dark), relative humidity of 60%, and a light intensity of 300 µmol m−2s−1. Every other day, the nutrition solution was replenished.
Five-week-old morphologically uniform seedlings were selected for treatment and transferred to another chamber for low-temperature stress. The treatment chamber’s temperature was set at 5 °C to simulate the low-temperature condition, and the plant maintained an optimal condition (28 °C) that was regarded as control. After 24 h of low-temperature stress, three to four fully expanded leaves were collected. Each sample contained a minimum of three individual plants of similar varieties mixed to form one sample. After collection, each sample tube was immediately steeped in liquid nitrogen and stored at −80 °C until analysis.

2.2. Determination of Photosynthetic Pigment Contents

About 0.1 g fresh leaf samples were homogenized with 10 mL (4.5:4.5:1) mixed solution of ethanol, acetone, and distilled water until the green-colored leaf sample turned white. After that, absorbance readings were recorded at 645, 663, and 470 nm, and concentration (mg/g FW) of chlorophyll a (Chl a), Chlorophyll b (Chl b), total chlorophyll (Chl t), and carotenoid were calculated by the formula [20].
Chlorophyll a (mg/g leaf fresh weight) = [12.7 (OD663) − 2.69 (OD645)] × V/1000 × W
Chlorophyll b (mg/g leaf fresh weight) = [22.9(OD645) − 4.68 (OD663)] × V/1000 × W
Total chlorophyll (mg/g leaf fresh weight) = [20.2 (OD645) + 8.02 (OD663)] × V/1000 × W
Carotenoid (mg/g leaf fresh weight) = [OD470 + (0.114 ∗ OD663) – (0.638 ∗ OD645)] × V/1000 × W
According to Sairam et al., the chlorophyll stability index (CSI) was developed [21]. It is calculated as follows: CSI = (Total Chl under stress/Total Chl under control) × 100.

2.3. Determination of Osmolyte Contents

The proline concentrations were determined using a slightly modified method reported by Bates, 1973 [22]. The proline content of fresh leaf samples (0.1 g) was assayed using aqueous 3% sulfosalicylic acid (5 mL) in a water bath for 10 min. Following this, the mixture was allowed to cool to ambient temperature, and then the resulting extract was filtered using filter paper. The supernatant from the second step was then combined with ninhydrin and acetic acid to make a 2.0 mL solution. The combination was then maintained in a boiling water bath for 30 min, and the reactions were terminated in an ice bath. After adding 5 mL of toluene, the mixture was left in the dark for 5 h. The absorbance of colored toluene at 520 nm was measured using the UV/Vis spectrophotometer (UV 2700, Shimadzu, Japan), with toluene serving as a blank. The amount of proline was tested using a standard curve constructed with L-proline common solution.
The amount of total soluble sugar (TSS) was determined using the anthrone method proposed by Yemn and Willis [23]. About 0.1 g fresh samples were placed in 10 mL cuvette, and after adding 10 mL distilled water, samples were heated at 100 °C for 1 h and then filtered into 25 mL volumetric flasks. The volumetric flask was filled up to mark by distilled water. Following that, 0.5 mL extracts, 0.5 mL mixed reagents (1 g anthrone + 50 mL ethyl acetate), 5 mL H2SO4 (98%), and 1.5 mL distilled water were added. After heating the mixture to 100 °C for a minute, the 630 nm absorbance was measured. Sucrose solution was used as a standard sample. The concentration of soluble sugar was measured using glucose as a standard solution.

2.4. Determination of Oxidative Damage and Enzymatic Antioxidant Activities

To determine the degree of oxidative damage and different antioxidant activity, 0.2 g fresh leaf was extracted with 5% thiobarbituric acid (TBA) dissolved in 5% trichloroacetic acid (TCA) for MDA content detection and homogenized in 0.2 M phosphate buffers (pH 7.0~7.5) for SOD, POD, APx, and CAT activity detection and GSH content. The assessed activities of MDA, H2O2, GSH, SOD, POD, CAT, and APx using the assay test kits were purchased from Nanjing Jian Cheng Bioengineering Institute in Nanjing, China. Protein content was determined using the Bradford protein colorimetry method with bovine serum albumin (BSA) as a protein standard [24]. Briefly, in a 50 mL 95% ethanol solution, 100 mg Coomassie Brilliant Blue G-250 was dissolved (C2H5OH). Following that, 100 mL of 85% phosphoric acid (H3PO4) was carefully added while stirring and then diluted with distilled water to a total volume of 1 L. The solution was filtered and maintained at a temperature of 4 °C. For the measurements, 20 µL extract and 200 µL Bradford solution were combined and incubated for 5 min before determining the absorbance at 595 nm using a UV/Vis spectrophotometer (UV 2700, Shimadzu, Japan).

2.5. Determination of Non-Enzymatic Antioxidant Compounds

The leaf sample (0.2 g) was homogenized in 10 mL of 80% ethanol to determine the total phenolic and flavonoids. The ethanolic extract was then centrifuged at 12,000× g for 20 min at 4 °C, and the supernatants were collected in the flask. The supernatant was then utilized to determine the total phenolic and flavonoid content.
The total flavonoid content (TFC) in the sample was determined using a modified aluminum chloride assay reported [25] with rutin as standard. Briefly, 1 mL of the extract was placed in a 10 mL volumetric tube. To begin, each volumetric flask was filled with 2 mL of 0.1 M AlCl3 and incubated for 5 min. Then, 3 mL of 1 M CH3COOK was added; the volume was topped up 10 mL with 80% ethanol and thoroughly mixed. At 420 nm, the absorbance was measured against a blank using a UV/Vis spectrophotometer (UV 2700, Shimadzu, Japan). The results were expressed in mg rutin equivalents per gram dry weight.
The concentration of total polyphenol content (TPC) was determined using the Folin–Ciocalteu colorimetric technique with minor modifications [26]. Briefly, 1.5 mL distilled water was added to 0.5 mL extracted plant samples in a test tube. After adding 0.2 mL FC reagent, the mixture was gently oscillated and maintained at room temperature for 4 min. Following that, each sample was vortexed with 0.8 mL of newly prepared 10% (w/w) Na2CO3. The mixtures were left for 1 h in a dark room condition to ensure a good reaction. The absorbance of the solution was determined using a UV/Vis spectrophotometer (UV 2700, Shimadzu, Japan) at 765 nm compared to the reagent blank. To estimate all of the determinations, three biological replications were carried out. The total phenolic content was reported in milligrams of gallic acid standard equivalent (mg) dry weight (mg of GAE/g DW).

3. Statistical Analysis

The data were examined using the one-way analysis of variance (ANOVA) using SPSS 16. The effect of treatment of each variety was determined compared to the control, and the statistical differences between control and treatment were performed using a least significant difference (LSD) test when p < 0.05. The correlation coefficient was determined using Pearson’s correlation coefficient. All data were transformed to stress tolerance indices prior to Pearson’s correlation, principal component analysis (PCA), and cluster analysis. The stress tolerance index was described as the observed value of a target trait when subjected to a particular level of stress divided by its mean value under control. To investigate the relationship between varieties and cluster features, principal component analysis (PCA) and cluster heat map analysis were performed using the Origin software and an online ClustVis application, respectively.

4. Results

4.1. Effect of Cold Stress on Photosynthetic Pigment Contents

Low temperature impacts chlorophyll level in plant species based on their cold tolerance [27,28]. To determine the effect of cold stress on photosynthesis, we measured chlorophyll a and b concentrations and total chlorophyll in jute plant leaves. The results of our experiment indicated that the production of photosynthetic pigments (Chl a, Chl b, and Total Chl) varied significantly between selected varieties, with variation patterns being comparable across all varieties (Table 2). It was observed that the total chlorophyll concentration of leaves declined with cold stress compared to their control. Greater decrease was observed in the varieties Y38 and T8, whereas a lower reduction rate was observed in Y49 and M33 varieties with the highest chlorophyll stability index (CSI) as 97.96% and 90.97%, respectively. Our findings suggested that these varieties were less harmed at 5 °C and more resistant to chilling injury than others, implying that they possessed a greater cold tolerance. In the case of the carotenoid content, a similar trend was observed as chlorophyll; except for Y49, all varieties showed declined trend compared to control. Meanwhile, the Y38 and T8 recorded significantly decreased by 18.46% and 19.62%, respectively, relative to control, and an increase and slight decrease was observed in Y49 and M33, respectively. This result suggests that Y49 and M33 have more low-temperature tolerance potential, whereas Y38 and T8 demonstrate a low degree of tolerance.

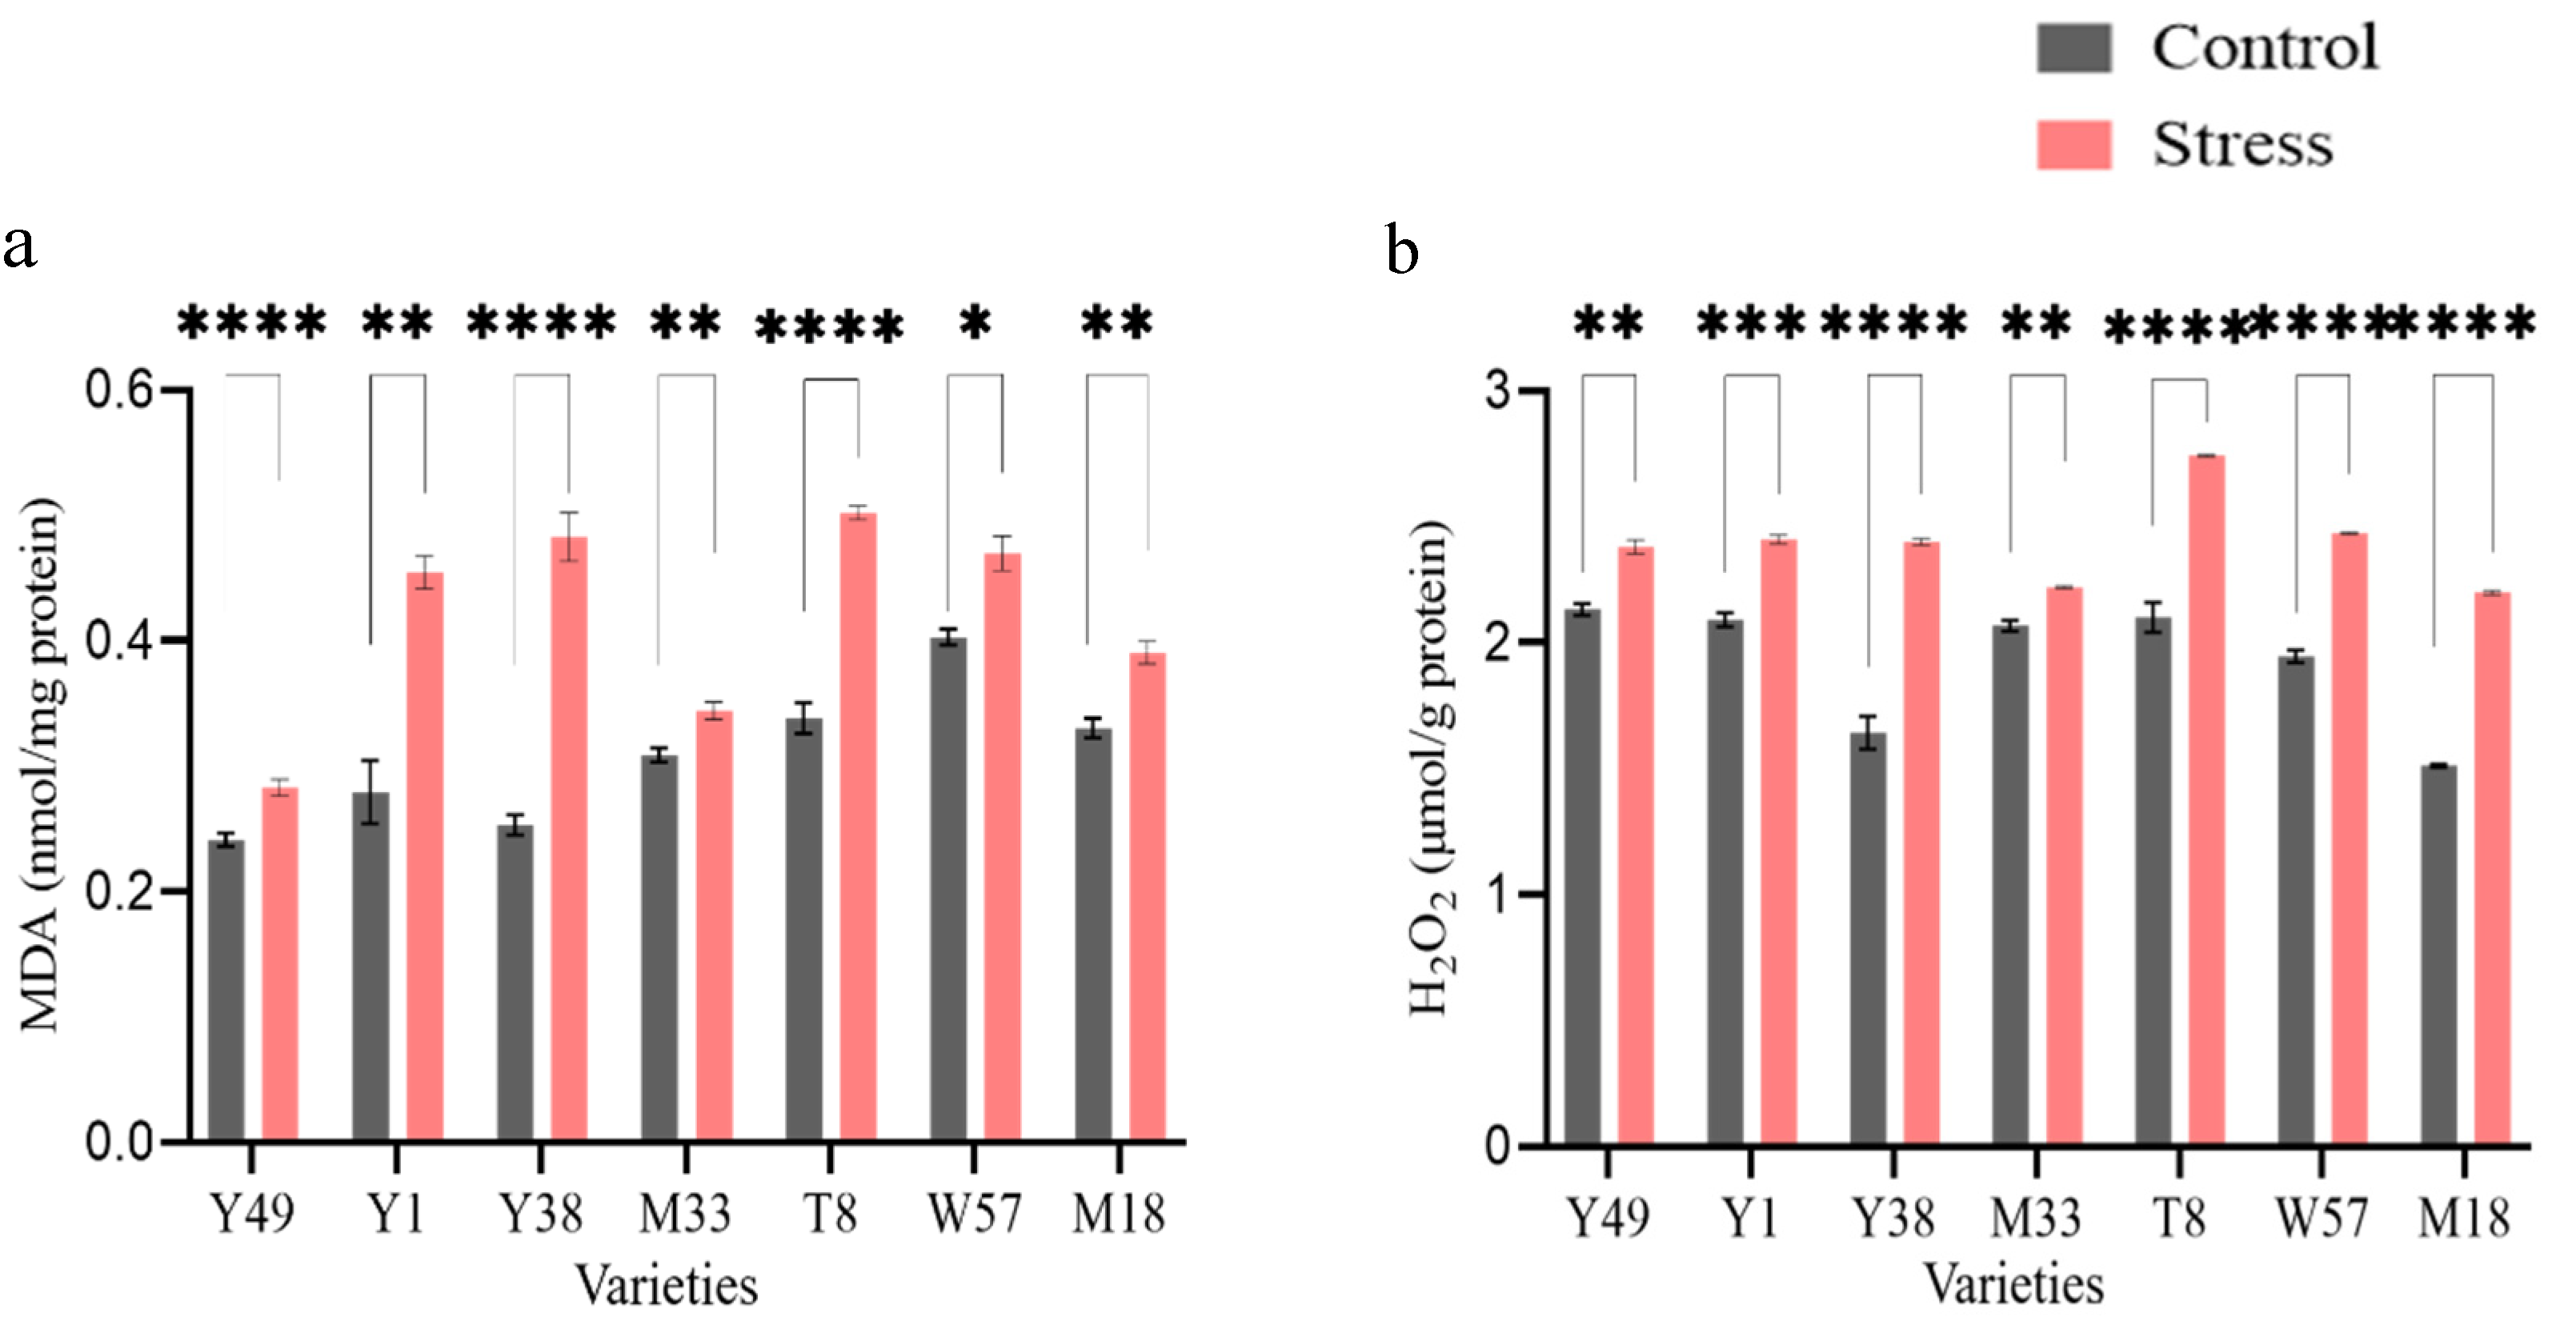
4.2. Oxidative Stress Evaluation

Lipid peroxidation, reflected by MDA content, usually accompanies ROS accumulation. Our experiment examined the effects of MDA content, and it showed that concentrations were considerably greater than the control. The highest increase was observed in Y38 (91.26%) and Y1 (65.81%), followed by T8 (48.82%). Whereas low level of MDA content was observed in Y49 (17.25%) and M33 (11.50%) varieties compared to optimal temperature (Figure 1a). The above result indicated that Y49 and M33 varieties suffered the least and cell membrane experienced little damage under cold injury, whereas Y1, Y38, and T8 varieties might have suffered severe and irreversible damage. The result of this study demonstrated that H2O2 content significantly increased under cold treatment conditions compared to control based on mean comparisons (Figure 1b). However, the lowest increase was noted in the varieties Y49 (11.64%) and M33 (17.25%). Whereas the Y38, T8, and M18 varieties showed a greater increase of H2O2 by 30.70~46.61% under low-temperature treatment than in the optimum temperature.

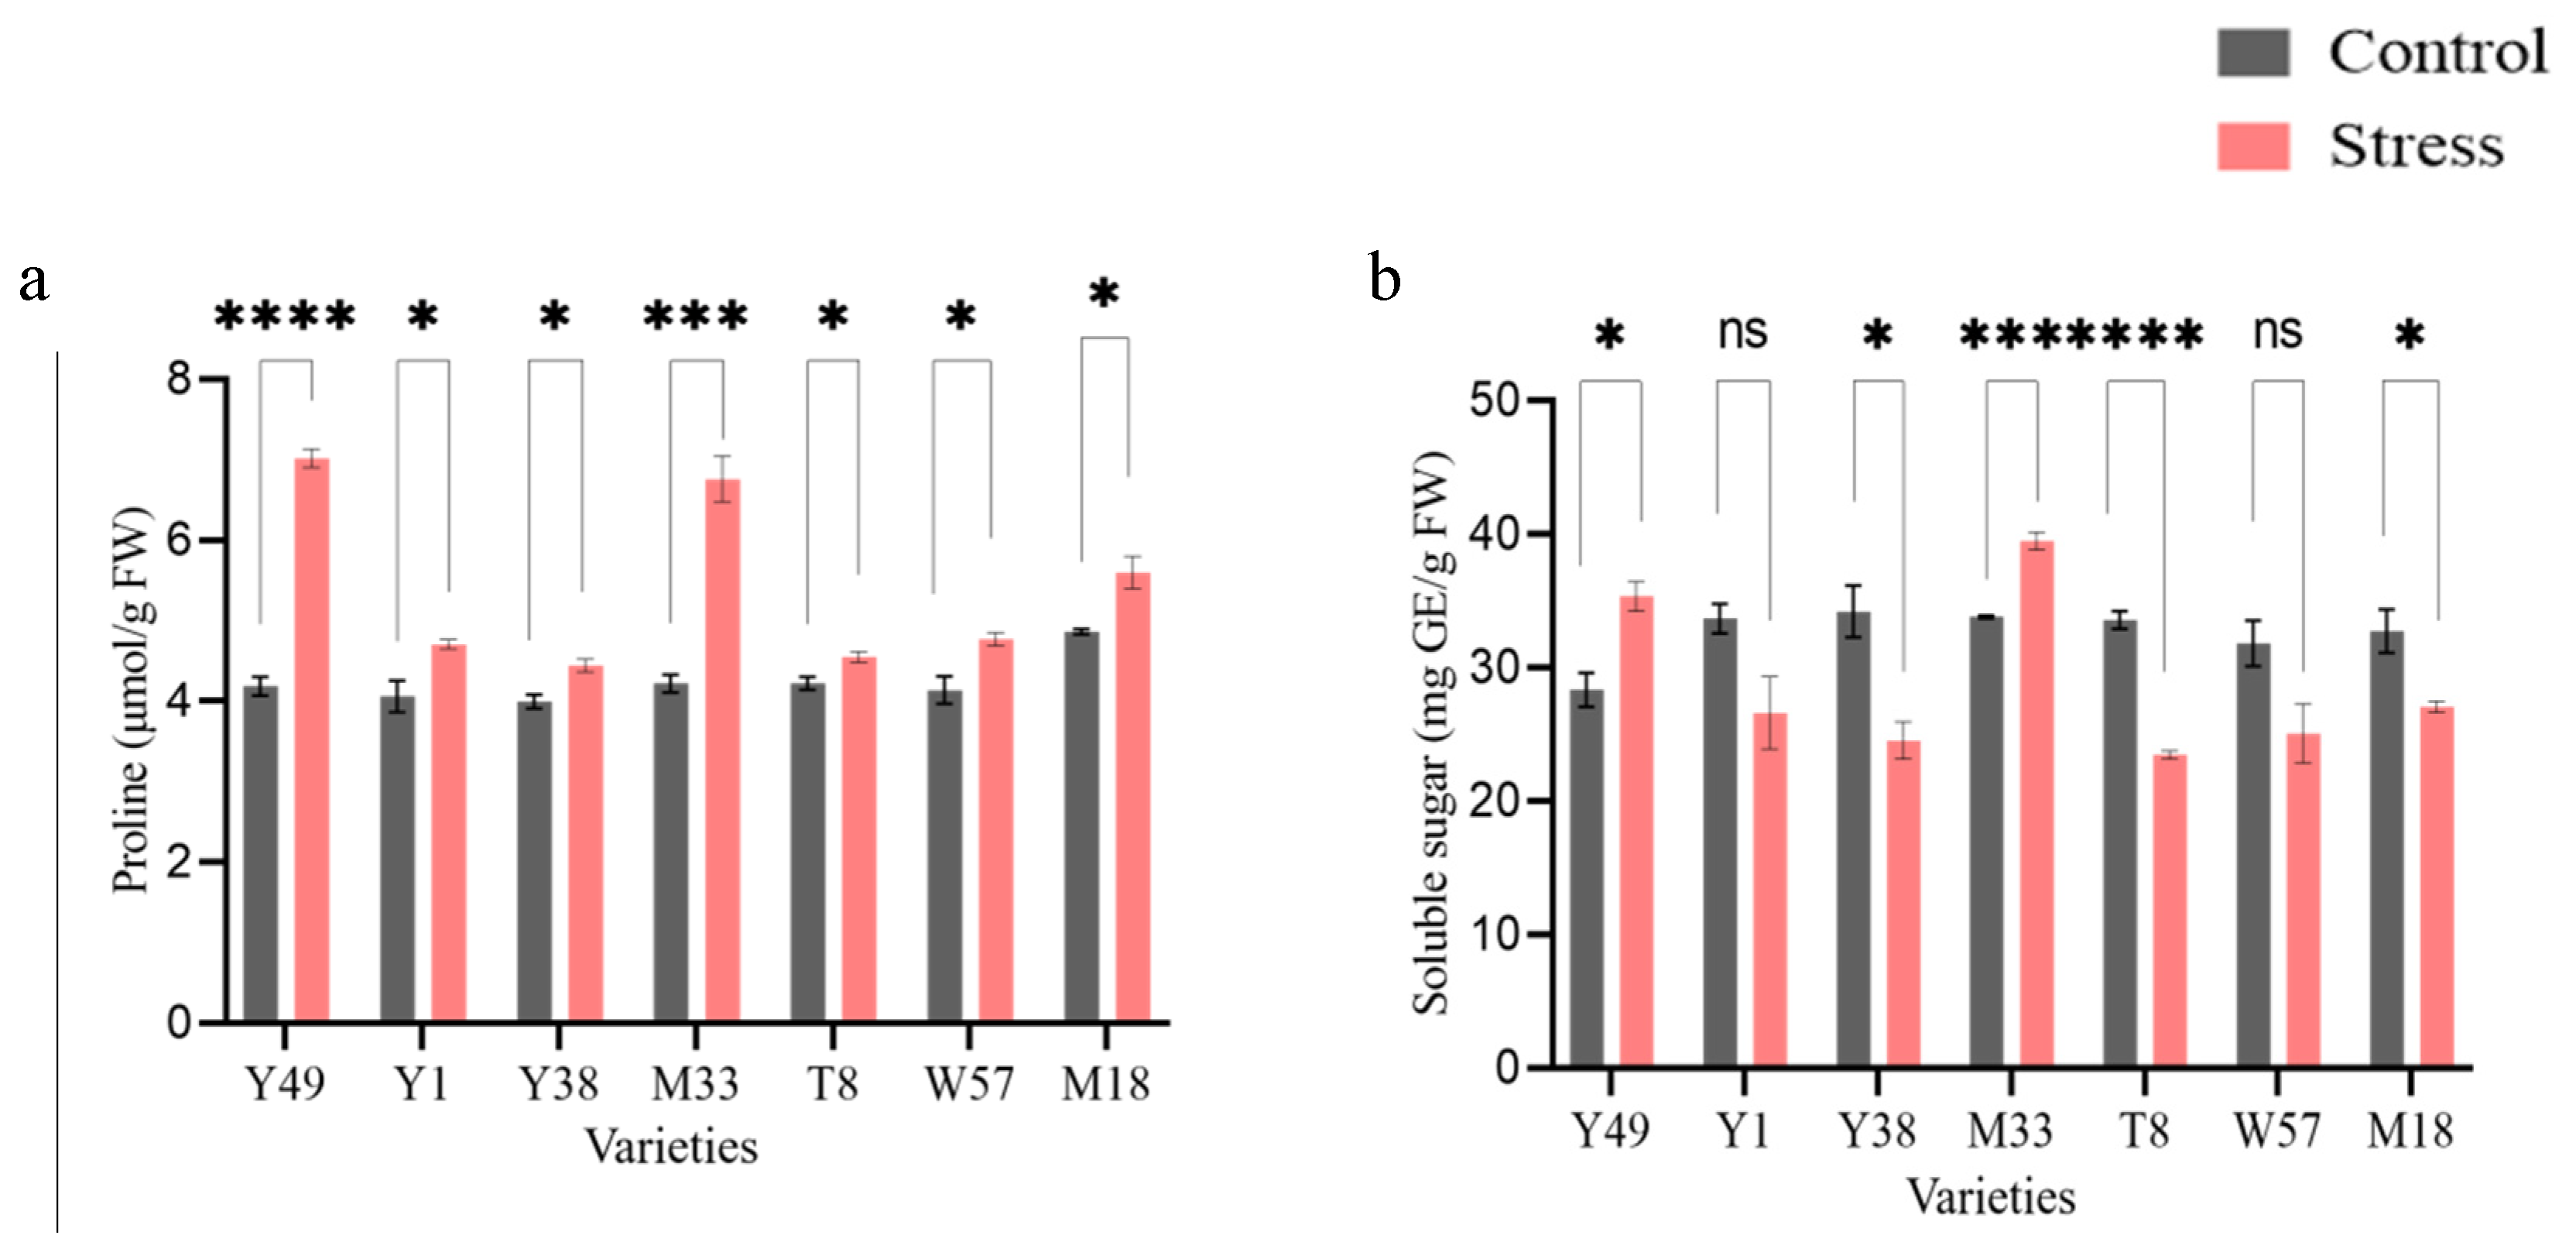
4.3. Effect of Cold Stress on Osmolytes Contents

The present investigation has shown that proline content is higher in leaves of stress treatment than under room temperature when exposed to 5 °C (Figure 2a). The most elevated proline was recorded in Y49, followed by M33 with 67.84% and 60.0% increased rate on cold stress compared to control condition, whereas the lowest increase was recorded in T8 (7.89%) and Y38 (11.39%)
In comparison to the control group after 24 h at 5 °C, our results revealed that total soluble sugar content of the leaves in most of the varieties demonstrated decline except Y49 and M33 (significantly increased by 16.77~24.99% and reached in highest in low-temperature treatment compared to other) (Figure 2b). Conversely, the highest rate of decrease was observed in the varieties T8 (30.07%) and Y38 (27.81%) compared to other varieties in stress treatment.

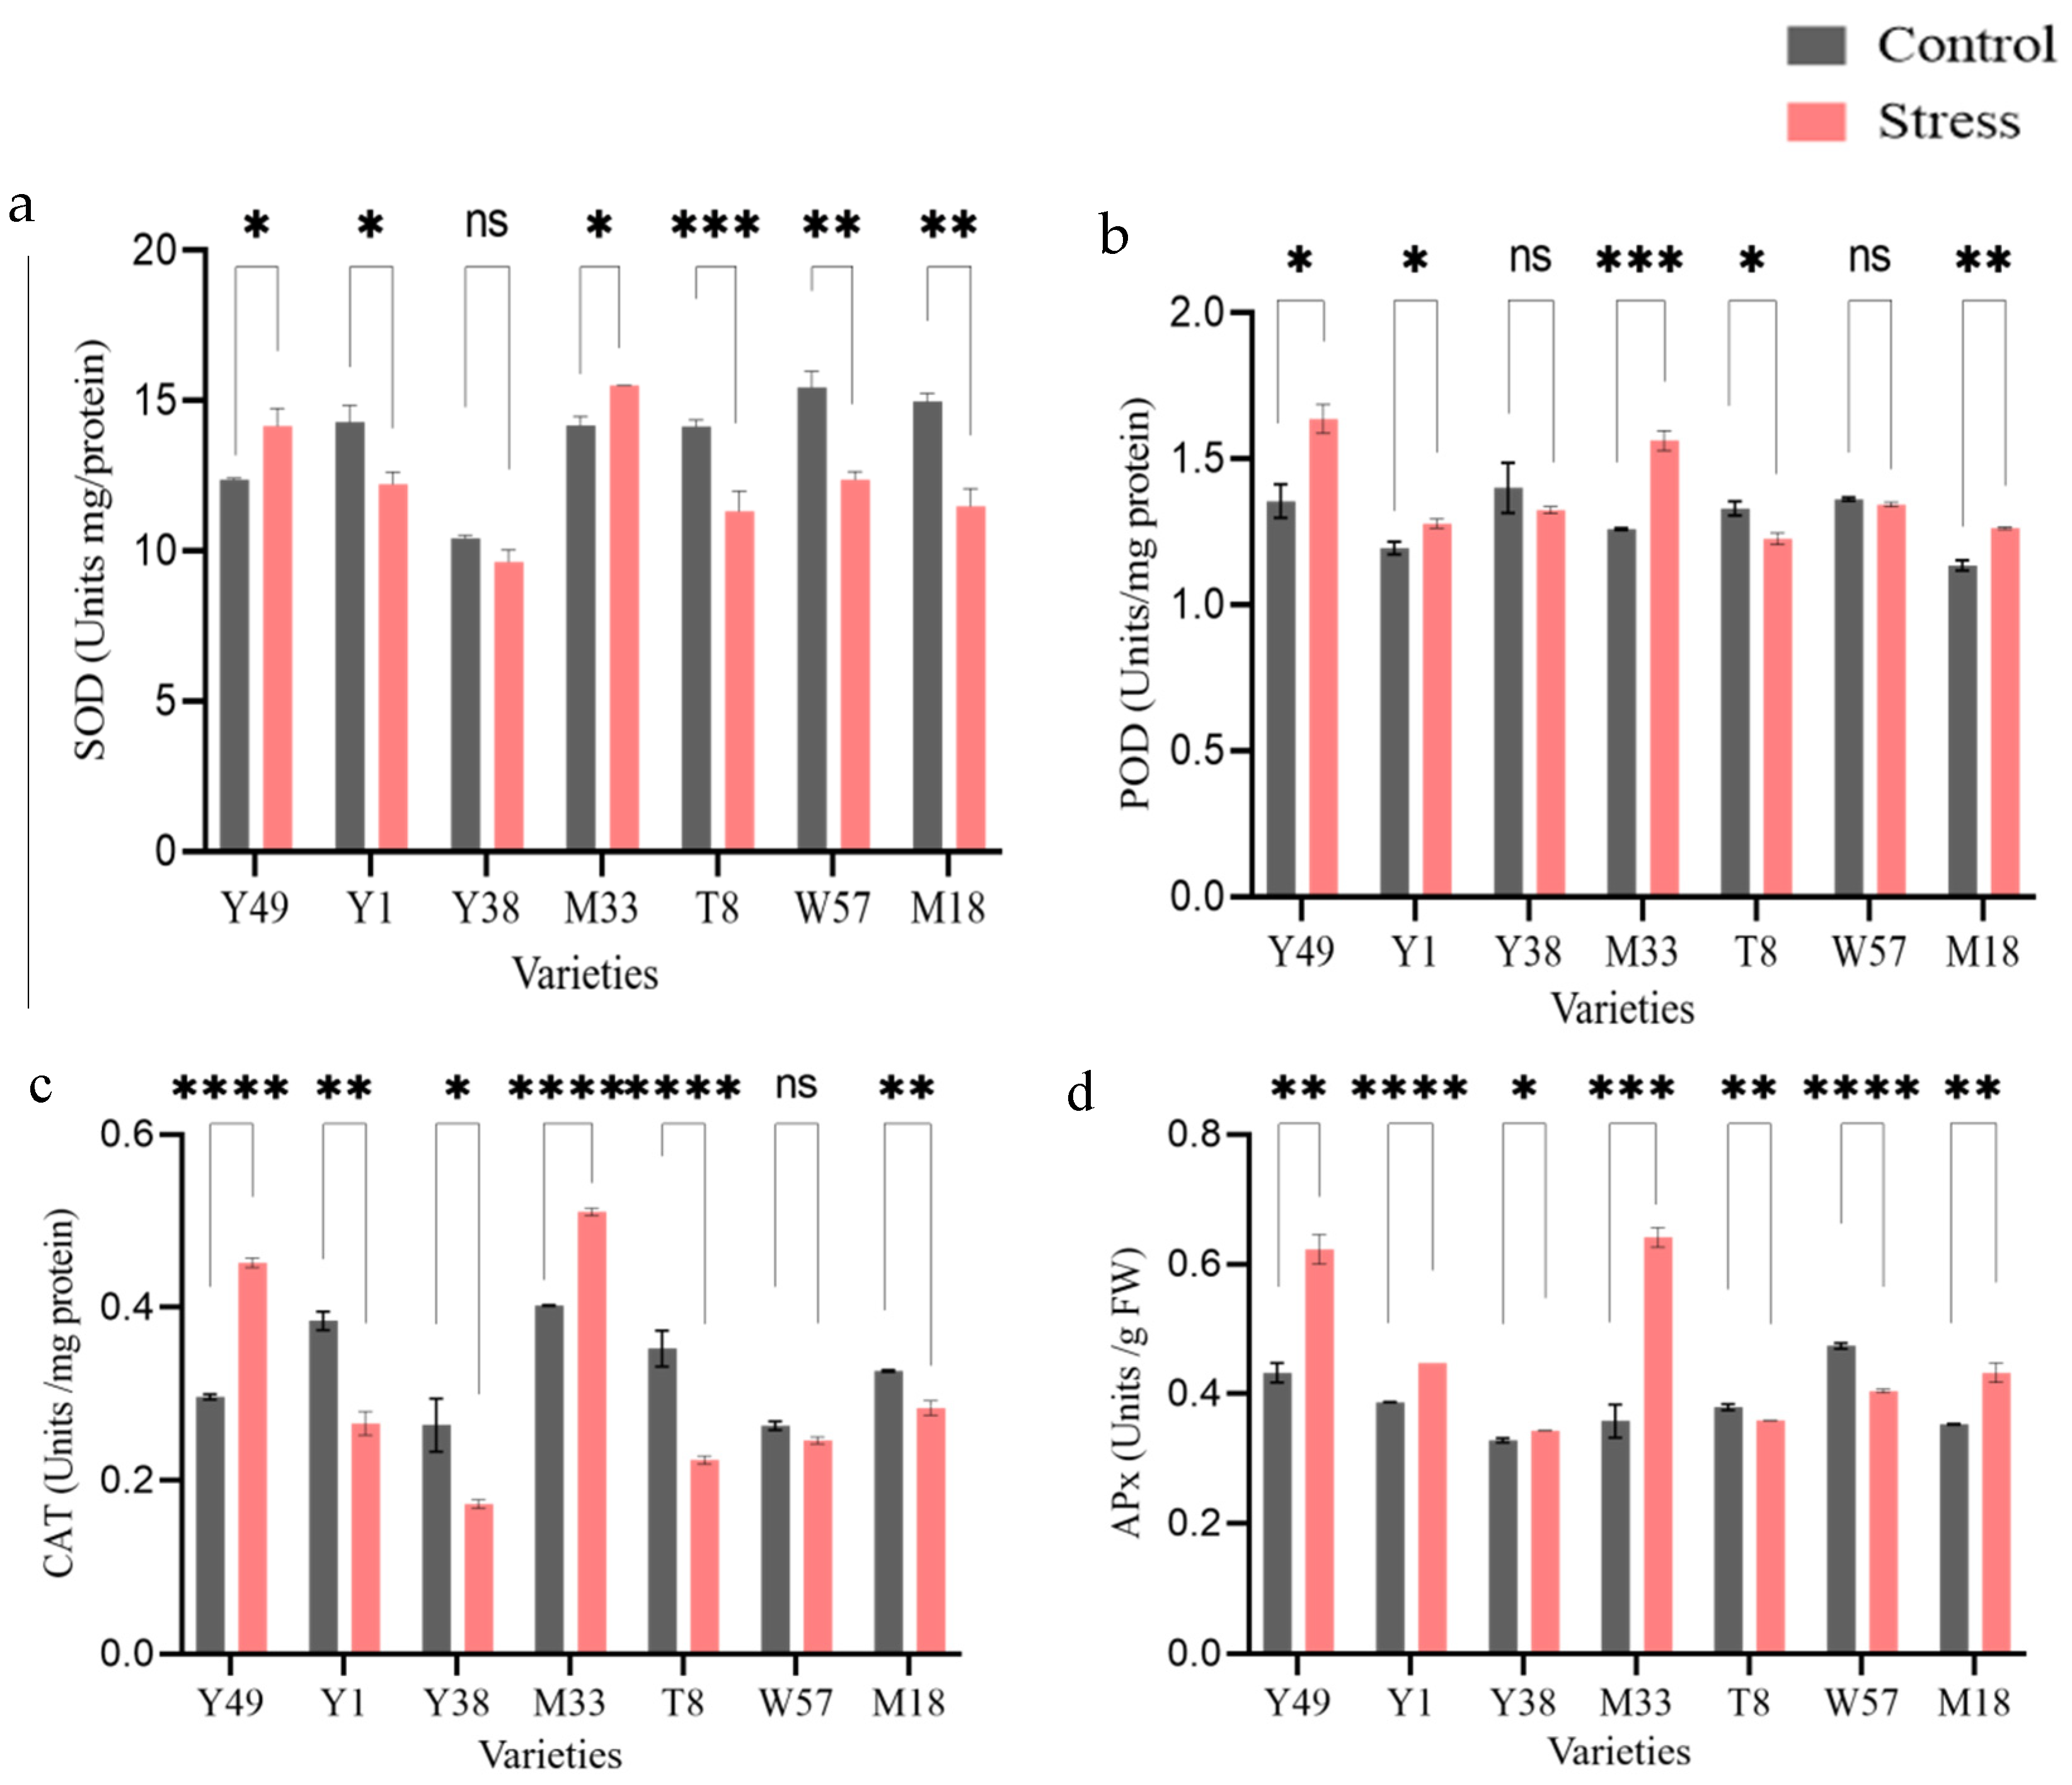
4.4. Enzymatic Antioxidant Activities (SOD, POD, CAT, and APx)

Low-temperature treatment caused a significant decrease in SOD activity in all varieties except Y49 and M33 in cold-induced leaves shown in Figure 3a. The activity of SOD during low-temperature stress was dramatically reduced in most of the varieties compared with control. In contrast, the Y49 and M33 had an increasing trend, which only increased by 5.16% and 14.13%, respectively.
Our experiment revealed that POD activity significantly decreased in Y38, T8 followed by W57 cultivar compared to control (Figure 3b). Conversely, POD activity was increased higher in both Y49 and M33 cultivars. There was a substantial difference in CAT activity between all varieties between control and stress conditions in our study. CAT activity decreased significantly in most of the varieties compared to the control (Figure 3c). There was a much lower level of CAT activity in Y1, Y38, and T8 after low temperature stresses Y49 and M33 than the control, whereas Y49 and M33 increased the CAT activity by 50.87% and 25.80%, respectively.
Cold treatment also had a significant effect on APx activity in the treatment leaves; however, cold treated leaves of the Y49, Y33, M33, T8, and M18 varieties exhibited an increasing trend in APx activity, whereas T8 and W57 exhibited a decreasing trend (Figure 3d). It was observed that Y49 and M33 enhanced by 47.5% and 84.79%, respectively compared with those of the non-stress condition. Increased APX activity in low temperature-treated leaves of Y49 and M33 may indicate that Apx interferes with cold signal transduction.

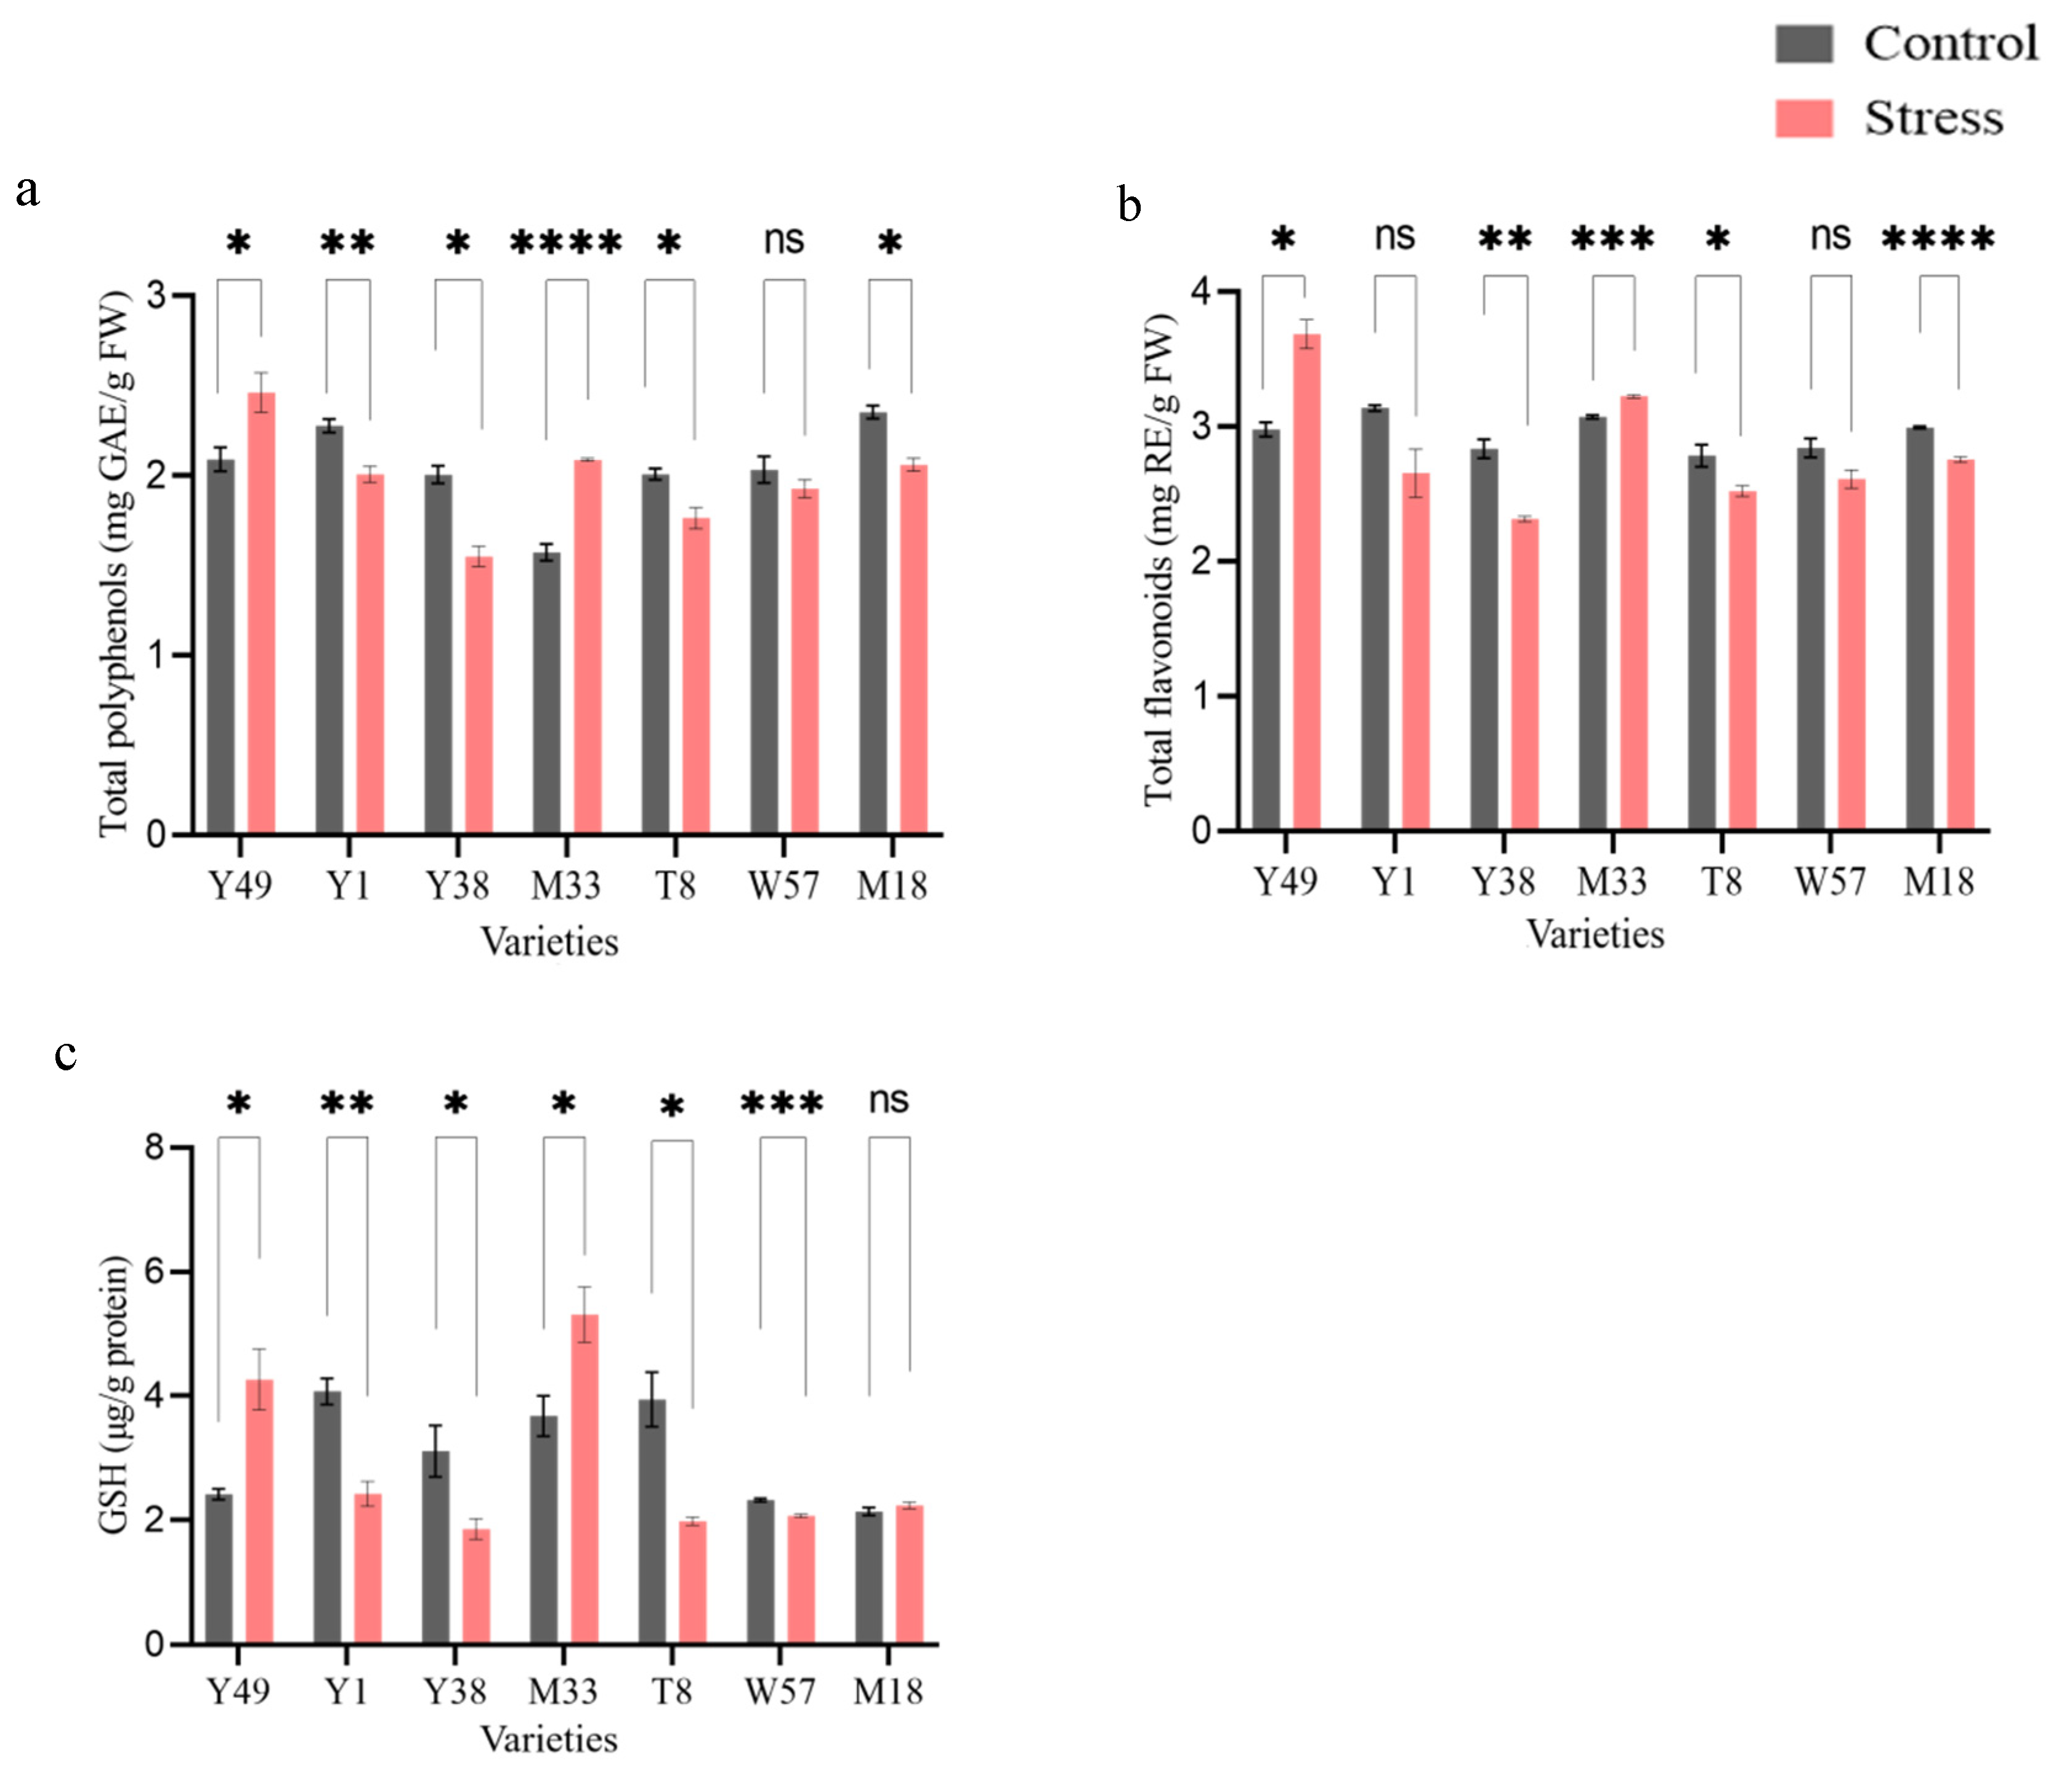
4.5. Non-Enzymatic Antioxidant Activities (TFC, TPC, and GSH)

Our findings showed that the controlled and low temperature-treated leaves accumulated phenolic compounds differently during cold stress. Determining phenolic contents in response to stress can help research the cultivation tolerance mechanism and crop loss minimization. When exposed to stress, phenolic compounds serve as antioxidants and activate the cell’s enzyme system [29]. In Figure 4a, it was noticed that most of the varieties showed a decreasing trend in low-temperature treatment, whereas the Y49 and M33 varieties showed significantly accelerated by 17.71% and 32.94%, respectively, and most reduced level was observed in T8 (12.08%) and Y1 (11.75%) compared to non-stressed conditions.
Like TPC, total flavonoid content (TFC) was enormously accelerated in Y49 (23.96%) and M33 (4.94%); whereas a high reduction rate was recorded in Y1, T38, T8, and W57 in stress conditions compared to control (Figure 4b). In the case of GSH, after 24 h low temperature stress, GSH contents were significantly increased in varieties Y49 (78.66%), M33 (45.65%), and M18 (4.86%) (Figure 4c). In contrast, the rest of the varieties demonstrated a decrease from 10.82~47.99%. The higher GSH level and homeostasis enhanced the antioxidant and glyoxalase systems’ activity to alleviate cold-induced damage in the cold tolerant.

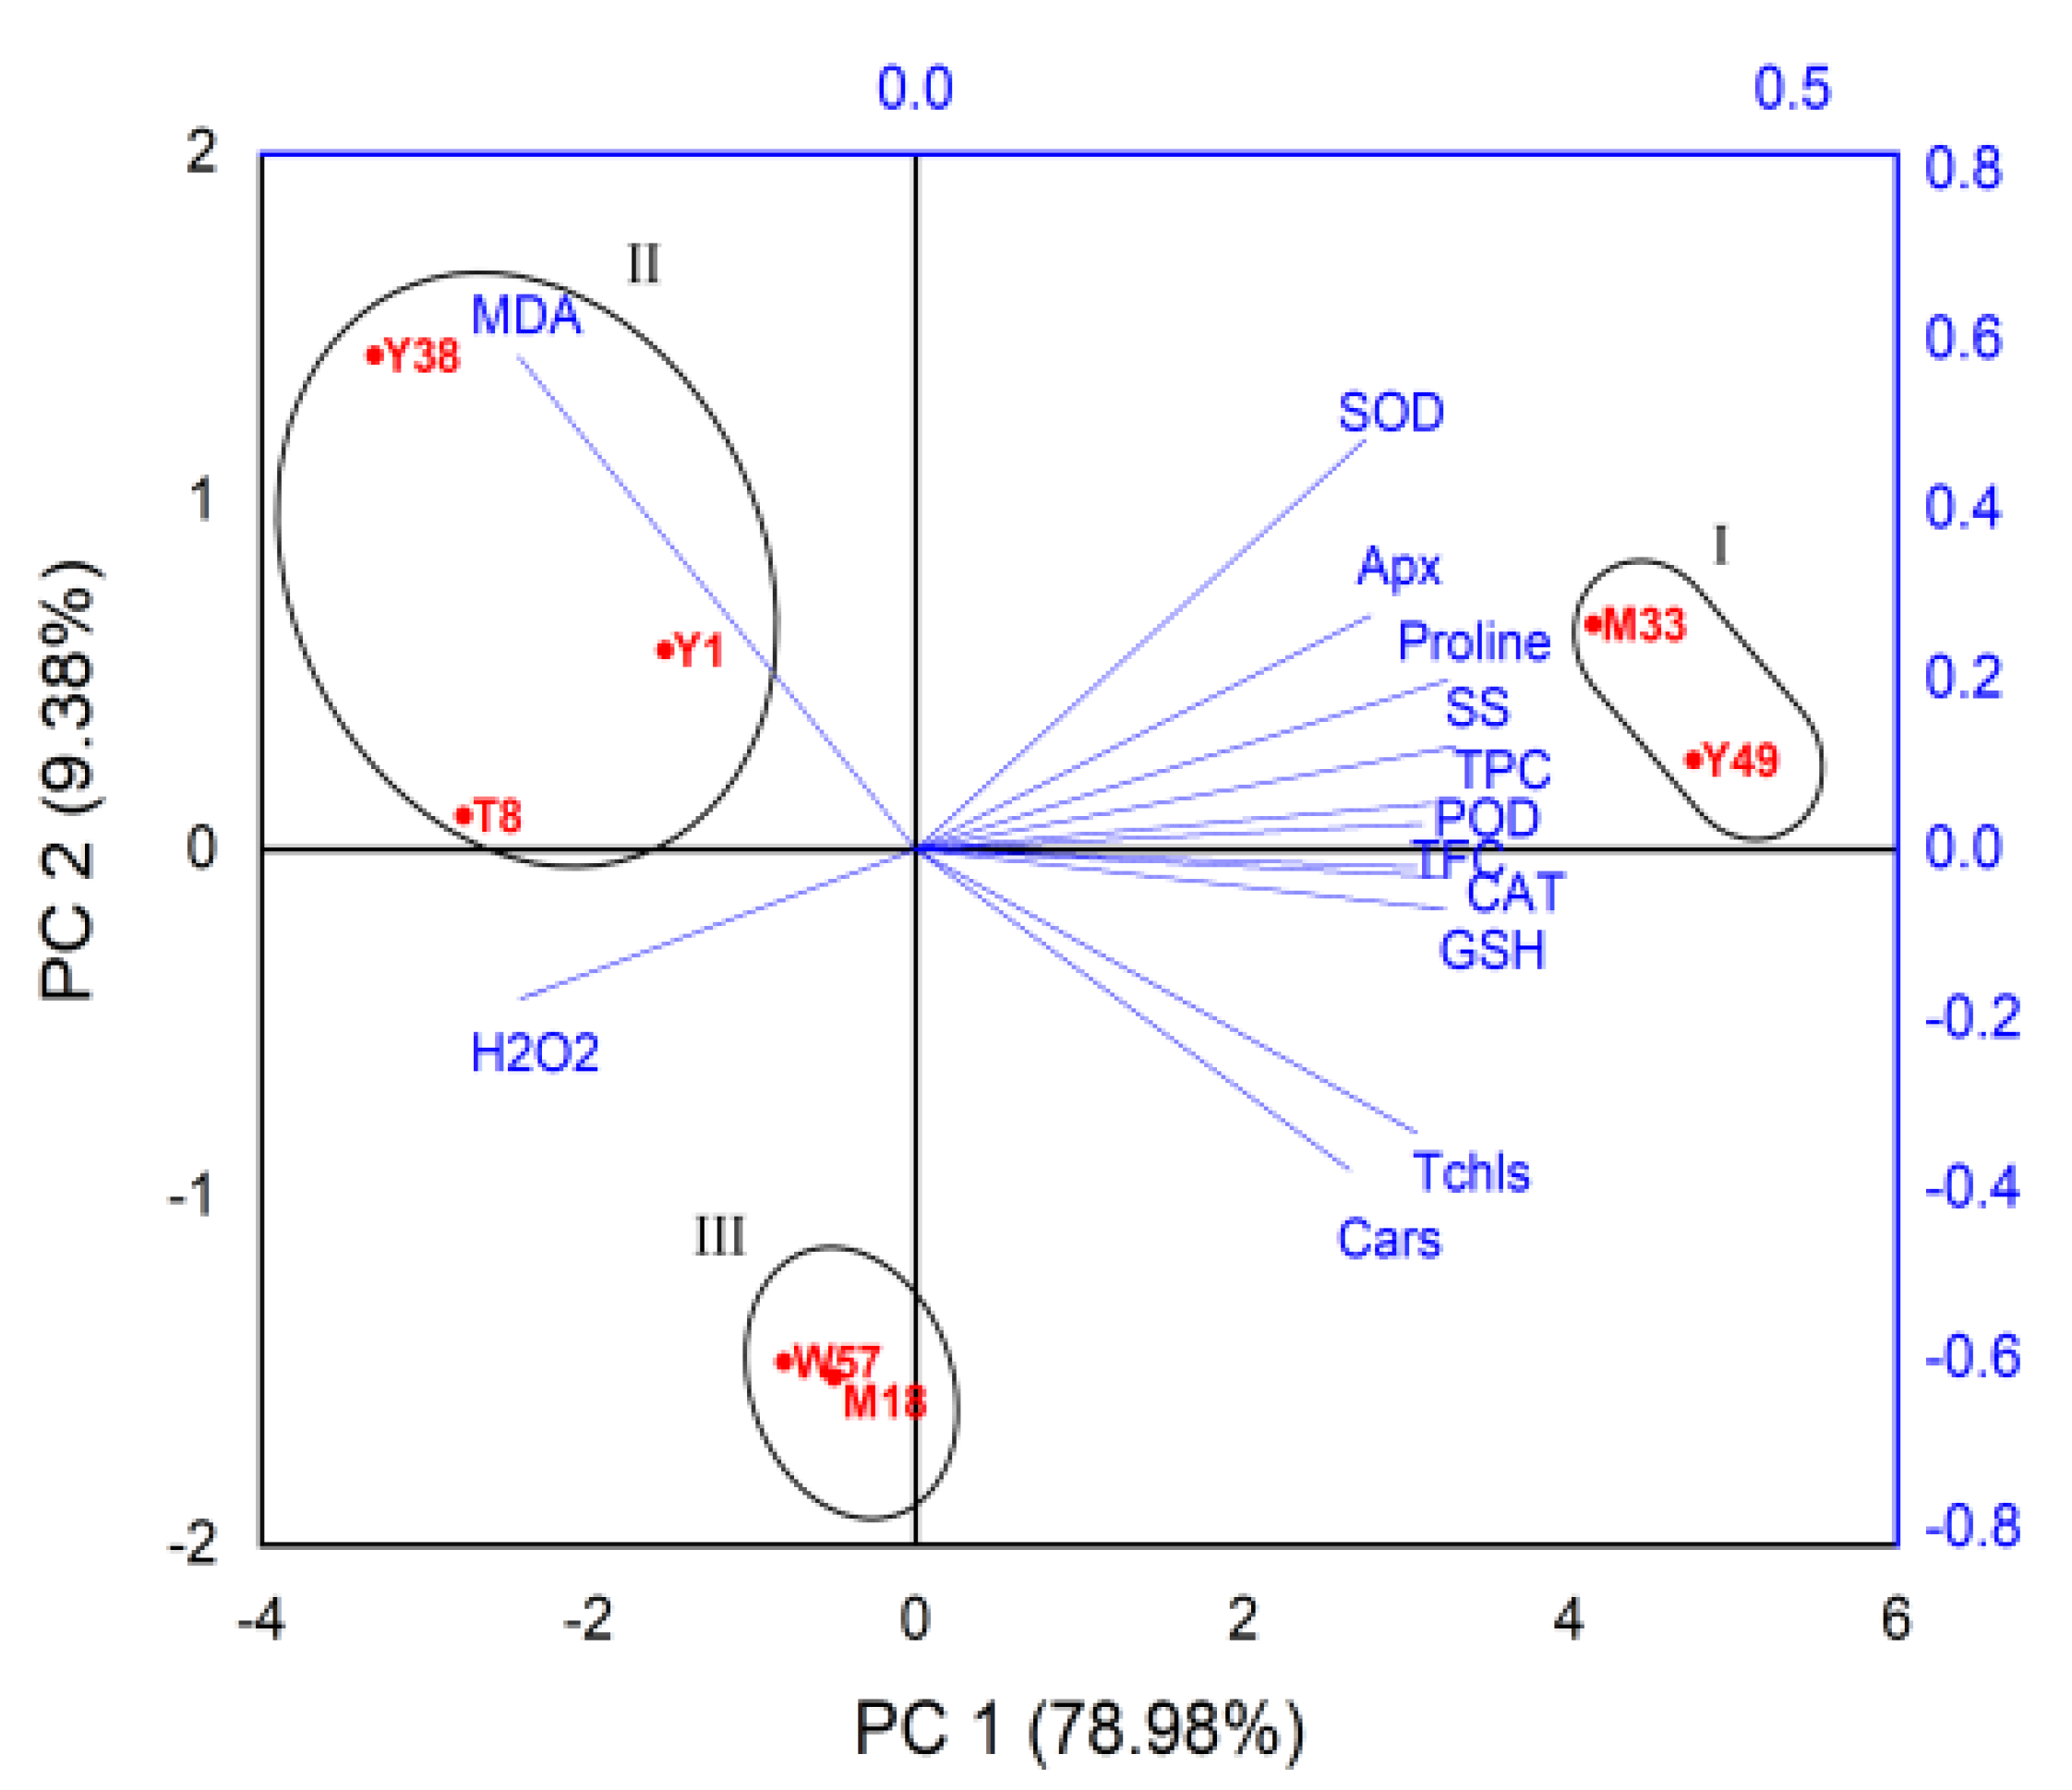
4.6. Principle Component Analysis (PCA)

PCA is a multivariate exploratory technique used to reduce the multidimensionality of the facts and provide a two-dimensional map that explains the determined variance. In the PCA analysis, eigenvalues greater than 1 were regarded as significant and loading plots allowed for easy visualization of biochemical parameters and varieties of C. capsularis and C. olitorius (Figure 5). Cumulative PCA biplot contributes 88.36% of the total variability of the studied parameters, while PC1 accounts for 78.98% and PC2 accounts for 9.38% of the original data in this study. The angle of the trait vectors reflected the correlation of variables. A lower angle between distinct factors pointing in the same direction suggested a strong correlation between the respective varieties’ classification criteria. The broad spectrum distribution of measured parameters in this biplot showed the differential correlation (positively and negatively to different PC groups) with each other. SOD, APx, proline, soluble sugar, total polyphenols (TPC), and POD were clustered on the right upper side of the biplot with positive loading, indicating that these parameters exhibited a significant degree of positive correlation among themselves. Total flavonoids, CAT, GSH, total chlorophyll, and carotenoid were all located on the right lower side of the biplot, indicating a positive association between these measures. MDA and H2O2 were detected on the left upper section, indicating that these parameters had a strong negative and substantial association with one another.
Under the low-temperature stress, the varieties Y49 and M33 were clustered together on the right side of the biplot with positive loading, and these two varieties were considered for low-temperature tolerance potential. The varieties Y38, T8, and Y1 were clustered together in the direction of MDA and H2O2 to the upper area of the biplot, and relatively poor performance of different enzymatic and non-enzymatic antioxidants activities indicated increased susceptibility to low-temperature stress. Whereas the varieties W57 and M18 shifted to the lower portion and were classified as intermediate to cold stress.

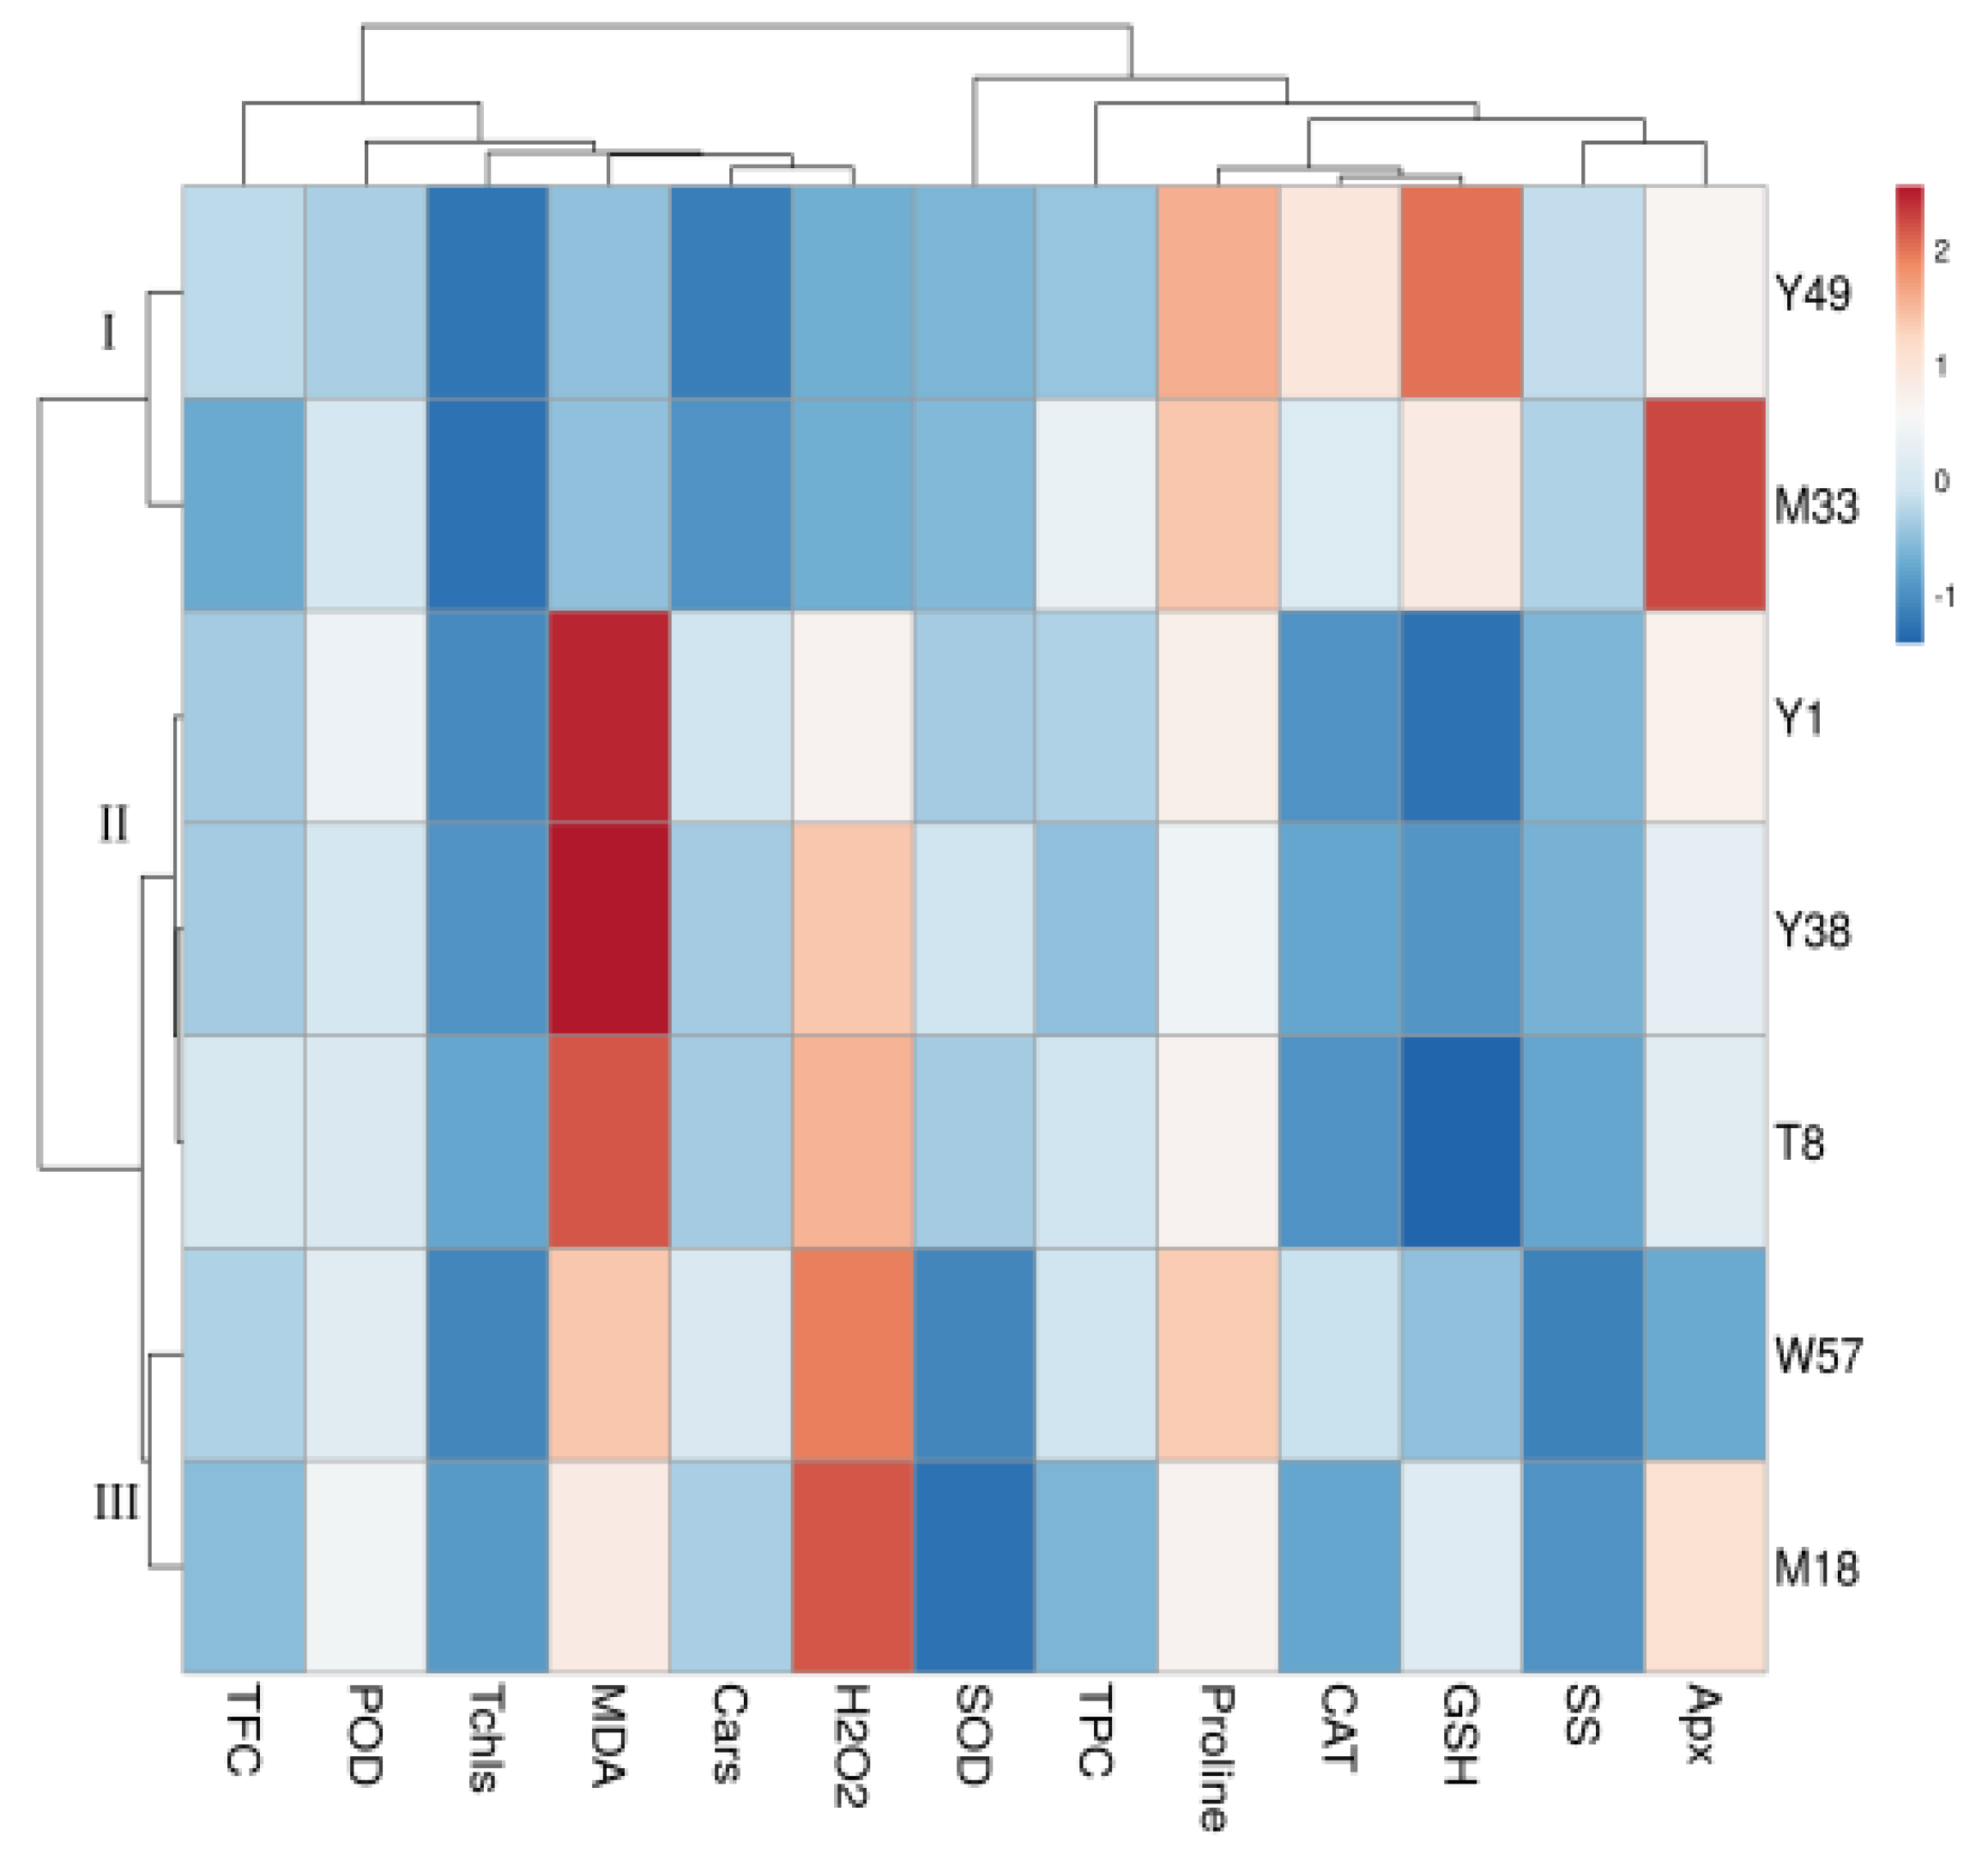
4.7. Cluster Heat Map Analysis

Further, cluster heat map approach to hierarchical cluster analysis using the average linkage via Ward’s method of agglomeration. According to the heatmap, seven jute varieties were divided into three main groups based on their varieties’ potential (Figure 6) consistent with PCA. The distribution pattern showed that cluster-I contained Y49 and M33 had the highest mean STI (1.26) values based on physiological and biochemical parameters. Therefore, the varieties in Cluster-I can be considered as low temperature-tolerant potential varieties. On the other hand, three varieties viz. Y1, T8, and Y38 were clustered in Cluster-II represented that sensitive group with the lowest mean STI (0.93). The rest of two varieties (W57 and M18) were found in Cluster-III with moderate mean STI (0.98) value. Comparing the score plots to the cluster heat map revealed that the PCA score plots corresponded to the HCA scores, suggesting tolerant, intermediate, and sensitive varieties.

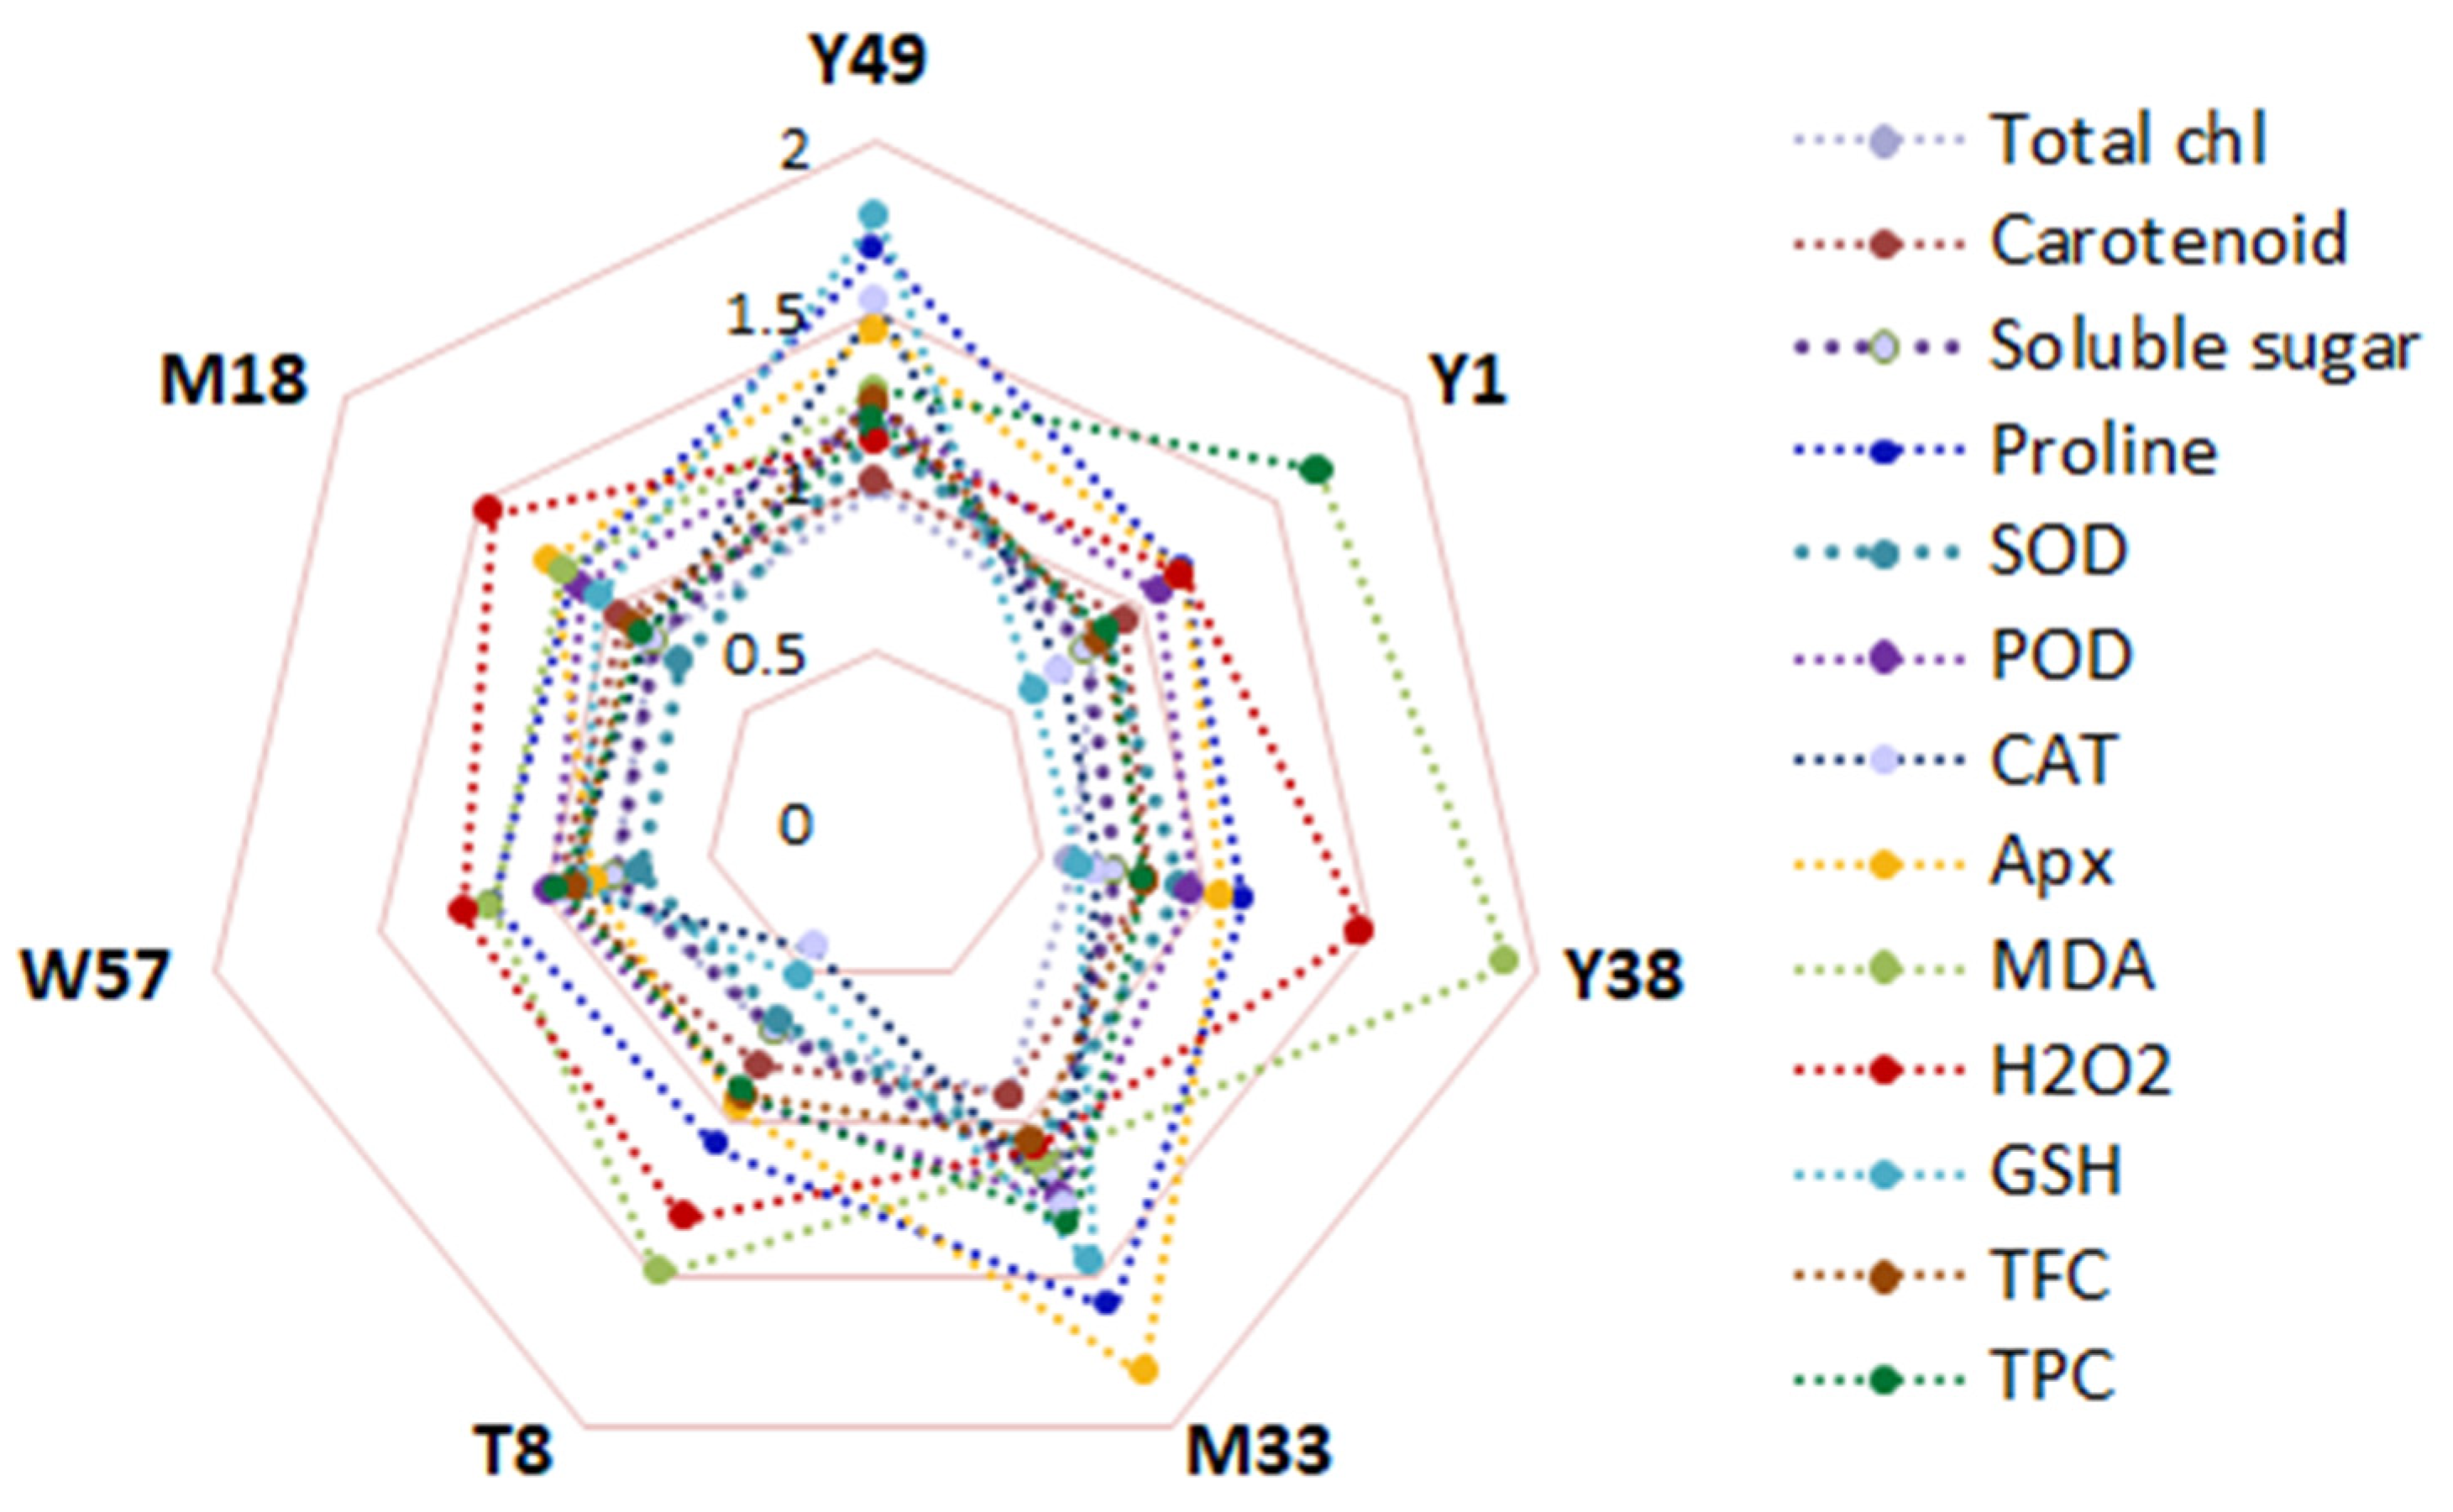
4.8. Genotypic Variation under Cold Stress

In our study, radar plot examination of STI values revealed that the jute varieties responded differently to cold treatment (Figure 7). The varieties Y49 and M33 had the highest average STI values, while the variety T8 had the lowest for all parameters except MDA and H2O2 concentration (Table 3). Under cold stress, the Y1, Y38, and T8 varieties collected the highest STI of MDA and H2O2 content, whereas M33 and Y49 varieties accumulated the lowest STI of MDA and H2O2 under the same conditions. Additionally, Y49 and M33 varieties maintained the higher STI value when exposed to cold stress conditions.

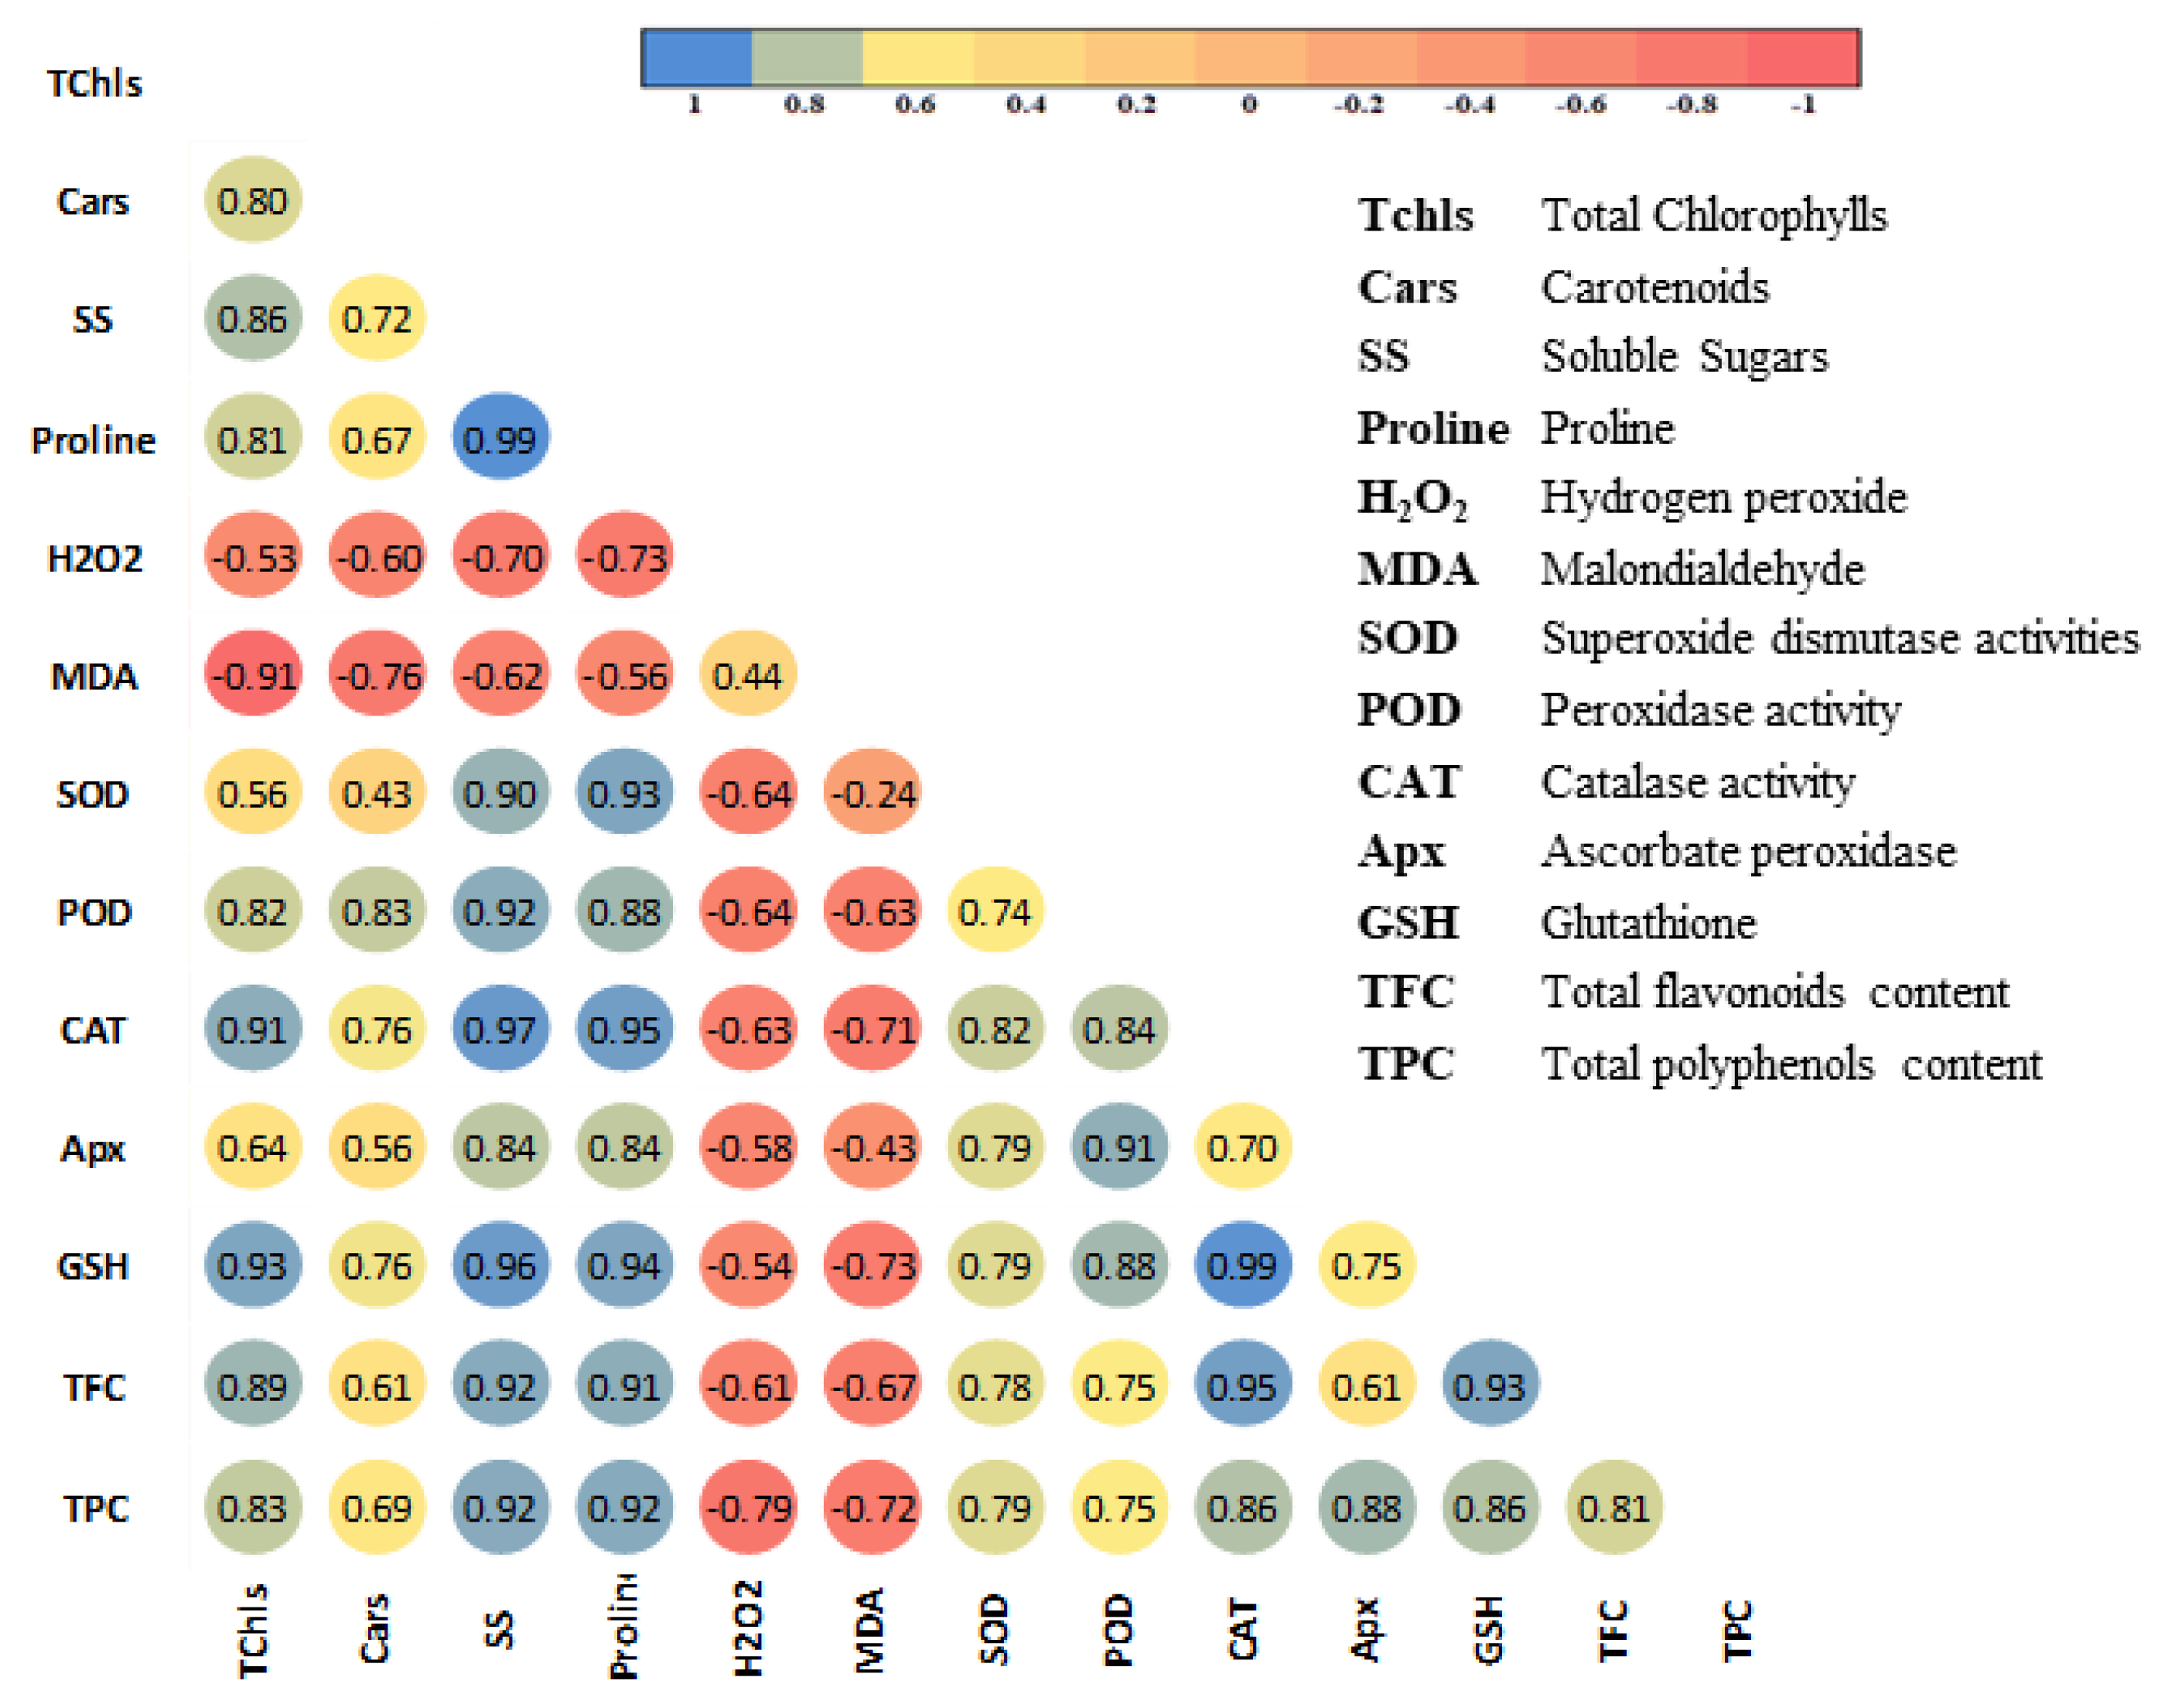
4.9. Correlation of Various Biochemical Parameters

Pearson’s correlation analysis was used to investigate the association between the physiological and biochemical characteristics of C. capsularis and C. olitorius under conditions of cold stress (Figure 8). Although most physiological and biochemical markers tested correlated significantly, some indices were more tightly related than others. Different physiological traits like photosynthetic pigment content (total chlorophyll) were observed to be positively correlated with different enzymatic and non-enzymatic antioxidants but negatively associated with reactive oxygen species (like H2O2 and MDA contents). At the same time, a strong positive significant positive correlation was observed between MDA and H2O2. It was observed that, in most cases, MDA and H2O2 made a high negative correlation with other enzymatic and non-enzymatic antioxidants. This high negative correlation suggests lipid peroxidation caused by cold stress was the main reason for decreasing non-enzymatic antioxidant activity and the occurrence of severe damage to jute varieties. In comparison, other enzymatic antioxidants such as SOD, POD, CAT, APx, and GSH exhibit a substantial positive connection with non-enzymatic antioxidants and physiological indices. Pearson correlation coefficient data supported the cluster analysis conclusion.

5. Discussion

Like other tropical and subtropical plants, jute seedlings could be susceptible to chilling temperatures, and the injuries are results of their susceptibility. This circumstance shows dramatic reductions in the rates of many physiological characteristics when they are under chilling stress. Chlorophyll is a necessary and vital biomolecule in photosynthesis, serving as an absorber of light and a converter of light energy [30]. When plants are subjected to low-temperature stress, chlorophyll biosynthesis is impaired, resulting in a decrease in light harvesting [31]. It has been reported that plants with a high tolerance for cold keep a constant chlorophyll content, while plants with low cold tolerance experience a decrease in chlorophyll content [28]. The present study reported that except M33, all varieties significantly reduced the chlorophyll content. This may be due to a cold-induced increase in the activity of the chlorophyll degrading enzyme, chlorophyllase reported by Noreen, 2009 [32]. It was also observed that varieties Y49 showed stable or less decreased, whereas Y38 and T8 had a high level of changes compared to control. This indicates that leaf chlorophyll content was better protected in Y49 and M33 varieties, probably because of the high antioxidant enzyme activities.
Our study observed that varieties Y49 and M33 showed a less declining trend at chilling than other varieties compared to their control condition. In our research, nearly stable and small changes in chlorophyll and carotenoid contents in Y49 and M33 are consistent with B. oleracea varacephalais a plant with good cold tolerance reported by Atici et al. [33]. Like this, high chlorophyll stability index (CSI) under chilling stress in Y49 and M33 varieties are considered superior among the varieties studied. Due to their genetic heterogeneity and the difference in the method of defense, the examined varieties in our study behaved differently than at the same low temperature.
In response to cold stress, total chlorophyll, stable, or low decrease was noticed in Y49 (1.17%) and M33 (14.08%) while Y38 and T8 recorded the highest change as decreased. The lower fall in carotenoid concentration in response to cold stress compared to in chlorophyll a or b content may reflect the activity of xanthophyll cycle carotenoids in releasing thermal energy and protecting PSII reaction centers. It has been suggested that a decrease in chlorophyll biosynthesis in plants exposed to cold temperatures is partially due to the reduction of 5-aminolevulinic acid biosynthesis [34]. Reduced photosynthetic pigments diminish light absorption, and the greater decrease in carotenoid content than in chlorophyll a or b content in Y49 and M33 may be related to the release of heat energy and protection of PSII reaction centers by xanthophyll cycle carotenoids [35,36]. Numerous studies have established that low-temperature stress impairs photosynthesis, as evidenced by decreases in photosynthetic rate and pigment concentrations [37]
Proline is a well-established suitable osmolyte required to maintain osmotic balance and stabilize cellular structures in plants under a variety of abiotic conditions [38]. Plants protect their tissues from low-temperature damage by accumulating proline in the cells leading to a better osmotic adjustment by eliminating stress-induced excess H+ and protecting enzymes from denaturation [39]. It was believed that more significant proline accumulation during stress conditions might account for a portion of plants’ increased tolerance to cold stress conditions by mitigating the ROS-induced oxidative damage [40]. In this experiment, results showed that low-temperature stress significantly increased proline content where a high increasing trend was observed in Y49 and M33 by 67.84% and 60%, indicating that these two varieties improve the cold tolerance by scavenging ROS produced under stress condition. Whereas lower increase was observed in Y38 (11.39%) and T8 (7.89%), which reflected that these two have less radical scavenger activity. Moreover, in support of the outcomes of the present study, several other scholars reported that tolerant varieties accumulated a higher proline content than sensitive varieties during the low-temperature treatment period in seedling of sugarcane [41] and grafted watermelon [42].
It has been proved that soluble sugars play a critical role in the process of cold tolerance. Soluble sugars protect plant cells from cold stress-induced damage in a variety of ways, including as osmoprotectants, nutrition, and by reacting with the lipid bilayer [43]. In our study, varieties Y49 and M33 recorded high soluble sugar accumulation, where other varieties displayed a decreasing trend compared to the control. The highest reduction was displayed in Y1 (31.84%), followed by T8 and Y38 with 30.94% and 32.84 % respectively. Thus, more accumulated varieties attained low-temperature tolerance by increasing membrane cryostability. Increased membrane cryostability is required for freezing tolerance since membrane instability is the main source of plant injury [44]. Considerable research indicated that cold-tolerant varieties accumulated higher soluble sugar, especially sucrose, which decreased significantly in the susceptible varieties [45,46].
It has been reported that cold stress increased uncontrolled ROS production, resulting in lipid peroxidation, protein degradation, DNA degradation, and mutation. Lastly, it affected cellular metabolism and physiology, impairing the plant’s membrane stability. Normally, the breakdown of unsaturated fatty acids produced MDA as the primary product in biological membranes. Likewise, greater H2O2 accumulation in many cell compartments, including chloroplasts, mitochondria, and apoplastic space, relates to oxidative damage in plants under cold stress [47]. Both MDA and H2O2 are useful indicators for detecting and monitoring oxidative stress in plants [48,49]. In the current study’s treatment groups, lipid peroxidation was enhanced and triggered cell-produced MDA accumulation. It has been shown that cold stress increases lipid peroxidation and H2O2 concentrations, but lesser accumulation observed in tolerant varieties suggests protection against oxidative damage through a better regulating mechanism to control the synthesis of more MDA and H2O2 [47]. Our research showed that at low-temperature stress, MDA levels and H2O2 increased more pronouncedly in the Y1, Y38, and T8 varieties than other varieties compared to control, indicating that the damage caused by cold injury in these varieties was more severe than others. Among the tested varieties, less augmented MDA levels and H2O2 were noticed in Y49 and M33 varieties, indicating a greater ROS scavenging mechanism effectiveness and higher tolerance to cold stress. The current research findings were similar to those previously reported on sugarcane seedlings; tolerant seedlings showed the lower MDA content while susceptible seedlings demonstrated higher MDA levels [41]. It also noted that MDA content was lower in the treatment groups while proline content was more elevated, and other radical scavenging enzymes were observed [50]. The enzymatic antioxidant system may prevent the degradation of polyunsaturated fatty acids. Thus, increased proline under cold stress helps adjust osmotic levels by reducing the MDA content and improving the cell membrane.
Due to the increased electron leakage to molecular oxygen, unfavorable conditions promote the generation of reactive oxygen species (ROS) such as H2O2 (hydrogen peroxide), O2 (superoxide), and OH (hydroxyl) radicals (Arora et al., 2002). An increase in ROS accumulation under abiotic stress parallels increased lipid peroxidation. To mitigate H2O2 induced oxidative damage and lipid peroxidation caused by the accumulation of MDA, plants increase their defense mechanisms against ROS by enhancing the ability of variety components both enzymatic and non-enzymatic to detoxify ROS [51]. In our study, a significant increase of SOD, CAT, POD, and APx were observed in the varieties of Y49 and T8 compared to other varieties and control conditions. It has been discovered that increasing enzyme activity results in a decrease in MDA and H2O2 concentrations below those found in control plants [48]. SOD and CAT serve as the initial line of defense for plants’ antioxidative machinery. They prevent the production of more hazardous reactive oxygen species (ROS) and play a vital role in intracellular H2O2 signaling [52]. In the initial stage, SOD catalyzes the dismutation of O2 to H2O2 and O2 molecules. Hydrogen peroxide is less toxic than superoxide radicals. On the other hand, POD enzymes catalyze the conversion of H2O2 to H2O and O2. Then, H2O2 is detoxified by APx, POD, and CAT in different organelles and antioxidant cycles [51]. CAT is an antioxidant enzyme with a high capacity for rapidly H2O2 scavenging and is more engaged in H2O2 detoxification (removes H2O2 by breaking it down to create H2O and oxygen and oxidizes H+ donors via peroxide consumption), which is required for cold stress tolerance [53,54]. In the current investigation, varieties (Y49 and M33) with a relatively high CAT activity accumulated less H2O2 and MDA than varieties with a relatively low CAT activity and vice versa. In comparison, following 24 h of low-temperature treatment at 5 °C, the activity of CAT increased up to 2.3-fold in cold-treated leaves compared to control leaves. Similar results were also obtained from different studies; Zhang et al. stated that cold-tolerant banana varieties demonstrated a significant increase in CAT activity under cold stress [55] and winter-type wheat revealed much higher CAT activity than the spring type soybean plants when exposed to cold [56].
GSH can be produced in both the cytosol and the chloroplast of the plant’s leaves, which is the primary component of plants’ non-enzymatic antioxidant system. ROS detoxification in the chloroplast is known to be primarily carried out by the ascorbate–GSH cycle due to its high reductive potential and electron donor properties; GSH could scavenge H2O2, or react non-enzymatically with 1O2, O2•−, and •OH and protects the various biomolecules by forming adducts (glutathiolated) or reducing them in the presence of ROS or organic free radicals [57]. However, GSH is a strong antioxidant in its own right; its key role is to renew another hydrophilic antioxidant, ascorbic acid, mainly through the Asc-GSH cycle. The APx directly reduces H2O2 into H2O and O2, utilizing ascorbic acid (AA) as a reducing agent. Many researchers reported that increased APx activity can reduce ROS levels and promote resistance to oxidative stress, whereas reduced APx activity can decrease the cold tolerance of plants [58]. In our investigation, Y49 and M33 accumulated high GSH by 78.66% and 45.65%, whereas APx activity increased by 44.35% and 71.78%, respectively compared to control. This resulted in higher efficiency of the H2O-H2O and ascorbate-glutathione cycles. On the other hand, APx is more likely to be responsible for fine-tuning ROS in the signaling pathway, whereas CAT may be accountable for removing excess ROS during stress [59,60]. On the other hand, much reduced APx content was observed in Y38 and T8; as a result, these varieties cannot neutralize ROS under cold stress and showed susceptibility to cold stress. Phenols (flavonoids, polyphenols) are a large class of specialized metabolites found in plant tissue that exhibit antioxidant activity due to their structure (aromatic ring with −OH or −OCH3 substituents) [61]. They have a high capacity for electron or hydrogen atom donation due to their quick stabilization of generated phenol radicals. Additionally, by trapping lipid alkoxy radicals, they will directly capture 1O2 and reduce lipid peroxidation [62]. This procedure is helpful for avoiding chilling harm and cell collapse during periods of cold stress [63]. According to our results (Figure 4a,b), low temperature significantly increases total flavonoid in Y49 (23.97%) and M33 (4.94%), and polyphenols content increased 17.72% and 32.95% for Y49 and M33, respectively. In contrast, other varieties showed decreasing trend compared to that of the control. For flavonoids highest decrease was recorded in Y1, Y38, and T8 (15.49%, 18.16%, 9.24%, respectively), whereas polyphenols in Y38 (22.62%) were followed by Y1 (11.75%), and (12.02%). It has been reported that increased phenolic levels have been shown to contribute to ROS detoxification, enhance phenolic compound accumulation in plant cell walls, and increase cell wall thickness, showing that these compounds have a role in stress tolerance at low temperatures [61]. The findings of this study were similar to previous publications where the synthesis of phenolic compounds in plant tissue was seen under abiotic stress [64,65,66].
Therefore, plants were resistant and adapted to low temperatures by alleviating oxidative stress caused by low temperature and thus protecting the photosynthetic system [67,68]. Current experimental results revealed that different antioxidant and non-enzymatic antioxidant activities at low-temperature stress had been changed; those are relevant to cold tolerance. It was noted that the synergistic interactions of the SOD-POD-CAT-APx system were found to be efficient in preventing oxidative damage in jute plants exposed to cold stresses. Overall, the results indicated that cold indices, PCA, and cluster heat map generated a wide range of variability and could be used as credible approaches for screening jute varieties and identifying tolerant varieties based on physiological and biochemical performance under cold stress. From both of PCA and heat map, it was observed that all varieties were placed in three separate groups. In cluster heat map analysis, Group I (Y49 and M33 varieties) was low-temperature tolerance (MSTI 1.26) with improved physiological and biochemical traits such as total chlorophyll, soluble sugar, proline, and different enzymatic and non-enzymatic antioxidants activities. Whereas Group-II (Y38, T8, and Y1) was low-temperature susceptible (MSTI 0.93) by displayed low level activates of different antioxidants and osmolytes, thus these groups were identified as low-temperature susceptible varieties. Groups-III (M18, W57) with MSTI 0.98 were moderately tolerant or susceptible due to intermediate physiological and biochemical activities. Many researchers revealed that cluster analysis could be a promising tool to screen the desirable varieties based on the similarity [69]. The study thus explained the cold-tolerant mechanisms in jute and verified the cold tolerance level of selected varieties.

6. Conclusions

The selection of stress-tolerant genotypes might be a promising approach to alleviate the detrimental effects of abiotic stress and cultivate natural fiber crop productivity in the cooler regions. In the present study, the results show that the cold-induced inhibition of growth was significantly ameliorated in Y49 and M33 varieties, as manifested by physiological indices, such as much better adaptation with much higher chlorophyll, proline, and soluble sugar contents; lower levels of ROS, and lipid peroxidation; higher enzymatic antioxidant activities, especially SOD, POD, CAT, APx; and higher levels of non-enzymatic activities like TFC, TPC, and GSH. On the contrary, Y38, T8, and Y1 varieties exhibited more sensitivity by low temperature by increasing cell membrane damage through a high level of MDA and H2O2. Furthermore, for PCA or cluster heat map, seven varieties created three different groups effectively, where Cluster I (Y49 and M33) indicated the low-temperature tolerant varieties. To summarize, our data demonstrate the role of several antioxidants and non-enzymatic activities in modifying physiological and biochemical responses associated with cold tolerance. Thus, the results would provide the theoretical guidance to the evaluation of jute varieties under cold stress, cold tolerance response mechanisms, and cropping adjustment on cooler regions.

Author Contributions

Conceptualization, S.D., D.L. and A.B.; Methodology, S.D., D.L. and A.B.; Supervision, D.L., S.H., Y.D. and A.B.; Data curation, S.D. and A.B.; Formal analysis, A.B., S.D. and Z.M.B.; Validation S.H., J.Z., Y.G. and L.L.; Investigation Y.D., A.X., J.L., Original draft writing, S.D. and A.B.; Review and editing, A.B. and D.L., Funding acquisition, D.L. All authors have read and agreed to the published version of the manuscript.

Funding

This research was supported by the Chinese Agriculture Technology Research System (CARS -16-E04) and Agricultural Science and Technology Innovation Program (ASTIP-IBFC03).

Institutional Review Board Statement

Not applicable.

Informed Consent Statement

Not applicable.

Data Availability Statement

On request, the corresponding author will provide the data used to support the findings of this study.

Acknowledgments

The authors would like to express their gratitude to the Chemistry Department of the Institute of Bast Fiber Crops for allowing them to utilize their facilities for this work.

Conflicts of Interest

The authors disclose that they have no conflict interests.

References

  1. Raza, A.; Su, W.; Hussain, M.A.; Mehmood, S.S.; Zhang, X.; Cheng, Y.; Zou, X.; Lv, Y. Integrated Analysis of Metabolome and Transcriptome Reveals Insights for Cold Tolerance in Rapeseed (Brassica napus L.). Front. Plant Sci. 2021, 12, 1796. [Google Scholar] [CrossRef]
  2. Szczerba, A.; Płażek, A.; Pastuszak, J.; Kopeć, P.; Hornyák, M.; Dubert, F. Effect of low temperature on germination, growth, and seed yield of four soybean (Glycine max L.) cultivars. Agronomy 2021, 11, 800. [Google Scholar] [CrossRef]
  3. Yang, Q.S.; Gao, J.; He, W.D.; Dou, T.X.; Ding, L.J.; Wu, J.H.; Li, C.Y.; Peng, X.X.; Zhang, S.; Yi, G.J. Comparative transcriptomics analysis reveals difference of key gene expression between banana and plantain in response to cold stress. BMC Genom. 2015, 16, 446. [Google Scholar] [CrossRef] [Green Version]
  4. Wang, W.; Chen, Q.; Hussain, S.; Mei, J.; Dong, H.; Peng, S.; Huang, J.; Cui, K.; Nie, L. Pre-sowing Seed Treatments in Direct-seeded Early Rice: Consequences for Emergence, Seedling Growth and Associated Metabolic Events under Chilling Stress. Sci. Rep. 2016, 6, 19637. [Google Scholar] [CrossRef] [Green Version]
  5. Kumar, R. A Review Report: Low Temperature Stress for Crop Production. Int. J. Pure Appl. Biosci. 2018, 6, 575–598. [Google Scholar] [CrossRef]
  6. Saleem, M.H.; Rehman, M.; Zahid, M.; Imran, M.; Xiang, W.; Liu, L. Morphological changes and antioxidative capacity of jute (Corchorus capsularis, Malvaceae) under different color light-emitting diodes. Rev. Bras. Bot. 2019, 42, 581–590. [Google Scholar] [CrossRef]
  7. Kumari, K.; Singh, P.K.; Kumari, S.; Singh, K.M. Dynamics of Jute Export in India. Int. J. Curr. Microbiol. Appl. Sci. 2020, 9, 3769–3774. [Google Scholar] [CrossRef]
  8. Islam, M.M. Biochemistry, Medicinal and Food values of Jute (Corchorus capsularis L. and C. olitorius L.) leaf: A Review. Int. J. Enhanc. Res. Sci. Technol. Eng. 2013, 2, 35–44. [Google Scholar]
  9. Dansi, A.; Adjatin, A.; Adoukonou-Sagbadja, H.; Faladé, V.; Yedomonhan, H.; Odou, D.; Dossou, B. Traditional leafy vegetables and their use in the Benin Republic. Genet. Resour. Crop Evol. 2008, 55, 1239–1256. [Google Scholar] [CrossRef]
  10. Zeghichi, S.; Kallithraka, S.; Simopoulos, A.P. Nutritional composition of molokhia (Corchorus olitorius) and stamnagathi (Cichorium spinosum). World Rev. Nutr. Diet. 2003, 91, 1–21. [Google Scholar] [CrossRef]
  11. Yang, Z.; Lu, R.; Dai, Z.; Yan, A.; Tang, Q.; Cheng, C.; Xu, Y.; Yang, W.; Su, J. Salt-stress response mechanisms using de novo transcriptome sequencing of salt-tolerant and sensitive Corchorus spp. Genotypes. Genes 2017, 8, 226. [Google Scholar] [CrossRef] [Green Version]
  12. Islam, M.; Ali, S. Agronomic Research Advances in Jute Crops of Bangladesh. AASCIT J. Biol. 2018, 3, 34–46. [Google Scholar]
  13. Hossain, M.B.; Awal, A.; Rahman, M.A.; Haque, S.; Khan, H. Distinction between Cold-sensitive and -tolerant Jute by DNA Polymorphisms. J. Biochem. Mol. Biol. 2003, 36, 427–432. [Google Scholar] [CrossRef] [Green Version]
  14. Bajwa, V.S.; Shukla, M.R.; Sherif, S.M.; Murch, S.J.; Saxena, P.K. Role of melatonin in alleviating cold stress in Arabidopsis thaliana. J. Pineal Res. 2014, 56, 238–245. [Google Scholar] [CrossRef]
  15. Apel, K.; Hirt, H. Reactive oxygen species: Metabolism, oxidative stress, and signal transduction. Annu. Rev. Plant Biol. 2004, 55, 373–399. [Google Scholar] [CrossRef] [Green Version]
  16. Chen, Y.E.; Cui, J.M.; Li, G.X.; Yuan, M.; Zhang, Z.W.; Yuan, S.; Zhang, H.Y. Effect of salicylic acid on the antioxidant system and photosystem II in wheat seedlings. Biol. Plant. 2016, 60, 139–147. [Google Scholar] [CrossRef]
  17. Rentel, M.C.; Knight, M.R.; Kingdom, U. Oxidative Stress-Induced Calcium Signaling. Plant Physiol. 2004, 135, 1471–1479. [Google Scholar] [CrossRef] [Green Version]
  18. Erdal, S.; Genisel, M.; Turk, H.; Dumlupinar, R.; Demir, Y. Modulation of alternative oxidase to enhance tolerance against cold stress of chickpea by chemical treatments. J. Plant Physiol. 2015, 175, 95–101. [Google Scholar] [CrossRef]
  19. Hoagland, D.R.; Arnon, D.I. Water-Culture Method Growing Plants without Soil; California Agricultural Experiment Station: Berkely, CA, USA, 1950; Volume 347, pp. 29–31. [Google Scholar]
  20. Lichtenthaler, H.K.; Wellburn, A.R. Determinations of total carotenoids and chlorophylls a and b of leaf extracts in different solvents. Biochem. Soc. Trans. 1983, 11, 591–592. [Google Scholar] [CrossRef] [Green Version]
  21. Sairam, R.K.; Deshmukh, P.S.; Shukla, D.S. Tolerance of drought and temperature stress in relation to increased antioxidant enzyme activity in wheat. J. Agron. Crop Sci. 1997, 178, 171–178. [Google Scholar] [CrossRef]
  22. Bates, L.S.; Waldren, R.P.; Teare, I.D. Rapid determination of free proline for water-stress studies. Plant Soil 1973, 207, 205–207. [Google Scholar] [CrossRef]
  23. Yemm, E.W.; Willis, A. The estimaion of carbohydrates in plant extracts by anthrone. Biochem. J. 1954, 57, 197. [Google Scholar] [CrossRef] [Green Version]
  24. Bradford, M.M. A Rapid and sensitive method for quantitation of microgram quantities of protein utilizing principle of protein-dye binding. Anal. Biochem. 1976, 72, 248–254. [Google Scholar] [CrossRef]
  25. Biswas, A.; Dey, S.; Li, D.; Liu, Y.; Zhang, J.; Huang, S.; Pan, G.; Deng, Y. Comparison of Phytochemical Profile, Mineral Content, and in Vitro Antioxidant Activities of Corchorus capsularis and Corchorus olitorius Leaf Extracts from Different Populations. J. Food Qual. 2020, 2020, 2931097. [Google Scholar] [CrossRef] [Green Version]
  26. Xu, B.; Chang, S.K.C. Effect of soaking, boiling, and steaming on total phenolic contentand antioxidant activities of cool season food legumes. Food Chem. 2008, 110, 1–13. [Google Scholar] [CrossRef]
  27. Ensminger, I.; Busch, F.; Huner, N.P.A. Photostasis and cold acclimation: Sensing low temperature through photosynthesis. Physiol. Plant. 2006, 126, 28–44. [Google Scholar] [CrossRef]
  28. Kalaji, H.M.; Jajoo, A.; Oukarroum, A.; Brestic, M.; Zivcak, M.; Samborska, I.A.; Cetner, M.D.; Łukasik, I.; Goltsev, V.; Ladle, R.J. Chlorophyll a fluorescence as a tool to monitor physiological status of plants under abiotic stress conditions. Acta Physiol. Plant. 2016, 38, 102. [Google Scholar] [CrossRef] [Green Version]
  29. Zainol, M.K.; Abd-Hamid, A.; Yusof, S.; Muse, R. Antioxidative activity and total phenolic compounds of leaf, root and petiole of four accessions of Centella asiatica (L.) Urban. Food Chem. 2003, 81, 575–581. [Google Scholar] [CrossRef]
  30. Xu, S.C.; Li, Y.P.; Hu, J.; Guan, Y.J.; Ma, W.G.; Zheng, Y.Y.; Zhu, S.J. Responses of antioxidant enzymes to chilling stress in tobacco seedlings. Agric. Sci. China 2010, 9, 1594–1601. [Google Scholar] [CrossRef]
  31. Wu, J.; Lightner, J.; Warwick, N.; Browse, J. Low-temperature damage and subsequent recovery of fab1 mutant arabidopsis exposed to 2 °C. Plant Physiol. 1997, 113, 347–356. [Google Scholar] [CrossRef] [Green Version]
  32. Noreen, Z.; Ashraf, M. Changes in antioxidant enzymes and some key metabolites in some genetically diverse cultivars of radish (Raphanus sativus L.). Environ. Exp. Bot. 2009, 67, 395–402. [Google Scholar] [CrossRef]
  33. Atici, Ö.; Demir, Y.; Kocaçalişkan, İ. Effects of low temperature on winter wheat and cabbage leaves. Biol. Plant. 2003, 46, 603–606. [Google Scholar] [CrossRef]
  34. Tewari, A.K.; Tripathy, B.C. Temperature-stress-induced impairment of chlorophyll biosynthetic reactions in cucumber and wheat. Plant Physiol. 1998, 117, 851–858. [Google Scholar] [CrossRef] [PubMed] [Green Version]
  35. Demmig-Adams, B.; Gilmore, A.M.; Iii, W.W.A. In vivo functions of carotenoids in higher plants. FASEB J. 1996, 10, 403–412. [Google Scholar] [CrossRef]
  36. Demmig-Adams, B.; Adams, W.W. Photoprotection in an ecological context: The remarkable complexity of thermal energy dissipation. New Phytol. 2006, 172, 11–21. [Google Scholar] [CrossRef] [PubMed]
  37. Boese, S.R.; Huner, N.P.A. Effect of growth temperature and temperature shifts on spinach leaf morphology and photosynthesis. Plant Physiol. 1990, 94, 1830–1836. [Google Scholar] [CrossRef] [PubMed] [Green Version]
  38. Kaur, G.; Asthir, B.J.B.P. Proline: A key player in plant abiotic stress tolerance. Biol. Plant. 2015, 59, 609–619. [Google Scholar] [CrossRef]
  39. Huang, M.; Guo, Z. Responses of antioxidative system to chilling stress in two rice cultivars differing in sensitivity. Biol. Plant. 2005, 49, 81–84. [Google Scholar] [CrossRef]
  40. Ben Rejeb, K.; Abdelly, C.; Savouré, A. How reactive oxygen species and proline face stress together. Plant Physiol. Biochem. 2014, 80, 278–284. [Google Scholar] [CrossRef]
  41. Huang, X.; Chen, M.H.; Yang, L.T.; Li, Y.R.; Wu, J.M. Effects of Exogenous Abscisic Acid on Cell Membrane and Endogenous Hormone Contents in Leaves of Sugarcane Seedlings under Cold Stress. Sugar Tech 2015, 17, 59–64. [Google Scholar] [CrossRef]
  42. Lu, K.; Sun, J.; Li, Q.; Li, X.; Jin, S. Effect of cold stress on growth, physiological characteristics, and calvin-cycle-related gene expression of grafted watermelon seedlings of different gourd rootstocks. Horticulturae 2021, 7, 391. [Google Scholar] [CrossRef]
  43. Yuanyuan, M.; Yali, Z.; Jiang, L.; Hongbo, S. Roles of plant soluble sugars and their responses to plant cold stress. Afr. J. Biotechnol. 2009, 8, 2004–2010. [Google Scholar] [CrossRef]
  44. Uemura, M.; Steponkus, P.L. A contrast of the plasma membrane lipid composition of oat and rye leaves in relation to freezing tolerance. Plant Physiol. 1994, 104, 479–496. [Google Scholar] [CrossRef] [PubMed] [Green Version]
  45. De Freitas, G.M.; Thomas, J.; Liyanage, R.; Lay, J.O.; Basu, S.; Ramegowda, V.; do Amaral, M.N.; Benitez, L.C.; Braga, E.J.B.; Pereira, A. Cold tolerance response mechanisms revealed through comparative analysis of gene and protein expression in multiple rice genotypes. PLoS ONE 2019, 14, e0218019. [Google Scholar] [CrossRef]
  46. Morsy, M.R.; Almutairi, A.M.; Gibbons, J.; Yun, S.J.; De Los Reyes, B.G. The OsLti6 genes encoding low-molecular-weight membrane proteins are differentially expressed in rice cultivars with contrasting sensitivity to low temperature. Gene 2005, 344, 171–180. [Google Scholar] [CrossRef] [PubMed]
  47. Fahimirad, S.; Karimzadeh, G.; Ghanati, F. Cold-induced Changes of Antioxidant Enzymes Activity and Lipid Peroxidation in Two Canola (Brassica napus L.) Cultivars. J. Plant Physiol. Breed. 2013, 3, 1–11. [Google Scholar]
  48. Khalofah, A.; Migdadi, H.; El-harty, E. Antioxidant enzymatic activities and growth response of quinoa (Chenopodium quinoa willd) to exogenous selenium application. Plants 2021, 10, 719. [Google Scholar] [CrossRef]
  49. Wakeel, A.; Xu, M.; Gan, Y. Chromium-induced reactive oxygen species accumulation by altering the enzymatic antioxidant system and associated cytotoxic, genotoxic, ultrastructural, and photosynthetic changes in plants. Int. J. Mol. Sci. 2020, 21, 728. [Google Scholar] [CrossRef] [PubMed] [Green Version]
  50. Posmyk, M.M.; Kontek, R.; Janas, K.M. Antioxidant enzymes activity and phenolic compounds content in red cabbage seedlings exposed to copper stress. Ecotoxicol. Environ. Saf. 2009, 72, 596–602. [Google Scholar] [CrossRef]
  51. Mittler, R. Oxidative stress, antioxidants and stress tolerance. Trends Plant Sci. 2002, 7, 405–410. [Google Scholar] [CrossRef]
  52. Skyba, M.; Petijová, L.; Košuth, J.; Koleva, D.P.; Ganeva, T.G.; Kapchina-Toteva, V.M.; Čellárová, E. Oxidative stress and antioxidant response in Hypericum perforatum L. plants subjected to low temperature treatment. J. Plant Physiol. 2012, 169, 955–964. [Google Scholar] [CrossRef]
  53. Auh, C.K.; Scandalios, J.G. Spatial and temporal responses of the maize catalases to low temperature. Physiol. Plant. 1997, 101, 149–156. [Google Scholar] [CrossRef]
  54. Sevengor, S.; Yasar, F.; Kusvuran, S.; Ellialtioglu, S. The effect of salt stress on growth, chlorophyll content, lipid peroxidation and antioxidative enzymes of pumpkin seedling. Afr. J. Agric. Res. 2011, 6, 4920–4924. [Google Scholar] [CrossRef]
  55. Zhang, Q.; Zhang, J.Z.; Chow, W.S.; Sun, L.L.; Chen, J.W.; Chen, Y.J.; Peng, C.L. The influence of low temperature on photosynthesis and antioxidant enzymes in sensitive banana and tolerant plantain (Musa sp.) cultivars. Photosynthetica 2011, 49, 201–208. [Google Scholar] [CrossRef]
  56. Balestrasse, K.B.; Tomaro, M.L.; Batlle, A.; Noriega, G.O. The role of 5-aminolevulinic acid in the response to cold stress in soybean plants. Phytochemistry 2010, 71, 2038–2045. [Google Scholar] [CrossRef] [PubMed]
  57. Krasnovsky, A.A., Jr. Singlet molecular oxygen in photobiochemical systems: IR phosphorescence studies. Membr. Cell Biol. 1998, 12, 665–690. [Google Scholar]
  58. Tatari, M.; Fotouhi Ghazvini, R.; Mousavi, A.; Babaei, G. Comparison of some physiological aspects of drought stress resistance in two ground cover genus. J. Plant Nutr. 2018, 41, 1215–1226. [Google Scholar] [CrossRef]
  59. Gill, S.S.; Tuteja, N. Reactive oxygen species and antioxidant machinery in abiotic stress tolerance in crop plants. Plant Physiol. Biochem. 2010, 48, 909–930. [Google Scholar] [CrossRef]
  60. Almela, L.; Fernández-López, J.A.; Roca, M.J. High-performance liquid chromatographic screening of chlorophyll derivatives produced during fruit storage. J. Chromatogr. A 2000, 870, 483–489. [Google Scholar] [CrossRef]
  61. Šamec, D.; Karalija, E.; Šola, I.; Vujčić Bok, V.; Salopek-Sondi, B. The role of polyphenols in abiotic stress response: The influence of molecular structure. Plants 2021, 10, 118. [Google Scholar] [CrossRef]
  62. Sharma, P.; Jha, A.B.; Dubey, R.S.; Pessarakli, M. Reactive Oxygen Species, Oxidative Damage, and Antioxidative Defense Mechanism in Plants under Stressful Conditions. J. Bot. 2012, 2012, 217037. [Google Scholar] [CrossRef] [Green Version]
  63. Sarikamiş, G.; Çakir, A. Influence of low temperature on aliphatic and indole glucosinolates in broccoli (Brassica oleracea var. italica L.). Acta Hortic. 2016, 1145, 79–84. [Google Scholar] [CrossRef]
  64. Dixon, R.A.; Achnine, L.; Kota, P.; Liu, C.J.; Reddy, M.S.S.; Wang, L. The phenylpropanoid pathway and plant defence—A genomics perspective. Mol. Plant Pathol. 2002, 3, 371–390. [Google Scholar] [CrossRef] [PubMed]
  65. Weidner, S.; Karolak, M.; Karamać, M.; Kosińska, A.; Amarowicz, R. Phenolic compounds and properties of antioxidants in grapevine roots (Vitis vinifera L.) under drought stress followed by recovery. Acta Soc. Bot. Pol. 2009, 78, 97–103. [Google Scholar] [CrossRef] [Green Version]
  66. Swigonska, S.; Amarowicz, R.; Król, A.; Mostek, A.; Badowiec, A.; Weidner, S. Influence of abiotic stress during soybean germination followed by recovery on the phenolic compounds of radicles and their antioxidant capacity. Acta Soc. Bot. Pol. 2014, 83, 209–218. [Google Scholar] [CrossRef] [Green Version]
  67. Hakam, N.; Simon, J.P. Effect of low temperatures on the activity of oxygen-scavenging enzymes in two populations of the C4 grass Echinochloa crus-galli. Physiol. Plant. 1996, 97, 209–216. [Google Scholar] [CrossRef]
  68. Gechev, T.; Willekens, H.; Van Montagu, M.; Inzé, D.; Van Camp, W.; Toneva, V.; Minkov, I. Different responses of tobacco antioxidant enzymes to light and chilling stress. J. Plant Physiol. 2003, 160, 509–515. [Google Scholar] [CrossRef]
  69. Rajametov, S.N.; Lee, K.; Jeong, H.B.; Cho, M.C.; Nam, C.W.; Yang, E.Y. Physiological traits of thirty-five tomato accessions in response to low temperature. Agriculture 2021, 11, 792. [Google Scholar] [CrossRef]
Figure 1. Influence of cold stress on leaf antioxidant and enzymatic antioxidants in jute varieties. Plant under control (28 °C) and stress (5 °C) showed a response in: (a) Lipid peroxidation MDA, (b) Hydrogen peroxide (H2O2). Different significant level marked with **** p < 0.0001, *** p ≤ 0.001, ** p ≤ 0.01, * p ≤ 0.05, and ns mean non-significant.
Agronomy 11 02547 g001
Figure 2. Response of jute varieties to low temperature treatments, with control (28 °C) and stress (5 °C) showing differential response in osmolyte content. (a) Proline content, (b) Soluble sugar content. Different significant level marked with **** p < 0.0001, *** p ≤ 0.001, * p ≤ 0.05, and ns mean non-significant.
Agronomy 11 02547 g002
Figure 3. Influence of cold stress on leaf antioxidant and enzymatic antioxidants in jute varieties. Plants under control (28 °C) and stress (5 °C) showed a response in: (a) Superoxidase dismutase (SOD) activity, (b) Peroxidase (POD) activity (c) Catalase (CAT) activity and (d) APx activity. Different significant level marked with **** p < 0.0001, *** p ≤ 0.001, ** p ≤ 0.01, * p ≤ 0.05, and ns mean non-significant.
Agronomy 11 02547 g003
Figure 4. Influence of cold stress on enzymatic and non-enzymatic antioxidants in jute varieties. Plants under control (28 °C) and stress (5 °C) showed a response in: (a) Total polyphenol, (b) Total flavonoid, and (c) GSH activity. Different significant level marked with **** p < 0.0001, *** p ≤ 0.001, ** p ≤ 0.01, * p ≤ 0.05, and ns mean non-significant.
Agronomy 11 02547 g004
Figure 5. Biplot for the first two principal components (PC1 and PC2) was shown using the principal component analysis (PCA) with all measured parameters and 7 varieties.
Agronomy 11 02547 g005
Figure 6. Cluster heat map results were obtained based on biochemical parameters in low-temperature stress conditions.
Agronomy 11 02547 g006
Figure 7. Radar plot represents the varietal variations in biochemical traits at low-temperature stress.
Agronomy 11 02547 g007
Figure 8. Pearson’s correlation analysis of different physiological and biochemical traits under low-temperature stress.
Agronomy 11 02547 g008
Table 1. Origin of 7 varieties of C. capsularis and C. olitorius.
SpeciesVarietyOrigin (Province/Country)
Y49C. capsularisHuangma 971Hunan
Y38C. capsularisMiandianyuanguoMyanmar
Y1C. capsularisLongxihongpiLongxi county, Guangdong
T8C. olitoriusT8Zhejiang
W57C. olitoriusW57Zhejiang
M33C. olitoriusFunong 5Fujian
M18C. olitoriusMaliyengshengchangguoMali
Table 2. Changes of chlorophyll content compared to control, chlorophyll stability index (CSI), and carotenoid in different varieties under exposure to cold stress.
ChlorophyllCarotenoid
GenotypesChl aChl bTotal Chl
ControlTreatmentCSI%ControlTreatment CSI%ControlTreatmentCSI%ControlTreatment
Y491.77 ± 0.01 a1.73 ± 0.0 a97.810.61± 0.0 a0.60 ± 0.01 b98.422.39 ± 0.0 a2.34 ± 0.0 b97.970.127 ± 0.0 b0.129 ± 0.0 a
Y11.93 ± 0.02 a1.23 ± 0.01 b64.140.50 ± 0.04 a0.77 ± 0.02 b152.872.43 ± 0.01 a2.00 ± 0.03 b82.440.13 ± 0.0 a0.12 ± 0.0 b
Y381.94 ± 0.0 a1.10 ± 0.02 b56.850.44 ± 0.02 a0.31 ± 0.02 b69.182.39 ± 0.01 a1.41 ± 0.01 b59.170.12 ± 0.01 a0.10 ± 0.0 b
M331.82 ± 0.0 b1.85 ± 0.0 a 101.670.55 ± 0.04 a0.31 ± 0.01 b55.622.37 ± 0.0 a2.16 ± 0.02 b90.970.12 ± 0.0 a0.10 ± 0.0 b
T81.75 ± 0.03 a1.10 ± 0.02 b63.230.46± 0.0 a0.44 ± 0.0 b94.932.20 ± 0.01 a1.54 ± 0.02 b69.880.11 ± 0.0 a0. 09 ± 0.0 b
W571.51 ± 0.0 a1.21 ± 0.0 b80.430.32 ± 0.0 a0.25 ± 0.0 b78.951.83 ± 0.01 a1.46 ± 0.0 b80.170.10 ± 0.0 a0.09 ± 0.0 a
M181.61 ± 0.02 a1.24 ± 0.03 b77.030.53 ± 0.0 a0.48 ± 0.01 a110.512.09 ± 0.0 a1.77 ± 0.03 b84.710.109 ± 0.0 a0.105 ± 0.0 b
Significant difference at p < 0.05 probability level using LSD test. Values in the table represent means and standard errors. Different lowercases indicate difference significant at 0.05 level.
Table 3. Stress tolerance index (STI) with their mean.
GenotypesTotal chlCarotenoidSoluble SugarProlineSODPODCATAPxMDAH2O2GSHTFCTPCMean STI
Y490.98 ± 0.0 a1.00 ± 0.01 a1.25 ± 0.04 a 1.68 ± 0.06 a1.14 ± 0.04 a1.21 ± 0.07 a1.52 ± 0.01 a 1.44 ± 0.07 b 1.17 ± 0.02 c 1.12 ± 0.01 c 1.79 ± 0.27 a 1.24 ± 0.05 a 1.18 ± 0.03 b 1.29
Y10.66 ± 0.01 c0.94 ± 0.01 bc0.79 ± 0.08 b1.17 ± 0.06 b0.86 ± 0.0 bc1.07 ± 0.03 bc 0.69 ± 0.05 d 1.16 ± 0.0 cd 1.66 ± 0.17 ab 1.15 ± 0.02 c 0.59 ± 0.03 cd 0.85.05 c 0.88 ± 0.02 cd 0.96
Y380.59 ± 0.0 e0.82 ± 0.02 d0.72 ± 0.05 b1.11 ± 0.04 b0.92 ± 0.03 b 0.95 ± 0.06 cd 0.67 ± 0.05 d 1.05 ± 0.0 cde 1.91 ± 0.10 a 1.47 ± 0.06 a 0.61 ± 0.06 cd 0.82 ± 0.02 c 0.77 ± 0.02 d 0.96
M330.91 ± 0.03 b0.99 ± 0.01 a1.17 ± 0.02 a1.60 ± 0.02 a1.10 ± 0.02 a1.24 ± 0.02 a 1.27 ± 0.01 b 1.82 ± 0.17 a 1.12 ± 0.01 c 1.07 ± 0.01 c 1.46 ± 0.11 a 1.05 ± 0.0 b 1.33 ± 0.04 a 1.24
T80.70 ± 0.01 d0.80 ± 0.0 d0.70 ± 0.0 b1.08 ± 0.03 b0.80 ± 0.05 c0.92 ± 0.03 d 0.64 ± 0.0 d 0.95 ± 0.01 de 1.49 ± 0.06 b 1.31 ± 0.03 b 0.52 ± 0.08 d 0.91 ± 0.03 c 0.88 ± 0.04 cd 0.90
W570.80 ± 0.0 c0.9 ± 0.01 ab0.79 ± 0.05 b1.16 ± 0.06 b0.80 ± 0.02 c0.99 ± 0.01 bcd 0.94 ± 0.02 c 0.85 ± 0.0 e 1.17 ± 0.05 c 1.25 ± 0.01 b 0.89 ± 0.02 bc 0.92 ± 0.03 c 0.95 ± 0.05 c 0.96
M180.85 ± 0.01 c0.96 ± 0.01 b0.83 ± 0.04 b1.15 ± 0.03 b0.77 ± 0.05 c1.11 ± 0.01 ab 0.87 ± 0.02 c 1.23 ± 0.03 bc 1.18 ± 0.03 c 1.45 ± 0.0 a 1.05 ± 0.05 b 0.92 ± 0 c 0.90 ± 0.01 c 1.02
Significant difference at p < 0.05 probability level using LSD test. Values in the table represent of means and standard errors. Different lowercases indicate difference significant at 0.05 level.
Publisher’s Note: MDPI stays neutral with regard to jurisdictional claims in published maps and institutional affiliations.

