Article

Impact of Corn Cob-Derived Biochar in Altering Soil Quality, Biochemical Status and Improving Maize Growth under Drought Stress

1
Sub-Campus Burewala, University of Agriculture Faisalabad, Faisalabad 38040, Pakistan
2
Department of Soil and Water Sciences, China Agricultural University, Beijing 100193, China
3
Hangzhou Academy of Agricultural Science, Hangzhou 310024, China
4
Institute of Soil and Environmental Sciences, University of Agriculture Faisalabad, Faisalabad 38040, Pakistan
5
State Key Laboratory of Rice Biology, Institute of Biotechnology, Zhejiang University, Hangzhou 310058, China
*
Authors to whom correspondence should be addressed.
Agronomy 2021, 11(11), 2300; https://doi.org/10.3390/agronomy11112300
Submission received: 28 September 2021 / Revised: 11 November 2021 / Accepted: 11 November 2021 / Published: 13 November 2021
(This article belongs to the Special Issue Plant, Soil, Microbe Interactions in Response to Environmental Stress)

Abstract

:
Biochar enhances soil fertility by improving the soil physical, chemical and microbiological properties. The aim of this study was to investigate the impact of corn cob-derived biochar on soil enzymatic activity, organic carbon, aggregate stability and soil microbial biomass carbon under drought stress. Biochar was prepared from crushed corn cobs pyrolyzed at 300 °C and 400 °C and applied at a ratio of 1% (w/w) and 3% (w/w) filled in pots. In each pot, three field capacity (FC) levels, i.e., 100, 70 and 40%, were maintained gravimetrically. Results showed that biochar application improved the growth (plant height and root length) and relative water content in maize leaves under drought stress, while it reduced electrolyte leakage compared to a control treatment. Aggregate stability was significantly (p ≤ 0.05) higher in biochar amended soil. Moreover, microbial biomass carbon and soil water also increased under drought stress at 70% FC and 40% FC, respectively, where 3% w/w (400 °C) biochar was applied. Among enzymes, β-glucosidase and alkaline phosphatase activity were improved with biochar application. The maximum organic carbon (240%, 246% and 249%, 254% more than control) was calculated in soils where 3% biochar pyrolyzed at 400 °C and 300 °C was mixed with soil, respectively. Similarly, the carbon pool index (CPI) and carbon management index (CMI) were also higher in biochar-amended soil as compared to control treatment. Conclusively, biochar amendment could effectively improve soil quality and maize growth under drought stress.

1. Introduction

Food insecurity is a global issue and a more severe threat to developing countries in particular due to increasing populations and the declining availability of agricultural lands, water and other resources related to agricultural settings [1,2]. Soil quality is a determinant of improved crop production. An increase in crop production and sustainable agronomic approaches are thus required to ensure food security under changing climate [3]. Soil organic matter is a potential indicator for soil productivity that can be improved with better management practices and by adding organic materials and crop residues. Soil organic carbon is vital for sustainable productivity as it improves the soil structure, provides nutrients, retains water and improves soil microbial diversity [4,5]. It also acts as a good binding agent for soil aggregates [6].
Organic manure can be an important source of organic carbon in soil. However, its production as fertilizer for agricultural soils is decreasing, resulting in the need to explore different sources of soil organic carbon [7]. We should focus on the other sources to maintain a sufficient balance of organic substances in the soil. The application of biochar into the soil as an organic amendment could be an innovative approach for solving the problem in low-quality soils [8]. Biochar is a fine-grained and highly porous material that holds carbon produced under relatively high temperatures in the presence of low oxygen [9]. Moreover, biochar particles bind with the soil particles to develop stable soil aggregates, resulting in a favorable structure [10].
Soil enzymes are involved in many biochemical reactions, such as nutrient cycling, carbon mineralization, and organic matter decomposition [11]. Several factors influence enzyme activity in the soil, including soil structure and texture, soil moisture, pH and temperature [12,13]. Biochar has a large surface area, which improves soil structure, retention capacity, and influences soil pH [14,15]. These changes in soil properties associated with biochar amendment can thus influence enzyme activities. In the literature, several studies have reported that the application of biochar significantly improved the antioxidant enzyme contents, e.g., superoxide dismutase (SOD), peroxidase (POD) and ascorbate peroxidase (APX) together with a decrease in reactive oxygen species (ROS), e.g., malondialdehyde (MDA), and electrolyte leakage (EL) in plants under stress conditions [16]. In a recent study, Zhang et al. [8] revealed that the soil amendments with biochar increased antioxidant enzyme activity and decreased the MDA content in sugar beet (Beta vulgaris L.) under stress conditions.
Although several research studies documented that the application of biochar causes a significant improvement in soil structure, soil enzyme activity, organic carbon content, and soil quality for better crop production, much of this work has been done under normal conditions. However, little work has been explored regarding the enzymatic activity for soil conditioning under drought stress. The objective of the present study was to evaluate the impact of biochar on maize growth and soil characteristics, including enzyme activity, aggregate stability, organic carbon and soil microbial carbon under drought stress.

2. Materials and Methods

2.1. Preparation and Characterization of Biochar

For biochar preparation, the corn cobs were taken from the Institute of Soil and Environmental Sciences research area, University of Agriculture Faisalabad, Pakistan. After sun and oven drying at 65 °C in a forced-air oven (Eyela WFO-600ND, Tokyo Rikakikai, Japan), cobs were crushed into small 2–5 mm pieces having moisture content of up to 10–15%. Feedstock (crushed corn cobs) was put in a muffle furnace and pyrolyzed at 300 °C or 400 °C. Temperature was increased by 8–9 °C min−1 and residence time was 15–20 min [17]. Biochar electrical conductivity (EC) and pH were determined after shaking a suspension at 1:20 ratio (biochar: deionized water) for 90 min on a mechanical shaker. Heating was performed up to 107 °C, and this temperature was maintained until the constant weight of the biochar sample was obtained; weight loss was recorded as moisture in biochar. Moreover, the size, shape and morphology of biochar were evaluated using scanning electron microscopy (SEM) (TM 1000 Hitachi, Tokyo, Japan), transmission electron microscopy (TEM) (1230 JEOL, Tokyo, Japan) and energy dispersive spectroscopy (EDS) (Oxford Instruments, Abingdon, UK).

2.2. Experimental Design

A pot study was performed in a glasshouse at the Institute of Soil and Environmental Sciences, UAF, Pakistan. The experimental soil samples were (2 mm) sieved and air-dried for evaluation of physicochemical properties (Table 1). The soil texture was estimated through a hydrometer according to Bouyoucos et al. [18]. Furthermore, soil physicochemical properties were measured using the method previously described by Walkley and Black [19]. Biochar was mixed at 1% and 3% separately in the soil before filling the pots. Seven-kilogram soil was used in each pot; for control, one set of pots was filled with soil without biochar. Levels of field capacity at 100%, 70% and 40% FC were maintained gravimetrically. Fifteen treatments with three repeats (total pots, 45) were arranged in factorial arrangement using a completely randomized design (CRD). The recommended amount of NPK (220:180:120 kg ha−1) was mixed in the soil at the time of sowing. Five seeds of maize were sowed and after germination, three plants were maintained in each pot.

2.3. Measurement of Plant Growth and Physiological Parameters

Maize crop was harvested after 50 days of sowing. Plant roots were separated from the soil with tap water after cutting the stem. Maize stalk height and root length were measured using standard procedures, and relative water content (RWC) in maize leaves was analyzed using the formula given below [20].
RWC   ( % ) = W f W d W f t W d  
Wf (Fresh weight), Wd (Dry weight), Wft (full turgid weight gained when leaves were held in 100% humidity conditions for 48 h at 4 °C in the dark) were measured.
The leaf samples (0.5 g) were placed in a 10 mL tube with 5 mL deionized water and incubated at 27 °C for 4 h, and the conductivity in solution was measured by a conductometer (R1). Afterward, samples were heated for 10 min in a boiling water bath, and conductivity was measured again after the samples had cooled to 27 °C (R2). Electrolyte leakage (EL) was calculated using the following formula.
Electrolyte   leakage   ( % ) = R 1 R 2 × 100
Malondialdehyde (MDA) content was estimated from leaves (200 mg) homogenized with 4 mL (0.1%) trichloroacetic acid. Homogenized samples were centrifuged for 15 min at 10,000 rpm and supernatant separated. A mixture containing 1 mL supernatant and 2 mL each of trichloroacetic acid (20%) and thiobarbituric acid (0.5%) was prepared. The mixture was cooled in ice after heating (95 °C) for 0.5 h, and MDA content was calculated after measuring absorbance at 532 nm using a visible spectrophotometer according to Nakano and Asada [21].
For ascorbate peroxidase activity, the sample mixture was prepared using 20 µL of leaf extract, 660 µL ascorbic acid solution (0.5 mM), 660 µL potassium phosphate buffer (50 mM, pH 7.0) and 660 µL H2O2. H2O2 was added at the end, and APx activity was estimated as a decrease in absorbance at 290 nm due to reduction in ascorbate by H2O2 as previously described by Nakano and Asada [21] The activity of APx was expressed as nmol ascorbate min−1 mg−1 protein.

2.4. Soil Quality Analysis

2.4.1. Measurement of Soil Aggregate Stability and Moisture Content

A small rainfall simulator was used to measure water stable aggregation (WSA) in soil samples collected from each pot. After air drying, samples were oven-dried at 40 °C after sieving through an 8 mm sieve. Stacked sieves (0.25 mm and 2 mm) and catch pan were used to shake the samples on a mechanical shaker for 10 s. Aggregates having size 0.25–2 mm were oven-dried again at 40 °C to achieve constant moisture content and measure water-stable aggregate. After drying, a single layer of aggregate was spread on a mesh sieve (0.25 mm) and placed 0.5 mm below the rainfall simulator with a diameter of 0.59 mm. About 1.9 joules of energy was used through simulated rainfall for a period of 300 s as recommended by [22], and the remaining fraction of soil particles (>0.25) in the sieve was used to determine WSA using the following formula.
Water   stable   aggrgates = Weight   of   stable   aggregate   Weight   of   total   aggregate  
where,
Weight   of   stable   aggregates = Weight   of   total   aggregate   ( Weight   of   slaked + Weight   of   stones )
Weight of slaked is the weight of total aggregate slaked out of sieve, and stones are the particles remaining in the sieve after the test.
Moisture content was determined by oven-drying (65 °C) 100 g of soil sample from each pot in an oven (Eyela WFO-600ND) until reaching constant weight, and soil moisture content was calculated as
Soil   moisture   content   % = wright   of   fresh   soil   sample     weight   of   over   dried   soil   weight   of   oven   dried   soil   × 100

2.4.2. Measurement of Soil Microbial Biomass

Microbial biomass carbon (MBC) and microbial biomass nitrogen (MBN) were determined through chloroform fumigation. A crucible was placed in a desiccator containing soil sample (10 g), and dish containing chloroform (30 mL) was placed near it; one soil sample without chloroform was also placed in separate desiccator as control for 5 d at room temperature [23]. After fumigation, soil samples were extracted for microbial C and N using K2SO4 solution (0.5 M). For calculations, k-factor 0.35 used for MBC [24], while 0.45 was used for MBN, and the calculation for microbial biomass was performed with the equations [25,26] given below.
MB   carbon = Extracted   Carbon   ( EC ) K
MB   nitrogen = Exracted   Nitrogen   ( EC ) K
where, K = fraction of extracted carbon or nitrogen from fumigated microbial biomass

2.4.3. Soil Biochemical Analysis

Modified universal buffer (MUB) was prepared at pH 11 for alkaline phosphatase assay and 6.5 for acid phosphatase assay (4 mL each); 1 mL solution of ρ-nitrophenyl phosphate (PNP) was prepared in that buffer. After treating 1 g of soil with toluene (0.25), the contents were incubated at 37 °C for 1 h. After incubation completed, 4 mL of 0.5 M NaOH and 1 mL of 0.5 M CaCl2 were added into the incubated samples. In the control sample, 4 mL of 0.5 M NaOH and 1 mL of 0.5 M CaCl2 were added before PNP and just before filtration. After filtration, the absorbance of the filtrate was measured at a wavelength 400 nm [27].
For β-glucosidase, 1 g of soil sample was treated with 0.25 mL toluene and placed in a flask containing MUB buffer (4 mL) and 1 mL ρ-nitrophenyl, β-glucosidase (PNG) solution and incubated at 37 °C for 1 h. After incubation, samples were treated with 4 mL of pH 12 tris buffer (hydroxyl-methyl amino-methane) solution and 1 mL CaCl2 (0.5 M). The control sample was treated with PNG first, before adding the pH 12 tris buffer (hydroxyl-methyl amino-methane) solution and 1 mL of 0.5 M CaCl2, and color intensity was observed at λ 400 nm [28].

2.4.4. Carbon Management Index

Carbon lability and changes in total carbon of the soil were used to develop a carbon management index (CMI) through KMnO4 oxidation [29]. The calculation for CMI was performed by taking soil samples as treatments along with control as a reference treatment; accordingly, the carbon pool index (CPI) was calculated by measuring changes in total organic carbon among control and treatments as given below:
CPI = TOCtreatment TOCcontrol
Lability of carbon (L) was calculated using C fraction oxidized by KMnO4 (POXC), as follows:
L = Carbon   in   sample   oxidized   by   KMnO 4 Carbon   in   sample   unoxidized   by   KMnO 4
Labile carbon (L) was used to calculate the lability index (LI), as follows:
LI = Ltreatment Lcontrol
CMI was calculated as the product of CPI and LI, as follows:
CMI = CPI × LI ×100

2.5. Statistical Analysis

Data were arranged using Microsoft Excel 2013® (Microsoft Corporation, Redmond, WA, USA), Statistix 8.1® (Analytical Software, Tallahassee, FL, USA). The data from the pot experiment were analyzed through one-way ANOVA by using the Statistix software suite (version 8.0), and Tukey’s multiple comparison test was used to compare the mean values (p ≤ 0 0.05).

3. Results

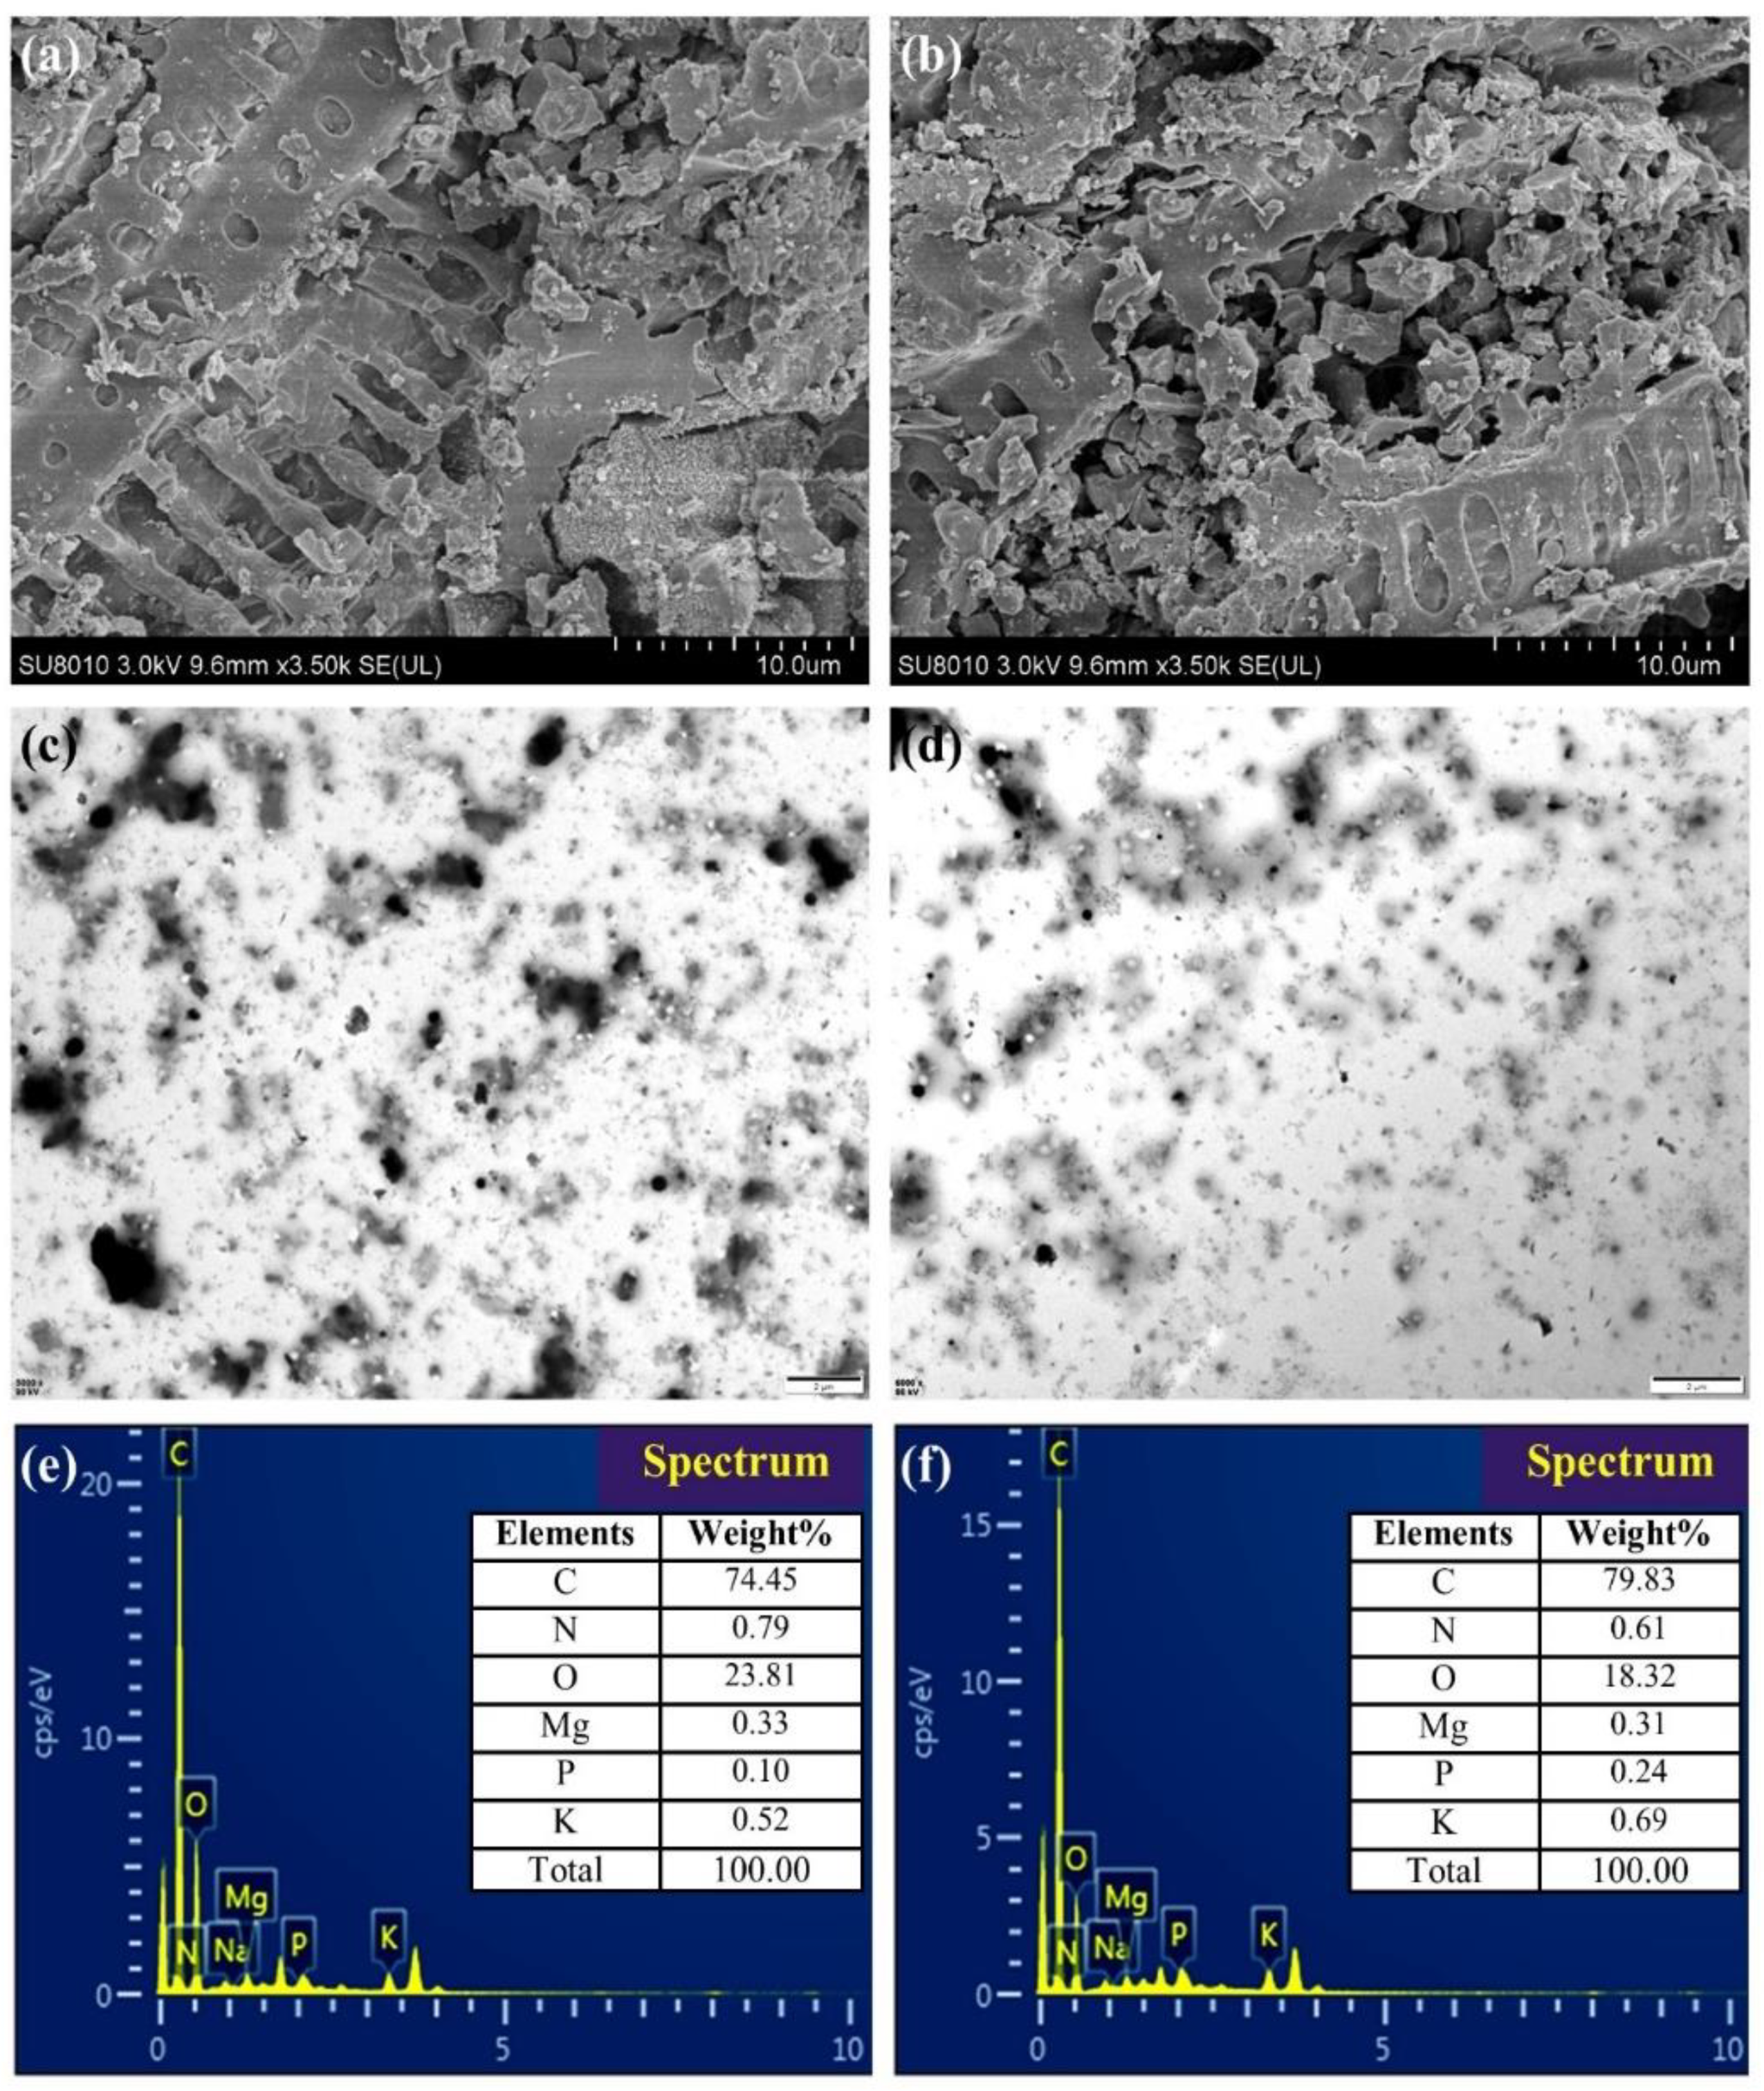
3.1. Characterization of Biochar

The present study presented the physicochemical properties of crushed corn cob biochar (Table 1). Moreover, SEM, TEM and EDS analysis revealed the size, shape and surface morphology of corn cob biochar samples pyrolyzed at 300 °C and 400 °C (Figure 1). The SEM results for biochar produced at 300 °C showed a smaller pore size and higher surface area compared with the biochar pyrolyzed at 400 °C. Similarly, TEM images of biochar pyrolyzed at 300 °C showed that particle size was larger than that of the biochar pyrolyzed at 400 °C. In addition, EDS analysis demonstrated the elemental composition of biochar. The biochar pyrolyzed at 300 °C consisted of 74.45% C, 0.79% N, 23.81% O, 0.33% Mg, 0.10% P and 0.52% K. However, the sample pyrolyzed at 400 °C consisted of 79.83% C, 18.32% O, 0.61% N, 0.31% Mg, 0.24% P and 0.69% K.
Table 1. Physicochemical properties of crushed corn cob biochar and soil.
Biochar
CharacteristicUnitsValues at 300 °CValues at 400 °C
Yield%47–5042.45
pH1:20-6.387.88
EC1:20dS m−10.211.23
Ash content%12.314.8
Moisture content%3.211.84
CECcmolc kg−138.4052.55
Carbon%55.3161.87
Nitrogen%1.782.93
Phosphorus%0.3819.38
Potassium%0.971.02
Soil
CharacteristicUnitsValues
pHs-8.12
ECedS m−11.34
Organic matter (OM)%0.63
Total N%0.049
Available Pmg kg−14.46
Available Kmg kg−1128
Field capacity (FC)%10.9
Texture of soil -Sandy clay loam

3.2. Effect of Biochar on Maize Growth and Physiological Parameters

Drought stress significantly (p ≤ 0.05) affects plant growth in terms of shoot and root length (Table 2). Maximum shoot length at 100% of field capacity (FC) was measured with 1% biochar (300 °C), which was increased by 12% compared to control. Under drought stress, highest shoot length was measured with 3% biochar (400 °C) at 70% and 40% FC, and was increased by 35% and 51% compared to control, respectively. Highest root length was measured where 1% and 3% (300 °C) and 1% (400 °C) biochar was applied at 100% FC compared to control without biochar (Table 2). However, the maximum increase in root length at 70% FC was measured with 3% (400 °C) biochar, and was increased by 5% compared with control, while at 40% FC the highest root length was observed in the control, where no biochar was applied.
There was no significant difference in electrolyte leakage (EL) among all treatments with biochar and control without biochar at 100% FC (Table 3). However, a significant (p ≤ 0.05) reduction in EL was observed at FC 70% and 40% with biochar application at 3% (400 °C), decreasing by 28% and 36% as compared to control, respectively. The highest relative water content was measured in the treatment where biochar was applied at 3% (400 °C) and increased by 7%, 36% and 51%, respectively, compared to the control treatment without biochar, at 100%, 70% and 40% of field capacity (Table 3). Reduction in MDA content was observed with biochar addition in soil under drought (Table 3). Maximum reduction was observed with 3% biochar (400 °C) at 70% FC and 40% FC, and was 28% and 17%, respectively, compared to control without biochar. APx activity was increased under drought; however, biochar reduced the activity of APx under drought stress, and the reduction was 32% and 42% at 70% FC and 34% and 42% at 40% FC where biochar was applied at 3% (300 °C and 400 °C) respectively, compared to control (Table 3).

3.3. Effect of Biochar on Soil Quality Parameters

A significant (p ≤ 0.05) increase in aggregate stability was observed in biochar amended treatments compared to unamended control treatment (Table 4). Maximum aggregate stability was 30% where biochar was applied at 3% (400 °C) and 3% (300 °C), respectively at 100% FC as compared to control (17%) without biochar (Table 4). However, with increasing drought level, from 100% FC to 40% FC, the results were statistically at par among all biochar treatments. At 40% FC, aggregate stability of 32% was measured with 3% (400 °C) biochar, followed by 31% with 3% (300 °C) and 19% with the control (19%) treatment. Similarly, the highest soil moisture content was measured with 3% biochar (400 °C) at all field capacity levels, yielding 59%, 42% and 26%, respectively, at 100%, 70% and 40% FC (Table 4). This increase in soil moisture was 104%, 132% and 125%, respectively, as compared to control treatment without biochar.
Biochar addition into the soil significantly (p ≤ 0.05) increased the MBC under drought stress (70% and 40% FC); however, under 100% FC, the results were statistically at par among all treatments with or without biochar (Table 4). At 70% FC, the maximum MBC was 197 mg kg−1 and 171 mg kg−1 with 3% biochar (400 °C) and 3% biochar (300 °C) respectively, compared to control (126 mg kg−1) without biochar. Similarly, at 40% FC, the MBC was 141 mg kg−1 and 113 mg kg−1 with 3% biochar (400 °C) and 3% biochar (300 °C), respectively, compared to control (64 mg kg−1) treatment. MBN was also non-significant (p ≤ 0.05) within each treatment at 100% FC (Table 4). The highest values for MBN were 24 mg kg−1 and 23 mg kg−1 at 70% FC, and 20 mg kg−1 and 17 mg kg−1 at 40% FC, for biochar treatments applied at 3% (400 °C) and 3% (300 °C), respectively, compared with control treatment (15 mg kg−1 and 7 mg kg−1) where no biochar was applied (Table 4).

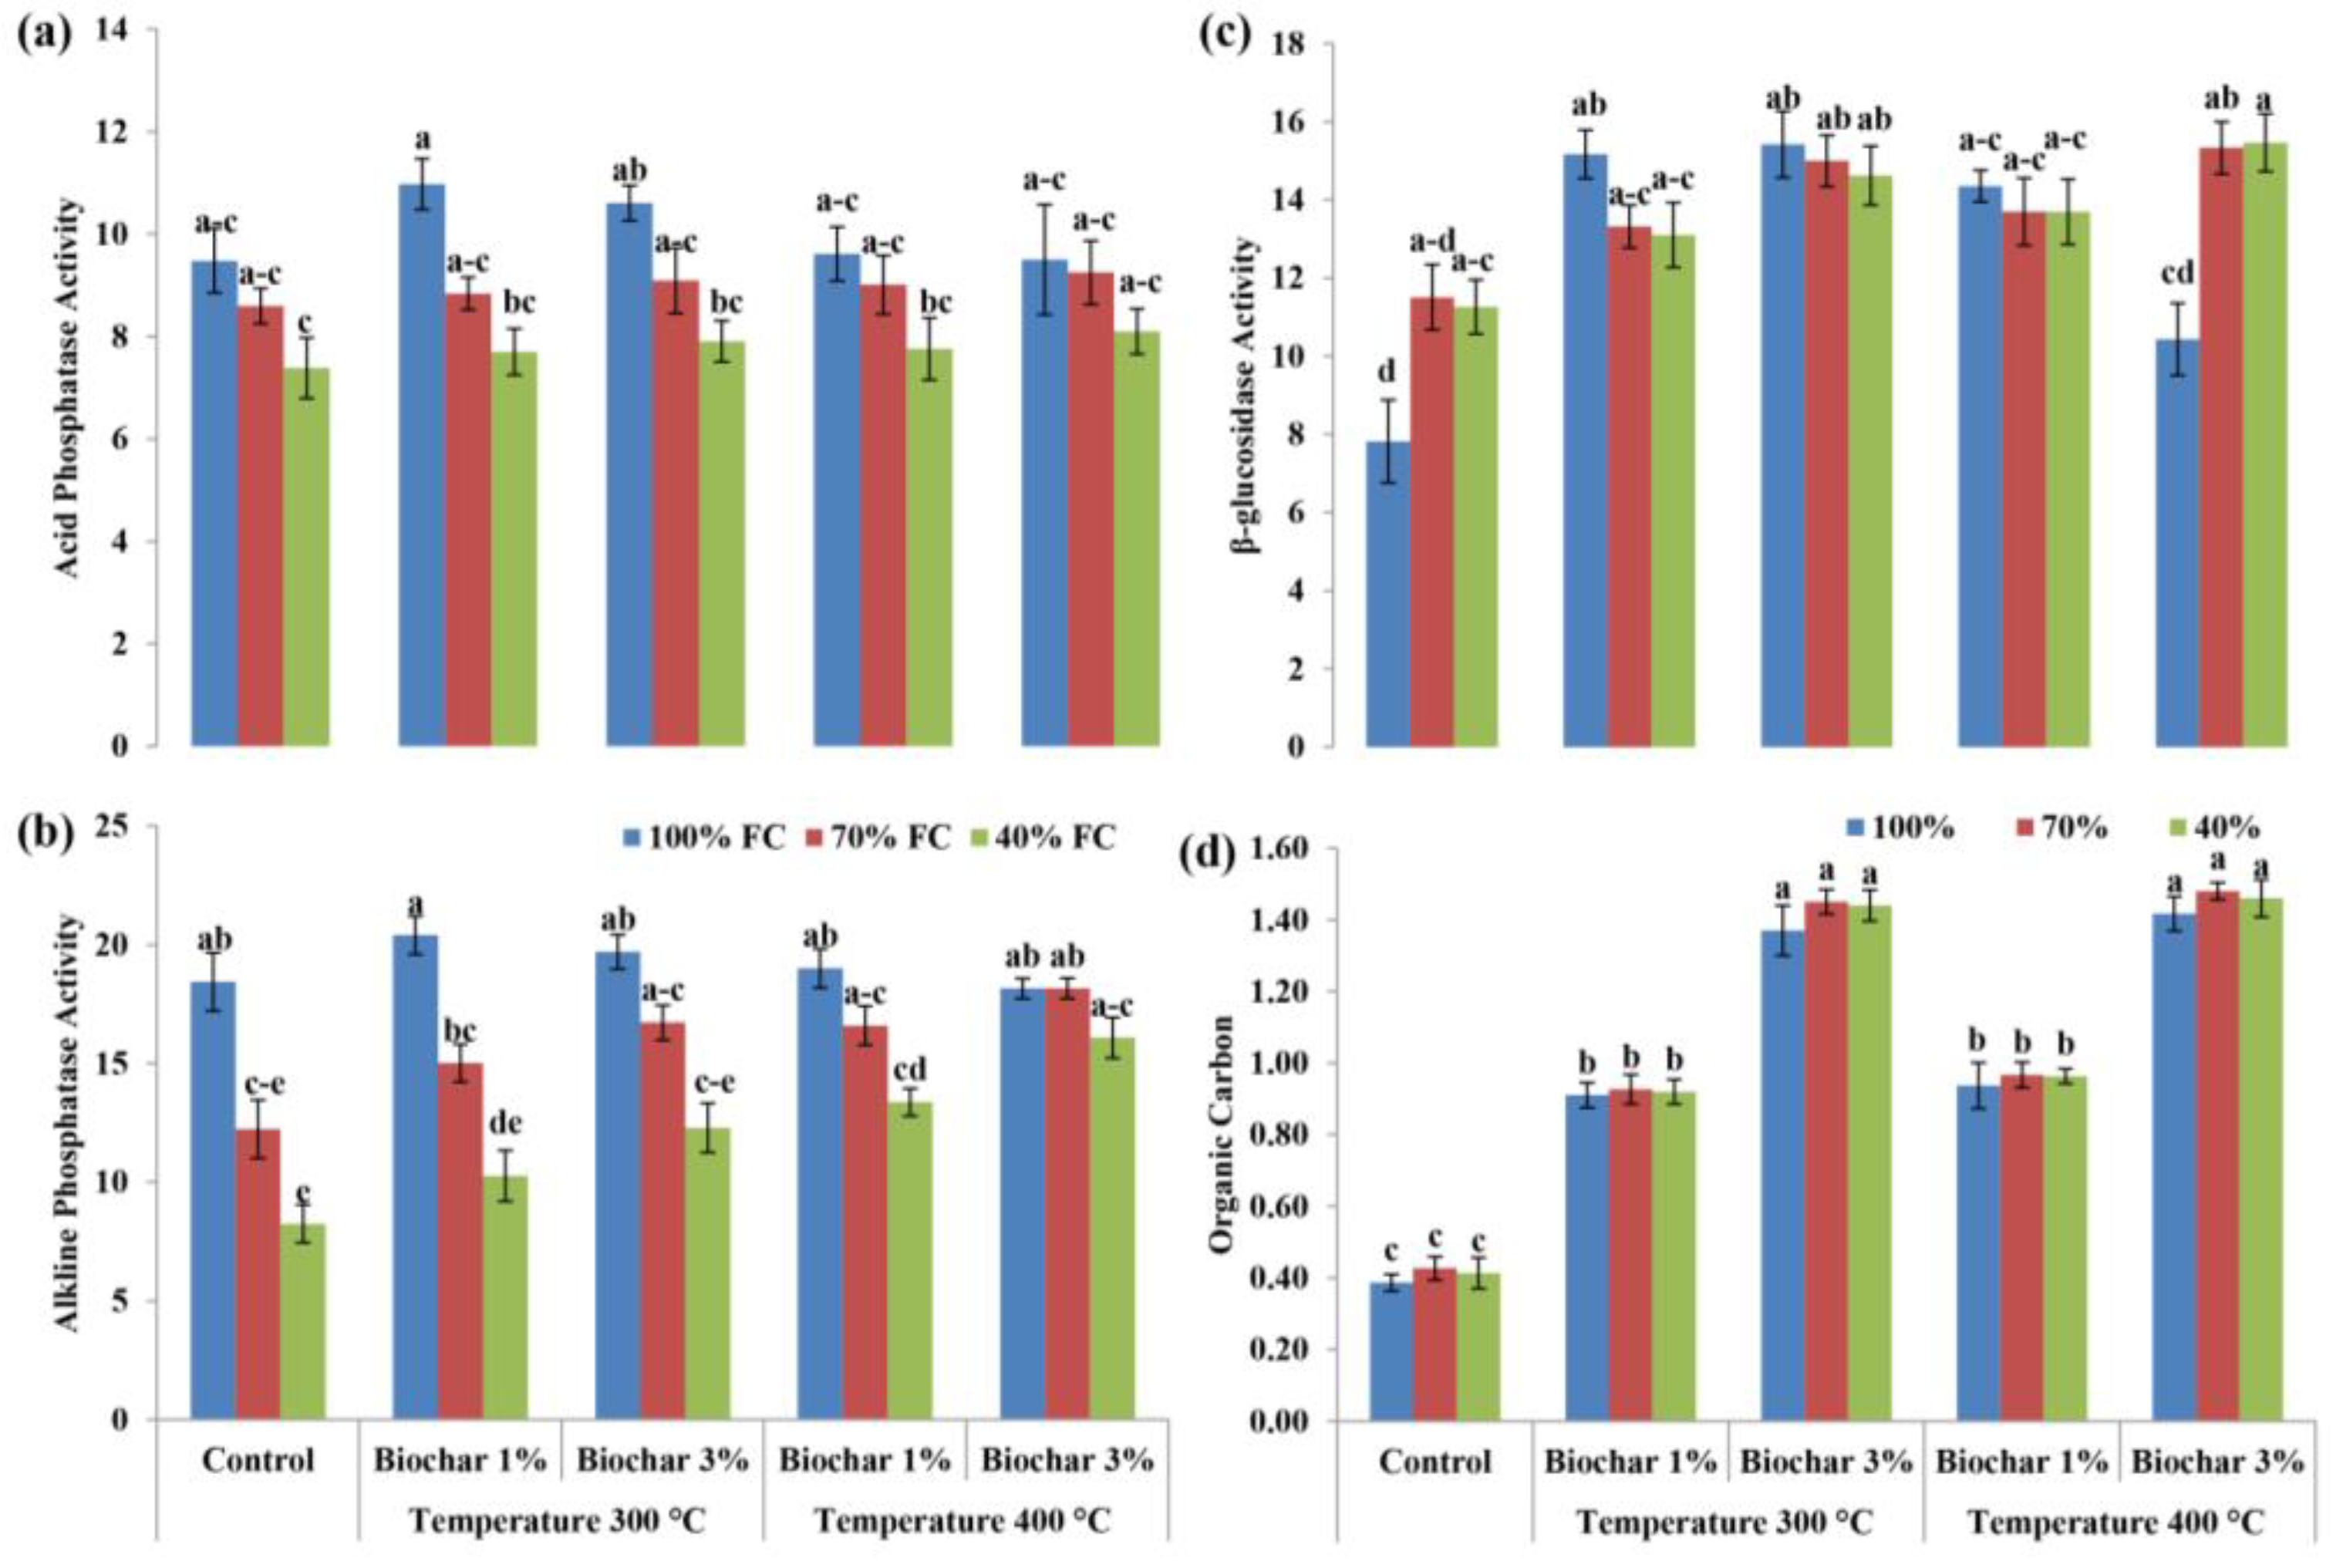
3.4. Effect of Biochar on Soil Biochemical Attributes

The data showed that drought significantly (p ≤ 0.05) affects soil alkaline phosphatase (Figure 2b) and β-glucosidase activity in biochar amended soil (Figure 2c). However, soil acid phosphatase activity was statistically at par among all the treatments (biochar amended as well as a control without biochar) at 100%, 70% and 40% FC, respectively (Figure 2a). Soil alkaline phosphatase activity showed a non-significant (p ≤ 0.05) relation among all the treatments at 100% FC. However, under drought stress at 40% FC, the addition of 3% and 1% biochar produced at 400 °C to the soil significantly (p ≤ 0.05) improved the activity of alkaline phosphatase, and the improvement was 95% and 62% respectively, compared with the control treatment without biochar. Although β-glucosidase activity was also improved with the addition of a lower concentration of biochar (1%) produced at the lower temperature (300 °C) at 100% FC, at 40% and 70% FC, β-glucosidase activity was improved with the application of the higher concentration of biochar (3%) produced at the higher temperature (400 °C), compared to control with no biochar added (Figure 2c).

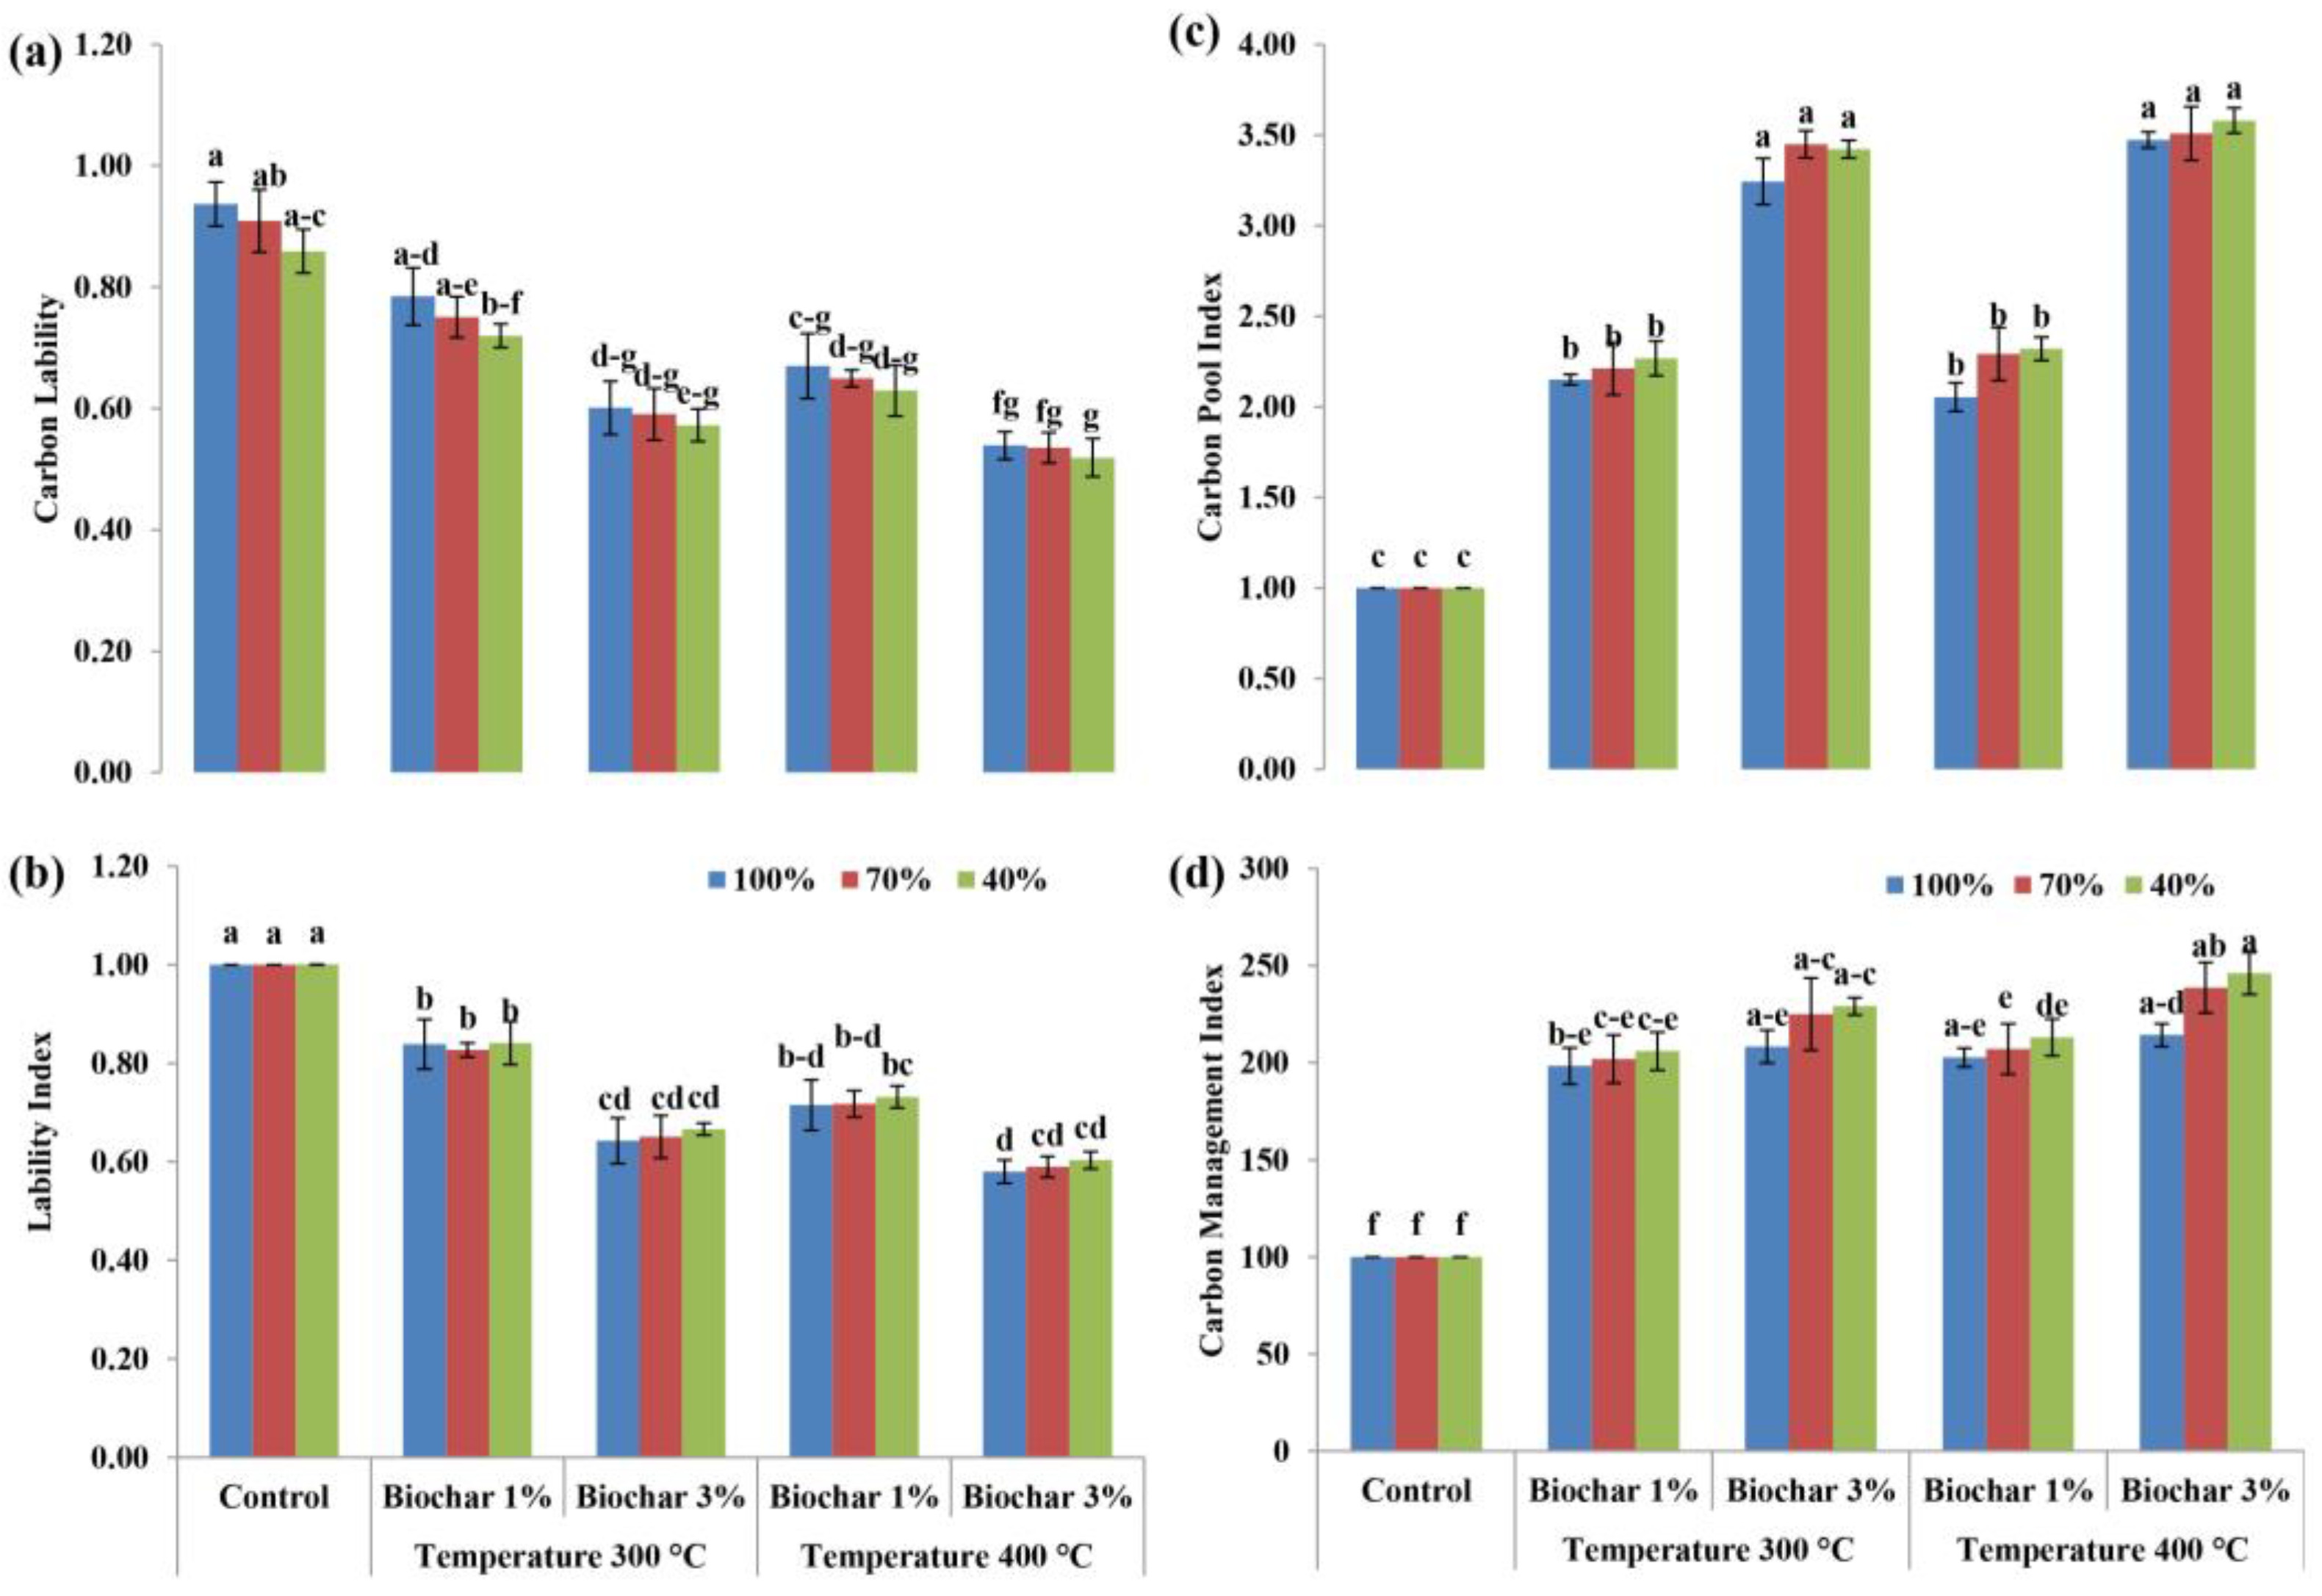
3.5. Effect of Biochar on Soil Organic Carbon Composition

Biochar addition into the soil significantly (p ≤ 0.05) increased the organic carbon in the soil (Figure 3d). The highest values of organic carbon measured at 100%, 40% and 70% FC were obtained with the treatment where biochar was applied at 3% (400 °C), and were 266%, 254% and 246% or more, respectively, compared to the control where no biochar was applied. Moreover, the results with each biochar treatment were statistically at par at 100%, 70% and 40% FC. Carbon lability was reduced significantly (p ≤ 0.05) with biochar, and minimum carbon lability (0.52, 0.54 and 0.54) was calculated at 40% FC with 3% biochar (400 °C) compared to control (0.86, 0.91, and 0.94), respectively (Figure 3a). A similar trend was observed in the case of the lability index, and the minimum lability index (0.58) was measured at 100% FC where 3% (400 °C) biochar was applied (Figure 3b). Data on carbon pool index (CPI) showed that biochar significantly (p ≤ 0.05) increased CPI when applied at a higher rate, and the maximum value of CPI was calculated with 3% biochar (400 °C), which was 3.58, 3.51 and 3.47 at 40% 70% and 100% respectively, followed by the results with 3% biochar (300 °C), where the CPI value was calculated as 3.45 3.42 and 3.24 at 70%, 40% and 100% FC, respectively, compared to control without biochar (Figure 3c). Similarly, the carbon management index (CMI) achieved a maximum value of 246 with biochar applied at 3% (400 °C) at 40% FC (Figure 3d). This result was similar to the values at 70% and 100% FC, where the CMI was 239 and 214, respectively. However, statistically, there were no significant differences among all the treatments except for the control (Figure 3d).

4. Discussion

Plant growth is adversely affected by drought, which causes plant cell dehydration, consequently inhibiting cell division and elongation, stem elongation, leaf size, root proliferation and plant water [30,31,32]. In the present study, we observed that biochar addition into the soil significantly affected plant growth under drought stress. However, at 70% FC and 40% FC, biochar application at a higher rate (3% w/w produced at 400 °C) significantly enhanced maize plant height, which could be due to more soil moisture as biochar retains more water due to its high porosity and high surface area [33,34]. Root length was increased with 3% w/w biochar pyrolyzed at 400 °C under drought stress at 70% FC (Table 2). That could be the result of biochar supplementation that improved the soil’s biological and physicochemical properties, which favor roots. Glaser et al. [35] and Abiven et al. [36] documented that biochar addition into the soil yielded improved length, wider root systems and lateral roots (primary and secondary) by providing more nutrients to specific zones [37], specifically for nutrients that are immobile, such as phosphorus [38]. The root length significantly increased due to the availability of more water to the plant, which could help the photosynthesis machinery improve chlorophyll content under drought stress [39]. Similarly, biochar addition improved the growth, and especially the roots, of Phragmites karka under drought stress [40].
The present study demonstrate higher relative water content in maize leaf in biochar amended soil under drought stress (Table 2), which could be due to the significant increase in water uptake from soil to maintain the plants’ water status [41]. Improvement in water status was observed by Abideen et al. [40], with biochar application in soil; other researchers also reported similar findings [42,43]. The relation between MDA content/lipid peroxidation was very strong, as more electrolyte leakage occurred with higher MDA accumulation under drought stress because higher accumulation of MDA and lipid peroxidation cause reduction in membrane stability [44]. We investigated higher electrolyte leakage with higher drought levels (70% FC and 40% FC). However, biochar addition at 3% (300 °C and 400 °C pyrolyzing temperatures) caused reduction in membrane leakage/MDA content under drought as documented by Abideen et al. [40]. A reduction in MDA content was also reported in maize leaves when poultry manure was applied with pyroligneous solution [45]. Biochar application into the soil reduced the oxidative stress and antioxidant enzyme activity compared to control [46]. For example, reduction in ascorbate peroxidase activity and other antioxidant enzyme activity, e.g., glutathione reductase (GR), in maize was documented in biochar amended soil under oxidative stress [47]. Improvements in plant physiology were also reported [41] with higher rates of biochar compared to lower rates.
We observed higher carbon content in soil amended with biochar, which is consistent with previous studies [48,49]. These higher levels of carbon content and lower carbon lability together reflected that biochar carbon remains in the soil for longer periods compared to other organic matter [50]. Several researchers reported similar findings [31,51]. In the present study, we investigated the significant increase in aggregate stability in biochar (1% and 3% w/w) amended soil under drought stress (70%, 40% FC). Lei and Zhang [52] observed a 17–18% increase in macroaggregates with biochar (woodchip and dairy manure) addition into the soil compared to control. The formation of water-stable macroaggregates with rice husk and corn cob biochar was also reported [53,54]. The organic carbon present in biochar has a potential role in increasing soil aggregate stability due to its recalcitrant nature and generally produces more stable macroaggregates [52].
In this study, maximum soil moisture content was measured (Table 3) in treatments where biochar was applied at 3% w/w (pyrolyzed at 400 °C), which could be due to more surface area and porosity, as biochar with higher surface area and porosity stores higher water content [55]. The soil application of biochar significantly improved soil fertility, which influenced the soil’s capacity to retain water available for plants [56,57,58]. Several studies revealed that the combination of biochar with soils could improve soil structure, increase porosity, decrease bulk density, and enhance aggregation and water retention [59,60]. Improvement in soil water content/soil moisture was also reported by many researchers [61,62,63,64]; however, the improvements depend on the feedstock used for pyrolysis, the pyrolysis method and conditions, and the rate of biochar applied [65].
Our results showed an increase in microbial biomass (MB) C and N with biochar application into the soil under drought stress. This increase in microbial biomass was possible because biochar provides natural habitat to the microbes in the soil environment [66,67,68,69] and also provides macro and micronutrients to the soil microbes for their proliferation [70,71]. Several studies also reported that biochar incorporation into the soil increases the microbial population [72,73]. However, the composition and abundance of different microbes may vary in response to biochar applications [66,74]. The distribution of various minerals present in biochar, as well as the pore size and surface area, depend on certain conditions, e.g., temperature [75]. A higher temperature creates more pores and higher surface area, and increases the carbon content in biochar [76].
Enzymes are potentially involved in certain biochemical processes in soils, such as organic matter mineralization and the carbon, nitrogen, and phosphorus cycles [77]. The activity of phosphatase in soil reflects the activity of the soil enzymes associated with living and dead plant cells, free phosphatase in soil solution, humic substances and microbes [78], and stimulates the transformation of organic into inorganic forms in soil, which are radially available to plants [79]. The highest alkaline phosphatase activity was found in soil amended with 3% w/w (400 °C) biochar at 70% FC and 40% FC, while acidic, alkaline activity was not improved (Figure 2). This change in enzymatic activity is associated with changes in soil moisture and oxygenation [80]. Gong et al. [81] reported an increase in the enzymatic activity of microbes with biochar addition into the soil. This difference in the promoting effect of biochar could be due to the physicochemical properties of the biochar used; the available proportion of nutrients in biochar can be a good source for microorganisms [82]. Our results showed an increase in β-glucosidase activity (Figure 2c). Smith et al. [83] and Bailey et al. [84] also reported increases in β-glucosidase activity when 2% (w/w) biochar pyrolyzed at 500 °C was applied to sandy, loamy soil. Similarly, Ouyang et al. [85] showed an increase in β-glucosidase activity in soil amended with dairy manure biochar during the initial incubation period. The activity of various enzymes was altered because biochar influences soil water holding capacity, specific surface area, gas exchange and other physicochemical properties of the soil [66]. We found in our experiment that organic carbon increased significantly with the addition of biochar (3% pyrolyzed at 400 °C) under drought stress (Figure 2d); this increase in organic carbon was attributed to the more recalcitrant nature of biochar as a stable source of organic carbon [8]. Improvements in total organic carbon in soil amended with biochar were also reported by other authors [86,87]. Recently, Agegnehu et al. [88] and Cross et al. [89] documented the biochar contribution to carbon sequestration, as biochar addition into the soil increased organic carbon content. Biochar produced at higher temperatures contains less degradable and more stable matter (high aromatic C-C bonds), resulting in higher chemical recalcitrance and stability [85]. On the other hand, biochar produced at lower temperatures contains less stable and more easily degradable matter (high aliphatic C-H bonds) [90].

5. Conclusions

In the present study, we observed that application of biochar significantly improved maize plant growth under drought stress conditions. Similarly, relative water content in maize leaves, soil aggregate stability and soil moisture content were increased significantly with biochar amendment under drought stress as compared to control. Among soil enzymes, the activity of β-glucosidase and alkaline phosphatase activity was improved under drought stress, while acid phosphatase activity showed non-significant results compared to control. Biochar increased organic carbon in soil and reduced carbon lability under drought stress. Moreover, the carbon pool index and carbon management index were also increased in biochar-amended soil. Overall, biochar is a good approach to improving maize physiology, soil enzyme activity, soil aggregate stability, microbial biomass carbon and nitrogen, organic carbon and soil quality.

Author Contributions

Conceptualization, L.A. and M.K.; methodology, M.N.; software, N.M.; validation, S.M.N., A.A. and M.R.W.; formal analysis, L.A. and N.M.; investigation, S.M.N., A.A. and M.R.W.; resources, B.L.; data curation, T.A.; writing—original draft preparation, L.A. and N.M.; writing—review and editing, T.A. and B.L.; visualization, M.N.; supervision, M.K. and J.Y.; project administration, X.L. and J.Y.; funding acquisition, X.L. and J.Y. All authors have read and agreed to the published version of the manuscript.

Funding

This research was funded by the key research and development program of Zhejiang province (2019C02035), Science and technology innovation and promotion demonstration project of Hangzhou Academy of Agricultural Sciences (2020HNCT-12, 2019HNCT-03).

Institutional Review Board Statement

Not applicable.

Informed Consent Statement

Not applicable.

Data Availability Statement

The data presented in this study are available within the article.

Conflicts of Interest

The authors declare no conflict of interest.

References

  1. Lal, R. Sequestering carbon and increasing productivity by conservation agriculture. J. Soil Water Conserv. 2015, 70, 55A–62A. [Google Scholar] [CrossRef] [Green Version]
  2. Ray, D.K.; Gerber, J.S.; MacDonald, G.K.; West, P.C. Climate variation explains a third of global crop yield variability. Nat. Commun. 2015, 6, 5989. [Google Scholar] [CrossRef] [Green Version]
  3. Lobell, D.; Letters, C. Global scale climate–crop yield relationships and the impacts of recent warming. Environ. Res. Lett. 2007, 16, 014002. [Google Scholar] [CrossRef]
  4. Dai, P.; Cong, P.; Wang, P.; Dong, J.; Dong, Z.; Song, W. Alleviating Soil Acidification and Increasing the Organic Carbon Pool by Long-Term Organic Fertilizer on Tobacco Planting Soil. Agronomy 2021, 11, 2135. [Google Scholar] [CrossRef]
  5. Lu, J.; Li, S.; Liang, G.; Wu, X.; Zhang, Q.; Gao, C.; Li, J.; Jin, D.; Zheng, F.; Zhang, M.; et al. The Contribution of Microorganisms to Soil Organic Carbon Accumulation under Fertilization Varies among Aggregate Size Classes. Agronomy 2021, 11, 2126. [Google Scholar] [CrossRef]
  6. Bronick, C.; Lal, R. Soil structure and management: A review. Geoderma 2005, 124, 3–22. [Google Scholar] [CrossRef]
  7. Juriga, M.; Zootech, V. Effect of biochar on soil structure—Review. Acta Fytotech. Zootech. 2018, 11, 11–19. [Google Scholar] [CrossRef]
  8. Zhang, P.; Yang, F.; Zhang, H.; Liu, L.; Liu, X.; Chen, J.; Wang, X.; Wang, Y.; Li, C. Beneficial Effects of Biochar-Based Organic Fertilizer on Nitrogen Assimilation, Antioxidant Capacities, and Photosynthesis of Sugar Beet (Beta vulgaris L.) under Saline-Alkaline Stress. Agronomy 2020, 10, 1562. [Google Scholar] [CrossRef]
  9. Fazal, A.; Bano, A. Role of Plant Growth-Promoting Rhizobacteria (PGPR), Biochar, and Chemical Fertilizer under Salinity Stress. Commun. Soil Sci. Plant Anal. 2016, 47, 1985–1993. [Google Scholar] [CrossRef]
  10. Faye, A.; Stewart, Z.P.; Diome, K.; Edward, C.-T.; Fall, D.; Ganyo, D.K.K.; Akplo, T.M.; Prasad, P.V.V. Single Application of Biochar Increases Fertilizer Efficiency, C Sequestration, and pH over the Long-Term in Sandy Soils of Senegal. Sustainability 2021, 13, 11817. [Google Scholar] [CrossRef]
  11. Makoi, J.; Ndakidemi, P. Selected soil enzymes: Examples of their potential roles in the ecosystem. Afr. J. Biotechnol. 2010, 7, 181–191. [Google Scholar]
  12. Awad, Y.M.; Blagodatskaya, E.; Ok, Y.S.; Kuzyakov, Y. Effects of polyacrylamide, biopolymer, and biochar on decomposition of soil organic matter and plant residues as determined by 14C and enzyme activities. Eur. J. Soil Biol. 2012, 48, 1–10. [Google Scholar] [CrossRef]
  13. Ameloot, N.; Sleutel, S.; Case, S.; Alberti, G.; Al, E.C. Mineralization and microbial activity in four biochar field experiments several years after incorporation. Soil Biol. Biochem. 2014, 78, 195–203. [Google Scholar] [CrossRef]
  14. Jatav, H.S.; Rajput, V.D.; Minkina, T.; Singh, S.K.; Chejara, S.; Gorovtsov, A.; Barakhov, A.; Bauer, T.; Sushkova, S.; Mandzhieva, S.; et al. Sustainable Approach and Safe Use of Biochar and Its Possible Consequences. Sustainability 2021, 13, 10362. [Google Scholar] [CrossRef]
  15. Latawiec, A.E.; Koryś, A.; Koryś, K.A.; Kuboń, M.; Sadowska, U.; Gliniak, M.; Sikora, J.; Drosik, A.; Niemiec, M.; Klimek-Kopyra, A.; et al. Analysis of the Economic Potential Trough Biochar Use for Soybean Production in Poland. Agronomy 2021, 11, 2108. [Google Scholar] [CrossRef]
  16. Hafez, E.M.; Gowayed, S.M.; Nehela, Y.; Sakran, R.M.; Rady, A.M.S.; Awadalla, A.; Omara, A.E.-D.; Alowaiesh, B.F. Incorporated Biochar-Based Soil Amendment and Exogenous Glycine Betaine Foliar Application Ameliorate Rice (Oryza sativa L.) Tolerance and Resilience to Osmotic Stress. Plants 2021, 10, 1930. [Google Scholar] [CrossRef]
  17. Sánchez, M.; Lindao, E.; Margaleff, D.; Martínez, O.; Morán, A. Pyrolysis of agricultural residues from rape and sunflowers: Production and characterization of bio-fuels and biochar soil management. J. Anal. Appl. Pyrolysis 2009, 85, 142–144. [Google Scholar] [CrossRef]
  18. Bouyoucos, G.J. Hydrometer Method Improved for Making Particle Size Analyses of Soils1. Agron. J. 1962, 54, 464–465. [Google Scholar] [CrossRef]
  19. Walkley, A.; Black, I.A.; Walkley, A.; Black, I.A. An Examination of the Degtjareff Method for Determining Soil Organic Matter, and a Proposed Modification of the Chromic Acid Titration Method. Soil Sci. 1934, 37, 29–38. [Google Scholar] [CrossRef]
  20. Mayak, S.; Tirosh, T.; Glick, B.R. Plant growth-promoting bacteria confer resistance in tomato plants to salt stress. Plant Physiol. Biochem. 2004, 42, 565–572. [Google Scholar] [CrossRef] [PubMed]
  21. Nakano, Y.; Asada, K. Hydrogen peroxide is scavenged by ascorbate-specific peroxidase in spinach chloroplasts. Plant Cell Physiol. 1981, 22, 867–880. [Google Scholar]
  22. Moebius, B.; van Es, H.M.; Schindelbeck, R.R.; Idowu, O.; Clune, D.; Thies, J. Evaluation of laboratory-measured soil properties as indicators of soil physical quality. Soil Sci. 2007, 172, 895–912. [Google Scholar] [CrossRef]
  23. Anderson, J.; Ingram, J. Tropical Soil Biology and Fertility; CAB International: Wallingford, UK, 1989. [Google Scholar]
  24. Sparling, D.W. Acid precipitation and food quality: Inhibition of growth and survival in black ducks and mallards by dietary aluminum, calcium, and phosphorus. Arch. Environ. Contam. Toxicol. 1990, 19, 457–463. [Google Scholar] [CrossRef]
  25. Ross, D.J.; Täte, K.R. Microbial C and N, and respiratory activity, in litter and soil of a southern beech (Nothofagus) forest: Distribution and properties. Soil Biol. Biochem. 1993, 25, 477–483. [Google Scholar] [CrossRef]
  26. Sparling, G.; Biochemistry, A. A direct extraction method to estimate soil microbial C: Calibration in situ using microbial respiration and 14C labelled cells. Soil Biol. Biochem. 1988, 20, 337–343. [Google Scholar] [CrossRef]
  27. Eivazi, F.; Tabatabai, M.A. Phosphatases in soils. Soil Biol. Biochem. 1977, 9, 167–172. [Google Scholar] [CrossRef]
  28. Eivazi, F.; Tabatabai, M. Glucosidases and galactosidases in soils. Soil Biol. Biochem. 1988, 20, 601–606. [Google Scholar] [CrossRef]
  29. Blair, G.; Lefroy, R.; Lisle, L. Soil carbon fractions based on their degree of oxidation, and the development of a carbon management index for agricultural systems. Aust. J. Agric. Res. 1995, 46, 1459–1466. [Google Scholar] [CrossRef]
  30. Gaskin, J.; Speir, R.; Harris, K.; Das, K.; Lee, R.; Morris, L.; Fisher, D. Effect of peanut hull and pine chip biochar on soil nutrients, corn nutrient status, and yield. Agron. J. 2010, 102, 623–633. [Google Scholar] [CrossRef] [Green Version]
  31. Major, J.; Rondon, M.; Molina, D.; Riha, S.; Lehmann, J. Maize yield and nutrition during 4 years after biochar application to a Colombian savanna oxisol. Plant Soil 2010, 333, 117–128. [Google Scholar] [CrossRef]
  32. Troy, S.; Lawlor, P.; O’Flynn, C.; Healy, M. Impact of biochar addition to soil on greenhouse gas emissions following pig manure application. Soil Biol. Biochem. 2013, 60, 173–181. [Google Scholar] [CrossRef] [Green Version]
  33. Graber, E.R.; Harel, Y.M.; Kolton, M.; Cytryn, E.; Silber, A.; David, D.R.; Tsechansky, L.; Borenshtein, M.; Elad, Y. Biochar impact on development and productivity of pepper and tomato grown in fertigated soilless media. Plant Soil 2010, 337, 481–496. [Google Scholar] [CrossRef]
  34. Khan, S.; Wang, N.; Reid, B.; Freddo, A.; Cai, C. Reduced bioaccumulation of PAHs by Lactuca satuva L. grown in contaminated soil amended with sewage sludge and sewage sludge derived biochar. Environ. Pollut. 2013, 175, 64–68. [Google Scholar] [CrossRef] [PubMed]
  35. Glaser, B.; Haumaier, L.; Guggenberger, G.; Zech, W. The’Terra Preta’phenomenon: A model for sustainable agriculture in the humid tropics. Naturwissenschaften 2001, 88, 37–41. [Google Scholar] [CrossRef]
  36. Abiven, S.; Hund, A.; Martinsen, V.; Cornelissen, G. Biochar amendment increases maize root surface areas and branching: A shovelomics study in Zambia. Plant Soil 2015, 395, 45–55. [Google Scholar] [CrossRef] [Green Version]
  37. Hodge, A. The plastic plant: Root responses to heterogeneous supplies of nutrients. New Phytol. 2004, 162, 9–24. [Google Scholar] [CrossRef]
  38. Physiology, J. Root phenes for enhanced soil exploration and phosphorus acquisition: Tools for future crops. Plant Physiol. 2011, 156, 1041–1049. [Google Scholar]
  39. Xiao, Q.; Zhu, L.; Shen, Y.; Li, S. Sensitivity of soil water retention and availability to biochar addition in rainfed semi-arid farmland during a three-year field experiment. Field Crops Res. 2016, 196, 284–293. [Google Scholar] [CrossRef]
  40. Abideen, Z.; Koyro, H.W.; Huchzermeyer, B.; Ansari, R.; Zulfiqar, F.; Gul, B. Ameliorating effects of biochar on photosynthetic efficiency and antioxidant defence of Phragmites karka under drought stress. Plant Biol. 2020, 22, 259–266. [Google Scholar] [CrossRef] [PubMed]
  41. Keshavarz Afshar, R.; Hashemi, M.; DaCosta, M.; Spargo, J.; Sadeghpour, A. Biochar Application and Drought Stress Effects on Physiological Characteristics of Silybum marianum. Commun. Soil Sci. Plant Anal. 2016, 47, 743–752. [Google Scholar] [CrossRef]
  42. Akhtar, S.; Li, G.; Andersen, M.; Liu, F. Biochar enhances yield and quality of tomato under reduced irrigation. Agric. Water Manag. 2014, 138, 37–44. [Google Scholar] [CrossRef]
  43. Haider, G.; Koyro, H.W.; Azam, F.; Steffens, D.; Müller, C.; Kammann, C. Biochar but not humic acid product amendment affected maize yields via improving plant-soil moisture relations. Plant Soil 2015, 395, 141–157. [Google Scholar] [CrossRef]
  44. Liu, X.; Huang, B. Heat stress injury in relation to membrane lipid peroxidation in creeping bentgrass. Crop Sci. 2000, 40, 503–510. [Google Scholar] [CrossRef]
  45. Lashari, M.S.; Ye, Y.; Ji, H.; Li, L.; Kibue, G.W.; Lu, H.; Zheng, J.; Pan, G. Biochar-manure compost in conjunction with pyroligneous solution alleviated salt stress and improved leaf bioactivity of maize in a saline soil from central China: A 2-year field experiment. J. Sci. Food Agric. 2015, 95, 1321–1327. [Google Scholar] [CrossRef]
  46. Farhangi-Abriz, S.; Torabian, S. Antioxidant enzyme and osmotic adjustment changes in bean seedlings as affected by biochar under salt stress. Ecotoxicol. Environ. Saf. 2017, 137, 64–70. [Google Scholar] [CrossRef] [PubMed]
  47. Kim, H.; Kim, K.; Yang, J.; Ok, Y.; Owens, G.; Nehls, T.; Wessolek, G.; Kim, K. Effect of biochar on reclaimed tidal land soil properties and maize (Zea mays L.) response. Chemosphere 2016, 142, 153–159. [Google Scholar] [CrossRef]
  48. Song, W.; Pyrolysis, M. Quality variations of poultry litter biochar generated at different pyrolysis temperatures. J. Anal. Appl. Pyrolysis 2012, 94, 138–145. [Google Scholar] [CrossRef]
  49. Hale, S.; Lehmann, J.; Rutherford, D.; Zimmerman, A.; Bachmann, R.; Al, E. Quantifying the total and bioavailable polycyclic aromatic hydrocarbons and dioxins in biochars. ACS Publ. 2018, 46, 2830–2838. [Google Scholar] [CrossRef]
  50. Lehmann, J.; Skjemstad, J.; Sohi, S.; Carter, J.; Barson, M.; Falloon, P.; Coleman, K.; Woodbury, P.; Krull, E. Australian climate–carbon cycle feedback reduced by soil black carbon. Nat. Geosci. 2008, 12, 832–835. [Google Scholar] [CrossRef]
  51. Chen, B.; Zhou, D.; Zhu, L. Transitional adsorption and partition of nonpolar and polar aromatic contaminants by biochars of pine needles with different pyrolytic temperatures. Environ. Sci. Technol. 2008, 42, 5137–5143. [Google Scholar] [CrossRef]
  52. Lei, O.; Zhang, R. Effects of biochars derived from different feedstocks and pyrolysis temperatures on soil physical and hydraulic properties. J. Soils Sediments 2013, 13, 1561–1572. [Google Scholar] [CrossRef]
  53. Herath, H.; Camps-Arbestain, M.; Hedley, M. Effect of biochar on soil physical properties in two contrasting soils: An Alfisol and an Andisol. Geoderma 2013, 209, 188–197. [Google Scholar] [CrossRef]
  54. Lu, W.; Ding, W.; Zhang, J.; Li, Y.; Luo, J.; Bolan, N.; Xie, Z. Biochar suppressed the decomposition of organic carbon in a cultivated sandy loam soil: A negative priming effect. Soil Biol. Biochem. 2014, 76, 12–21. [Google Scholar] [CrossRef]
  55. Bird, M.; Wurster, C.; Silva, P.; Bass, A.; Nys, R. Algal biochar–production and properties. Bioresour. Technol. 2011, 102, 1886–1891. [Google Scholar] [CrossRef] [PubMed]
  56. Arthur, E.; Tuller, M.; Moldrup, P.; De Jonge, L.W. Effects of biochar and manure amendments on water vapor sorption in a sandy loam soil. Geoderma 2015, 243, 175–182. [Google Scholar] [CrossRef]
  57. Jeffery, S.; Verheijen, F.; Velde, M.; Bastos, A.C. A quantitative review of the effects of biochar application to soils on crop productivity using meta-analysis. Agric. Ecosyst. Environ. 2011, 144, 175–187. [Google Scholar] [CrossRef]
  58. Cornelissen, G.; Martinsen, V.; Shitumbanuma, V.; Alling, V.; Breedveld, G.; Rutherford, D.; Sparrevik, M.; Hale, S.; Obia, A.; Mulder, J. Biochar effect on maize yield and soil characteristics in five conservation farming sites in Zambia. Agronomy 2013, 3, 256–274. [Google Scholar] [CrossRef] [Green Version]
  59. Githinji, L. Effect of biochar application rate on soil physical and hydraulic properties of a sandy loam. Arch. Agron. Soil Sci. 2014, 60, 457–470. [Google Scholar] [CrossRef]
  60. Castellini, M.; Giglio, L.; Niedda, M.; Palumbo, A.; Ventrella, D. Impact of biochar addition on the physical and hydraulic properties of a clay soil. Soil Tillage Res. 2015, 154, 1–13. [Google Scholar] [CrossRef]
  61. Barrow, C.J. Biochar: Potential for countering land degradation and for improving agriculture. Appl. Geogr. 2012, 34, 21–28. [Google Scholar] [CrossRef]
  62. Koide, R.T.; Nguyen, B.T.; Skinner, R.H.; Dell, C.J.; Peoples, M.S.; Adler, P.R.; Drohan, P.J. Biochar amendment of soil improves resilience to climate change. GCB Bioenergy 2015, 7, 1084–1091. [Google Scholar] [CrossRef]
  63. Obia, A.; Mulder, J.; Martinsen, V.; Cornelissen, G.; Børresen, T. In situ effects of biochar on aggregation, water retention and porosity in light-textured tropical soils. Soil Tillage Res. 2016, 155, 35–44. [Google Scholar] [CrossRef]
  64. Vitkova, J.; Surda, P.; Plant, E.K.; Kondrlova, E.; Horak, J.; Rodny, M. Analysis of soil water content and crop yield after biochar application in field conditions. Plant, Soil Environ. 2017, 63, 569–573. [Google Scholar]
  65. CBaronti, S.; Vaccari, F.; Miglietta, F.; Calzolari, C.; Lugato, E.; Orlandini, S.; Pini, R.; Zulian, C.; Genesioac, L. Impact of biochar application on plant water relations in Vitis vinifera (L.). Eur. J. Agron. 2014, 53, 38–44. [Google Scholar] [CrossRef]
  66. Lehmann, J.; Rillig, M.C.; Thies, J.; Masiello, C.A.; Hockaday, W.C.; Crowley, D. Biochar effects on soil biota—A review. Soil Biol. Biochem. 2011, 43, 1812–1836. [Google Scholar] [CrossRef]
  67. Quilliam, R.S.; Glanville, H.C.; Wade, S.C.; Jones, D.L. Life in the ‘charosphere’–Does biochar in agricultural soil provide a significant habitat for microorganisms? Soil Biol. Biochem. 2013, 65, 287–293. [Google Scholar] [CrossRef]
  68. Ye, J.; Joseph, S.D.; Ji, M.; Nielsen, S.; Mitchell, D.R.G.; Donne, S.; Horvat, J.; Wang, J.; Munroe, P.; Thomas, T. Chemolithotrophic processes in the bacterial communities on the surface of mineral-enriched biochars. ISME J. 2017, 11, 1087–1101. [Google Scholar] [CrossRef] [PubMed]
  69. Awad, Y.M.; Ok, Y.S.; Abrigata, J.; Beiyuan, J.; Beckers, F.; Tsang, D.C.W.; Rinklebe, J. Pine sawdust biomass and biochars at different pyrolysis temperatures change soil redox processes. Sci. Total Environ. 2018, 625, 147–154. [Google Scholar] [CrossRef] [PubMed]
  70. Rutigliano, F.A.; Romano, M.; Marzaioli, R.; Baglivo, I.; Baronti, S.; Miglietta, F.; Castaldi, S. Effect of biochar addition on soil microbial community in a wheat crop. Eur. J. Soil Biol. 2014, 60, 9–15. [Google Scholar] [CrossRef]
  71. Hairani, A.; Osaki, M.; Watanabe, T. Effect of biochar application on mineral and microbial properties of soils growing different plant species. Soil Sci. Plant Nutr. 2016, 62, 519–525. [Google Scholar] [CrossRef] [Green Version]
  72. Singh, C.; Tiwari, S.; Gupta, V.K.; Singh, J.S. The effect of rice husk biochar on soil nutrient status, microbial biomass and paddy productivity of nutrient poor agriculture soils. CATENA 2018, 171, 485–493. [Google Scholar] [CrossRef]
  73. Futa, B.; Oleszczuk, P.; Andruszczak, S.; Kwiecińska-Poppe, E.; Kraska, P. Effect of Natural Aging of Biochar on Soil Enzymatic Activity and Physicochemical Properties in Long-Term Field Experiment. Agronomy 2020, 10, 449. [Google Scholar] [CrossRef] [Green Version]
  74. Ameloot, N.; De Neve, S.; Jegajeevagan, K.; Yildiz, G.; Buchan, D.; Funkuin, Y.N.; Prins, W.; Bouckaert, L.; Sleutel, S. Short-term CO2 and N2O emissions and microbial properties of biochar amended sandy loam soils. Soil Biol. Biochem. 2013, 57, 401–410. [Google Scholar] [CrossRef]
  75. Lehmann, J.; Joseph, S. Biochar for Environmental Management: Science, Technology and Implementation; Routledge: Abingdon, UK, 2021; ISBN 9780367779184. [Google Scholar]
  76. Kavitha, B.; Reddy, P.V.L.; Kim, B.; Lee, S.S.; Pandey, S.K.; Kim, K.H. Benefits and limitations of biochar amendment in agricultural soils: A review. J. Environ. Manag. 2018, 227, 146–154. [Google Scholar] [CrossRef]
  77. Hussain, A.; Ali, S.; Rizwan, M.; Zia ur Rehman, M.; Javed, M.R.; Imran, M.; Chatha, S.A.S.; Nazir, R. Zinc oxide nanoparticles alter the wheat physiological response and reduce the cadmium uptake by plants. Environ. Pollut. 2018, 242, 1518–1526. [Google Scholar] [CrossRef] [PubMed]
  78. Nannipieri, P.; Greco, S.; Ceccanti, B. Ecological Significance of the Biological Activity in Soil. Soil Biochem. 2017, 64, 293–356. [Google Scholar]
  79. Monografie, R. Methods of determination of photosphatase activity. Acta Agrophysica Rozpr. I Monogr. 2005, 3, 63–74. [Google Scholar]
  80. Gregorich, E.G.; Carter, M.R.; Angers, D.A.; Monreal, C.M.; Ellert, B.H. Towards a minimum data set to assess soil organic matter quality in agricultural soils. Can. J. Soil Sci. 1994, 74, 367–385. [Google Scholar] [CrossRef] [Green Version]
  81. Gong, X.; Huang, D.; Liu, Y.; Zeng, G.; Chen, S.; Wang, R.; Xu, P.; Cheng, M.; Zhang, C.; Xue, W. Biochar facilitated the phytoremediation of cadmium contaminated sediments: Metal behavior, plant toxicity, and microbial activity. Sci. Total Environ. 2019, 666, 1126–1133. [Google Scholar] [CrossRef]
  82. Zimmerman, A.; Gao, B.; MY, A. Positive and negative carbon mineralization priming effects among a variety of biochar-amended soils. Soil Biol. Biochem. 2011, 43, 1169–1179. [Google Scholar] [CrossRef]
  83. Smith, J.; Collins, H.; Bailey, V. The effect of young biochar on soil respiration. Soil Biol. Biochem. 2010, 42, 2345–2347. [Google Scholar] [CrossRef]
  84. Bailey, V.; Fansler, S.; Smith, J.; Bolthon, H. Reconciling apparent variability in effects of biochar amendment on soil enzyme activities by assay optimization. Soil Biol. Biochem. 2011, 43, 296–301. [Google Scholar] [CrossRef]
  85. Ouyang, L.; Tang, Q.; Yu, L.; Zhang, L. Effects of amendment of different biochars on soil enzyme activities related to carbon mineralisation. Soil Res. 2014, 52, 706–716. [Google Scholar] [CrossRef]
  86. Abrishamkesh, S.; Gorji, M.; Asadi, H.; Bagheri-Marandi, G.; Pourbabaee, A. Effects of rice husk biochar application on the properties of alkaline soil and lentil growth. Plant Soil Environ. 2015, 61, 475–482. [Google Scholar] [CrossRef] [Green Version]
  87. Kraska, P.; Oleszczuk, P.; Andruszczak, S.; Kwiecińska-Poppe, E.; Różyło, K.; Pałys, E.; Gierasimiuk, P.; Michałojć, Z. Effect of various biochar rates on winter rye yield and the concentration of available nutrients in the soil. Plant Soil Environ. 2016, 62, 483–489. [Google Scholar] [CrossRef] [Green Version]
  88. Agegnehu, G.; Bass, A.M.; Nelson, P.N.; Bird, M.I. Benefits of biochar, compost and biochar–compost for soil quality, maize yield and greenhouse gas emissions in a tropical agricultural soil. Sci. Total Environ. 2016, 543, 295–306. [Google Scholar] [CrossRef] [PubMed]
  89. Cross, A.; Zwart, K.; Shackley, S.; Ruysschaert, G. The role of biochar in agricultural soils. Biochar Eur. Soils Agric. Sci. Pract. 2016, 26, 73–98. [Google Scholar]
  90. EW, B.; Hauggaard-Nielsen, H.; Ibrahim, N.; Egsgaard, H.; Ambus, P.; Jensen, P.; Dam-Johansen, K. Influence of fast pyrolysis temperature on biochar labile fraction and short-term carbon loss in a loamy soil. Biomass Bioenergy 2011, 35, 1182–1189. [Google Scholar]
Figure 1. Characterization of corn cob biochar samples pyrolyzed at 300 °C and 400 °C. (a) SEM analysis of biochar pyrolyzed at 300 °C, (b) SEM analysis of biochar pyrolyzed at 400 °C, (c) TEM analysis of biochar pyrolyzed at 300 °C, (d) TEM analysis of biochar pyrolyzed at 400 °C, (e) EDS analysis of biochar pyrolyzed at 300 °C, (f) EDS analysis of biochar pyrolyzed at 400 °C.
Agronomy 11 02300 g001
Figure 2. The effect of biochar on soil (a) acid phosphatase activity, (b) alkaline phosphatase activity, (c) β-glucosidase activity, and (d) organic carbon under drought stress. Data with different letters are considered significantly different (p ≤ 0.05).
Agronomy 11 02300 g002
Figure 3. The effect of biochar on (a) carbon lability, (b) lability index, (c) carbon pool index, and (d) carbon management index under drought stress. Data with different letters are considered significantly different (p ≤ 0.05).
Agronomy 11 02300 g003
Table 2. The effect of biochar on root and shoot length of maize under drought stress.
TreatmentsShoot Length (cm)Root Length (cm)
100% FC70% FC40% FC100% FC70% FC40% FC
Control93.05 ± 1.73 a–c71.37 ± 5.03 ef52.24 ± 2.40 g51.17 ± 1.53 de59.42 ± 0.88 ab57.02 ± 1.20 a–d
Temperature 300 °C Biochar 1%104.10 ± 3.21 a86.33 ± 2.96 cd63.03 ± 1.45 fg54.06 ± 0.88 b–e56.38 ± 1.20 b–d52.12 ± 0.88 c–e
Biochar 3%102.31 ± 2.60 ab92.13 ± 1.45 a–c72.35 ± 1.73 ef54.11 ± 1.00 b–e58.14 ± 1.00 ab51.35 ± 1.20 de
Temperature 400 °C Biochar 1%100.03 ± 0.88 a–c89.00 ± 1.53 b–d67.01 ± 2.96 ef54.40 ± 1.76 b–e56.33 ± 1.15 a–d49.27 ± 0.67 e
Biochar 3%96.42 ± 2.19 a–c96.40 ± 0.88 a–c78.41 ± 0.58 de53.25 ± 1.20 b–e62.20 ± 0.58 a53.35 ± 1.00 b–e
Data are the means of three replications ± Standard Error (SE). Means sharing similar letters for each parameter (shoot length and root length) are not significantly different at p ≤ 0.05.
Table 3. The effect of biochar on electrolyte leakage, relative water content, MDA content and APx activity in maize plants under drought stress.
TreatmentsElectrolyte Leakage (%)Relative Water Content (%)
100% FC70% FC40% FC100% FC70% FC40% FC
Control5.32 ± 0.35 h8.15 ± 0.34 cd11.80 ± 0.25 a66.22 ± 0.85b51.01 ± 0.64 ef39.00 ± 0.75 h
Temperature 300 °CBiochar 1%4.77 ± 0.22 h7.35 ± 0.20 de10.02 ± 0.32 b69.03 ± 0.90ab57.02 ± 0.95 cd46.12 ± 1.02 g
Biochar 3%4.87 ± 0.18 h6.67 ± 0.12 e–g8.31 ± 0.16 cd71.00 ± 0.32 ab66.18 ± 0.46 b55.35 ± 1.45 de
Temperature 400 °CBiochar 1%4.80 ± 0.20 h7.04 ± 0.27 d–f9.21 ± 0.21 bc70.10 ± 0.90ab59.25 ± 0.69 c47.00 ± 0.90 fg
Biochar 3%5.72 ± 0.21 gh5.90 ± 0.15 f–h7.53 ± 0.15 de71.04 ± 0.28a69.33 ± 0.72 ab59.04 ± 0.73 c
TreatmentsMDA Content µmol g−1 FWAPx nmol Ascorbate min−1 mg−1 Protein
100% FC70% FC40% FC100% FC70% FC40% FC
Control5.28 ± 0.38 fg8.25 ± 0.76 de6.76 ± 0.47 a6.24 ± 0.35 g12.1 ± 0.48 d22.23 ± 0.30 a
Temperature 300 °CBiochar 1%5.04 ± 0.48 fg7.02 ± 0.52 ef6.03 ± 0.44 ab6.00 ± 0.44 g9.85 ± 0.35 e17.00 ± 0.31 b
Biochar 3%4.86 ± 0.18 g6.36 ± 0.40 e–g5.61 ± 0.52 bc5.89 ± 0.21 g8.24 ± 0.20 e14.72 ± 0.16 c
Temperature 400 °CBiochar 1%5.16 ± 0.46 fg6.55 ± 0.39 e–g5.86 ± 0.62 bc6.15 ± 0.45 g9.01 ± 0.34 ef16.57 ± 0.27 b
Biochar 3%5.32 ± 0.15 fg5.97 ± 0.63 fg5.64 ± 0.32 cd6.19 ± 0.15 g7.01 ± 0.24 fg12.90 ± 0.34 d
Data are the means of three replications ± Standard Error (SE). Means sharing similar letters for each parameter (electrolyte leakage, relative water content, MDA content and APx activity) are not significantly different at p ≤ 0.05.
Table 4. The effect of biochar on aggregate stability, soil moisture content, soil microbial carbon and nitrogen under drought stress.
TreatmentsAggregate Stability (%)Soil Moisture Content (%)
100% FC70% FC40% FC100% FC70% FC40% FC
Control17.28 ± 1.06 b18.02 ± 1.26 b19.19 ± 1.26 b29.06 ± 0.65 ef18.37 ± 0.19 ij12.00 ± 0.31 k
Temperature 300 °C Biochar 1%28.33 ± 1.14 a29.05 ± 1.38 a30.41 ± 1.28 a36.37 ± 1.33 d23.25 ± 0.17 gh16.39 ± 0.18 j
Biochar 3%30.00 ± 1.08 a30.37 ± 1.10 a31.08 ± 1.03 a50.31 ± 0.59 b34.00 ± 0.88 d22.24 ± 0.56 hi
Temperature 400 °C Biochar 1%28.17 ± 0.98 a30.22 ± 1.61 a30.26 ± 1.68 a43.06 ± 1.15 c30.18 ± 0.33 e17.45 ± 0.31 j
Biochar 3%30.01 ± 1.05 a32.16 ± 1.16 a32.09 ± 1.01 a59.25 ± 0.99 a42.40 ± 1.00 c26.30 ± 0.58f g
TreatmentsMicrobial Biomass Carbon
(mg kg−1 Soil)
Microbial Biomass Nitrogen
(mg kg−1 Soil)
100% FC70% FC40% FC100% FC70% FC40% FC
Control223.15 ± 3.02 ab126.36 ± 5.11 ef64.45 ± 8.97 h26.22 ± 0.90 a–c15.25 ± 0.97gh7.00 ± 0.75 i
Temperature 300 °C Biochar 1%239.45 ± 3.53 a141.27 ± 5.69 ef95.18 ± 5.39 g27.45 ± 1.08 ab18.10 ± 1.04 e–g12.21 ± 1.35 h
Biochar 3%233.22 ± 3.11 a171.00 ± 4.00 cd113.22 ± 4.61 fg28.00 ± 0.59 a23.32 ± 0.88 b–d17.33 ± 0.59 fg
Temperature 400 °C Biochar 1%227.00 ± 7.03 ab144.31 ± 4.51 de96.09 ± 3.56 g27.37 ± 0.91 ab22.43 ± 0.48c–e14.01 ±0.73 gh
Biochar 3%220.06 ± 6.05 ab197.01 ± 6.52 bc141.31 ± 6.11 ef26.01 ± 0.76a–c24.21 ± 0.41a–d20.40 ± 0.64 d–f
Data are the means of three replications ± Standard Error (SE). Means sharing similar letters for each parameter (aggregate stability, soil moisture content, microbial biomass carbon and microbial biomass nitrogen) are not significantly different at p ≤ 0.05.
Publisher’s Note: MDPI stays neutral with regard to jurisdictional claims in published maps and institutional affiliations.

