Article

DiaMOS Plant: A Dataset for Diagnosis and Monitoring Plant Disease

by
Gianni Fenu
and
Francesca Maridina Malloci
*
Department of Mathematics and Computer Science, University of Cagliari, Via Ospedale 72, 09124 Cagliari, Italy
*
Author to whom correspondence should be addressed.
Agronomy 2021, 11(11), 2107; https://doi.org/10.3390/agronomy11112107
Submission received: 6 September 2021 / Revised: 15 October 2021 / Accepted: 18 October 2021 / Published: 21 October 2021
(This article belongs to the Special Issue Imaging Technology for Detecting Crops and Agricultural Products)

Abstract

:
The classification and recognition of foliar diseases is an increasingly developing field of research, where the concepts of machine and deep learning are used to support agricultural stakeholders. Datasets are the fuel for the development of these technologies. In this paper, we release and make publicly available the field dataset collected to diagnose and monitor plant symptoms, called DiaMOS Plant, consisting of 3505 images of pear fruit and leaves affected by four diseases. In addition, we perform a comparative analysis of existing literature datasets designed for the classification and recognition of leaf diseases, highlighting the main features that maximize the value and information content of the collected data. This study provides guidelines that will be useful to the research community in the context of the selection and construction of datasets.

1. Introduction

The direct visual analysis of leaves provides valuable information on plant health. Leaf symptoms are the first warning signs of many diseases, infections, parasites and deficiencies that occur during the development and life cycle of the plant. Biotic and abiotic stresses represent the main factors limiting agricultural productivity, possibly causing huge production losses.
Economic–environmental issues that are attracting increasing attention and becoming hotspots in research [1] are the intensifying pressure from climate change and the estimated increase in the global population of 70% by 2050, which will increase food demand [2]. These challenges may find their solutions in innovation and the development of sustainable cultivation practices that make efficient use of available resources.
The promotion of qualitatively and quantitatively sustainable actions is made possible by the adoption of recent information and communication technologies—so-called ICT. The use of proximity sensors in the field of operational IT tools is capable of assisting farmers in cultivation practices. Mobile and robotic applications are enabling solutions for the digital innovation processes needed to safeguard the planet by assisting in monitoring and treatment operations. The integration of Artificial Intelligence [3,4] in these systems is indispensable to support the operator in making informed and thoughtful decisions on the real state of the vigor of a plant. These tools are able to support stakeholders in both early prediction and diagnosis by recognizing symptoms that are visible to the naked eye. In the first task, the models are categorized into three categories [1]: (i) forecast models based on weather data; (ii) forecast models based on image processing; and (iii) forecast models based on distinct types of data coming from various heterogeneous sources. The second task, diagnosis, is mainly performed by processing RGB, multispectral or remote sensing images. In this context, Computer Vision [5] finds a relevant application; by using appropriate networks trained on image samples, it can detect, recognize and identify situations of crop risk and identify the various stages of fruit growth, which is useful for mechanical harvesting. Recent literature has addressed the problem by training single-output or multi-output convolutional neural networks [5]—an approach known as multitask learning.
The accuracy and reliability of integrated artificial intelligence systems is greatly influenced by the representativeness and completeness of the dataset used in training the algorithm. The development of intelligent neural networks needs large quantities of data to be able to learn, from known examples, the essential knowledge to obtain the greater generalizability of the model. However, the realization of a dataset is not a simple and immediate task due to the efforts and costs required, which include the acquisition, annotation and categorization of the images, which often must be carried out by professional figures that are expert in the sector. The availability of datasets in Digital Agriculture (DA) has become a well-known problem in the literature, slowing down scientific progress [6].
In recent years, several efforts have been made in the context of data collection. Several datasets have been introduced. The best known in this field is PlantVillage [7], which consists of 54,000 images portrayed on the ventral side of the leaf on a homogeneous background. However, as observed in the literature [8], these configurations are not sufficiently representative for the objectives of the final application. The datasets created under controlled conditions—i.e., depicting the leaf on a homogeneous background—do not realistically reproduce the possible environmental conditions in which the model will operate.
In this context, the contribution of this paper is articulated on two levels. We introduce a new dataset in the literature for the diagnosis and monitoring of plant symptoms, called DiaMOS Plant. It is a dataset collected under realistic field conditions, composed of 3505 images depicting 4 leaf stresses and 3 stages of fruit development: fruit set, growth and ripening. We conduct a survey dedicated to public image datasets built for the classification and identification of leaf diseases. We focus on datasets released in open format on data sharing platforms. Therefore, we do not deal with datasets released on request to the authors. The development and release of publicly available datasets has a twofold advantage: it allows researchers to save time and resources and devote more effort to the objective evaluation and comparison of algorithms. A research work was conducted for various tasks related to computer vision in the context of precision agriculture [9]. This survey seeks to cover the lack of a complete description for this particular sub-field. We believe that this survey will be a useful resource to guide the insightful selection of datasets for future research.
The rest of the paper is organized as follows. Section 2 describes the proposed DiaMOS Plant dataset and summarizes the characteristics of the publicly available image datasets. Section 3 provides a comparative analysis of the examined datasets. Section 4 provides some recommendations on requirements for the future creation of datasets, and a brief conclusion is drawn.

2. DiaMOS Plant Dataset

In this section, we describe the proposed dataset in detail.
Description. In this work, we introduce a field dataset to diagnose and monitor plant symptoms called DiaMOS Plant—an extended dataset analyzed in [5]. DiaMOS Plant is a pilot dataset containing images of an entire growing season of a pear tree, from February to July, in order to build a representative sample that covers the main cultural aspects of this plant. The dataset is suitable for performing machine and deep learning methods in classification and detection tasks. A total of 3505 images were collected, including 499 fruit images and 3006 leaves images, respectively. The fruit is portrayed in the following four phases: fruit set, nut fruit, fruit growth and ripening. Similarly, biotic and abiotic stresses fall into four categories: leaf spot, leaf curl, slug damage and healthy leaf. A detailed summary is provided in Table 1 and Table 2.
The images belong to three trees that are in the same plot located in Italy. Pictures were gathered using different devices including a smartphone (Honor 6×) and DSRL camera (Canon EOS 60D); thus, the images present two type of resolutions, at 2976 × 3968 and 3456 × 5184 respectively. Table 3 reports the set-up of each device. We employed two different devices because many people were involved in collecting data and it was not feasible for them to have the same devices. Furthermore, the different resolution increases the complexity of the dataset and represents an added value for it. The choice of using multiple devices is a widely used approach in this field of literature as it allows heterogeneous and representative inputs to be provided to the models. In the real scenario, agricultural and non-agricultural operators have smartphones that differ in terms of their technical characteristics, including resolution.
The leaves were captured from the adaxial (upper) side of the leaf, in a real-life scenario, where they were shot in various lighting (cloudy, sunny and windy days), angle, background (other plants and weeds) and noise conditions, at different times of the day throughout the entire growing season. This acquisition protocol made it possible to obtain numerous advantages, such as (i) capturing leaves under realistic lighting conditions, which can be classified as (a) indirect sunlight, (b) direct sunlight, (c) strong reflection and (d) evenly distributed light (see Figure 1); (ii) capturing the evolution of visual symptoms and (iii) capturing the fruit from the fruit set phase to the ripening phase.
The disease recognition process for dataset labeling was assisted by an expert. The dataset was annotated manually using the LabelImg software (available at the following link: https://github.com/tzutalin/labelImg, accessed on 17 October 2021). Each original image of the entire leaf is labeled with the predominant disease. For healthy, leaf spot and slug damage classes, a severity level is assigned, where each level is set according to the percentage of affected leaf area. The stress severity was calculated, identifying five classes expressed as no risk (0%), very low (1–5%), low (6–20%), medium (21–25%) and high (>50%) in a range from 0 to 4 (see Table 2. The annotated labels are released in a csv format, while the bounding boxes are released in YOLO format. The dataset is freely available for academic purposes from a repository at https://doi.org/10.5281/zenodo.5557313 (accessed on 17 October 2021), where the folder has the following structure:
Agronomy 11 02107 i001
  • Description contains the data description;
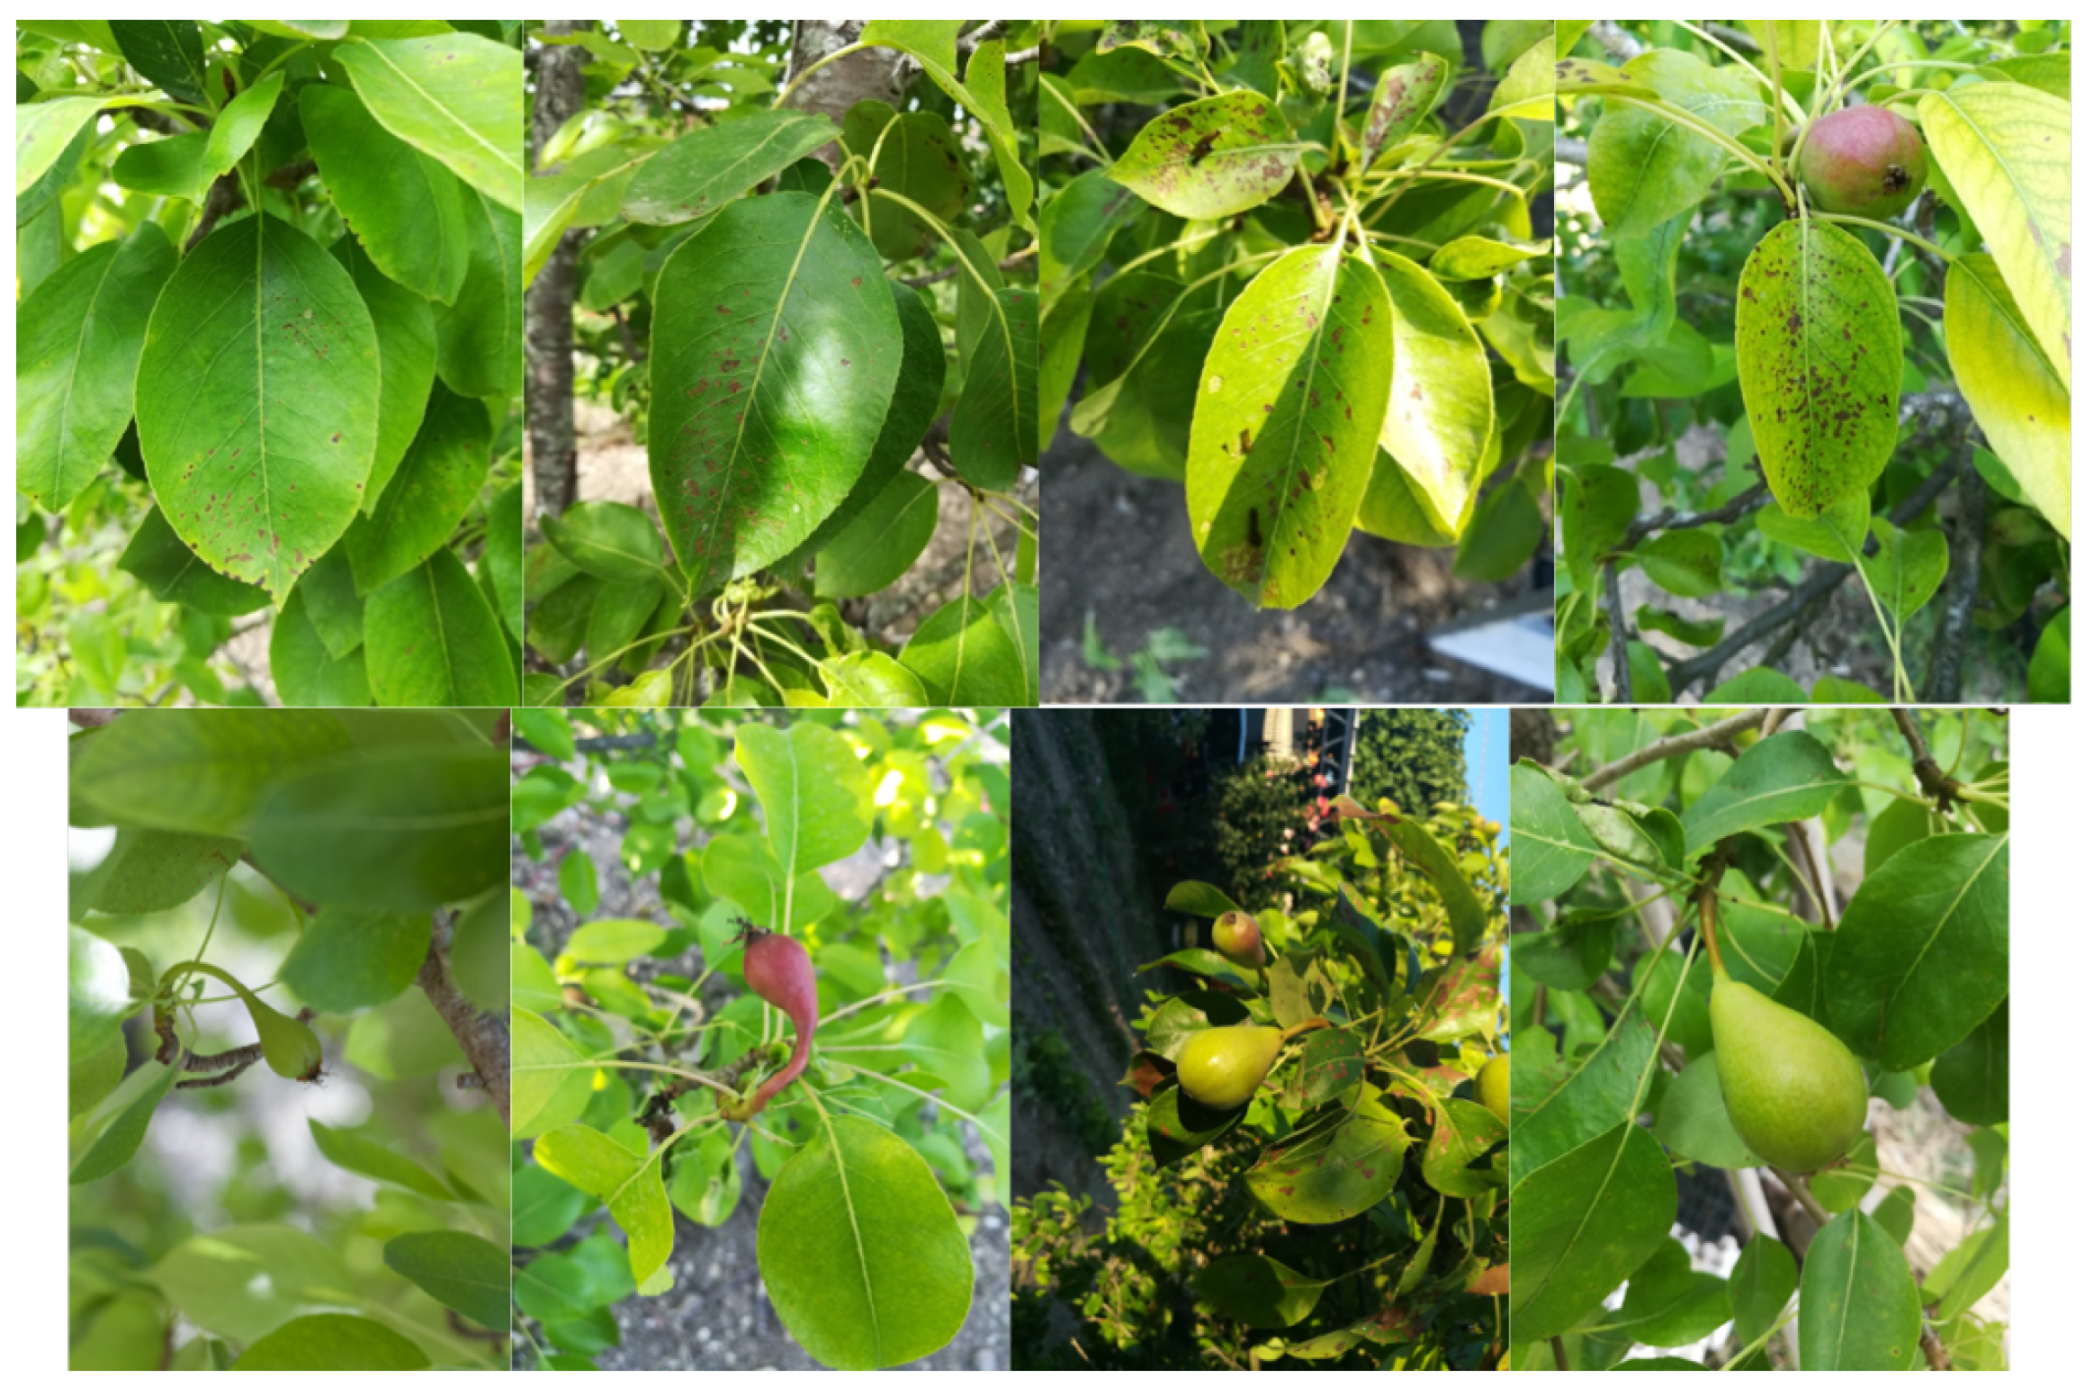
  • Pear contains the data related to the pear tree;
  • Annotation contains the annotation files;
  • Leaves contains the leaf images;
  • Fruits contains the fruit images.
News regarding dataset updates will be posted on the following site https://francescamalloci.com/category/projects/, accessed on 17 October 2021, as we plan to continue to extend the dataset with additional fruit plants.
Benchmark dataset. In this section, we provide a benchmark dataset with the aim of providing a baseline for the classification task. In this regard, we compared the performances of five well-known convolutional neural network architectures—VGG19, ResNet50, InceptionV3, MobileNetV2 and EfficientNetB0—as they are widely adopted in different classification tasks and have shown good generalization skills in the literature under review.
The experiment described here was conducted with the LeafBox toolbox developed and released in an open format, more purely for educational purposes and intended to facilitate the reproduction of our results and further research in this direction. It can be reached at the following link: https://github.com/mallociFrancesca/leaf-disease-toolbox.git (accessed on 17 October 2021). The experimental framework written in Python language exploits the Keras deep learning 2.4.3 library based on TensorFlow 2.2.1 environment, executed on a server machine with a 3.000 GHz Intel Xeon Gold, and 64 Gb of memory [5].
The classification task involved four ground truths: “healthy”, “slug”, “curl” and “spot”. The dataset was divided into training, validation and test datasets with a ratio of 7:2:1, respectively. To preserve the percentage of samples for each class, the dataset was split using the ShuffleSplit strategy provided by the scikit-learn 0.23.2 library. All images were resized to 224 × 224 × 3. In the training phase, to better manage the unbalance of the classes and minimize overfitting situations, the augmentation technique was applied, including horizontal and vertical mirroring, rotation and color variation. To avoid a long training time, the transfer learning method was applied. The training was performed by adapting CNN networks trained using the ImageNet dataset [10] with a cross-entropy function. Furthermore, we monitored the model’s validation loss to reduce the learning rate when it stopped improving to avoid the plateau phenomenon. A learning-rate of 2 × 10 5 and a momentum of 0.9 were set. The settings were identified by carrying out various tests, and on the basis of the results, the settings were chosen that allowed us to obtain models that were more robust and less affected by overfitting problems. The test was repeated twice to record the model’s performance with the RMSprop optimizer and the Adam optimizer.
Table 4a shows the training, validation and test accuracy obtained with the RMSprop optimizer, while Table 4b shows the results achieved with the Adam optimizer.
Comparing Table 4a,b, we observe similar performances for both optimizers, but there is a slight improvement with the Adam optimizer. However, this improvement is at the expense of the robustness of the results. Indeed, comparing the accuracy obtained in the three data sets, there is a more marked gap in the latter.
In general, it can be seen that the three networks EfficientNetB0, InceptionV3 and MobileNetV2 have a better generalization capacity than the VGG19 and ResNet50 networks. In fact, with reference to Table 4, EfficientNetB0, InceptionV3 and MobileNetV2 obtained accuracies for the test set of 83.38%, 82.72% and 83.06% respectively, while ResNet50 achieved an accuracy of 56.67% and VGG19 achieved an accuracy of 71.76%. Comparing the scores recorded between the training, validation and test sets, it is not excluded that the models may suffer from a slight overfitting bias. All things being equal, MobileNetV2 tends to converge faster. In Table 5, the precision, recall and F1-score obtained in the test set are shown. In this case, the F1-score ratio does not show notable differences in performance, exhibiting a high value for EfficientNetB0, InceptionV3 and MobileNetV2.

3. Open Dataset for Plant Disease Classification and Detection

In this section, we provide a brief description of the datasets presented in the literature.

3.1. RoCoLe Dataset

RoCoLe is the acronym for the Robusta Coffee Leaf image dataset [11], containing 1560 leaf pictures divided into six classes: healthy, red spider mite presence, rust level 1, rust level 2, rust level 3 and rust level 4. The photos were captured from the adaxial (upper) and abaxial (lower) leaf side, under a natural uncontrolled environment, using a smartphone camera at a working distance of 200 and 300 mm without zoom. In addition, the dataset includes annotations regarding the segmentation object, processed with the web-tool called Labelbox.

3.2. BRACOL Dataset

BRACOL is a Brazilian arabica coffee leaf image dataset used for the identification and quantification of coffee diseases and pests [12]. It contains 1747 images of arabica coffee leaves affected by the following biotic stresses: leaf miner, leaf rust, brown leaf spot and cercospora leaf spot. The images were collected at different times of the year in Santa Maria of Marechal Floreano in the mountain regions of the state of Espirito Santo, Brazil. Obtained using five different smartphones, the leaves were depicted from the abaxial (lower) side under partially controlled conditions and placed on a white background. The acquisition of the images was conducted without much criteria to make the dataset more heterogeneous. The process of biotic stress recognition for dataset labeling was assisted by an expert.

3.3. Rice Leaf Disease Dataset

The Rice Leaf dataset [13] consists of 120 images collected from a village called Shertha near Gandhinagar, Gujarat, India, captured with a white background using a Nikon D90 digital SRL camera with 12.3 megapixels in November 2015. The authors collected leaves with varying degrees of disease spread, where all images have a resolution of 2848 × 4288 pixels.

3.4. Plant Pathology Dataset

The Plant Pathology dataset [14] is a collection of 3651 RGB images of multiple apple foliar disease symptoms captured during the 2019 growing season from commercially grown cultivars in an unsprayed apple orchard at Cornell AgriTech (Geneva, NY, USA). Of the 3651 RGB images, there are 1200 images of apple scab, 1399 of cedar apple rust, 187 of complex disease symptoms (i.e., more than one disease on the same leaf) and 865 of healthy leaves. Photos were taken using a Canon Rebel T5i DSLR and smartphones under various illumination, angle, surface and noise conditions, directly from the field. The dataset was manually annotated into three classes: cedar apple rust, apple scab, multiple diseases and healthy leaves. An expert plant pathologist confirmed the annotations.

3.5. Citrus Dataset

The Citrus dataset [15] contains 759 images of healthy and unhealthy citrus fruits and leaves, manually acquired using a DSLR with the help of a domain expert. The infected images are classified into four different diseases of citrus fruits and leaves, respectively. The diseases present in the datasets are black spot, canker, scab, greening and melanose. All images are resized to a dimension of 256 ∗ 256 with a 72 dpi resolution. The fruit images were collected directly from the plant, while leaf images were acquired under laboratory conditions with a homogeneous gray background.

3.6. APDA Dataset

The APDA dataset [16] collected by Tea Research Institute, Mansehra contains 40 images, divided into healthy and unhealthy images. The diseased subset contains samples of two types of diseases: anthracnose and black spots. Acquired with a Nikon camera D90, the leaves are depicted in indoor lighting, maintaining a constant distance of the object from the lens of approximately 9–12 inches.

3.7. PlantVillage Dataset

The Plant Village is an image-based dataset of 54,309 samples in which foliar diseases are portrayed on the ventral side of the leaf, on a homogeneous background (black or gray). For each leaf, the authors took four to seven images with a standard point-and-shoot camera, Sony DSC—Rx100/13, with 20.2 megapixels using the automatic mode. The images span 14 crop species: apple, blueberry, cherry, corn, grape, orange, peach, bell pepper, potato, raspberry, soybean, squash, strawberry and tomato. It contains images of 17 fungal diseases, 4 bacterial diseases, 2 mold (oomycete) diseases, 2 viral disease and 1 disease caused by a mite. Twelve crop species also include images of healthy leaves that are not visibly affected by a disease.

4. Comparative Analysis

In this section, we provide a comparative analysis of the examined datasets, including the proposed DiaMOS Plant dataset, organized into three sections: (i) dataset acquisition, (ii) symptoms and diseases and (iii) technical dataset settings. A summary scheme is shown in the Table 6.

4.1. Dataset Acquisistion

The place and mode of dataset acquisition influences how the algorithms learn and make predictions. In total, 62% of the datasets were collected under controlled conditions, using a mobile phone camera or DSRL camera. The remainder acquired the images directly in the field. The acquisition protocol followed by the laboratory datasets in some studies was not characterized by certain criteria; others kept both the distance of the object of interest from the camera and the lighting conditions constant, portraying the leaf in the centre of the frame on a homogeneous background—mainly white.
With regard to the field datasets, the common goal was to maximize variability by adopting different techniques. Several acquisition tools were used. The leaf portrayed directly on the plant was acquired several times with different angles and illumination scenarios. The majority of cases portrayed the leaf on the upper side, also called the adaxial side. Two exceptions are represented by BRACOL and RoCole, where RoCole portrayed both sides of the leaf (abaxial and adaxial) while BRACOL only portrayed the abaxial side.

4.2. Symptoms and Diseases

In the plant world, there are many different stressful events that can give rise to the same or very similar visual symptoms. These events can also overlap and follow each other, making it even more complicated to arrive at an accurate and reliable diagnosis of the plant’s condition [1]. Some researchers have taken into account the temporal variability in the evolution of a symptom from the first to the last stage. During a growing season, symptoms show different morphology, texture and coloration depending on the extent of the damage. For this purpose, for DiaMOS Plant, we collected images at different times of the day for an entire growing season. This approach was also followed for the Plant Pathology dataset, which further enriched the dataset by annotating the presence of several diseases on the same leaf surface. Finally, DiaMOS Plant, BRACOL and RoCole labeled four levels of severity, which is useful to train models that are able to recognize a disease at different stages.

4.3. Technical Dataset Settings

Having a large dataset greatly affects the performance of machine and deep learning models. The datasets in this field are all small-scale datasets in terms of the number of images. Figure 2 shows the graphical distribution of the examined datasets according to size. PlantVillage is a large-scale dataset. However, certain classes contain few instances. As shown in Table 6, the RGB format was adopted in all studies, and the acquisition approach involved the camera of a smartphone or DSRL. No datasets made use of drones. The acquired images can be used for the classification task, as they are appropriately annotated with labels. DiaMOS Plant, RoCole and BRACOL also feature bounding-box annotation, which allows the datasets to be used for the detection task right from the start. The most commonly used annotation format is csv. Finally, the data sharing methods were different (see Table 7. The prevailing methodology used external services. According to Lu and Young [9], this good practice allows data availability to be guaranteed over time.

5. Discussion

This analysis suggests that the most widely adopted image acquisition set-up in the state-of-the-art is based on collecting data under controlled, laboratory conditions. The analysis of current datasets has revealed some limitations including size, representativeness and completeness.
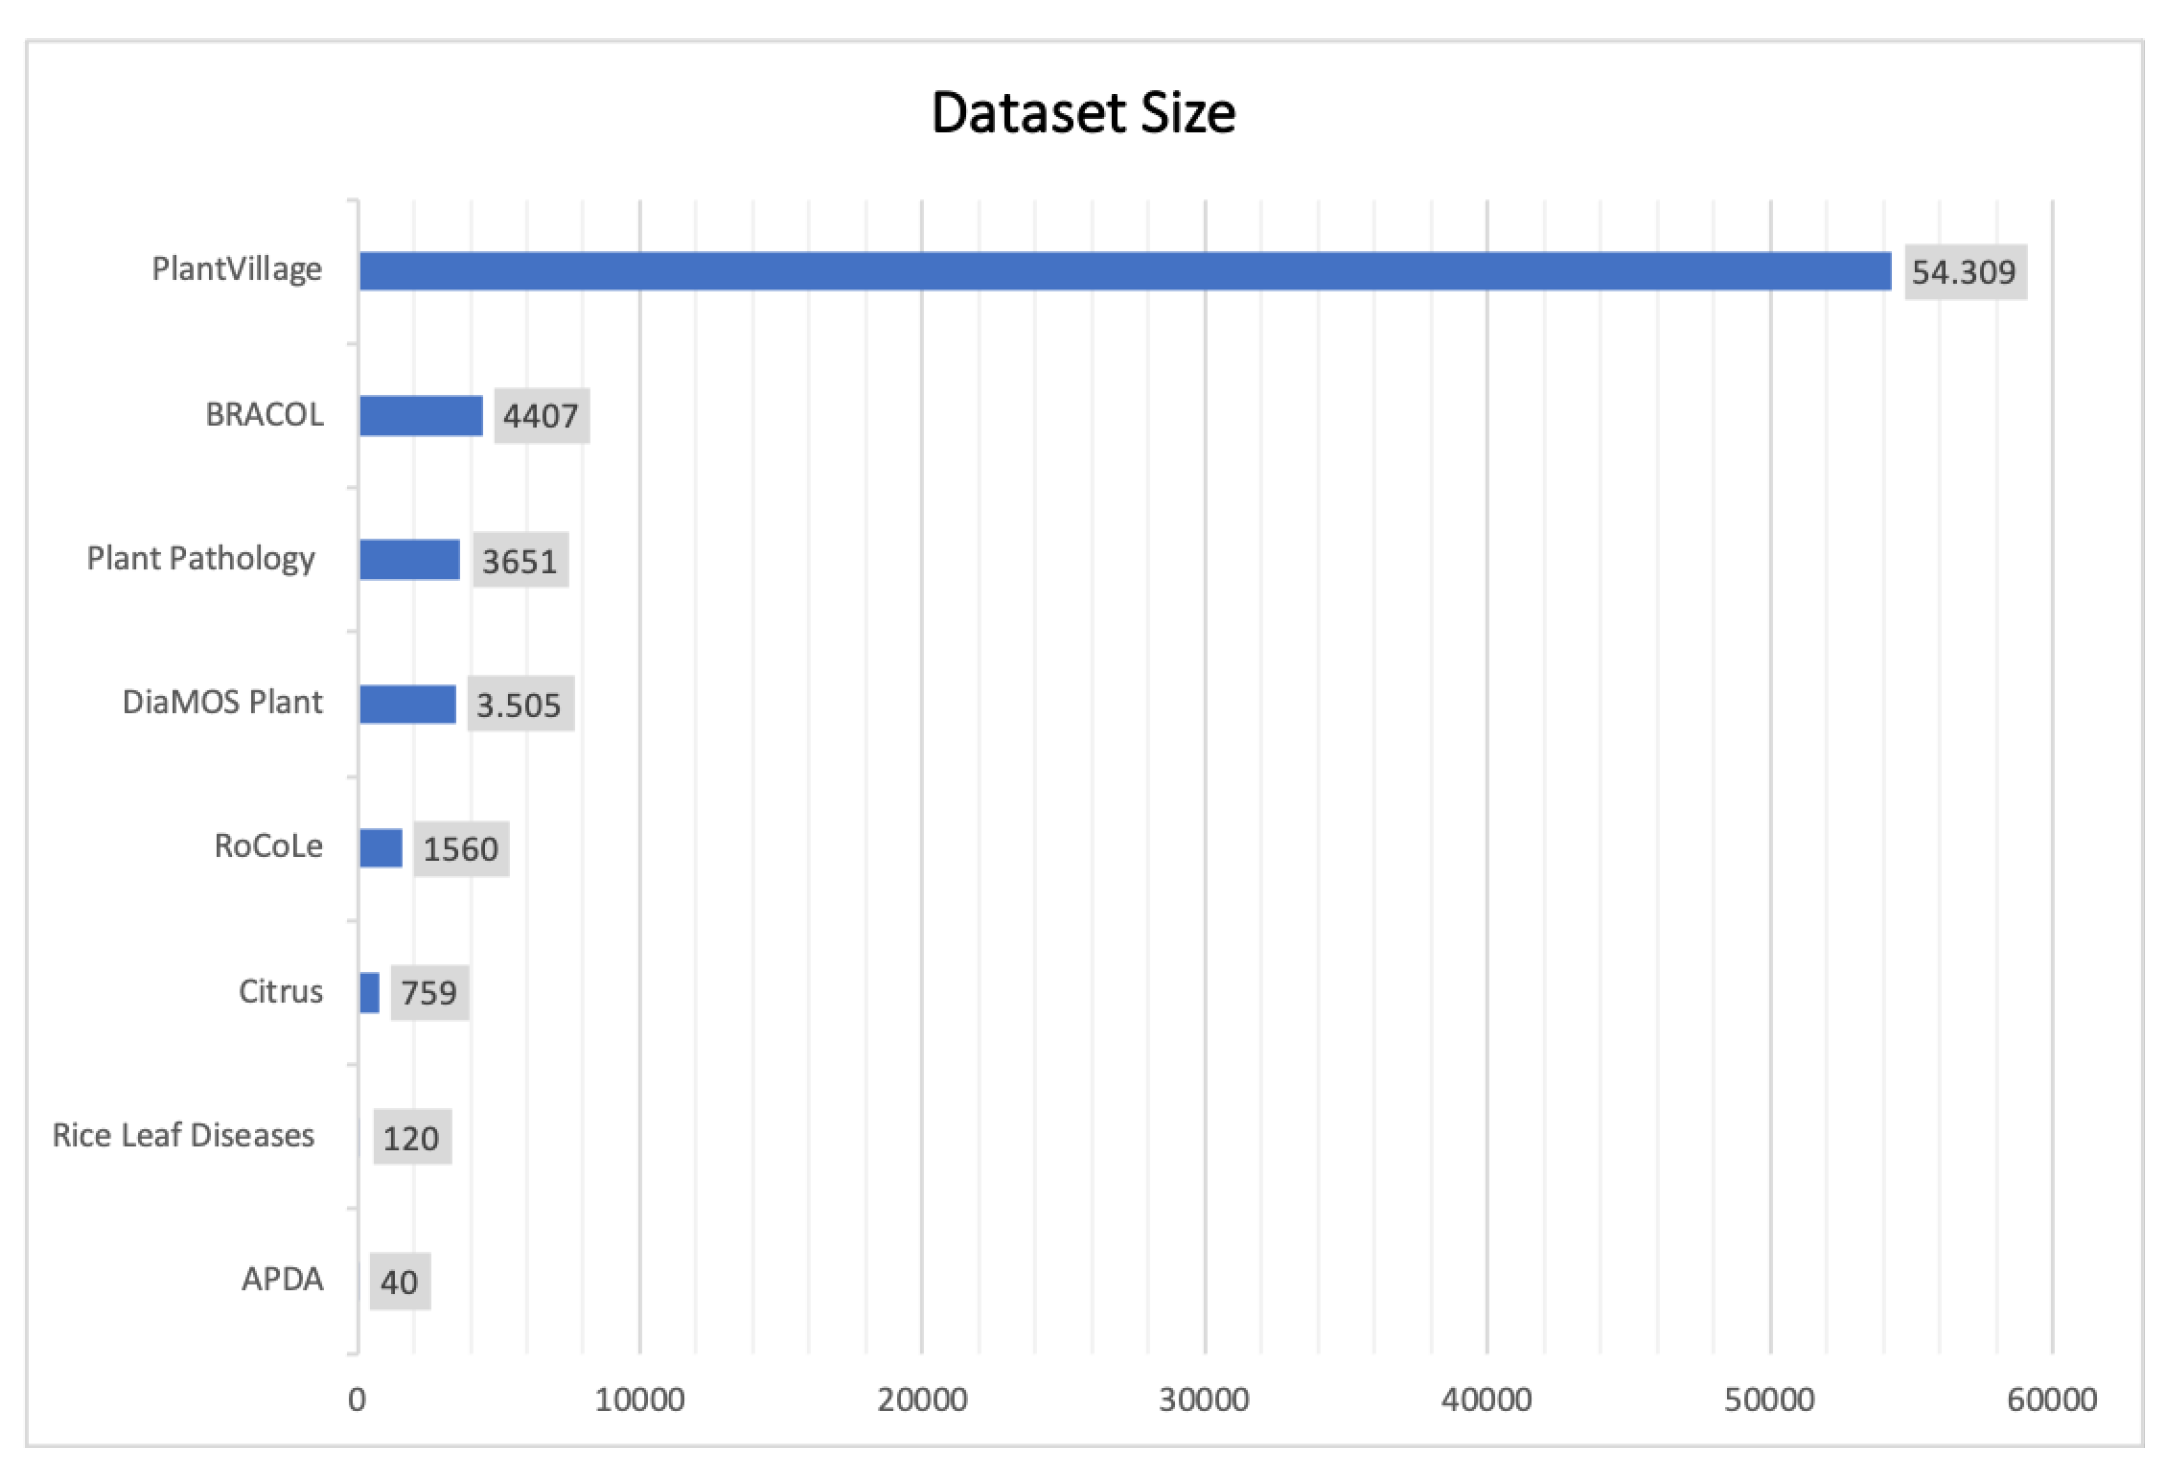
  • Dataset size: The greatest limitation of the current datasets is the small number of disease classes and the sample sizes. Even our proposed dataset, DiaMOS Plant, contains few samples for the “healthy” class. Inevitably, a strong imbalance of classes leads to the model not generalizing well in practical applications. This confirms and demonstrates, in agreement with Lu and Young [9], that although the need for larger datasets is recognized, this task is challenging due to the manual effort and cost required, which in some cases is further exacerbated as very few occurrences in the field can be found for some classes. This technical problem can be mitigated by data augmentation, transfer learning, and fine tuning techniques.
  • Representativeness: The most widely adopted acquisition protocol is based on data collection under controlled, laboratory conditions. The representativeness of the dataset is limited by two factors: the place of acquisition and mode of acquisition. Controlled conditions are not able to reflect the spectrum of variability detectable in the field. Algorithms tend to achieve near-perfect accuracy when trained on laboratory datasets, but performance degrades significantly when trained on field datasets [5]. In addition, few datasets took into account the evolution of symptoms during an entire growing season. More efforts should focus on capturing symptoms at an early stage of emergency. In fact, at these stages, digital aids are essential to take timely action to stop the disease proliferation.
  • Completeness: In Strong et al. [17], completeness is defined as “the level of breadth, depth, and appropriateness of a datum according to its purpose”. Although some datasets are well constructed, in some cases, we found a lack of completeness in providing ground truth labels. The annotation of multiple symptoms present in the leaf maximizes and completes the informative capacity of the data. Similarly, the presence of bounding-boxes and segmentation masks would extend usability.
  • Performance baseline: The availability of a performance baseline can help in the development and validation of new methods that can be applied.
Based on the limitations identified above, we provide some recommendations for creating future datasets. The number of samples and variety of diseases need to be increased so that a learning algorithm may generalize on the problem domain. Algorithms are destined for inclusion in field applications, which can be categorized as follows:
  • Disease recognition mobile applications;
  • Robotic applications that recognize and identify a disease and spray chemical or natural inputs based on the extent of the damage.
To maximize the information content that the data can express and the completeness and representativeness of the samples, we suggest portraying the leaf using different configurations, as follows:
  • Defer the angle, focus and position of the leaf in individual frames;
  • Portray the disease for an entire growing season, identifying different levels of severity;
  • Collect the samples at different times of the day—that is, with different climatic conditions (sunny, cloudy, direct light).
Finally, the dataset should be published on data sharing platforms, which allow the integrity and availability of data to be preserved over time [9].

6. Conclusions

In this paper, we released an open dataset in the literature, called DiaMOS Plant—a self-collected dataset in the field, consisting of 3505 images, depicting 4 leaf diseases with 4 level of severity and 4 fruit stages, reachable at the following link https://doi.org/10.5281/zenodo.5557313, accessed on 17 October 2021. Simultaneously with the release of the dataset, we provided a performance baseline and we reviewed the datasets present in the literature built for the classification and recognition of leaf diseases. The conducted analysis has highlighted the good practices for the construction of field data sets, impacting the information content that the data can express, as functional with regard to its ability to describe the environment from which it was drawn or observed. These factors were taken into consideration when constructing the proposed dataset. In this regard, for future works, we plan to expand the released dataset to enrich its representativeness and completeness, which currently is limited by the small number of samples for the “healthy” and “curled” classes.

Author Contributions

All authors equally contributed to this research. All authors have read and agreed to the published version of the manuscript.

Funding

This research received no external funding.

Data Availability Statement

The dataset used to support the findings of this study are available at: https://doi.org/10.5281/zenodo.5557313 (accessed on 17 October 2021). The source code is available at https://github.com/mallociFrancesca/leaf-disease-toolbox, accessed on 17 October 2021.

Acknowledgments

Francesca Maridina Malloci gratefully acknowledges the Department of Mathematics and Computer Science of the University of Cagliari for the financial support of her Ph.D. scholarship. We would like to thank the reviewers, whose valuable feedback, suggestions and comments significantly increased the overall quality of this study.

Conflicts of Interest

The authors declare no conflict of interest.

Abbreviations

The following abbreviations are used in this manuscript:
AIArtificial Intelligence
MLMachine Learning
DLDeep Learning
DADigital Agriculture
ICTInformation and Communication Technologies

References

  1. Fenu, G.; Malloci, F.M. Forecasting plant and crop disease: An explorative study on current algorithms. Big Data Cogn. Comput. 2021, 5, 2. [Google Scholar] [CrossRef]
  2. Food and Agriculture Organization of the United Nations. The State of the World’s Land and Water Resources for Food and Agriculture: Managing Systems at Risk; Rome and Earthscan: London, UK, 2011. [Google Scholar]
  3. Fenu, G.; Malloci, F.M. An application of machine learning technique in forecasting crop disease. In Proceedings of the 2019 3rd International Conference on Big Data Research, Cergy-Pontoise, France, 20–22 November 2019; pp. 76–82. [Google Scholar] [CrossRef]
  4. Fenu, G.; Malloci, F.M. Artificial intelligence technique in crop disease forecasting: A case study on potato late blight prediction. In Proceedings of the International Conference on Intelligent Decision Technologies, Split, Croatia, 17–19 June 2020; Springer: Berlin/Heidelberg, Germany, 2020; pp. 79–89. [Google Scholar] [CrossRef]
  5. Fenu, G.; Malloci, F.M. Using Multioutput Learning to Diagnose Plant Disease and Stress Severity. Complexity 2021, 2021, 6663442. [Google Scholar] [CrossRef]
  6. Kamilaris, A.; Prenafeta-Boldú, F.X. Deep learning in agriculture: A survey. Comput. Electron. Agric. 2018, 147, 70–90. [Google Scholar] [CrossRef] [Green Version]
  7. Hughes, D.; Salathé, M. An open access repository of images on plant health to enable the development of mobile disease diagnostics. arXiv 2015, arXiv:1511.08060. [Google Scholar]
  8. Barbedo, J.G.A. Plant disease identification from individual lesions and spots using deep learning. Biosyst. Eng. 2019, 180, 96–107. [Google Scholar] [CrossRef]
  9. Lu, Y.; Young, S. A survey of public datasets for computer vision tasks in precision agriculture. Comput. Electron. Agric. 2020, 178, 105760. [Google Scholar] [CrossRef]
  10. Deng, J.; Dong, W.; Socher, R.; Li, L.J.; Li, K.; Fei-Fei, L. ImageNet: A large-scale hierarchical image database. In Proceedings of the IEEE Conference on Computer Vision and Pattern Recognition, Miami, FL, USA, 20–29 June 2009; IEEE: Piscataway, NJ, USA, 2009. [Google Scholar] [CrossRef] [Green Version]
  11. Parraga-Alava, J.; Cusme, K.; Loor, A.; Santander, E. RoCoLe: A robusta coffee leaf images dataset for evaluation of machine learning based methods in plant diseases recognition. Data Brief 2019, 25, 104414. [Google Scholar] [CrossRef]
  12. Krohling, R.; Esgario, J.; Ventura, J.A. BRACOL—A Brazilian Arabica Coffee Leaf images dataset to identification and quantification of coffee diseases and pests. Mendeley Data 2019, V1. [Google Scholar] [CrossRef]
  13. Prajapati, H.B.; Shah, J.P.; Dabhi, V.K. Detection and classification of rice plant diseases. Intell. Decis. Technol. 2017, 11, 357–373. [Google Scholar] [CrossRef]
  14. Thapa, R.; Zhang, K.; Snavely, N.; Belongie, S.; Khan, A. The Plant Pathology Challenge 2020 data set to classify foliar disease of apples. Appl. Plant Sci. 2020, 8, e11390. [Google Scholar] [CrossRef] [PubMed]
  15. Rauf, H.T.; Saleem, B.A.; Lali, M.I.U.; Khan, M.A.; Sharif, M.; Bukhari, S.A.C. A citrus fruits and leaves dataset for detection and classification of citrus diseases through machine learning. Data Brief 2019, 26, 104340. [Google Scholar] [CrossRef] [PubMed]
  16. Akhtar, A.; Khanum, A.; Khan, S.A.; Shaukat, A. Automated plant disease analysis (APDA): Performance comparison of machine learning techniques. In Proceedings of the 2013 11th International Conference on Frontiers of Information Technology, Islamabad, Pakistan, 16–18 December 2013; IEEE: Piscataway, NJ, USA, 2013; pp. 60–65. [Google Scholar]
  17. Strong, D.M.; Lee, Y.W.; Wang, R.Y. Data quality in context. Commun. ACM 1997, 40, 103–110. [Google Scholar] [CrossRef]
Figure 1. On the first row, from left to the right, images of pear leaves captured under different light conditions: indirect sunlight, direct sunlight, strong sunlight reflection and distributed light. On the second row, images of pear fruit in different stages of growth.
Agronomy 11 02107 g001
Figure 2. Graphical size distribution of the examined datasets.
Agronomy 11 02107 g002
Table 1. Dataset description.
DiaMOS Plant Dataset
PlantPear
CultivarSeptoria Piricola
Data Source LocationSardegna, Italy
Type of dataRGB Images
Annotationcsv, YOLO
ROI (Region of Interest) capturedleaf, fruit
Total size3505 images (3006 leaves images + 499 fruit images)
Data Accessibilityhttps://doi.org/10.5281/zenodo.5557313
accessed on 17 October 2021
ApplicationThe images are suitable for different machine and
deep learning tasks
such as images detection and classification.
Table 2. DiaMOS Plant is a collection of 3505 images of fruits and leaves. The table illustrates the distribution of classes belonging to the leaf images.
Leaves ImagesLeaf SymptomsSize
Healthy43
Spot884
Curl54
Slug2025
Severity LevelsSize
043
1682
21139
3699
4389
Table 3. Acquisition device configurations.
Smartphone CameraDSRL Camera
Image size2976 × 39683456 × 5184
Model deviceHonor 6×Canon EOS 60D
Focal length3.83 mm50 mm
Focal ratiof/2.2f/4.5
Color spaceRGBRGB
Table 4. Accuracies obtained with RMSprop (a) and Adam (b) optimizers, respectively, in the training set, validation set and test set in the task of classifying the “healthy”, “slug”, “curl” and “spot” classes.
RMSprop (a)
CNNTrain
Acc (%)
Validation
Acc (%)
Test
Acc (%)
EfficientNetB081.1382.8283.38
InceptionV381.9679.6682.72
MobileNetV85.3881.1283.06
ResNet5068.4967.1668.44
VGG1972.4271.6873.75
Adam (b)
CNNTrain
Acc(%)
Validation
Acc (%)
Test
Acc (%)
EfficientNetB089.0286.3386.05
InceptionV384.4480.2983.39
MobileNetV287.7083.8384.05
ResNet5068.3868.4769.10
VGG1976.6676.5375.75
Table 5. Precision, recall and F1-score obtained with RMSprop (a) and Adam (b) optimizers on the test set in the task of classifying the “healthy”, “slug”, “curl” and “spot” classes.
RMSprop (a)
CNNPrecision
(%)
Recall
(%)
F1-Score
(%)
EfficientNetB081.1483.3882.23
InceptionV380.2182.7281.45
MobileNetV281.3583.0582.07
ResNet5068.2768.4356.67
VGG1970.4773.7571.76
Adam (b)
CNNPrecision
(%)
Recall
(%)
F1-Score
(%)
EfficientNetB084.4286.0485.03
InceptionV381.1483.3882.23
MobileNetV282.3784.0583.06
ResNet5066.3869.1059.51
VGG1972.7175.7474.05
Table 6. Details of examined datasets.
DatasetDiaMOSPlant [5]BRACOL [12]RoCoLe [11]Plant Pathology [14]Rice Leaf Diseases [13]Citrus [15]APDA [16]PlantVillage [7]
Plant/CropPearCoffeeCoffeeAppleRiceCitrusRoseMultiple
Dataset size3505 (3006 leaf images + 499 fruit images)440715603651120759 (609 leaf images + 150 fruit images)4054.309
No. of symptoms442335226
Acquisition deviceSmarthphone e DSRLSmartphoneSmartphoneDSLR Camera, SmartphoneDSLR cameraDSLR cameraSmartphoneSmartphone
ColorRGBRGBRGBRGBRGBRGBRGBRGB
Image resolutionMultiple2048 × 1024Multiple2048 × 13652848 × 4288256 × 256N.d.Multiple
AnnotationPolygon, LabelPolygon, LabelPolygon, LabelLabelLabelLabelLabelLabel
Annotation formatcsv, YOLOcsvcsv, COCO, JSON, Pascal VOCcsvFolder structureFolder structureN.d.Folder structure
Data sharing platformZenodoGitHubMendeley DataKaggleUCI Machine Learning RepositoryMendeley DataMathWorksGithub
Acquisition placeFieldLaboratoryFieldFieldLaboratoryLaboratoryLaboratoryLaboratory
Side of the leafAdaxialAbaxialAdaxial, AbaxialAdaxialAdaxialAdaxialAdaxialAdaxial
Object of interestFruit, leafLeafLeafLeafLeafFruit, leafLeafLeaf
Table 7. Public image datasets with the related on-line repository.
Publisher’s Note: MDPI stays neutral with regard to jurisdictional claims in published maps and institutional affiliations.

