Remote Sensing for Precision Agriculture: Sentinel-2 Improved Features and Applications


Abstract
: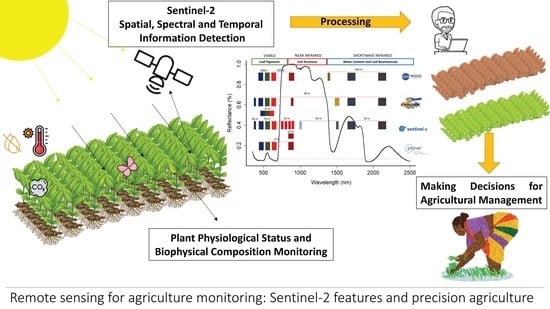
1. Introduction
2. Remote Sensing for Agriculture
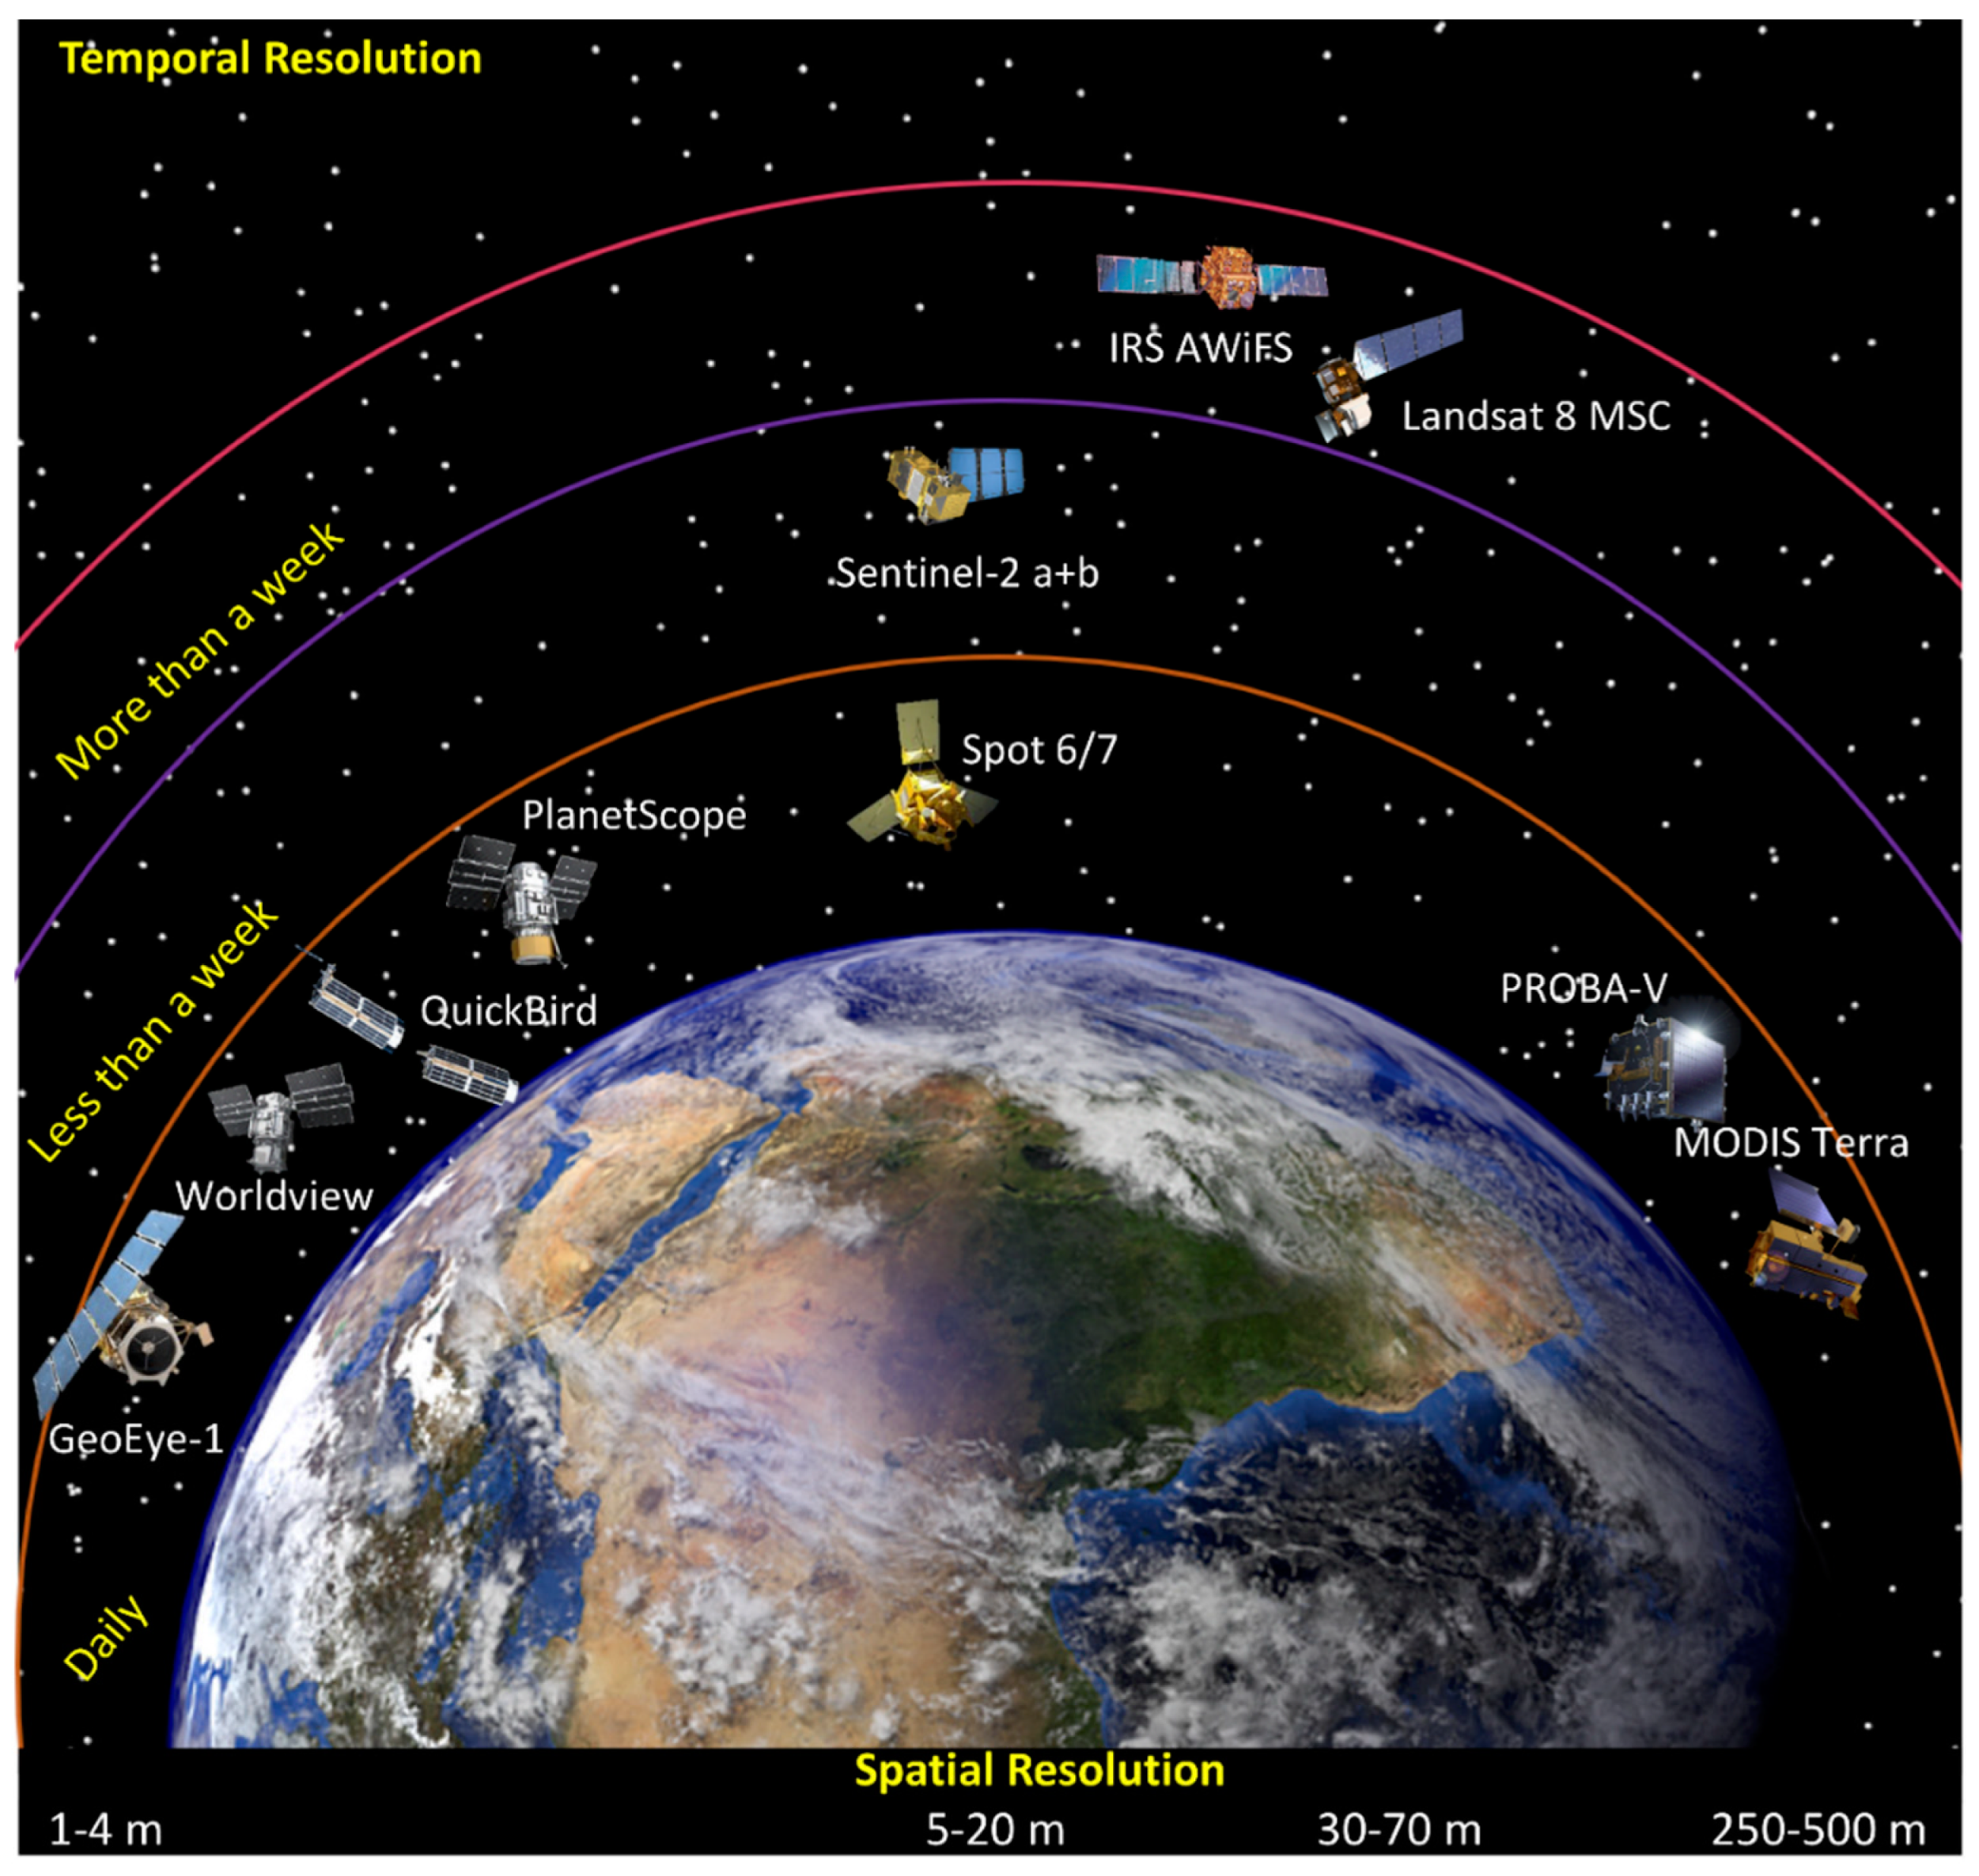
2.1. Plant Spectral Reflectance Properties
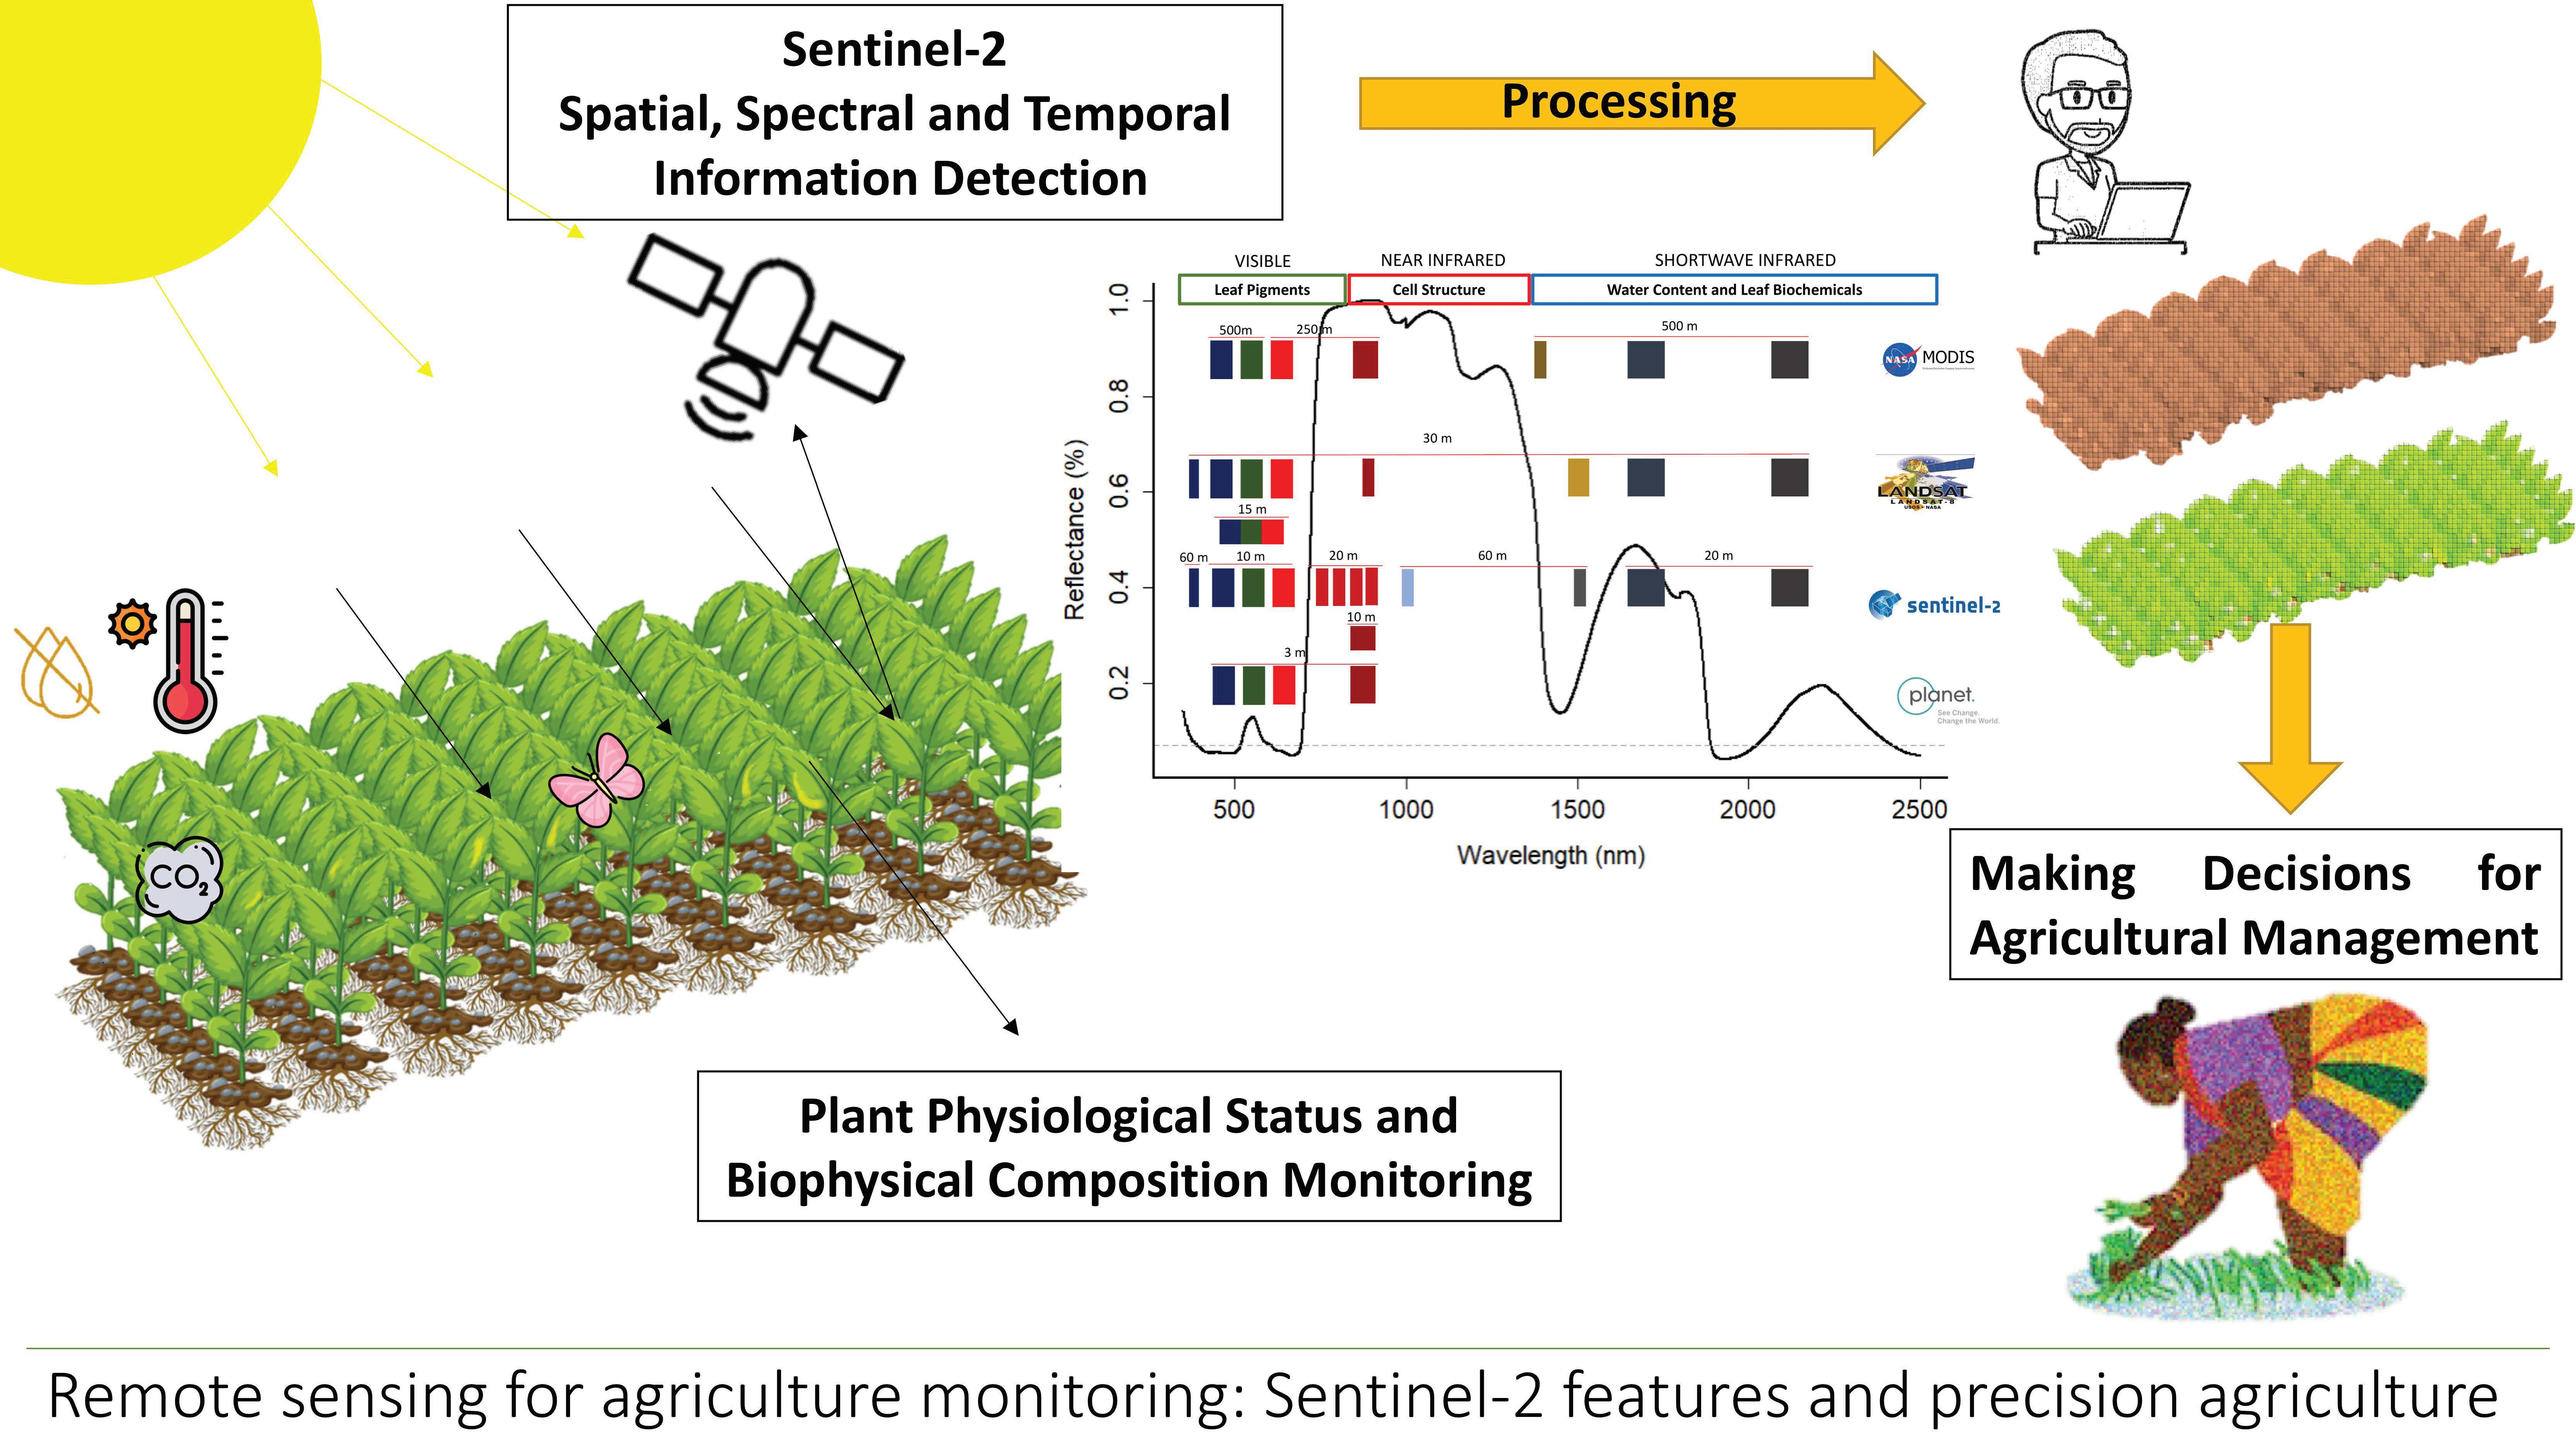
2.2. Satellites and Remote Sensing Scales of Observation
2.3. Sentinel-2 Spatial and Temporal Resolutions Compared to Other Satellites
2.4. Spectral Resolutions and Useful Vegetation Indices for Sentinel-2 Features
2.5. Sentinel-2 Data Access, Secondary Products, and Support Tools
3. Sentinel-2 for Precision Agriculture

| S2 for Agriculture | Sensed Trait | Method | Ref. | |
|---|---|---|---|---|
| Plant stress | Biotic | Cotton rot root (Phymatotrichopsis omnivore) | Classification of affected areas with trained algorithms using bands 2, 3, 4, and 8 S2 imagery calibrated with an UAV NDVI decrease with increasing infestation, ground, airborne, and satellite multiplatform Field spectral data and S2-derived VIs Proposed index: Red Edge Disease Stress Index (REDSI), bands 4, 5, and 7 | [86] [87] [84] [83] [85] |
| Rice crops and Western Swamphen (Porphyrio porphyrio) | ||||
| Hessian fly (Mayetiola destructor) infestation in Wheat | ||||
| Coffee leaf rust (Hemileia vastarix) | ||||
| Wheat yellow rust (Puccinia striiformis) | ||||
| Abiotic | Metal stress in rice | Red-edge S2 bands S2 VI and OPTRAM soil moisture monitoring | [90,91,92] [94,95] | |
| Drought | ||||
| Salinity | S2 visible bands, blue and red, are sensitive to soil salinity | [93] | ||
| Management scale | Fertilization | N in crops | Biophysical retrieval of canopy chlorophyll content, also with VIs within the red-edge. Assessment of the nutritional status, NNI | [75,76,77,78,79,80,81] |
| Water | Irrigation and hydric requirements (cotton, tomato, wheat, and maize) | S2 vegetation parameters, surface albedo, and crop height for FAO-56 Penman-Monteith ET estimation; red and red-edge bands to predict crop coefficients (Kc). Irrigated and rain-fed cropland differentiation. Combination of S2 and Aquacrop. | [70,71,72,73,74] | |
| Fields monitoring | Cropland assessments | VIs for cropping practices assessment; regional and nation-scale cropland and crop type classification with S2, time series and retrieval of biophysical and vegetation radiometric indexes (sen-2Agri) | [44,45,48,49,50,51,52,53,54] | |
| Soils | Soil features | Determining soil OM with VIs, and S2 bands. The wavelength of the OM spectral feature in the visible is close to S2 red band. Classification of soils degradation. | [63,64,65,66,67,68,69] | |
| Yield prediction | Empirical models Radiative transfer models (RTM) | VIs and yields, together with climatological data to build a dataset. Fitting techniques (regressions, random forest, machine learning) to predict yields. Coupling with crop functioning models, FAPAR, LAI, SLA, and light use efficiency. | [55,56,57,58] [59,60,61,62] | |
4. Sentinel-2: Comparative Advantages and Future Work
5. Conclusions
Author Contributions
Funding
Acknowledgments
Conflicts of Interest
References
- Berthet, E.T.; Bretagnolle, V.; Lavorel, S.; Sabatier, R.; Tichit, M.; Segrestin, B. Applying ecological knowledge to the innovative design of sustainable agroecosystems. J. Appl. Ecol. 2019, 56, 44–51. [Google Scholar] [CrossRef] [Green Version]
- General Assembly Transforming Our World: The 2030 Agenda for Sustainable Development; United Nations: New York, NY, USA, 2015.
- Matton, N.; Canto, G.S.; Waldner, F.; Valero, S.; Morin, D.; Inglada, J.; Arias, M.; Bontemps, S.; Koetz, B.; Defourny, P. An Automated Method for Annual Cropland Mapping along the Season for Various Globally-Distributed Agrosystems Using High Spatial and Temporal Resolution Time Series. Remote Sens. 2015, 7, 13208–13232. [Google Scholar] [CrossRef] [Green Version]
- Pierce, F.J.; Nowak, P. Aspects of Precision Agriculture. Adv. Agron. 1999, 67, 1–85. [Google Scholar]
- Araus, J.L.; Kefauver, S.C. Breeding to adapt agriculture to climate change: Affordable phenotyping solutions. Curr. Opin. Plant Biol. 2018, 45, 237–247. [Google Scholar] [CrossRef]
- Mulla, D.J. Twenty five years of remote sensing in precision agriculture: Key advances and remaining knowledge gaps. Biosyst. Eng. 2013, 114, 358–371. [Google Scholar] [CrossRef]
- Yang, J.; Gong, P.; Fu, R.; Zhang, M.; Chen, J.; Liang, S.; Xu, B.; Shi, J.; Dickinson, R. The role of satellite remote sensing in climate change studies. Nat. Clim. Chang. 2013, 3, 875–883. [Google Scholar] [CrossRef]
- Zhang, N.; Wang, M.; Wang, N. Precision agriculture—A worldwide overview. Comput. Electron. Agric. 2002, 36, 113–132. [Google Scholar] [CrossRef]
- Adams, J.B.; Gillespie, A.R. Remote Sensing of Landscapes with Spectral Images: A Physical Modeling Approach; Cambridge University Press: Cambridge, UK, 2006; pp. 1–362. [Google Scholar]
- Avery, T.E.; Berlin, G.L. Fundamentals of Remote Sensing and Airphoto Interpretation; Macmillan: London, UK, 1992. [Google Scholar]
- Tucker, C.J. Red and photographic infrared linear combinations for monitoring vegetation. Remote Sens. Environ. 1979, 8, 127–150. [Google Scholar] [CrossRef] [Green Version]
- Rautiainen, M.; Stenberg, P. Application of photon recollision probability in coniferous canopy reflectance simulations. Remote Sens. Environ. 2005, 96, 98–107. [Google Scholar] [CrossRef]
- Disney, M.; Lewis, P.; Saich, P. 3D modelling of forest canopy structure for remote sensing simulations in the optical and microwave domains. Remote Sens. Environ. 2006, 100, 114–132. [Google Scholar] [CrossRef]
- Steddom, K.; Bredehoeft, M.W.; Khan, M.; Rush, C.M. Comparison of visual and multispectral radiometric disease evaluations of Cercospora leaf spot of sugar beet. Plant Dis. 2005, 89, 153–158. [Google Scholar] [CrossRef] [Green Version]
- Aparicio, N.; Villegas, D.; Araus, J.L.; Casadesús, J.; Royo, C. Relationship between growth traits and spectral vegetation indices in durum wheat. Crop Sci. 2002, 42, 1547–1555. [Google Scholar] [CrossRef]
- Peñuelas, J.; Filella, I. Reflectance assessment of mite effects on apple trees. Int. J. Remote Sens. 1995, 16, 2727–2733. [Google Scholar] [CrossRef]
- Blazquez, C.H.; Edwards, G.J. Spectral reflectance of healthy and diseased watermelon leaves. Ann. Appl. Biol. 1986, 108, 243–249. [Google Scholar] [CrossRef]
- Sharp, E.L. Monitoring Cereal Rust Development with a Spectral Radiometer. Phytopathology 1985, 75, 936. [Google Scholar] [CrossRef] [Green Version]
- Miller, J.R.; Hare, E.W.; Wu, J. Quantitative characterization of the vegetation red edge reflectance 1. An inverted-gaussian reflectance model. Int. J. Remote Sens. 1990, 11, 1755–1773. [Google Scholar] [CrossRef]
- Curran, P.J.; Dungan, J.L.; Macler, B.A.; Plummer, S.E. The effect of a red leaf pigment on the relationship between red edge and chlorophyll concentration. Remote Sens. Environ. 1991, 35, 69–76. [Google Scholar] [CrossRef]
- Curran, P.J.; Dungan, J.L.; Gholz, H.L. Exploring the relationship between reflectance red edge and chlorophyll content in slash pine. Tree Physiol. 1990, 7, 33–48. [Google Scholar] [CrossRef]
- Kokaly, R.F. Investigating a physical basis for spectroscopic estimates of leaf nitrogen concentration. Remote Sens. Environ. 2001, 75, 153–161. [Google Scholar] [CrossRef]
- Guerif, M.; Houles, V.; Baret, F. Remote sensing and detection of nitrogen status in crops. Application to precise nitrogen fertilization. In Proceedings of the 4th International Symposium on Intelligent Information Technology in Agriculture, Beijing, China, 26–29 October 2007. [Google Scholar]
- Chen, P.; Haboudane, D.; Tremblay, N.; Wang, J.; Vigneault, P.; Li, B. New spectral indicator assessing the efficiency of crop nitrogen treatment in corn and wheat. Remote Sens. Environ. 2010, 114, 1987–1997. [Google Scholar] [CrossRef]
- Gitelson, A.A.; Merzlyak, M.N. Signature analysis of leaf reflectance spectra: Algorithm development for remote sensing of chlorophyll. J. Plant Physiol. 1996, 148, 494–500. [Google Scholar] [CrossRef]
- Liang, S.; Li, X.; Wang, J. Advanced Remote Sensing; Academic Press: Cambridge, MA, USA, 2012; ISBN 9780123859549. [Google Scholar]
- Homolová, L.; Malenovský, Z.; Clevers, J.G.P.W.; García-Santos, G.; Schaepman, M.E. Review of optical-based remote sensing for plant trait mapping. Ecol. Complex. 2013, 15, 1–16. [Google Scholar] [CrossRef] [Green Version]
- Drusch, M.; Del Bello, U.; Carlier, S.; Colin, O.; Fernandez, V.; Gascon, F.; Hoersch, B.; Isola, C.; Laberinti, P.; Martimort, P.; et al. Sentinel-2: ESA’s Optical High-Resolution Mission for GMES Operational Services. Remote Sens. Environ. 2012, 120, 25–36. [Google Scholar] [CrossRef]
- SUHET. Sentinel-2 User Handbook; European Comission: Brussels, Belgium, 2015. [Google Scholar]
- Le Maire, G.; François, C.; Dufrêne, E. Towards universal broad leaf chlorophyll indices using PROSPECT simulated database and hyperspectral reflectance measurements. Remote Sens. Environ. 2004, 89, 1–28. [Google Scholar] [CrossRef]
- Xue, J.; Su, B. Significant remote sensing vegetation indices: A review of developments and applications. J. Sens. 2017, 2017, 1353691. [Google Scholar] [CrossRef] [Green Version]
- Bannari, A.; Morin, D.; Bonn, F.; Huete, A.R. A review of vegetation indices. Remote Sens. Rev. 1995, 13, 95–120. [Google Scholar] [CrossRef]
- Hunt, E.R.; Cavigelli, M.; Daughtry, C.S.T.; McMurtrey, J.E.; Walthall, C.L. Evaluation of digital photography from model aircraft for remote sensing of crop biomass and nitrogen status. Precis. Agric. 2005, 6, 359–378. [Google Scholar] [CrossRef]
- Hunt, E.R.; Doraiswamy, P.C.; McMurtrey, J.E.; Daughtry, C.S.T.; Perry, E.M.; Akhmedov, B. A visible band index for remote sensing leaf chlorophyll content at the Canopy scale. Int. J. Appl. Earth Obs. Geoinf. 2012, 21, 103–112. [Google Scholar] [CrossRef] [Green Version]
- Haboudane, D.; Miller, J.R.; Tremblay, N.; Zarco-Tejada, P.J.; Dextraze, L. Integrated narrow-band vegetation indices for prediction of crop chlorophyll content for application to precision agriculture. Remote Sens. Environ. 2002, 81, 416–426. [Google Scholar] [CrossRef]
- Dash, J.; Curran, P.J. Evaluation of the MERIS terrestrial chlorophyll index (MTCI). Adv. Sp. Res. 2007, 39, 100–104. [Google Scholar] [CrossRef]
- Gitelson, A.A.; Viña, A.; Ciganda, V.; Rundquist, D.C.; Arkebauer, T.J. Remote estimation of canopy chlorophyll content in crops. Geophys. Res. Lett. 2005, 32. [Google Scholar] [CrossRef] [Green Version]
- Vincini, M.; Frazzi, E.; D’Alessio, P. A broad-band leaf chlorophyll vegetation index at the canopy scale. Precis. Agric. 2008, 9, 303–319. [Google Scholar] [CrossRef]
- Frampton, W.J.; Dash, J.; Watmough, G.; Milton, E.J. Evaluating the capabilities of Sentinel-2 for quantitative estimation of biophysical variables in vegetation. ISPRS J. Photogramm. Remote Sens. 2013, 82, 83–92. [Google Scholar] [CrossRef] [Green Version]
- Congedo, L. Semi-Automatic Classification Plugin Semi-Automatic Classification Plugin Documentation; SCP: Rome, Italy, 2017; pp. 3, 159, 160, 154, 159, 206. [Google Scholar]
- ESA. The Copernicus Space Component: Sentinels Data Products List; ESA: Paris, France, 2014; pp. 1–18. [Google Scholar]
- Weiss, M.; Baret, F. S2ToolBox Level 2 Products: LAI, FAPAR, FCOVER—Version 1.1; INRA: Avignon, France, 2016; 53p. [Google Scholar]
- Verrelst, J.; Rivera, J.P.; Veroustraete, F.; Muñoz-Marí, J.; Clevers, J.G.P.W.; Camps-Valls, G.; Moreno, J. Experimental Sentinel-2 LAI estimation using parametric, non-parametric and physical retrieval methods—A comparison. ISPRS J. Photogramm. Remote Sens. 2015, 108, 260–272. [Google Scholar] [CrossRef]
- Defourny, P.; Bontemps, S.; Bellemans, N.; Cara, C.; Dedieu, G.; Guzzonato, E.; Hagolle, O.; Inglada, J.; Nicola, L.; Rabaute, T.; et al. Near real-time agriculture monitoring at national scale at parcel resolution: Performance assessment of the Sen2-Agri automated system in various cropping systems around the world. Remote Sens. Environ. 2019, 221, 551–568. [Google Scholar] [CrossRef]
- Lambert, M.J.; Traoré, P.C.S.; Blaes, X.; Baret, P.; Defourny, P. Estimating smallholder crops production at village level from Sentinel-2 time series in Mali’s cotton belt. Remote Sens. Environ. 2018, 216, 647–657. [Google Scholar] [CrossRef]
- Comission, E. EU Budget: The Common Agricultural Policy beyond 2020. Available online: https://ec.europa.eu/commission/presscorner/detail/en/MEMO_18_3974 (accessed on 26 April 2020).
- Campos-Taberner, M.; García-Haro, F.J.; Martínez, B.; Sánchez-Ruiz, S.; Gilabert, M.A. A copernicus sentinel-1 and sentinel-2 classification framework for the 2020+ European common agricultural policy: A case study in València (Spain). Agronomy 2019, 9, 556. [Google Scholar] [CrossRef] [Green Version]
- Vuolo, F.; Neuwirth, M.; Immitzer, M.; Atzberger, C.; Ng, W.T. How much does multi-temporal Sentinel-2 data improve crop type classification? Int. J. Appl. Earth Obs. Geoinf. 2018, 72, 122–130. [Google Scholar] [CrossRef]
- Son, N.T.; Chen, C.F.; Chen, C.R.; Guo, H.Y. Classification of multitemporal Sentinel-2 data for field-level monitoring of rice cropping practices in Taiwan. Adv. Sp. Res. 2020, 65, 1910–1921. [Google Scholar] [CrossRef]
- Wang, M.; Liu, Z.; Ali Baig, M.H.; Wang, Y.; Li, Y.; Chen, Y. Mapping sugarcane in complex landscapes by integrating multi-temporal Sentinel-2 images and machine learning algorithms. Land Use Policy 2019, 88, 104190. [Google Scholar] [CrossRef]
- Cai, Y.; Lin, H.; Zhang, M. Mapping paddy rice by the object-based random forest method using time series Sentinel-1/Sentinel-2 data. Adv. Sp. Res. 2019, 64, 2233–2244. [Google Scholar] [CrossRef]
- Csillik, O.; Belgiu, M.; Asner, G.P.; Kelly, M. Object-based time-constrained dynamic time warping classification of crops using Sentinel-2. Remote Sens. 2019, 11, 1257. [Google Scholar] [CrossRef] [Green Version]
- Belgiu, M.; Csillik, O. Sentinel-2 cropland mapping using pixel-based and object-based time-weighted dynamic time warping analysis. Remote Sens. Environ. 2018, 204, 509–523. [Google Scholar] [CrossRef]
- Noi, P.T.; Kappas, M. Comparison of random forest, k-nearest neighbor, and support vector machine classifiers for land cover classification using sentinel-2 imagery. Sensors 2018, 18, 18. [Google Scholar]
- Gómez, D.; Salvador, P.; Sanz, J.; Casanova, J.L. Potato Yield Prediction Using Machine Learning Techniques and Sentinel 2 Data. Remote Sens. 2019, 11, 1745. [Google Scholar] [CrossRef] [Green Version]
- Hunt, M.L.; Blackburn, G.A.; Carrasco, L.; Redhead, J.W.; Rowland, C.S. High resolution wheat yield mapping using Sentinel-2. Remote Sens. Environ. 2019, 233, 111410. [Google Scholar] [CrossRef]
- Fieuzal, R.; Bustillo, V.; Collado, D.; Dedieu, G. Combined use of multi-temporal Landsat-8 and sentinel-2 images for wheat yield estimates at the intra-plot spatial scale. Agronomy 2020, 10, 327. [Google Scholar] [CrossRef] [Green Version]
- Toscano, P.; Castrignanò, A.; Di Gennaro, S.F.; Vonella, A.V.; Ventrella, D.; Matese, A. A precision agriculture approach for durum wheat yield assessment using remote sensing data and yield mapping. Agronomy 2019, 9, 437. [Google Scholar] [CrossRef] [Green Version]
- Battude, M.; Al Bitar, A.; Morin, D.; Cros, J.; Huc, M.; Marais Sicre, C.; Le Dantec, V.; Demarez, V. Estimating maize biomass and yield over large areas using high spatial and temporal resolution Sentinel-2 like remote sensing data. Remote Sens. Environ. 2016, 184, 668–681. [Google Scholar] [CrossRef]
- Novelli, F.; Vuolo, F. Assimilation of sentinel-2 leaf area index data into a physically-based crop growth model for yield estimation. Agronomy 2019, 9, 255. [Google Scholar] [CrossRef] [Green Version]
- Habyarimana, E.; Piccard, I.; Catellani, M.; De Franceschi, P.; Dall’Agata, M. Towards predictive modeling of sorghum biomass yields using fraction of absorbed photosynthetically active radiation derived from sentinel-2 satellite imagery and supervised machine learning techniques. Agronomy 2019, 9, 203. [Google Scholar] [CrossRef] [Green Version]
- He, L.; Mostovoy, G. Cotton Yield Estimate Using Sentinel-2 Data and an Ecosystem Model over the Southern US. Remote Sens. 2019, 11, 2000. [Google Scholar] [CrossRef] [Green Version]
- Castaldi, F.; Hueni, A.; Chabrillat, S.; Ward, K.; Buttafuoco, G.; Bomans, B.; Vreys, K.; Brell, M.; van Wesemael, B. Evaluating the capability of the Sentinel 2 data for soil organic carbon prediction in croplands. ISPRS J. Photogramm. Remote Sens. 2019, 147, 267–282. [Google Scholar] [CrossRef]
- Castaldi, F.; Chabrillat, S.; Don, A.; van Wesemael, B. Soil Organic Carbon Mapping Using LUCAS Topsoil Database and Sentinel-2 Data: An Approach to Reduce Soil Moisture and Crop Residue Effects. Remote Sens. 2019, 11, 2121. [Google Scholar] [CrossRef] [Green Version]
- Vaudour, E.; Gomez, C.; Loiseau, T.; Baghdadi, N.; Loubet, B.; Arrouays, D.; Ali, L.; Lagacherie, P. The Impact of Acquisition Date on the Prediction Performance of Topsoil Organic Carbon from Sentinel-2 for Croplands. Remote Sens. 2019, 11, 2143. [Google Scholar] [CrossRef] [Green Version]
- Gholizadeh, A.; Žižala, D.; Saberioon, M.; Borůvka, L. Soil organic carbon and texture retrieving and mapping using proximal, airborne and Sentinel-2 spectral imaging. Remote Sens. Environ. 2018, 218, 89–103. [Google Scholar] [CrossRef]
- Vaudour, E.; Gomez, C.; Fouad, Y.; Lagacherie, P. Sentinel-2 image capacities to predict common topsoil properties of temperate and Mediterranean agroecosystems. Remote Sens. Environ. 2019, 223, 21–33. [Google Scholar] [CrossRef]
- Rosero-Vlasova, O.A.; Vlassova, L.; Pérez-Cabello, F.; Montorio, R.; Nadal-Romero, E. Modeling soil organic matter and texture from satellite data in areas affected by wildfires and cropland abandonment in Aragón, Northern Spain. J. Appl. Remote Sens. 2018, 12, 1. [Google Scholar] [CrossRef]
- Žížala, D.; Juřicová, A.; Zádorová, T.; Zelenková, K.; Minařík, R. Mapping soil degradation using remote sensing data and ancillary data: South-East Moravia, Czech Republic. Eur. J. Remote Sens. 2019, 52, 108–122. [Google Scholar] [CrossRef] [Green Version]
- Vanino, S.; Nino, P.; De Michele, C.; Falanga Bolognesi, S.; D’Urso, G.; Di Bene, C.; Pennelli, B.; Vuolo, F.; Farina, R.; Pulighe, G.; et al. Capability of Sentinel-2 data for estimating maximum evapotranspiration and irrigation requirements for tomato crop in Central Italy. Remote Sens. Environ. 2018, 215, 452–470. [Google Scholar] [CrossRef]
- Dalla Marta, A.; Chirico, G.B.; Falanga Bolognesi, S.; Mancini, M.; D’Urso, G.; Orlandini, S.; De Michele, C.; Altobelli, F. Integrating Sentinel-2 Imagery with AquaCrop for Dynamic Assessment of Tomato Water Requirements in Southern Italy. Agronomy 2019, 9, 404. [Google Scholar] [CrossRef] [Green Version]
- Pasqualotto, N.; D’Urso, G.; Bolognesi, S.F.; Belfiore, O.R.; Van Wittenberghe, S.; Delegido, J.; Pezzola, A.; Winschel, C.; Moreno, J. Retrieval of evapotranspiration from sentinel-2: Comparison of vegetation indices, semi-empirical models and SNAP biophysical processor approach. Agronomy 2019, 9, 663. [Google Scholar] [CrossRef] [Green Version]
- Rozenstein, O.; Haymann, N.; Kaplan, G.; Tanny, J. Estimating cotton water consumption using a time series of Sentinel-2 imagery. Agric. Water Manag. 2018, 207, 44–52. [Google Scholar] [CrossRef]
- Rozenstein, O.; Haymann, N.; Kaplan, G.; Tanny, J. Validation of the cotton crop coefficient estimation model based on Sentinel-2 imagery and eddy covariance measurements. Agric. Water Manag. 2019, 223, 105715. [Google Scholar] [CrossRef]
- Clevers, J.G.P.W.; Kooistra, L.; van den Brande, M.M.M. Using Sentinel-2 data for retrieving LAI and leaf and canopy chlorophyll content of a potato crop. Remote Sens. 2017, 9, 663. [Google Scholar] [CrossRef] [Green Version]
- Nutini, F.; Confalonieri, R.; Crema, A.; Movedi, E.; Paleari, L.; Stavrakoudis, D.; Boschetti, M. An operational workflow to assess rice nutritional status based on satellite imagery and smartphone apps. Comput. Electron. Agric. 2018, 154, 80–92. [Google Scholar] [CrossRef]
- Delloye, C.; Weiss, M.; Defourny, P. Retrieval of the canopy chlorophyll content from Sentinel-2 spectral bands to estimate nitrogen uptake in intensive winter wheat cropping systems. Remote Sens. Environ. 2018, 216, 245–261. [Google Scholar] [CrossRef]
- Vizzari, M.; Santaga, F.; Benincasa, P. Sentinel 2-based nitrogen VRT fertilization in wheat: Comparison between traditional and simple precision practices. Agronomy 2019, 9, 663. [Google Scholar] [CrossRef] [Green Version]
- Ramoelo, A.; Cho, M.A. Explaining leaf nitrogen distribution in a semi-arid environment predicted on sentinel-2 imagery using a field spectroscopy derived model. Remote Sens. 2018, 10, 269. [Google Scholar] [CrossRef] [Green Version]
- Chemura, A.; Mutanga, O.; Odindi, J.; Kutywayo, D. Mapping spatial variability of foliar nitrogen in coffee (Coffea arabica L.) plantations with multispectral Sentinel-2 MSI data. ISPRS J. Photogramm. Remote Sens. 2018, 138, 1–11. [Google Scholar] [CrossRef]
- Söderström, M.; Piikki, K.; Stenberg, M.; Stadig, H.; Martinsson, J. Producing nitrogen (N) uptake maps in winter wheat by combining proximal crop measurements with Sentinel-2 and DMC satellite images in a decision support system for farmers. Acta Agric. Scand. Sect. B Soil Plant Sci. 2017, 67, 637–650. [Google Scholar] [CrossRef]
- Delegido, J.; Verrelst, J.; Alonso, L.; Moreno, J. Evaluation of sentinel-2 red-edge bands for empirical estimation of green LAI and chlorophyll content. Sensors 2011, 11, 7063–7081. [Google Scholar] [CrossRef] [PubMed] [Green Version]
- Chemura, A.; Mutanga, O.; Dube, T. Separability of coffee leaf rust infection levels with machine learning methods at Sentinel-2 MSI spectral resolutions. Precis. Agric. 2017, 18, 859–881. [Google Scholar] [CrossRef]
- Bhattarai, G.P.; Schmid, R.B.; McCornack, B.P. Remote Sensing Data to Detect Hessian Fly Infestation in Commercial Wheat Fields. Sci. Rep. 2019, 9, 6109. [Google Scholar] [CrossRef]
- Zheng, Q.; Huang, W.; Cui, X.; Shi, Y.; Liu, L. New spectral index for detecting wheat yellow rust using sentinel-2 multispectral imagery. Sensors 2018, 18, 868. [Google Scholar] [CrossRef] [Green Version]
- Song, X.; Yang, C.; Wu, M.; Zhao, C.; Yang, G.; Hoffmann, W.C.; Huang, W. Evaluation of Sentinel-2A satellite imagery for mapping cotton root rot. Remote Sens. 2017, 9, 906. [Google Scholar] [CrossRef] [Green Version]
- Pla, M.; Bota, G.; Duane, A.; Balagué, J.; Curcó, A.; Gutiérrez, R.; Brotons, L. Calibrating Sentinel-2 Imagery with Multispectral UAV Derived Information to Quantify Damages in Mediterranean Rice Crops Caused by Western Swamphen (Porphyrio porphyrio). Drones 2019, 3, 45. [Google Scholar] [CrossRef] [Green Version]
- Meivel, S.M.; Professor, A.; Maguteeswaran, R.; Gandhiraj, N.B.; Srinivasan, G. Quadcopter UAV Based Fertilizer and Pesticide Spraying System. Int. Acad. Res. J. Eng. Sci. 2016, 1, 2414–6242. [Google Scholar]
- Faiçal, B.S.; Costa, F.G.; Pessin, G.; Ueyama, J.; Freitas, H.; Colombo, A.; Fini, P.H.; Villas, L.; Osório, F.S.; Vargas, P.A.; et al. The use of unmanned aerial vehicles and wireless sensor networks for spraying pesticides. J. Syst. Archit. 2014, 60, 393–404. [Google Scholar] [CrossRef]
- Zhang, Z.; Liu, M.; Liu, X.; Zhou, G. A new vegetation index based on multitemporal sentinel-2 images for discriminating heavy metal stress levels in rice. Sensors 2018, 18, 2172. [Google Scholar] [CrossRef] [Green Version]
- Liu, M.; Wang, T.; Skidmore, A.K.; Liu, X. Heavy metal-induced stress in rice crops detected using multi-temporal Sentinel-2 satellite images. Sci. Total Environ. 2018, 637–638, 18–29. [Google Scholar] [CrossRef] [PubMed]
- Sun, N.; Wang, P.; Huang, F.; Li, B. Developing an integrated index based on phenological metrics for evaluating cadmium stress in rice using Sentinel-2 data. J. Appl. Remote Sens. 2018, 12, 1. [Google Scholar] [CrossRef]
- Davis, E.; Wang, C.; Dow, K. Comparing Sentinel-2 MSI and Landsat 8 OLI in soil salinity detection: A case study of agricultural lands in coastal North Carolina. Int. J. Remote Sens. 2019, 40, 6134–6153. [Google Scholar] [CrossRef]
- Mananze, S.; Pôças, I. Agricultural drought monitoring based on soil moisture derived from the optical trapezoid model in Mozambique. J. Appl. Remote Sens. 2019, 13, 1–16. [Google Scholar] [CrossRef]
- West, H.; Quinn, N.; Horswell, M.; White, P. Assessing vegetation response to soil moisture fluctuation under extreme drought using sentinel-2. Water 2018, 10, 838. [Google Scholar] [CrossRef] [Green Version]
- Xie, Q.; Dash, J.; Huete, A.; Jiang, A.; Yin, G.; Ding, Y.; Peng, D.; Hall, C.C.; Brown, L.; Shi, Y.; et al. Retrieval of crop biophysical parameters from Sentinel-2 remote sensing imagery. Int. J. Appl. Earth Obs. Geoinf. 2019, 80, 187–195. [Google Scholar] [CrossRef]
- Mokhtari, A.; Noory, H.; Pourshakouri, F.; Haghighatmehr, P.; Afrasiabian, Y.; Razavi, M.; Fereydooni, F.; Sadeghi Naeni, A. Calculating potential evapotranspiration and single crop coefficient based on energy balance equation using Landsat 8 and Sentinel-2. ISPRS J. Photogramm. Remote Sens. 2019, 154, 231–245. [Google Scholar] [CrossRef]
- Guzinski, R.; Nieto, H. Evaluating the feasibility of using Sentinel-2 and Sentinel-3 satellites for high-resolution evapotranspiration estimations. Remote Sens. Environ. 2019, 221, 157–172. [Google Scholar] [CrossRef]
- Bousbih, S.; Zribi, M.; Hajj, M.; El Baghdadi, N.; Lili-Chabaane, Z.; Gao, Q.; Fanise, P. Soil moisture and irrigation mapping in a semi-arid region, based on the synergetic use of Sentinel-1 and Sentinel-2 data. Remote Sens. 2018, 10, 1953. [Google Scholar] [CrossRef] [Green Version]
- Sodango, T.H.; Li, X.; Sha, J.; Bao, Z. Review of the spatial distribution, source and extent of heavy metal pollution of soil in China: Impacts and mitigation approaches. J. Heal. Pollut. 2018, 8, 53–70. [Google Scholar] [CrossRef] [Green Version]
- Atzberger, C. Correction: Advances in Remote Sensing of Agriculture: Context Description, Existing Operational Monitoring Systems and Major Information Needs. Remote Sens. 2013, 5, 949–981. [Google Scholar] [CrossRef] [Green Version]
- Bégué, A.; Arvor, D.; Bellon, B.; Betbeder, J.; de Abelleyra, D.; Ferraz, R.P.D.; Lebourgeois, V.; Lelong, C.; Simões, M.; Verón, S.R. Remote sensing and cropping practices: A review. Remote Sens. 2018, 10, 99. [Google Scholar] [CrossRef] [Green Version]
- Weiss, M.; Jacob, F.; Duveiller, G. Remote sensing for agricultural applications: A meta-review. Remote Sens. Environ. 2020, 236, 111402. [Google Scholar] [CrossRef]


| MSI Band | Spatial Resolution (m) | Central Wavelength (nm) | Bandwidth (nm) |
|---|---|---|---|
| B1: Coastal Aerosol | 60 | 443 | 20 |
| B2: Blue | 10 | 490 | 65 |
| B3: Green | 10 | 560 | 35 |
| B4: Red | 10 | 665 | 30 |
| B5: Red-Edge | 20 | 705 | 15 |
| B6: Red-Edge | 20 | 740 | 15 |
| B7: Red-Edge | 20 | 783 | 20 |
| B8: NIR | 10 | 842 | 115 |
| B8A: Vegetation RE | 20 | 865 | 20 |
| B9: Water Vapor | 60 | 945 | 20 |
| B10: SWIR Cirrus | 60 | 1375 | 30 |
| B11: SWIR | 20 | 1610 | 90 |
| B12: SWIR | 20 | 2190 | 180 |
| VIs | Sentinel-2 Bands Used | Original Author |
|---|---|---|
| NGRDI | (B3 − B4) / (B3 + B4) | Hunt (2005) |
| TGI | −0.5 × [190 × (B4 − B3) − 120 × (B4 − B2)] | Hunt (2012) |
| NDVI | (B8 − B4) / (B8 + B4) | Tucker (1979) |
| TCARI/OSAVI | 3 × [(B5 − B4) − 0.2 × (B5 − B3) × (B5 / B4)] / [(1 + 0.16) × (B7 − B4) × (B7 + B4 + 0.16) | Haboudane (2002) |
| MTCI | (B6 − B5) / (B5 − B4) | Dash and Curran (2004) |
| CVI | (B8 / B3)] / (B3 / B4) | Vincini (2008) |
| CI red-edge | (B8 / B5) − 1 | Gitelson (2003) |
| IRECI | (B7 − B4) / (B5 / B6) | Frampton (2013) |
© 2020 by the authors. Licensee MDPI, Basel, Switzerland. This article is an open access article distributed under the terms and conditions of the Creative Commons Attribution (CC BY) license (http://creativecommons.org/licenses/by/4.0/).
Share and Cite
Segarra, J.; Buchaillot, M.L.; Araus, J.L.; Kefauver, S.C. Remote Sensing for Precision Agriculture: Sentinel-2 Improved Features and Applications. Agronomy 2020, 10, 641. https://doi.org/10.3390/agronomy10050641
Segarra J, Buchaillot ML, Araus JL, Kefauver SC. Remote Sensing for Precision Agriculture: Sentinel-2 Improved Features and Applications. Agronomy. 2020; 10(5):641. https://doi.org/10.3390/agronomy10050641
Chicago/Turabian StyleSegarra, Joel, Maria Luisa Buchaillot, Jose Luis Araus, and Shawn C. Kefauver. 2020. "Remote Sensing for Precision Agriculture: Sentinel-2 Improved Features and Applications" Agronomy 10, no. 5: 641. https://doi.org/10.3390/agronomy10050641