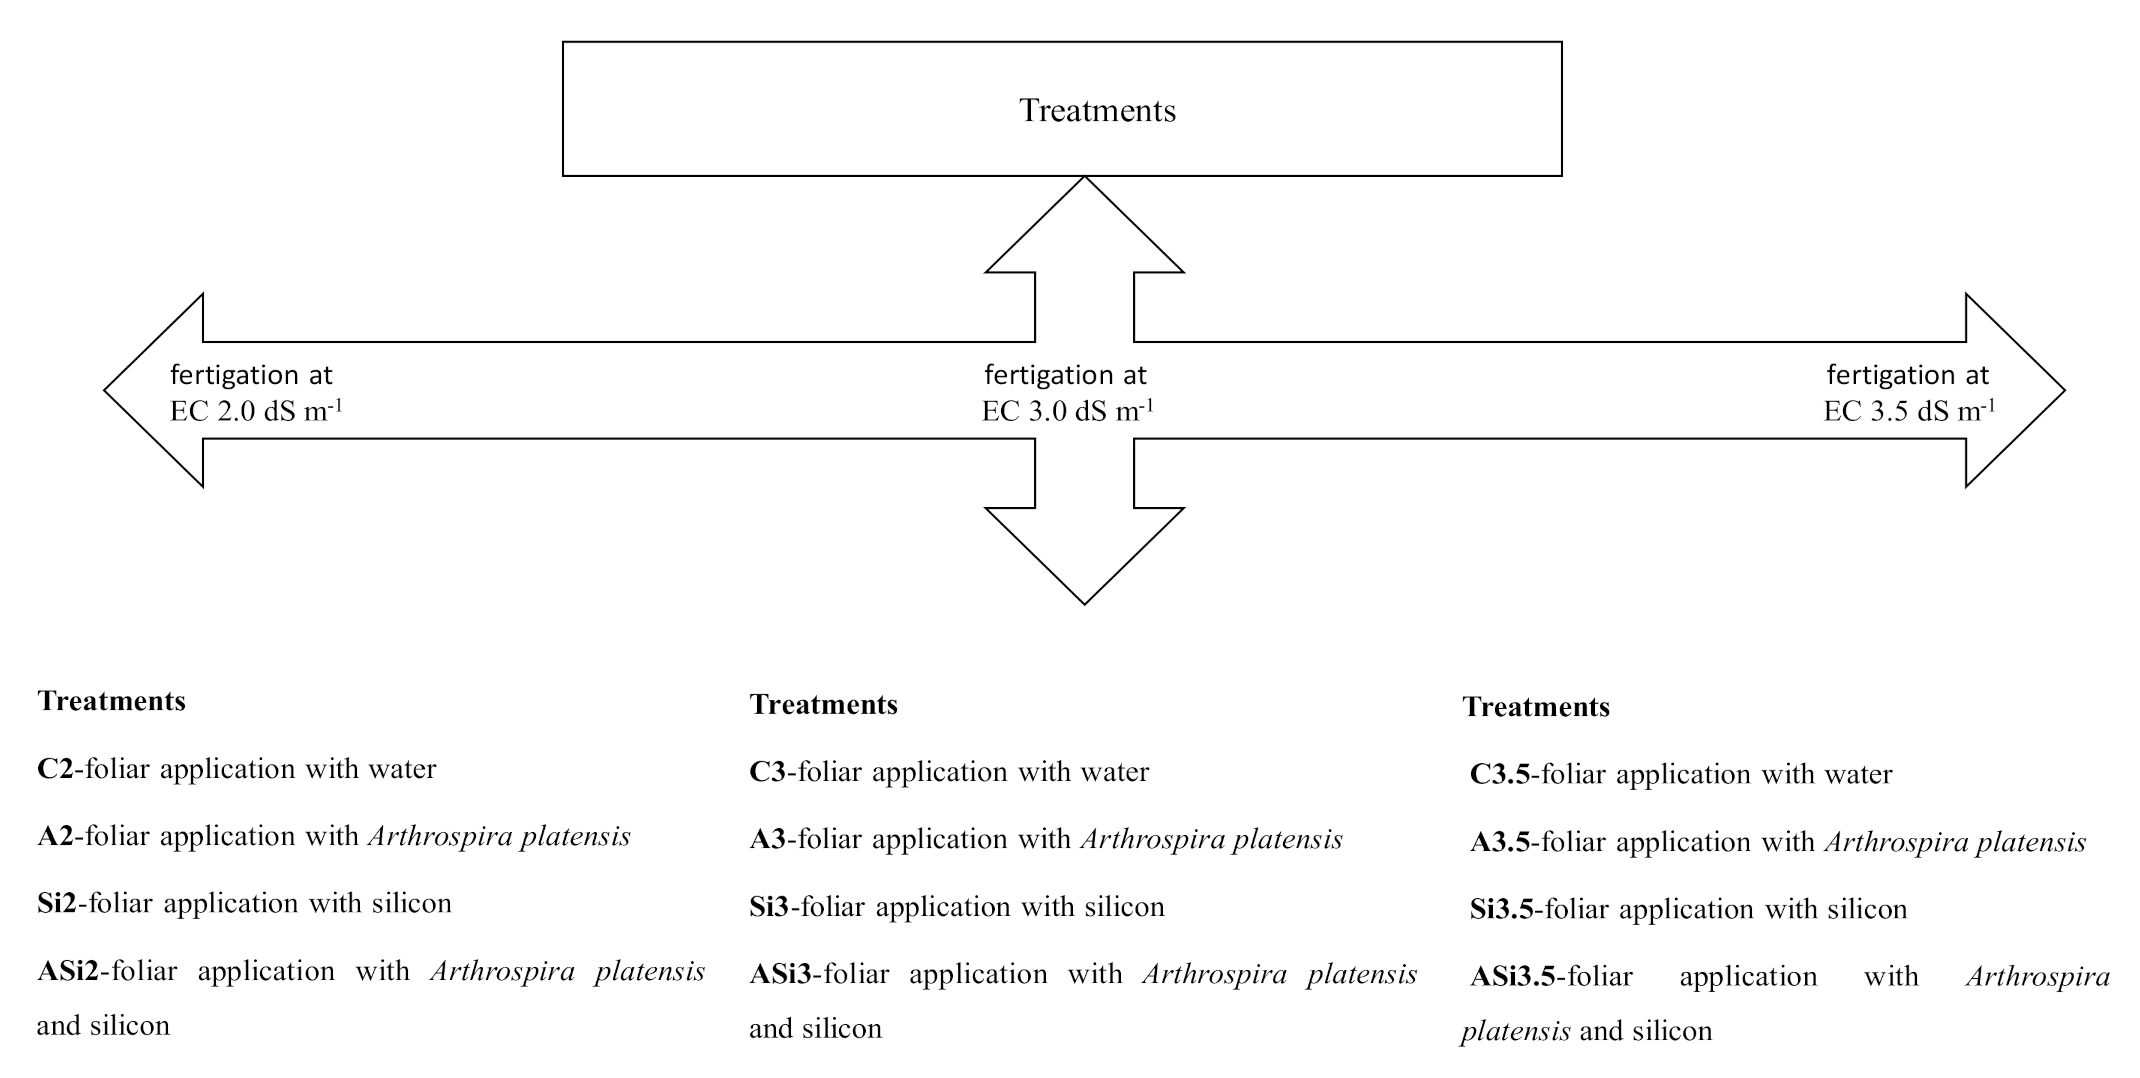
Figure 1.
Schematic diagram of the treatments performed. C—foliar application with water; A—foliar application with Arthrospira platensis; Si—foliar application with silicon; ASi—foliar application with Arthrospira platensis and silicon; 2—fertigation at EC 2.0 dS m−1; 3—fertigation at EC 3.0 dS m−1; 3.5—fertigation at EC 3.5 dS m−1.
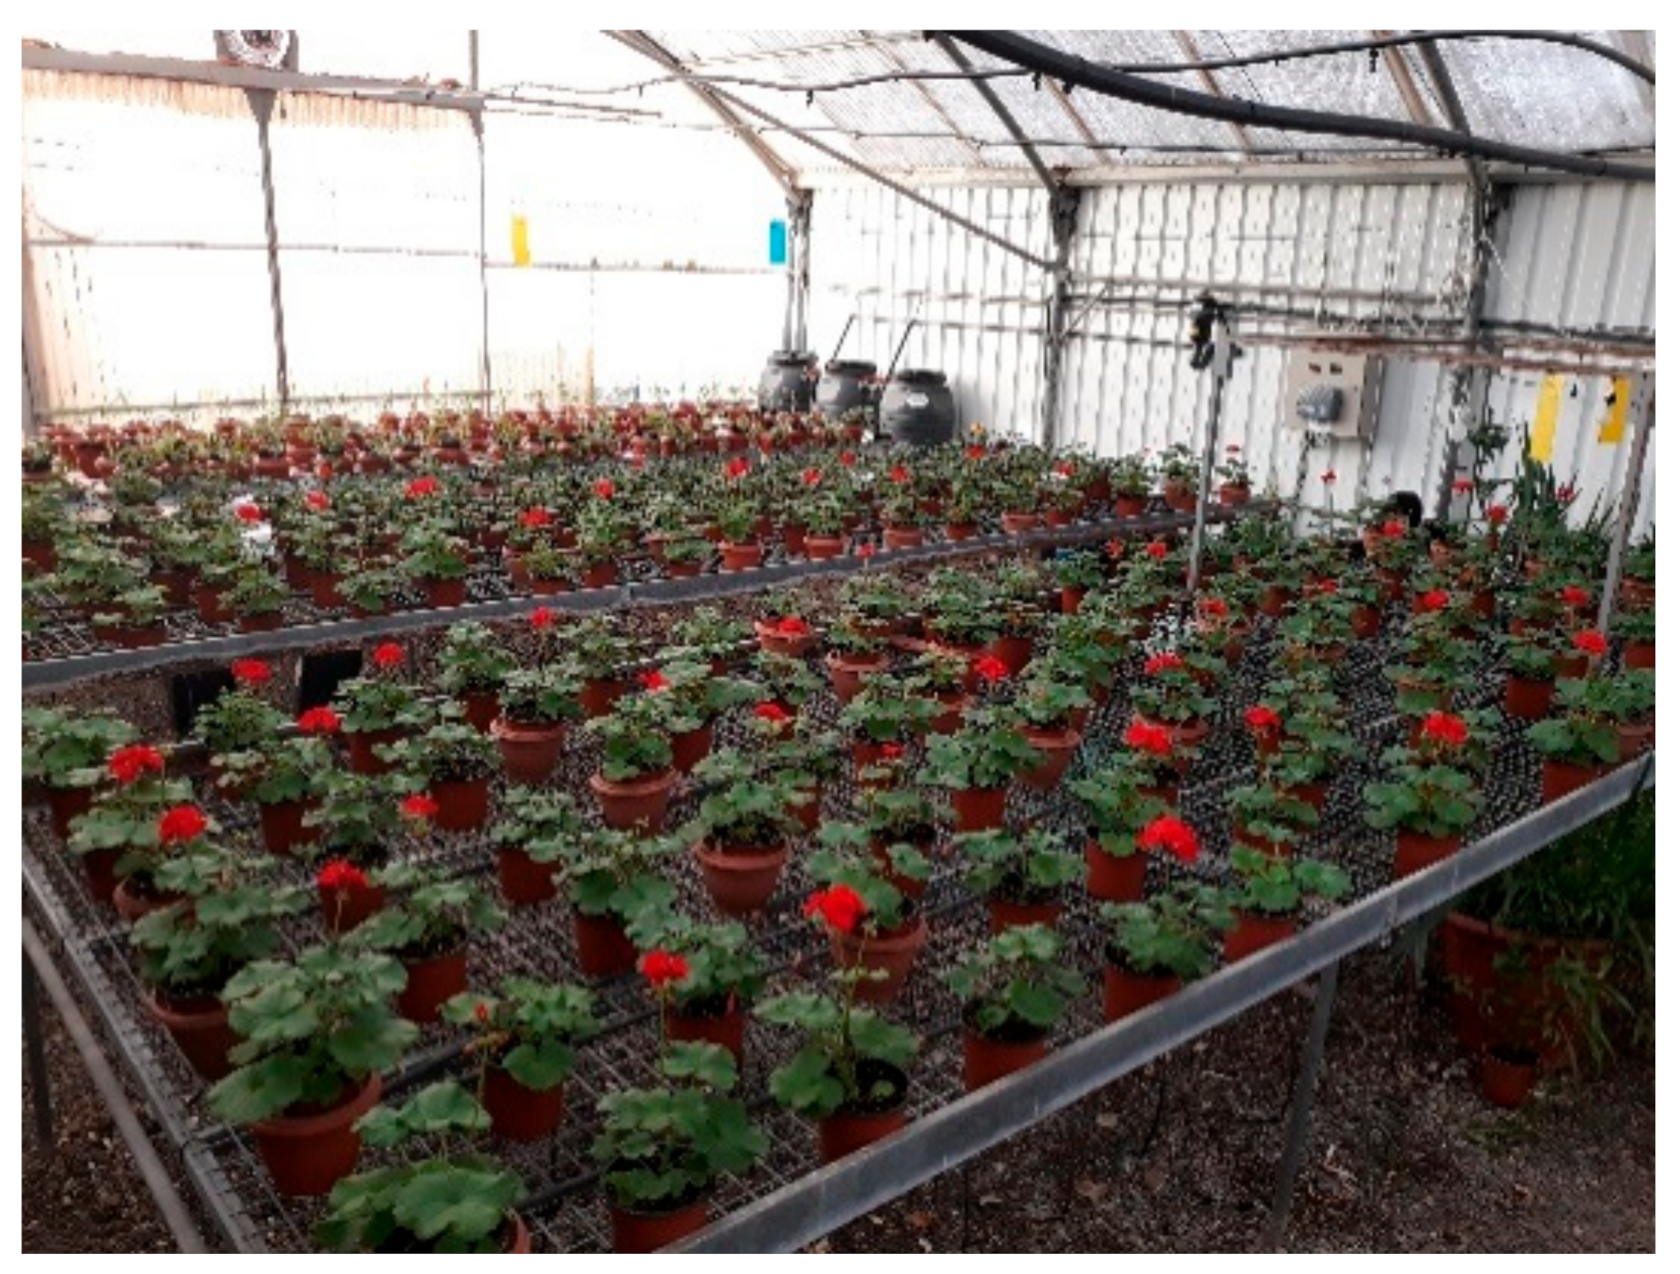
Figure 2.
Pelargonium hortorum plants cultivated in the greenhouse, under the different treatments tested.
Figure 2.
Pelargonium hortorum plants cultivated in the greenhouse, under the different treatments tested.
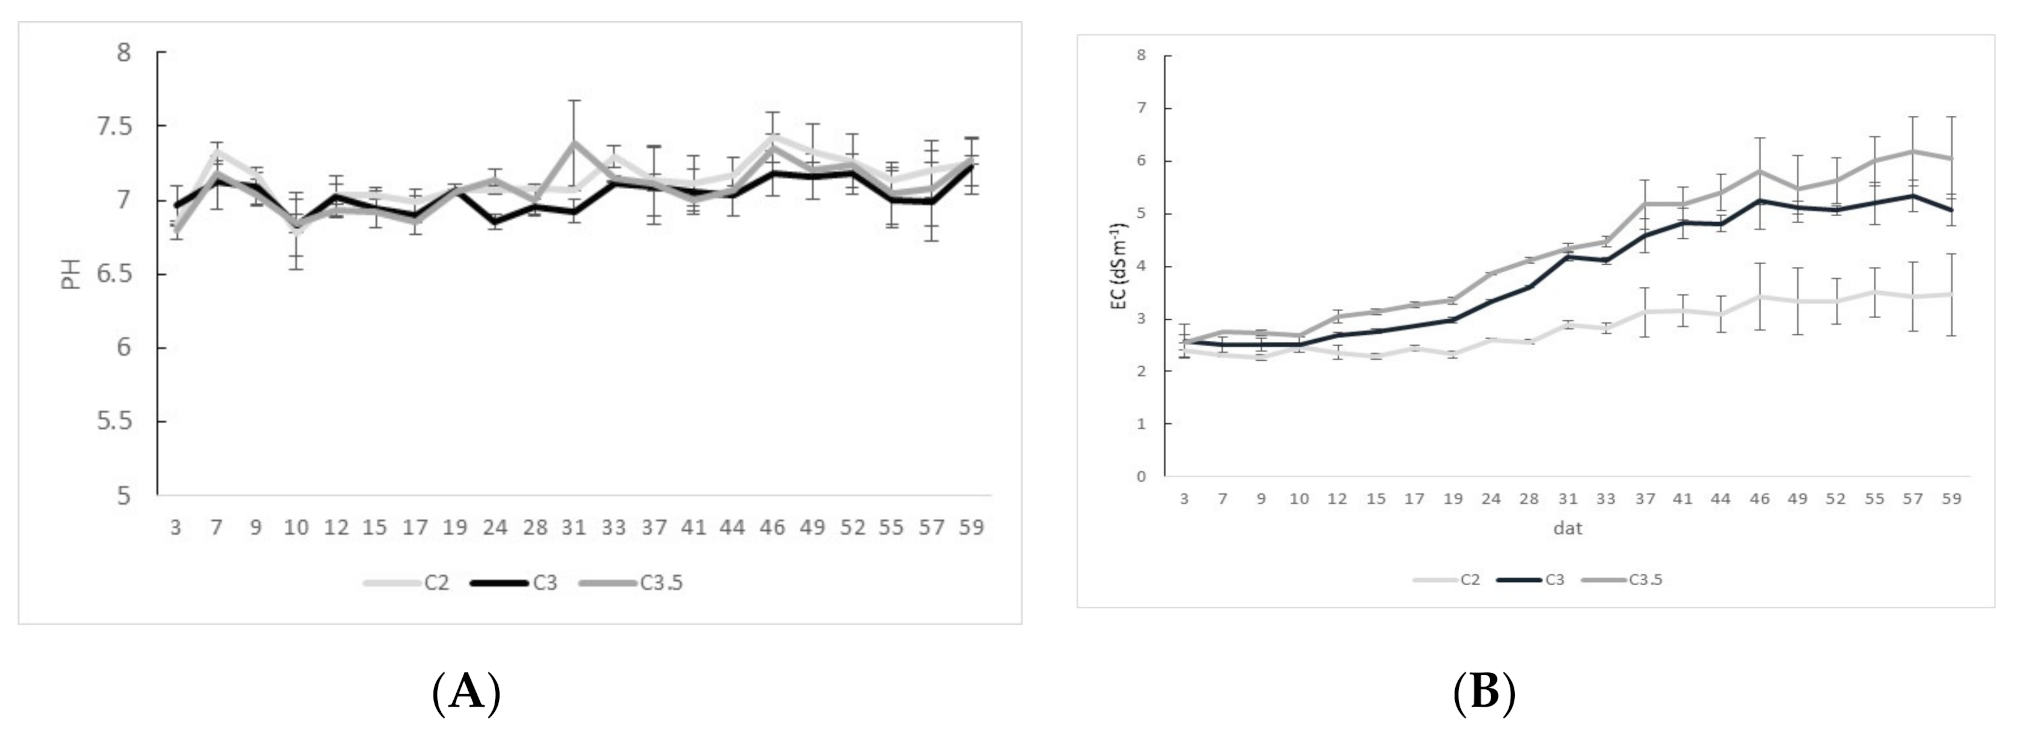
Figure 3.
pH (A) and EC (B) of the leachate collated during the day after transplanting for the C2 (fertigation EC 2.0 dS m−1), C3.0 (fertigation EC 3.0 dS m−1), and C3.5 (fertigation EC 3.5 dS m−1) treatments.
Figure 3.
pH (A) and EC (B) of the leachate collated during the day after transplanting for the C2 (fertigation EC 2.0 dS m−1), C3.0 (fertigation EC 3.0 dS m−1), and C3.5 (fertigation EC 3.5 dS m−1) treatments.
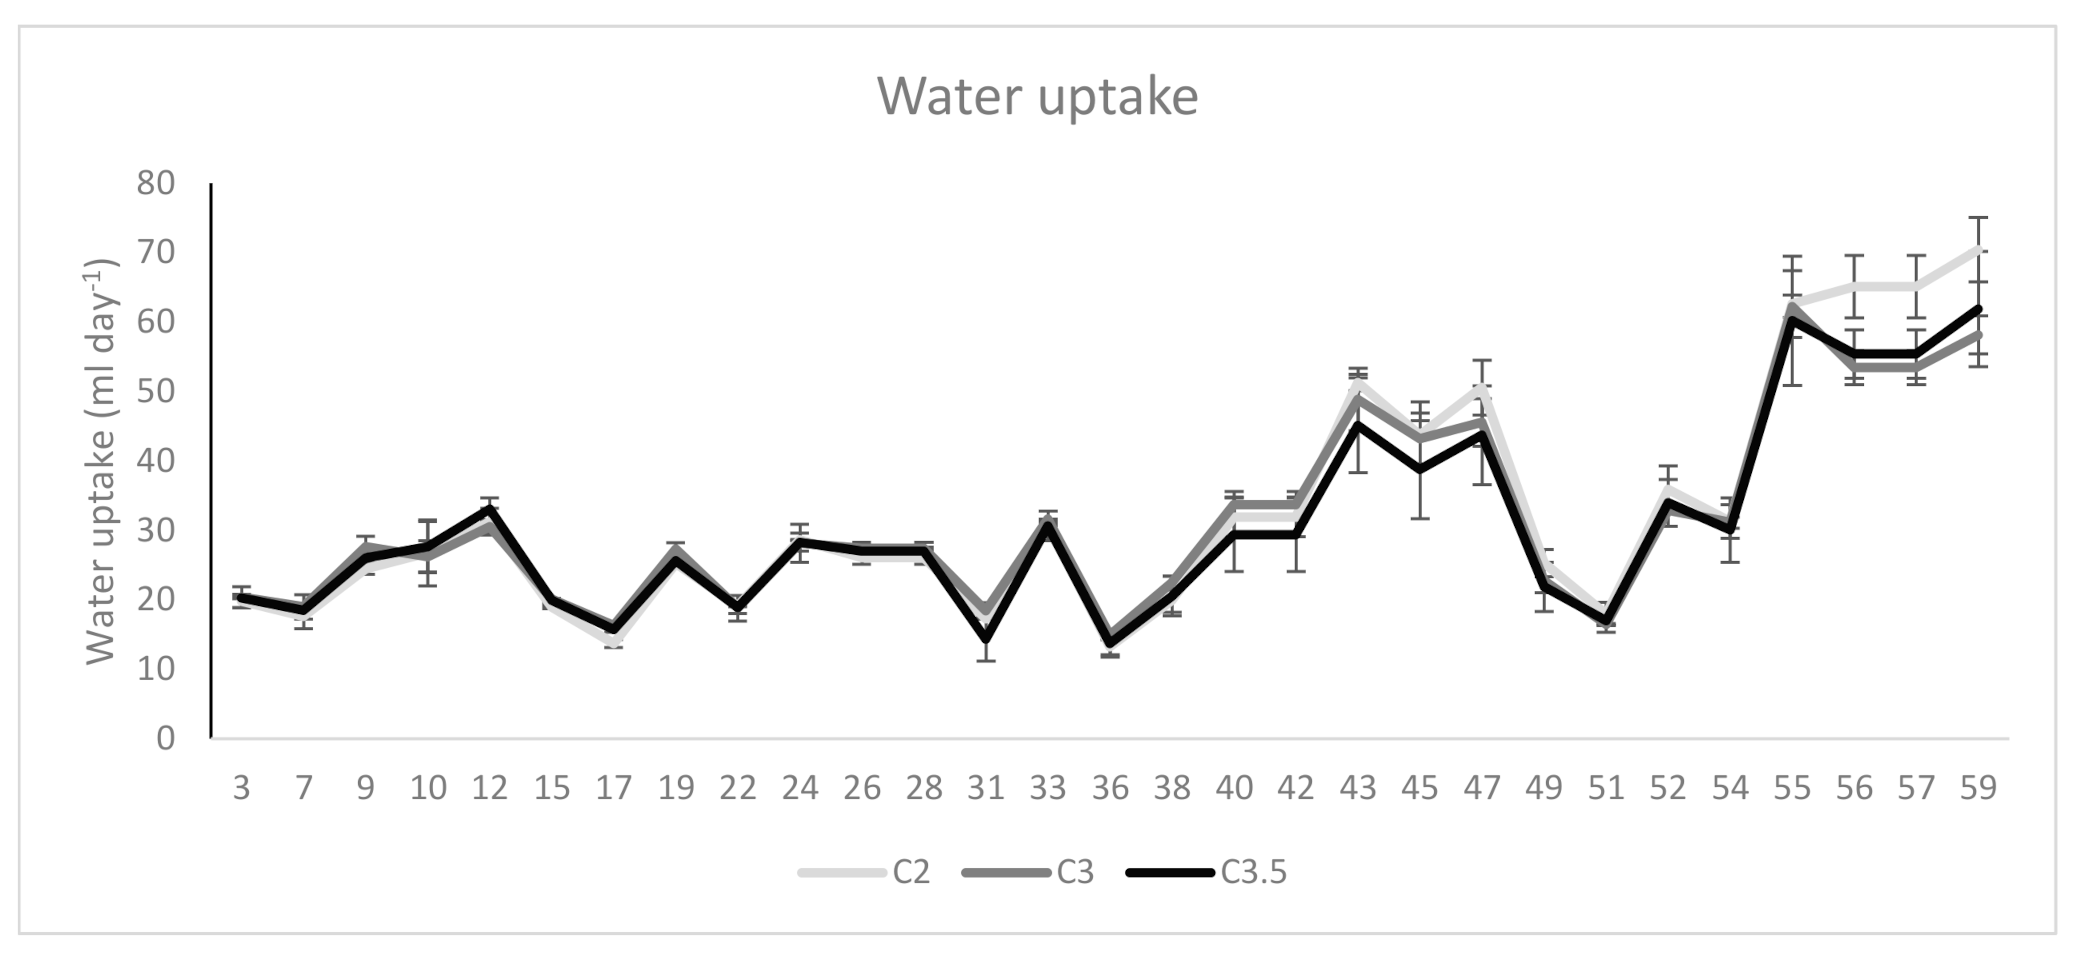
Figure 4.
Water uptake during the day after transplanting for the C2 (fertigation EC 2.0 dS m−1), C3.0 (fertigation EC 3.0 dS m−1), and C3.5 (fertigation EC 3.5 dS m−1) treatments.
Figure 4.
Water uptake during the day after transplanting for the C2 (fertigation EC 2.0 dS m−1), C3.0 (fertigation EC 3.0 dS m−1), and C3.5 (fertigation EC 3.5 dS m−1) treatments.
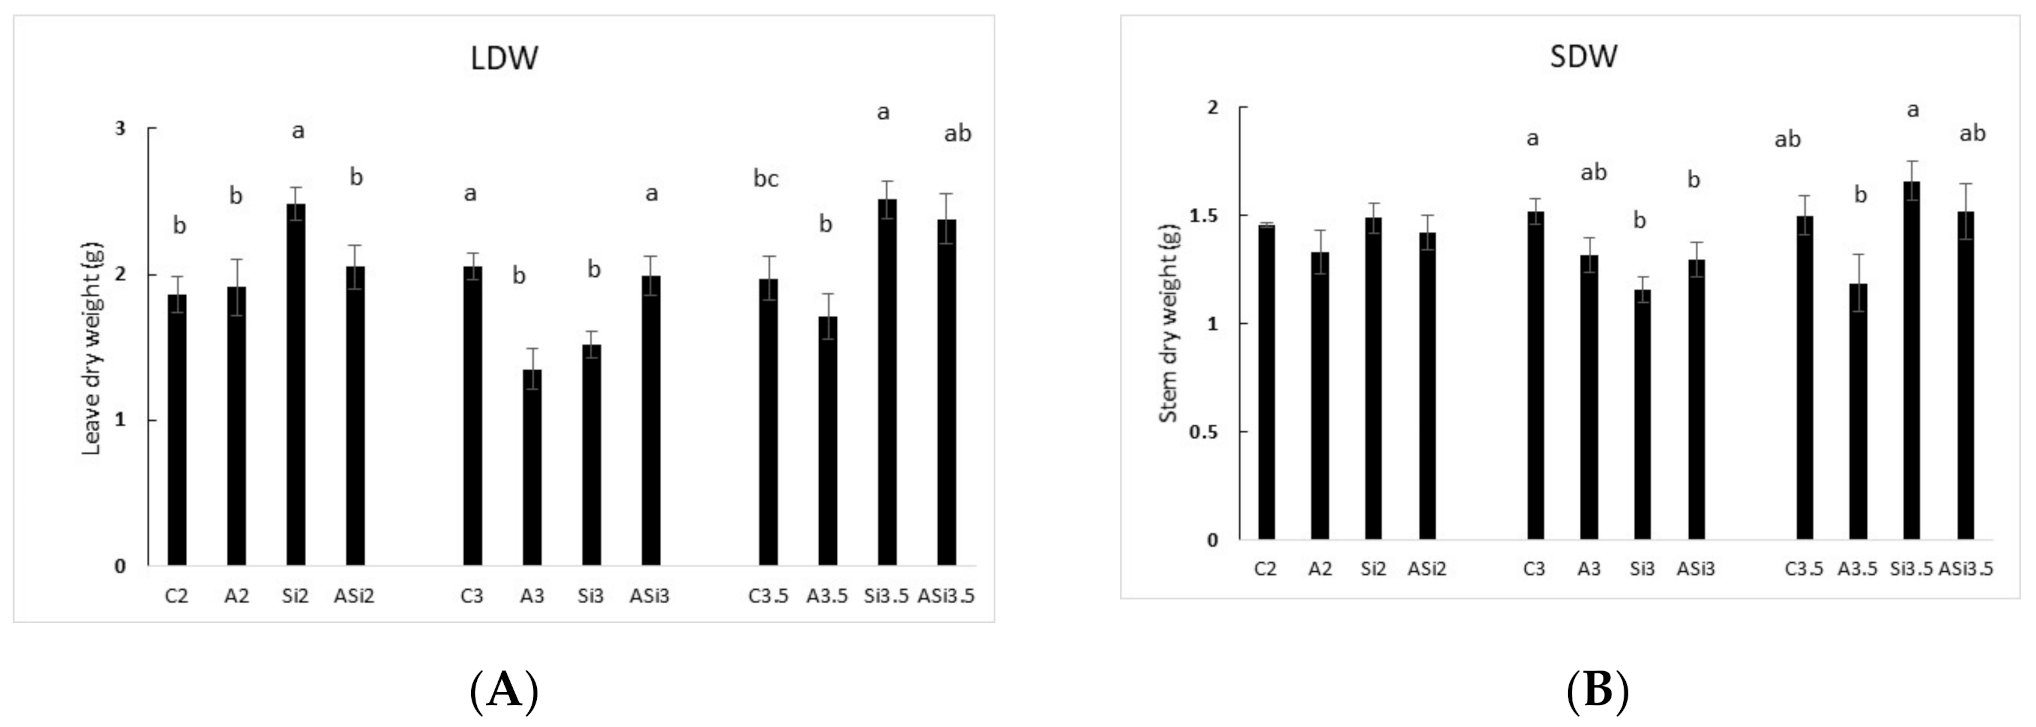
Figure 5.
LDW (A) and SDW (B) (g) at the end of the trial for the C2 (foliar application with water and fertigation EC 2.0 dS m−1), A2 (foliar application with Arthrospira platensis and fertigation EC 2.0 dS m−1), Si2 (foliar application with Si and fertigation EC 2.0 dS m−1), ASi2 (foliar application with Arthrospira platensis and Si, and fertigation EC 2.0 dS m−1), C3.0 (foliar application with water and fertigation EC 3.0 dS m−1), A3.0 (foliar application with Arthrospira platensis and fertigation EC 3.0 dS m−1), Si3 (foliar application with Si and fertigation EC 3.0 dS m−1), ASi3 (foliar application with Si and Arthrospira platensis, and fertigation EC 3.0 dS m−1) treatments; C3.5 (foliar application with water and fertigation EC 3.5 dS m−1), A3.5 (foliar application with Arthrospira platensis and fertigation EC 3.5 dS m−1), Si3.5 (foliar application with Si and fertigation EC 3.5 dS m−1), and ASi3.5 (foliar application with Si and Arthrospira platensis, and fertigation EC 3.5 dS m−1) treatments. Different letters indicate significant differences between treatments at the p < 0.05 level using the LSD test. Values are the means of 12 plants. Error bars show standard deviations.
![Agronomy 10 01713 g005]()
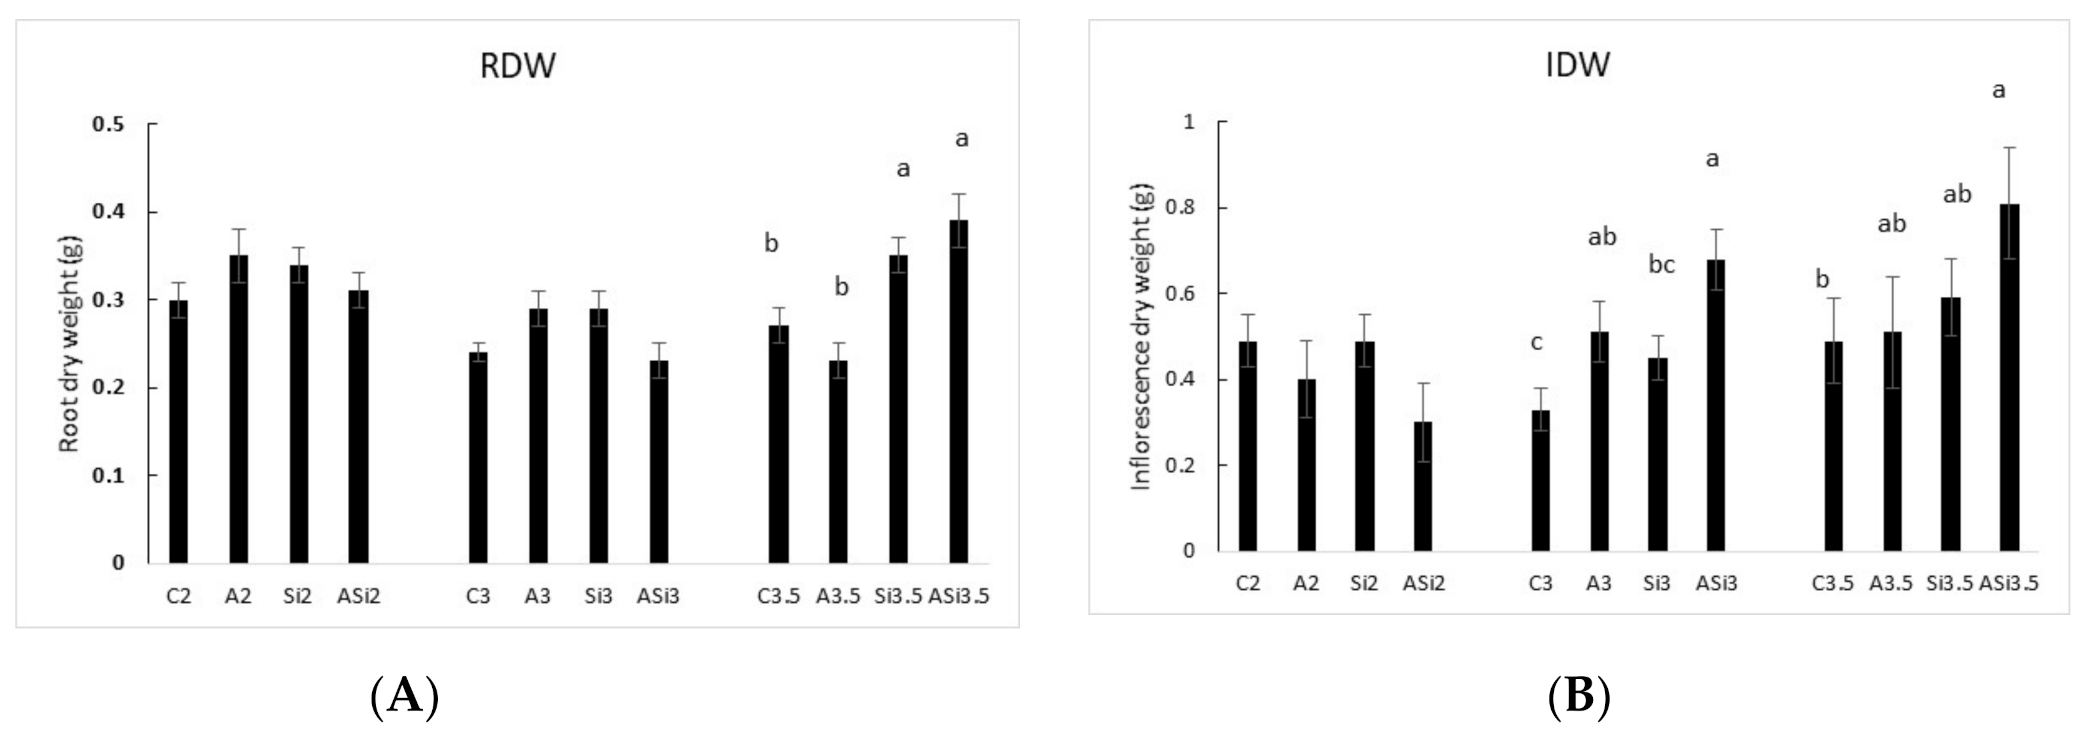
Figure 6.
RDW (A) and IDW (B) (g) at the end of the trial for the C2 (foliar application with water and fertigation EC 2.0 dS m−1), A2 (foliar application with Arthrospira platensis and fertigation EC 2.0 dS m−1), Si2 (foliar application with Si and fertigation EC 2.0 dS m−1), ASi2 (foliar application with Arthrospira platensis and Si, and fertigation EC 2.0 dS m−1), C3.0 (foliar application with water and fertigation EC 3.0 dS m−1), A3.0 (foliar application with Arthrospira platensis and fertigation EC 3.0 dS m−1), Si3 (foliar application with Si and fertigation EC 3.0 dS m−1), ASi3 (foliar application with Si and Arthrospira platensis, and fertigation EC 3.0 dS m−1) treatments; C3.5 (foliar application with water and fertigation EC 3.5 dS m−1), A3.5 (foliar application with Arthrospira platensis and fertigation EC 3.5 dS m−1), Si3.5 (foliar application with Si and fertigation EC 3.5 dS m−1), and ASi3.5 (foliar application with Si and Arthrospira platensis, and fertigation EC 3.5 dS m−1) treatments. Different letters indicate significant differences between treatments at the p < 0.05 level using the LSD test. Values are the means of 12 plants. Error bars show standard deviations.
![Agronomy 10 01713 g006]()
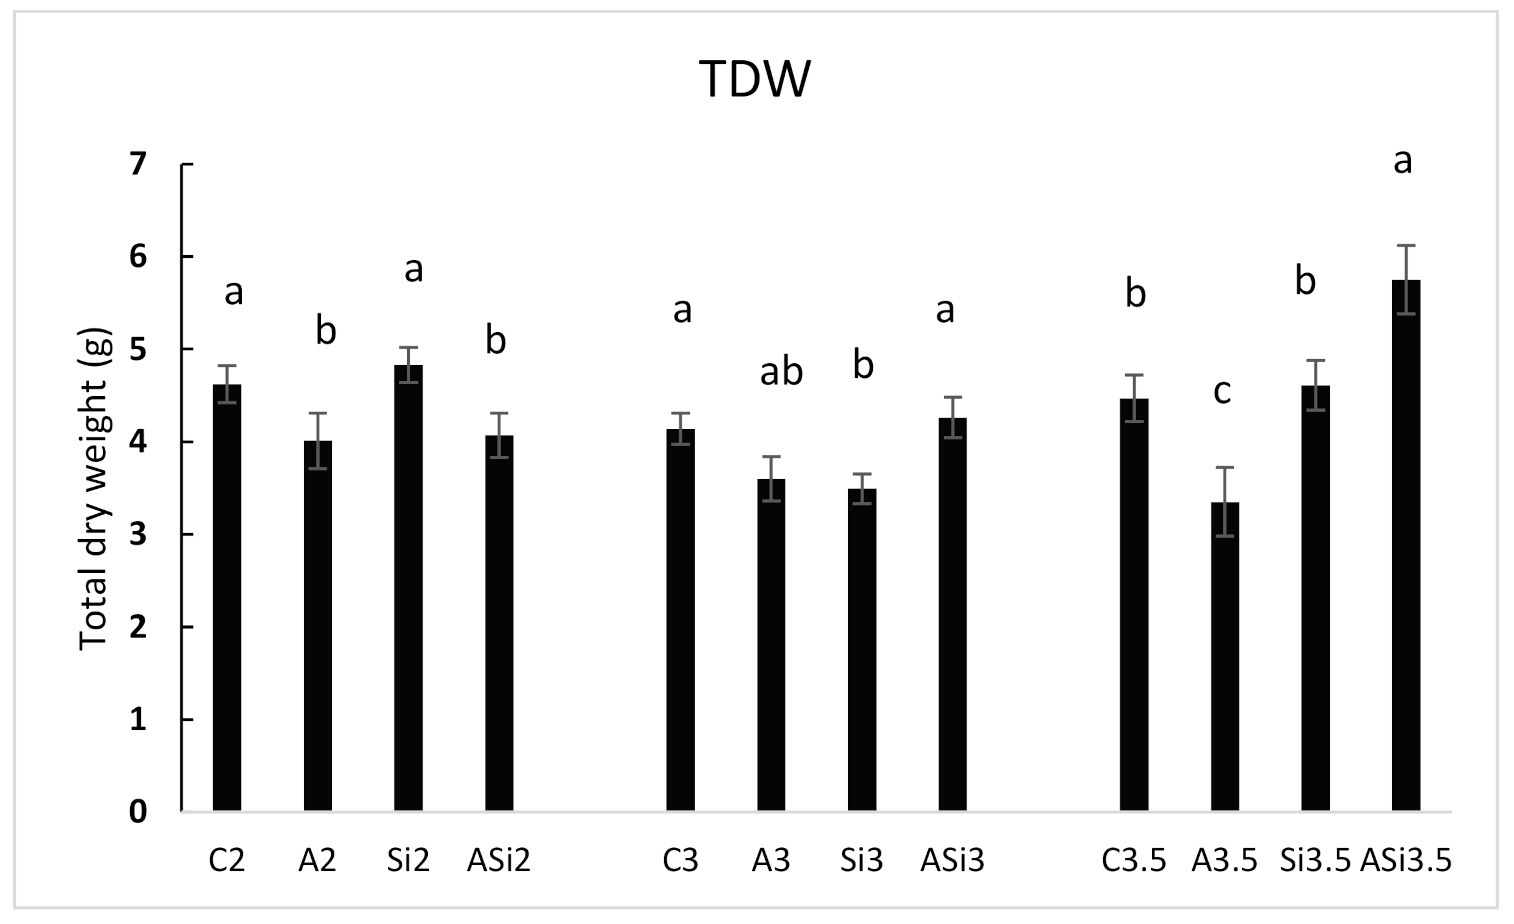
Figure 7.
TDW (g) at the end of the trial for the C2 (foliar application with water and fertigation EC 2.0 dS m−1), A2 (foliar application with Arthrospira platensis and fertigation EC 2.0 dS m−1), Si2 (foliar application with Si and fertigation EC 2.0 dS m−1), ASi2 (foliar application with Arthrospira platensis and Si, and fertigation EC 2.0 dS m−1), C3.0 (foliar application with water and fertigation EC 3.0 dS m−1), A3.0 (foliar application with Arthrospira platensis and fertigation EC 3.0 dS m−1), Si3 (foliar application with Si and fertigation EC 3.0 dS m−1), ASi3 (foliar application with Si and Arthrospira platensis, and fertigation EC 3.0 dS m−1) treatments; C3.5 (foliar application with water and fertigation EC 3.5 dS m−1), A3.5 (foliar application with Arthrospira platensis and fertigation EC 3.5 dS m−1), Si3.5 (foliar application with Si and fertigation EC 3.5 dS m−1), and ASi3.5 (foliar application with Si and Arthrospira platensis, and fertigation EC 3.5 dS m−1) treatments. Different letters indicate significant differences between treatments at the p < 0.05 level using the LSD test. Values are the means of 12 plants. Error bars show standard deviations.
![Agronomy 10 01713 g007]()
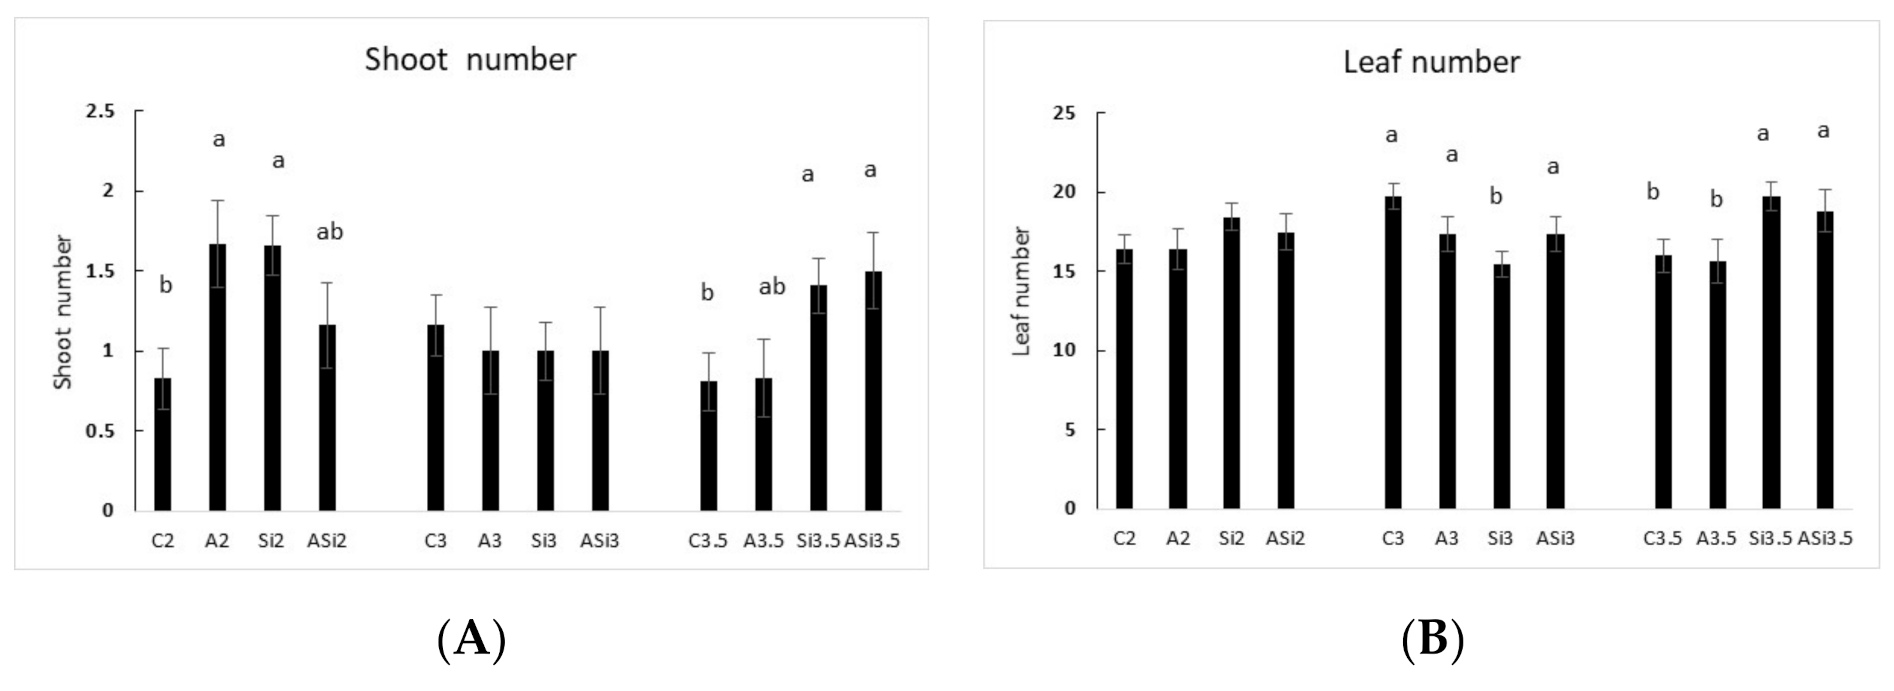
Figure 8.
Shoot number (A) and leaf number (B) at the end of the trial for the C2 (foliar application with water and fertigation EC 2.0 dS m−1), A2 (foliar application with Arthrospira platensis and fertigation EC 2.0 dS m−1), Si2 (foliar application with Si and fertigation EC 2.0 dS m−1), ASi2 (foliar application with Arthrospira platensis and Si, and fertigation EC 2.0 dS m−1), C3.0 (foliar application with water and fertigation EC 3.0 dS m−1), A3.0 (foliar application with Arthrospira platensis and fertigation EC 3.0 dS m−1), Si3 (foliar application with Si and fertigation EC 3.0 dS m−1), ASi3 (foliar application with Si and Arthrospira platensis, and fertigation EC 3.0 dS m−1) treatments; C3.5 (foliar application with water and fertigation EC 3.5 dS m−1), A3.5 (foliar application with Arthrospira platensis and fertigation EC 3.5 dS m−1), Si3.5 (foliar application with Si and fertigation EC 3.5 dS m−1), and ASi3.5 (foliar application with Si and Arthrospira platensis, and fertigation EC 3.5 dS m−1) treatments. Different letters indicate significant differences between treatments at the p < 0.05 level using the LSD test. Values are the means of 12 plants. Error bars show standard deviations.
![Agronomy 10 01713 g008]()
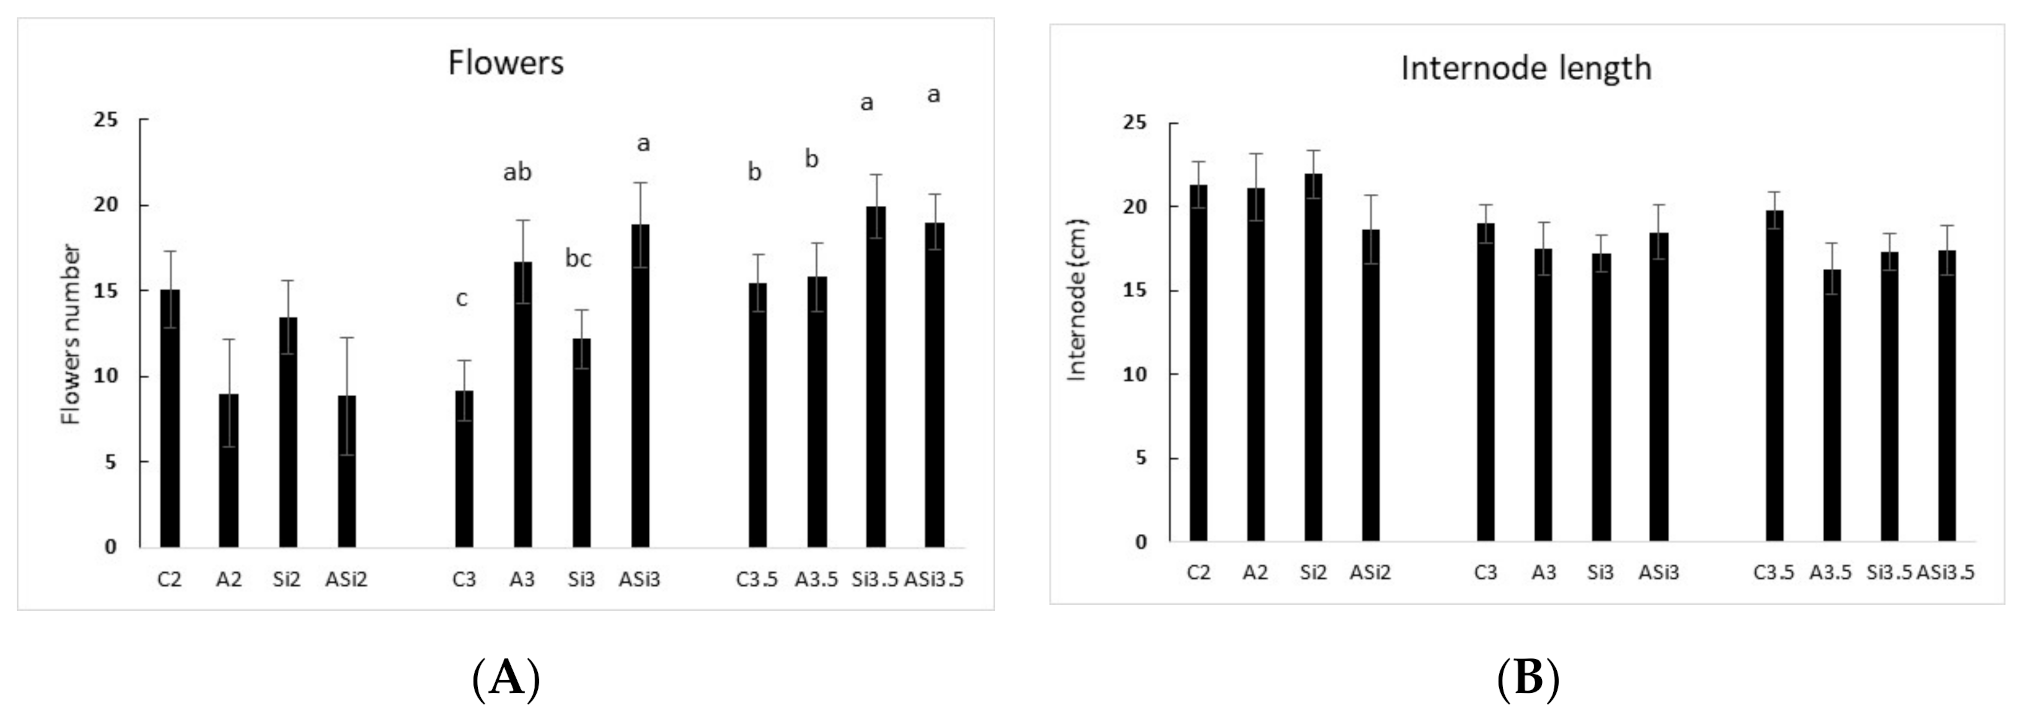
Figure 9.
Flower number (A) and internode length (B) at the end of the trial for the C2 (foliar application with water and fertigation EC 2.0 dS m−1), A2 (foliar application with Arthrospira platensis and fertigation EC 2.0 dS m−1), Si2 (foliar application with Si and fertigation EC 2.0 dS m−1), ASi2 (foliar application with Arthrospira platensis and Si, and fertigation EC 2.0 dS m−1), C3.0 (foliar application with water and fertigation EC 3.0 dS m−1), A3.0 (foliar application with Arthrospira platensis and fertigation EC 3.0 dS m−1), Si3 (foliar application with Si and fertigation EC 3.0 dS m−1), ASi3 (foliar application with Si and Arthrospira platensis, and fertigation EC 3.0 dS m−1) treatments; C3.5 (foliar application with water and fertigation EC 3.5 dS m−1), A3.5 (foliar application with Arthrospira platensis and fertigation EC 3.5 dS m−1), Si3.5 (foliar application with Si and fertigation EC 3.5 dS m−1), and ASi3.5 (foliar application with Si and Arthrospira platensis, and fertigation EC 3.5 dS m−1) treatments. Different letters indicate significant differences between treatments at the p < 0.05 level using the LSD test. Values are the means of 12 plants. Error bars show standard deviations.
![Agronomy 10 01713 g009]()
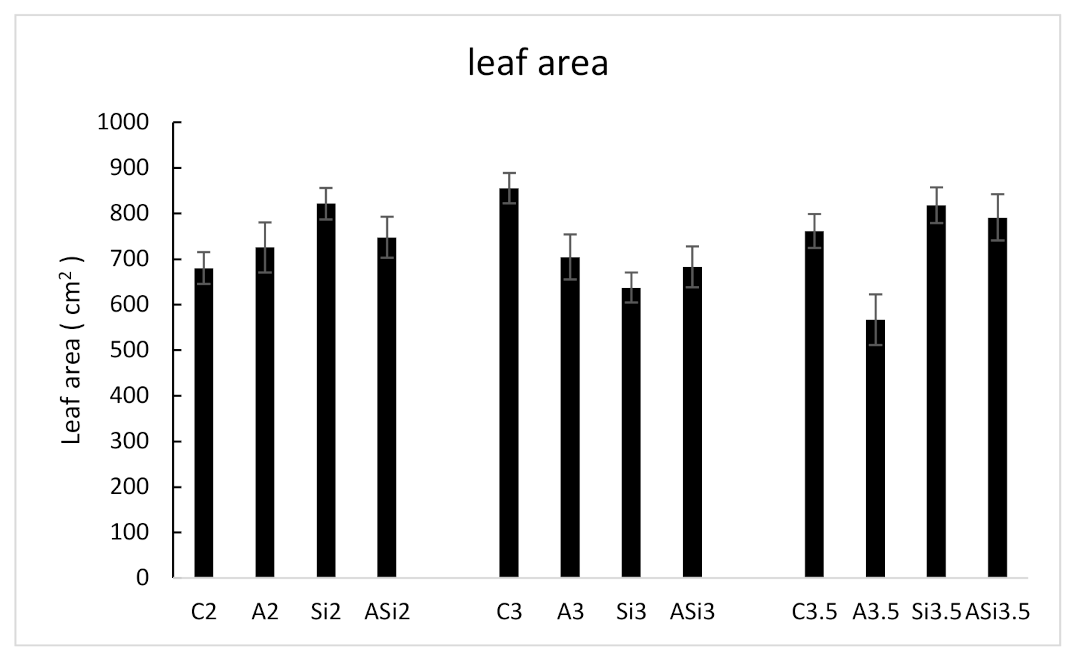
Figure 10.
Leaf area at the end of the trial for the C2 (foliar application with water and fertigation EC 2.0 dS m−1), A2 (foliar application with Arthrospira platensis and fertigation EC 2.0 dS m−1), Si2 (foliar application with Si and fertigation EC 2.0 dS m−1), ASi2 (foliar application with Arthrospira platensis and Si and fertigation EC 2.0 dS m−1), C3.0 (foliar application with water and fertigation EC 3.0 dS m−1), A3.0 (foliar application with Arthrospira platensis and fertigation EC 3.0 dS m−1), Si3 (foliar application with Si and fertigation EC 3.0 dS m−1), ASi3 (foliar application with Si and Arthrospira platensis, and fertigation EC 3.0 dS m−1) treatments; C3.5 (foliar application with water and fertigation EC 3.5 dS m−1), A3.5 (foliar application with Arthrospira platensis and fertigation EC 3.5 dS m−1), Si3.5 (foliar application with Si and fertigation EC 3.5 dS m−1), and ASi3.5 (foliar application with Si and Arthrospira platensis, and fertigation EC 3.5 dS m−1) treatments. Different letters indicate significant differences between treatments at the p < 0.05 level using the LSD test. Values are the means of 12 plants. Error bars show standard deviations.
![Agronomy 10 01713 g010]()
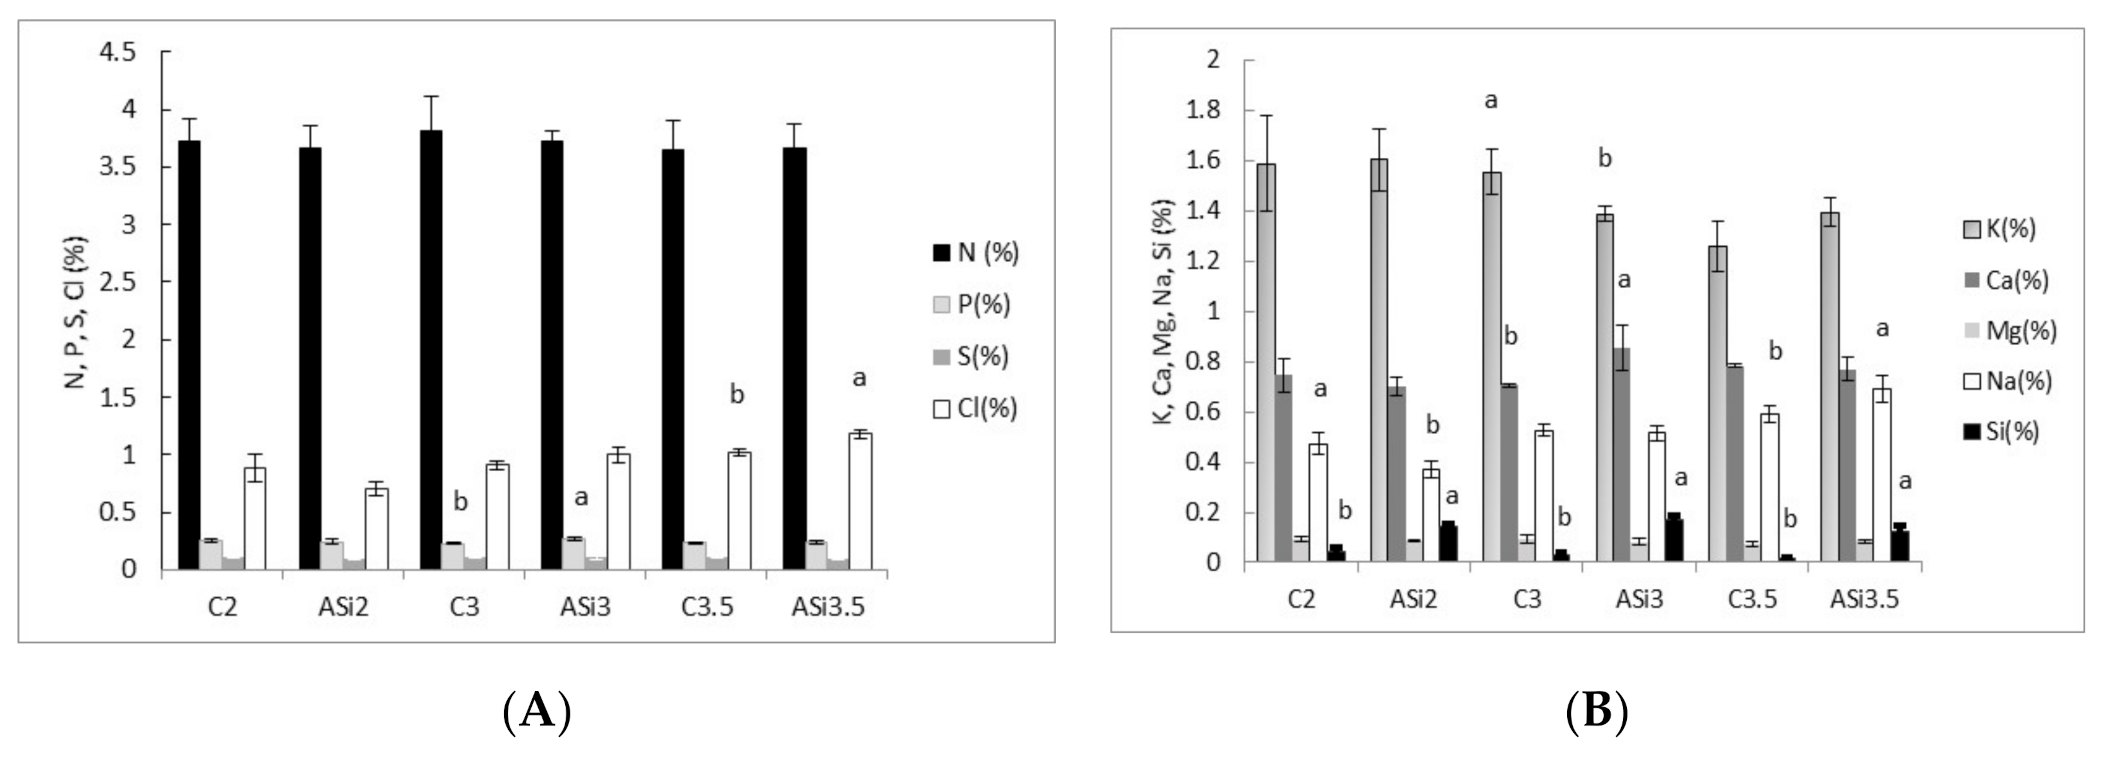
Figure 11.
N, P, S, and Cl (A) and K, Ca, Mg, and Na (B) concentrations in the leaves (%) for the C2 (foliar application with water and fertigation EC 2.0 dS m−1), A2 (foliar application with Arthrospira platensis and fertigation EC 2.0 dS m−1), Si2 (foliar application with Si and fertigation EC 2.0 dS m−1), ASi2 (foliar application with Arthrospira platensis and Si, and fertigation EC 2.0 dS m−1), C3.0 (foliar application with water and fertigation EC 3.0 dS m−1), A3.0 (foliar application with Arthrospira platensis and fertigation EC 3.0 dS m−1), Si3 (foliar application with Si and fertigation EC 3.0 dS m−1), ASi3 (foliar application with Si and Arthrospira platensis, and fertigation EC 3.0 dS m−1) treatments; C3.5 (foliar application with water and fertigation EC 3.5 dS m−1), A3.5 (foliar application with Arthrospira platensis and fertigation EC 3.5 dS m−1), Si3.5 (foliar application with Si and fertigation EC 3.5 dS m−1), and ASi3.5 (foliar application with Si and Arthrospira platensis, and fertigation EC 3.5 dS m−1) treatments. Different letters indicate significant differences between treatments at the p < 0.05 level using the LSD test. Values are the means of 12 plants. Error bars show standard deviations.
![Agronomy 10 01713 g011]()
Table 1.
DW (g) of S, R, L, I and T at the end of the trial for the C2 (fertigation EC 2.0 dS m−1), C3.0 (fertigation EC 3.0 dS m−1), and C3.5 (fertigation EC 3.5 dS m−1) treatments. Different letters indicate significant differences between treatments at the p < 0.05 level using the LSD test. Values are the means of 12 plants.
| | SDW | RDW | LDW | IDW | TDW |
|---|
| C2 | 1.46 ± 0.01 | 0.30 ± 0.02 a | 1.85 ± 0.12 | 0.48 ± 0.06 | 4.62 ± 0.21 |
| C3 | 1.52 ± 0.06 | 0.24 ± 0.01 b | 2.04 ± 0.09 | 0.32 ± 0.05 | 4.14 ± 0.17 |
| C3.5 | 1.50 ± 0.09 | 0.27 ± 0.02 b | 1.97 ± 0.15 | 0.49 ± 0.10 | 4.47 ± 0.25 |
Table 2.
Leaf area, internode length, leaf, shoot, and flower numbers and width, and leaf length for the C2 (fertigation EC 2.0 dS m−1), C3.0 (fertigation EC 3.0 dS m−1), and C3.5 (fertigation EC 3.5 dS m−1) treatments. Different letters indicate significant differences between treatments at the p < 0.05 level using the LSD test. Values are the means of 12 plants.
| | Leaf Area | Leaf Number | Internode Lenght | Soot Number | Flower Number | Width Leaf | Length Leaf |
|---|
| C2 | 680 ± 34 b | 16.42 ± 0.89 b | 21.3 ± 1.42 | 0.83 ± 0.19 | 15.1 ± 2.24 | 12.52 ± 1.38 | 11.14 ± 1.49 |
| C3 | 855 ± 33 a | 19.72 ± 0.80 a | 18.97 ± 1.11 | 1.16 ± 0.19 | 9.16 ± 1.73 | 12.48 ± 0.52 | 11.33 ± 0.46 |
| C3.5 | 761 ± 37 b | 16.00 ± 1.04 b | 19.75 ± 1.11 | 0.81 ± 0.18 | 15.45 ± 1.64 | 12.33 ± 1.15 | 11.11 ± 1.03 |
Table 3.
N, P, S, Cl, K, Ca, Mg and Na concentration in the leaves at the end of the trial for the C2 (fertigation EC 2.0 dS m−1), C3.0 (fertigation EC 3.0 dS m−1), and C3.5 (fertigation EC 3.5 dS m−1) treatments. Different letters indicate significant differences between treatments at the p < 0.05 level using the LSD test. Values are the means of 12 plants.
| | N (%) | P (%) | S (%) | Cl (%) | K (%) | Ca (%) | Mg (%) | Na (%) |
|---|
| C2 | 3.72 ± 0.2 | 0.25 ± 0.01 | 0.11 ± 0.01 | 0.88 ± 0.11 | 1.59 ± 0.19 a | 0.75 ± 0.07 | 0.09 ± 0.01 | 0.47 ± 0.04 b |
| C3 | 3.82 ± 0.3 | 0.23 ± 0.01 | 0.11 ± 0.00 | 0.91 ± 0.03 | 1.55 ± 0.09 a | 0.71 ± 0.01 | 0.09 ± 0.02 | 0.53 ± 0.02 ab |
| C3.5 | 3.65 ± 0.25 | 0.23 ± 0.01 | 0.11 ± 0.00 | 1.02 ± 0.03 | 1.26 ± 0.10 b | 0.78 ± 0.01 | 0.07 ± 0.01 | 0.59 ± 0.03 a |


