
Kinetic Analysis of Thermal Degradation of Recycled Polypropylene and Polystyrene Mixtures Using Regenerated Catalyst from Fluidized Catalytic Cracking Process (FCC)


Abstract
:1. Introduction
2. Materials and Methods
2.1. Sample Collection
2.2. Characterization of Plastic Waste
2.3. Thermogravimetric Analysis
2.4. Kinetic Theory and Model Development
2.4.1. Method 1: Friedman (FR)
2.4.2. Method 2: Kissinger–Akahira–Sunose (KAS)
2.4.3. Method 3: Flynn–Wall–Ozawa (FWO)
2.4.4. Method 4: Starink (ST)
2.4.5. Method 5: Miura–Maki (MM)
2.5. Validation of the Models
2.6. Thermodynamic Parameters
3. Results
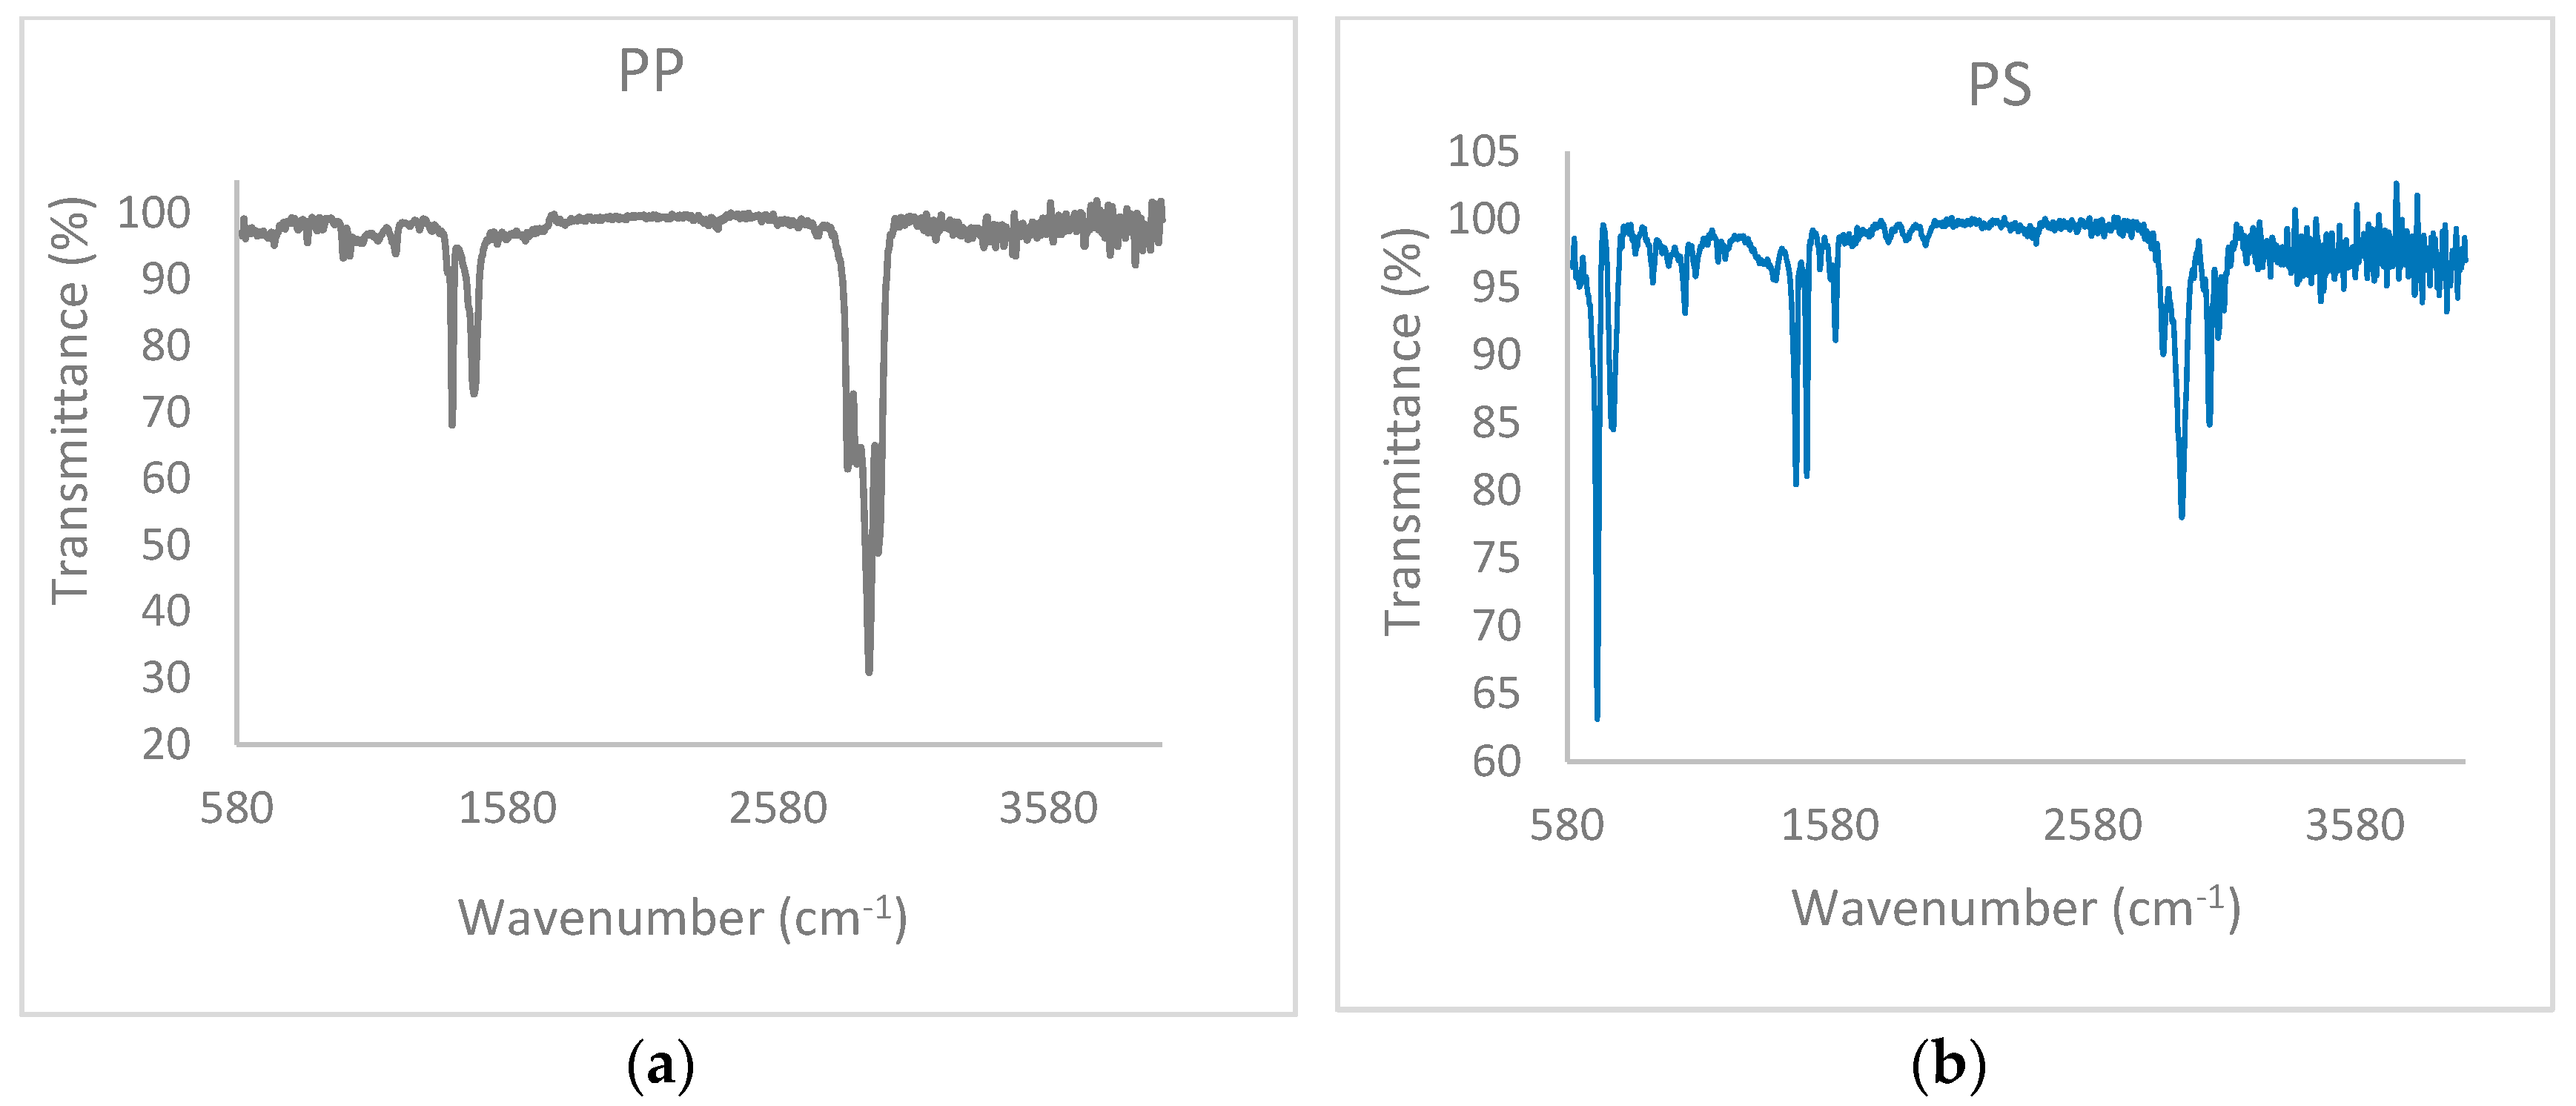
3.1. FTIR Analysis
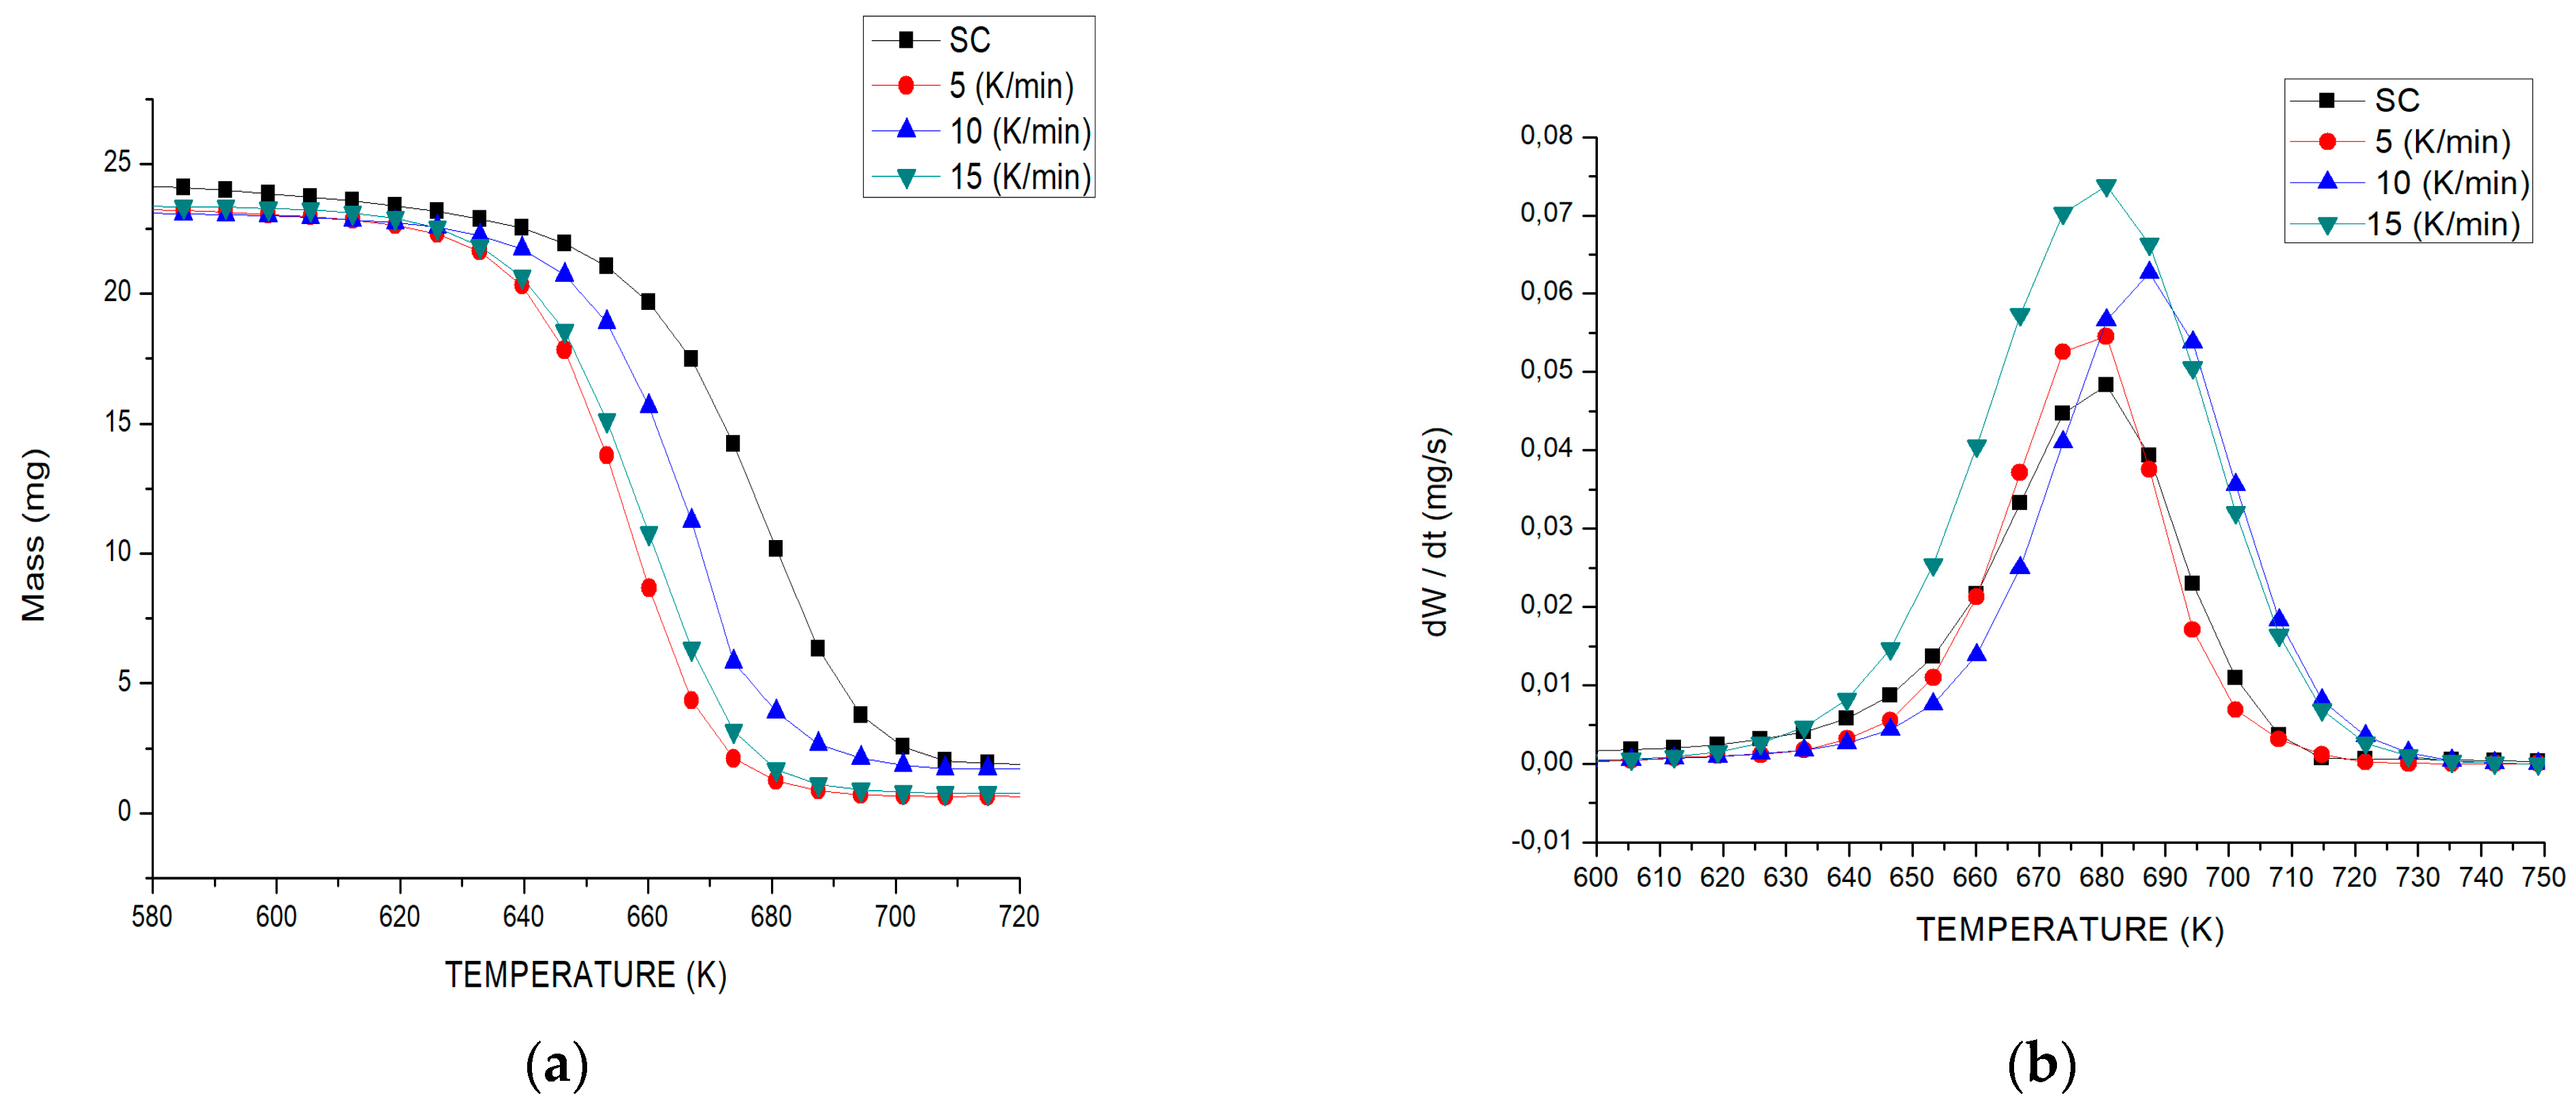
3.2. Thermogravimetric Analysis (TGA)
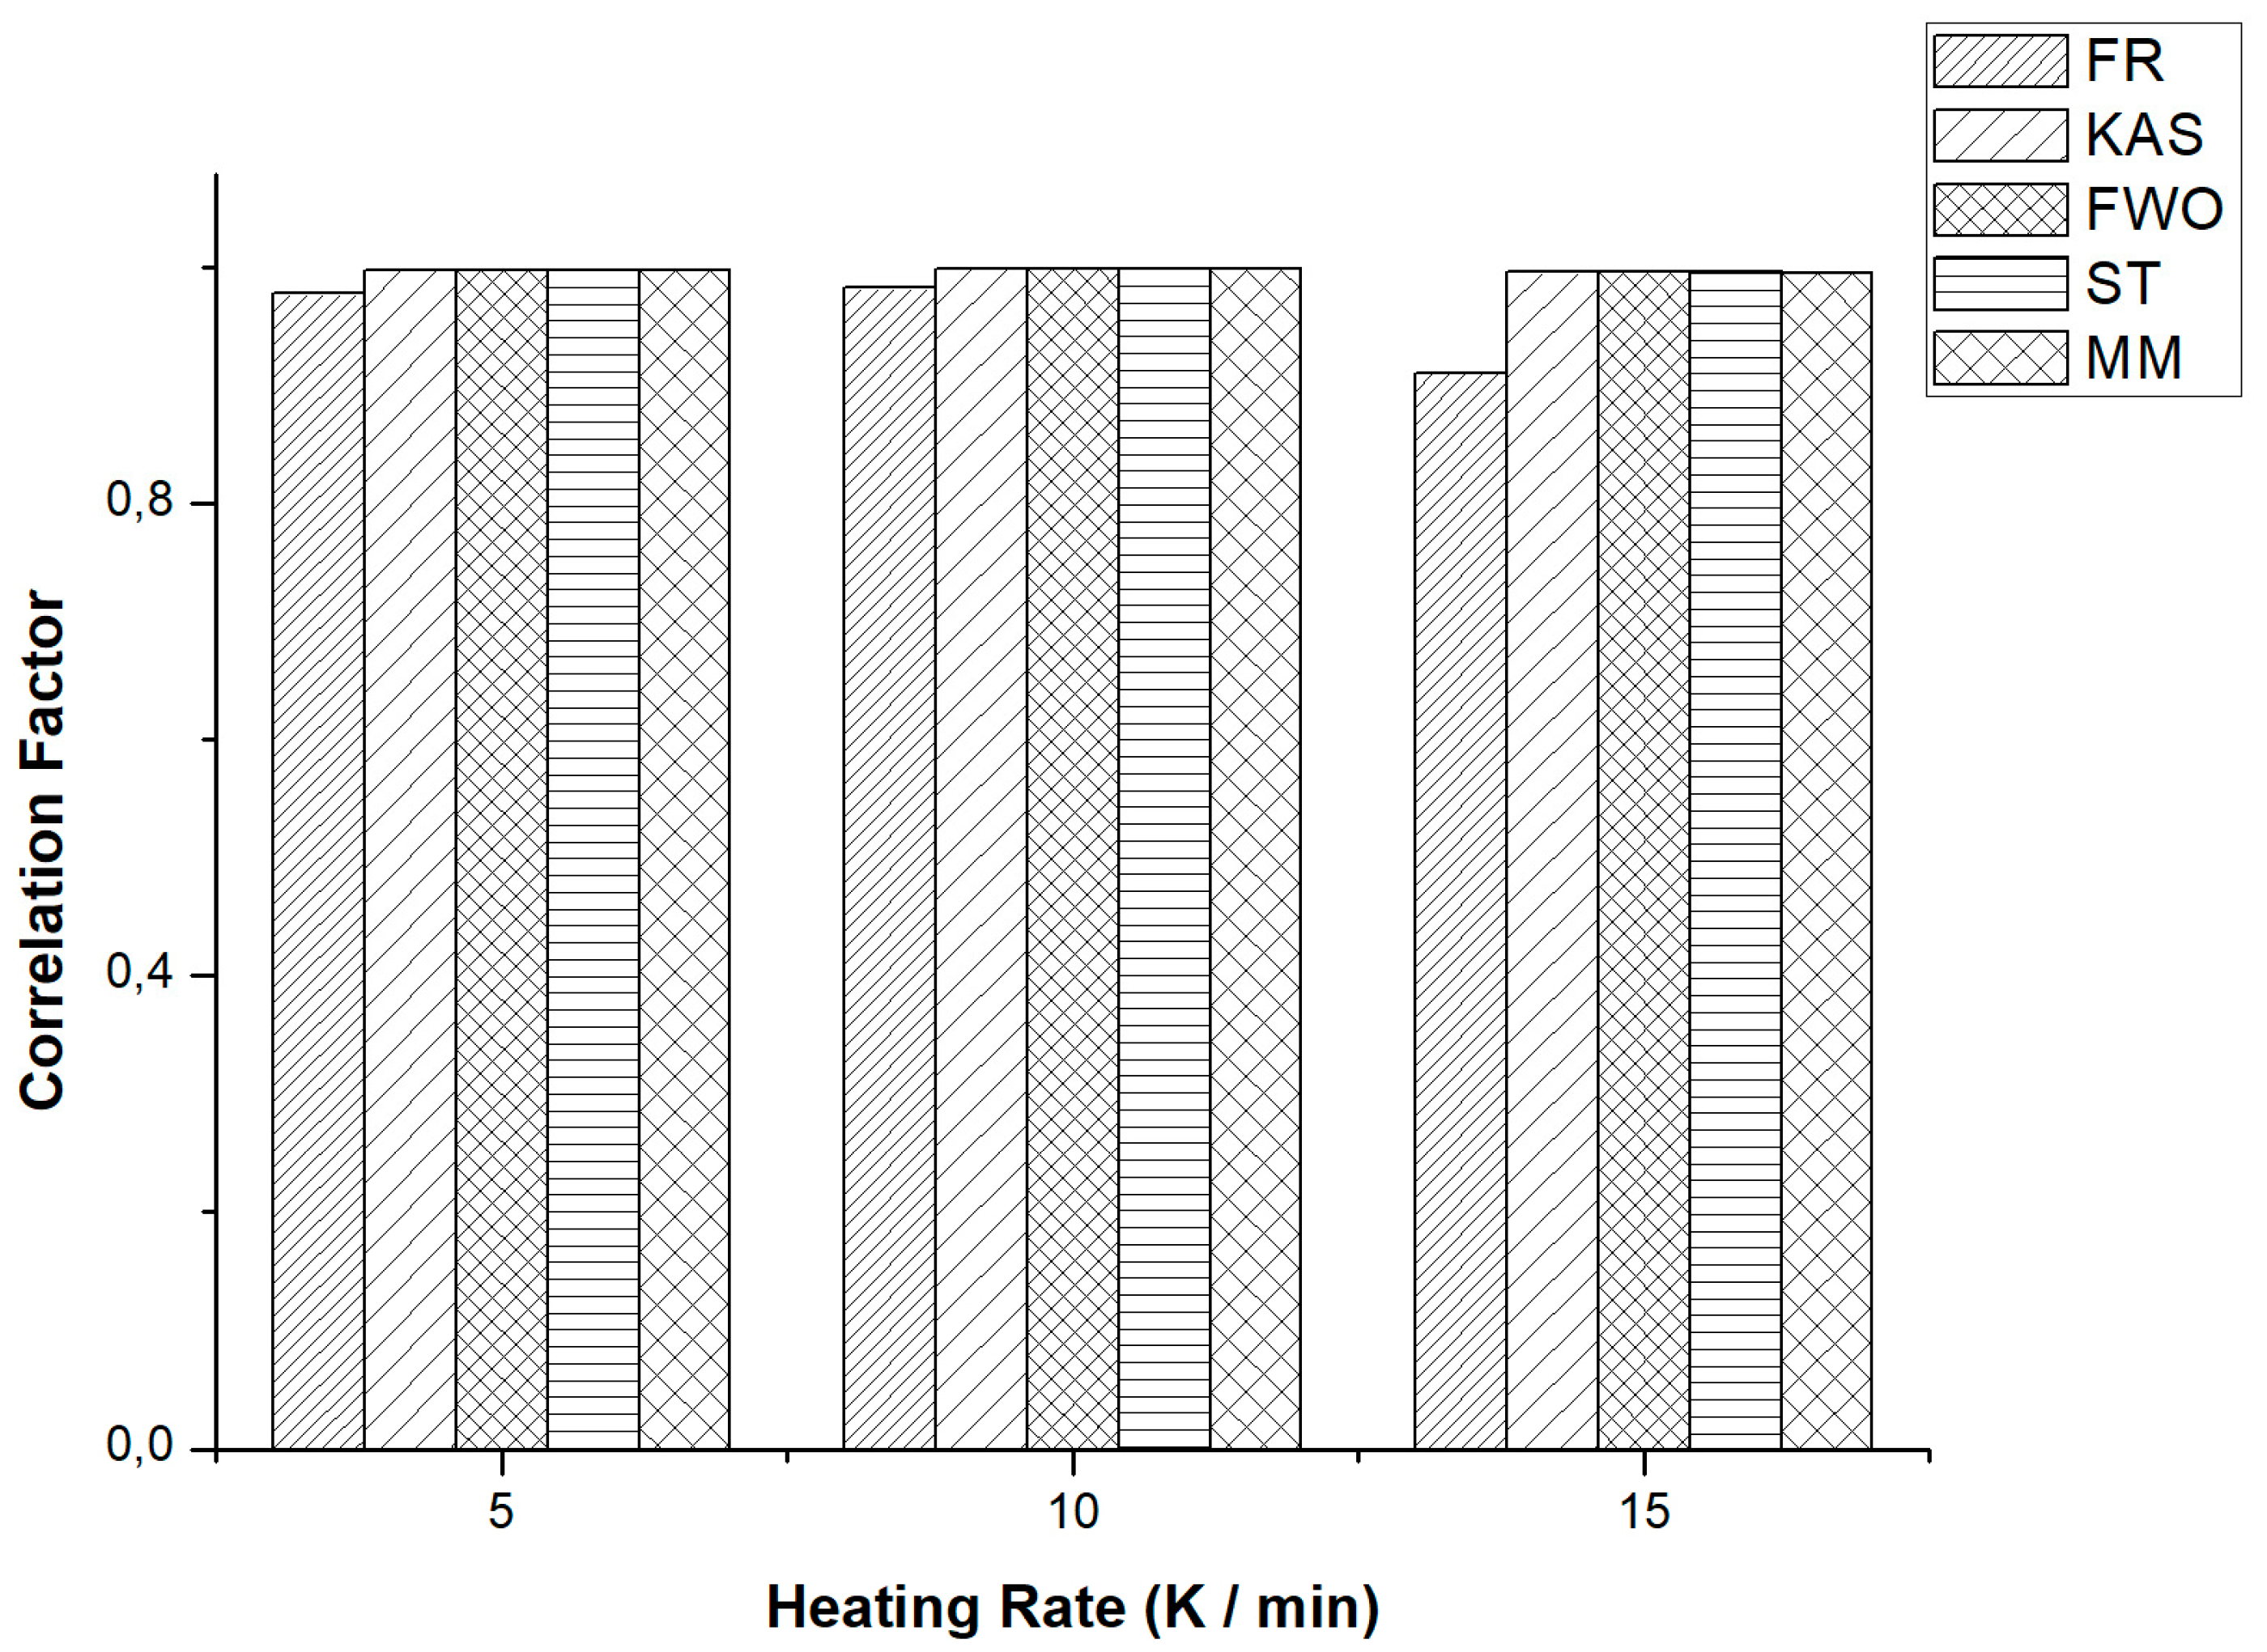
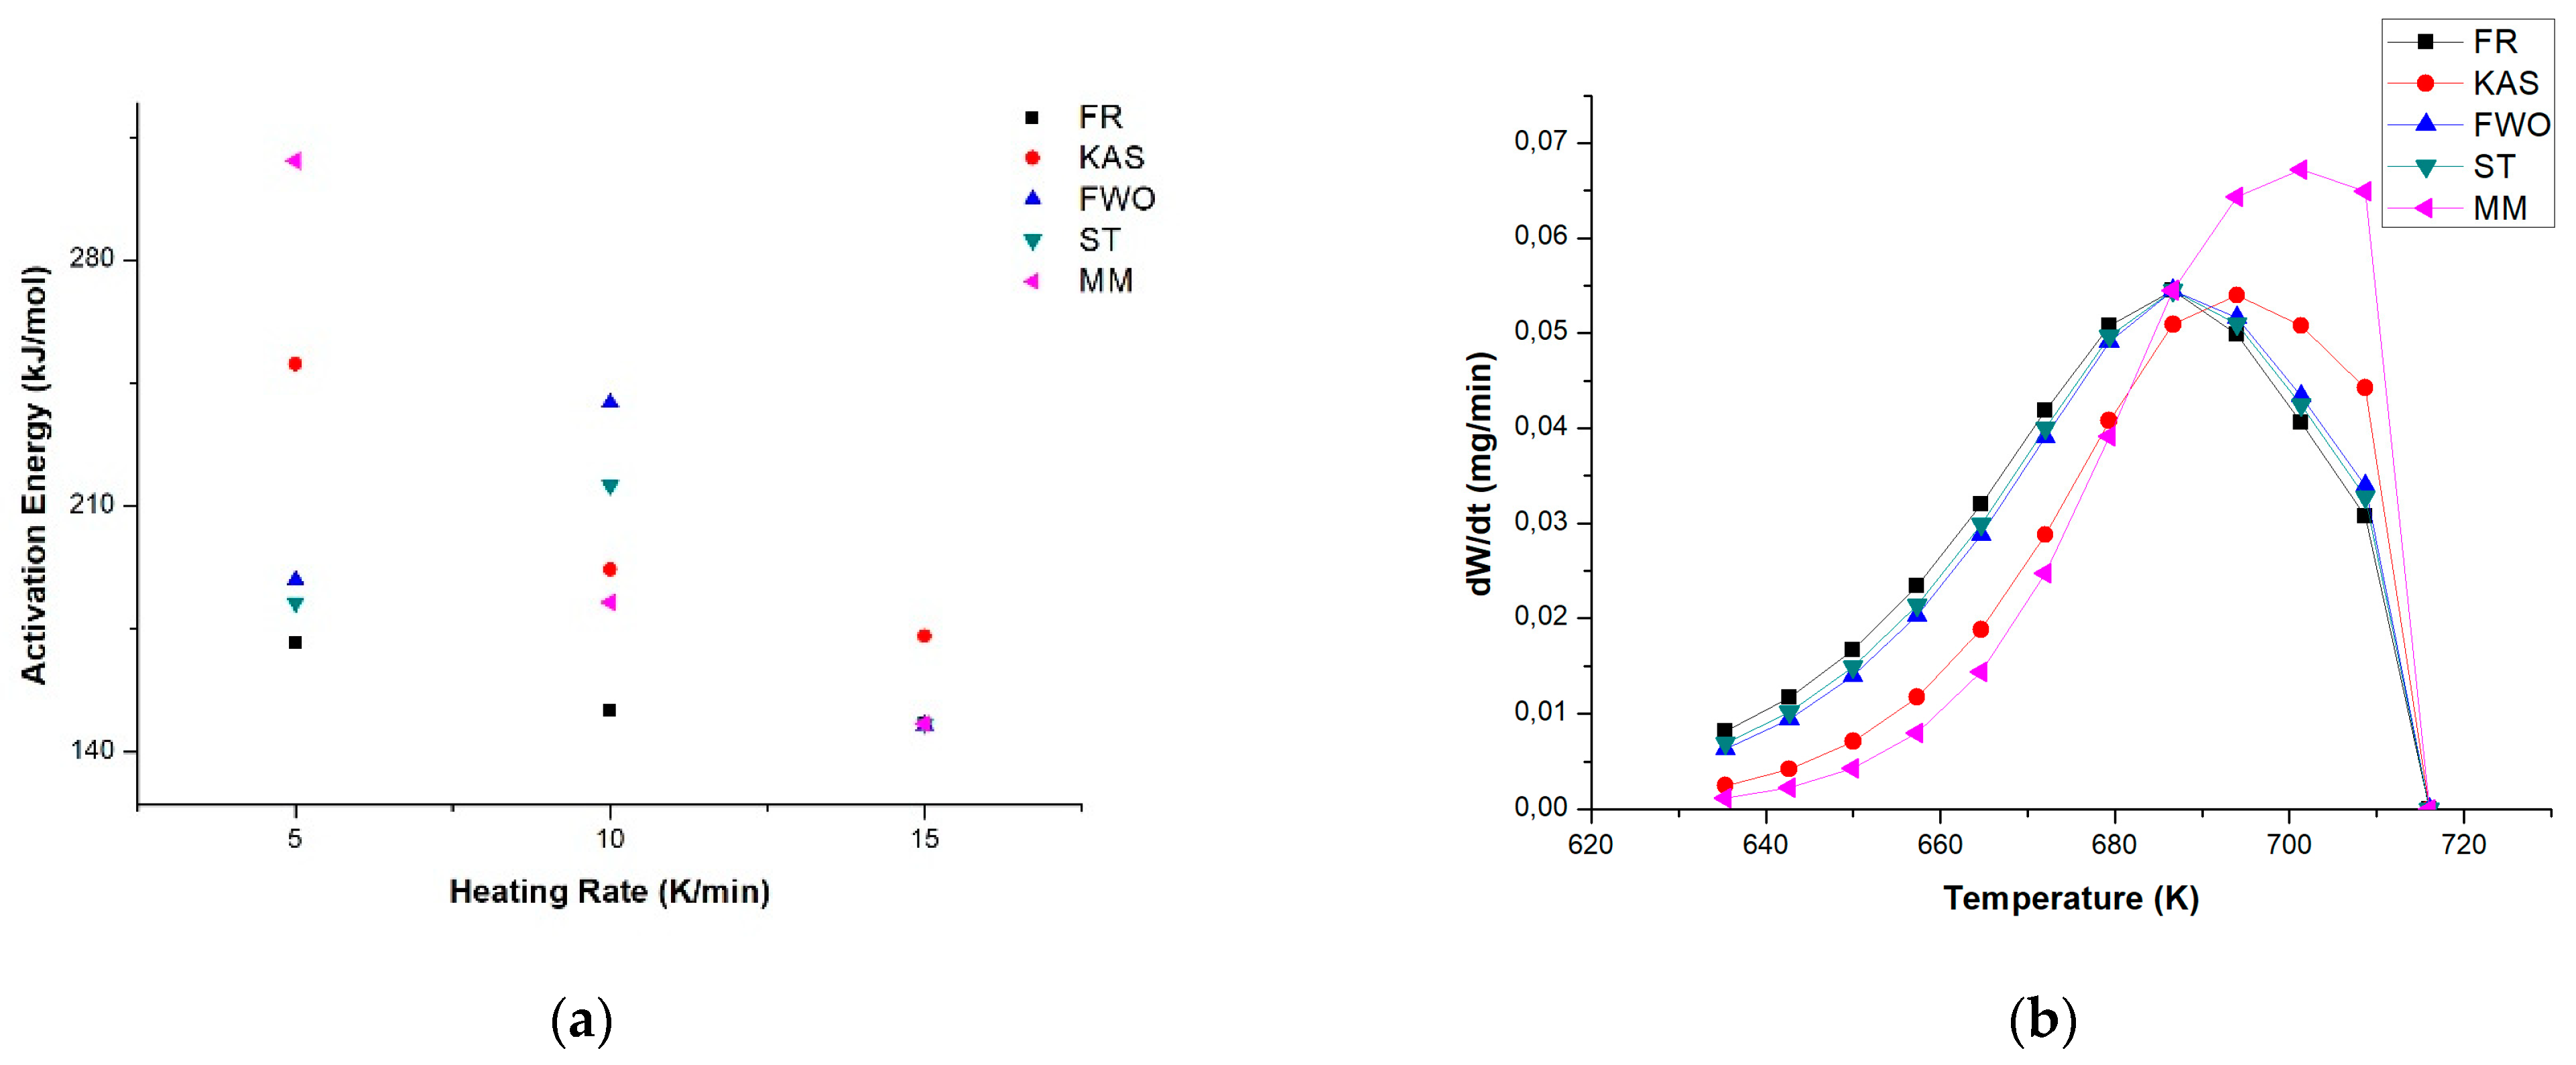
3.3. Kinetic Parameters
3.4. Thermodynamic Parameters
4. Conclusions
Author Contributions
Funding
Institutional Review Board Statement
Informed Consent Statement
Data Availability Statement
Conflicts of Interest
References
- Chen, Y.; Cui, Z.; Cui, X.; Liu, W.; Wang, X.; Li, X.; Li, S. Life cycle assessment of end-of-life treatments of waste plastics in China. Resour. Conserv. Recycl. 2019, 146, 348–357. [Google Scholar] [CrossRef]
- Borrelle, S.B.; Ringma, J.; Law, K.L.; Monnahan, C.C.; Lebreton, L.; Mcgivern, A.; Murphy, E.; Jambeck, J.; Leonard, G.H.; Hilleary, M.A.; et al. Predicted growth in plastic waste exceeds efforts to mitigate plastic pollution. Science 2020, 369, 1515–1518. [Google Scholar] [CrossRef] [PubMed]
- Lim, J.; Ahn, Y.; Kim, J. Optimal sorting and recycling of plastic waste as a renewable energy resource considering economic feasibility and environmental pollution. Process Saf. Environ. Prot. 2023, 169, 685–696. [Google Scholar] [CrossRef]
- Geyer, R.; Jambeck, J.R.; Law, K.L. Production, Use, and Fate of All Plastics Ever Made. 2017. Available online: http://advances.sciencemag.org/ (accessed on 19 July 2017).
- Vieira, O.; Ribeiro, R.S.; de Tuesta, J.L.D.; Gomes, H.T.; Silva, A.M.T. A systematic literature review on the conversion of plastic wastes into valuable 2D graphene-based materials. Chem. Eng. J. 2021, 428, 131399. [Google Scholar] [CrossRef]
- Aisien, E.T.; Otuya, I.C.; Aisien, F.A. Thermal and catalytic pyrolysis of waste polypropylene plastic using spent FCC catalyst. Environ. Technol. Innov. 2021, 22, 101455. [Google Scholar] [CrossRef]
- Das, P.; Tiwari, P. Thermal degradation kinetics of plastics and model selection. Thermochim. Acta 2017, 654, 191–202. [Google Scholar] [CrossRef]
- Das, S.; Liang, C.; Dunn, J.B. Plastics to fuel or plastics: Life cycle assessment-based evaluation of different options for pyrolysis at end-of-life. Waste Manag. 2022, 153, 81–88. [Google Scholar] [CrossRef]
- Aboulkas, A.; El harfi, K.; El Bouadili, A. Thermal degradation behaviors of polyethylene and polypropylene. Part I: Pyrolysis kinetics and mechanisms. Energy Convers. Manag. 2010, 51, 1363–1369. [Google Scholar]
- Koga, N.; Vyazovkin, S.; Burnham, A.K.; Favergeon, L.; Muravyev, N.V.; Perez-Maqueda, L.A.; Saggese, C.; Sánchez-Jiménez, P.E. ICTAC Kinetics Committee recommendations for analysis of thermal decomposition kinetics. Thermochim. Acta 2022, 719, 179384. [Google Scholar] [CrossRef]
- Nisar, J.; Ali, G.; Shah, A.; Shah, M.R.; Iqbal, M.; Ashiq, M.N.; Bhatti, H.N. Pyrolysis of Expanded Waste Polystyrene: Influence of Nickel-Doped Copper Oxide on Kinetics, Thermodynamics, and Product Distribution. Energy Fuels 2019, 33, 12666–12678. [Google Scholar] [CrossRef]
- Briceno, J.; Lemos, M.A.; Lemos, F. Kinetic analysis of the degradation of HDPE+PP polymer mixtures. Int. J. Chem. Kinet. 2021, 53, 660–674. [Google Scholar] [CrossRef]
- Chowlu, A.C.K.; Reddy, P.K.; Ghoshal, A.K. Pyrolytic decomposition and model-free kinetics analysis of mixture of polypropylene (PP) and low-density polyethylene (LDPE). Thermochim. Acta 2009, 485, 20–25. [Google Scholar] [CrossRef]
- Dubdub, I.; Al-Yaari, M. Pyrolysis of mixed plastic waste: I. kinetic study. Materials 2020, 13, 4912. [Google Scholar]
- Encinar, J.M.; González, J.F. Pyrolysis of synthetic polymers and plastic wastes. Kinetic study. Fuel Process. Technol. 2008, 89, 678–686. [Google Scholar] [CrossRef]
- Hu, Q.; Tang, Z.; Yao, D.; Yang, H.; Shao, J.; Chen, H. Thermal behavior, kinetics and gas evolution characteristics for the co-pyrolysis of real-world plastic and tyre wastes. J. Clean. Prod. 2020, 260, 121102. [Google Scholar] [CrossRef]
- Vyazovkin, S.; Burnham, A.K.; Criado, J.M.; Pérez-Maqueda, L.A.; Popescu, C.; Sbirrazzuoli, N. ICTAC Kinetics Committee recommendations for performing kinetic computations on thermal analysis data. Thermochim. Acta 2011, 520, 1–19. [Google Scholar] [CrossRef]
- Patnaik, S.; Kumar, S.; Panda, A.K. Thermal degradation of eco-friendly alternative plastics: Kinetics and thermodynamics analysis. Environ. Sci. Pollut. Res. 2020, 27, 14991–15000. [Google Scholar] [CrossRef]
- Martínez-Narro, G.; Royston, N.J.; Billsborough, K.L.; Phan, A.N. Kinetic modelling of mixed plastic waste pyrolysis. Chem. Thermodyn. Therm. Anal. 2023, 9, 100105. [Google Scholar] [CrossRef]
- Kim, Y.S.; Kim, Y.S.; Kim, S.H. Investigation of thermodynamic parameters in the thermal decomposition of plastic waste-waste lube oil compounds. Environ. Sci. Technol. 2010, 44, 5313–5317. [Google Scholar] [CrossRef]
- Diaz Silvarrey, L.S.; Phan, A.N. Kinetic study of municipal plastic waste. Int. J. Hydrog. Energy 2016, 41, 16352–16364. [Google Scholar] [CrossRef]
- Roussi, A.T.; Vouvoudi, E.C.; Achilias, D.S. Pyrolytic degradation kinetics of HIPS, ABS, PC and their blends with PP and PVC. Thermochim. Acta 2020, 690, 178705. [Google Scholar] [CrossRef]
- Dubdub, I.; Al-Yaari, M. Thermal behavior of mixed plastics at different heating rates: I. pyrolysis kinetics. Polymers 2021, 13, 3413. [Google Scholar] [PubMed]
- Park, K.B.; Jeong, Y.S.; Guzelciftci, B.; Kim, J.S. Two-stage pyrolysis of polystyrene: Pyrolysis oil as a source of fuels or benzene, toluene, ethylbenzene, and xylenes. Appl. Energy 2020, 259, 114240. [Google Scholar] [CrossRef]
- Li, Q.; Faramarzi, A.; Zhang, S.; Wang, Y.; Hu, X.; Gholizadeh, M. Progress in catalytic pyrolysis of municipal solid waste. Energy Convers. Manag. 2020, 226, 113525. [Google Scholar] [CrossRef]
- Miranda, R.; Yang, J.; Roy, C.; Vasile, C. Vacuum Pyrolysis of Commingled Plastics Containing PVC I. Kinetic Study. Available online: www.elsevier.nl/locate/polydegstab (accessed on 19 July 2017).
- Eimontas, J.; Striūgas, N.; Abdelnaby, M.A.; Yousef, S. Catalytic pyrolysis kinetic behavior and TG-FTIR-GC–MS analysis of metallized food packaging plastics with different concentrations of ZSM-5 zeolite catalyst. Polymers 2021, 13, 702. [Google Scholar] [CrossRef]
- Al-Salem, S.M. Thermal pyrolysis of high density polyethylene (HDPE) in a novel fixed bed reactor system for the production of high value gasoline range hydrocarbons (HC). Process Saf. Environ. Prot. 2019, 127, 171–179. [Google Scholar] [CrossRef]
- Xu, F.; Wang, B.; Yang, D.; Hao, J.; Qiao, Y.; Tian, Y. Thermal degradation of typical plastics under high heating rate conditions by TG-FTIR: Pyrolysis behaviors and kinetic analysis. Energy Convers. Manag. 2018, 171, 1106–1115. [Google Scholar] [CrossRef]
- Honus, S.; Kumagai, S.; Fedorko, G.; Molnár, V.; Yoshioka, T. Pyrolysis gases produced from individual and mixed PE, PP, PS, PVC, and PET—Part I: Production and physical properties. Fuel 2018, 221, 346–360. [Google Scholar] [CrossRef]


| Model | Heating Rate (K/min) | Model Equation | Ea (KJ/mol) | A (s−1) |
|---|---|---|---|---|
| KAS | 5 | 250.474 | 4.841 × 10¹⁷ | |
| 10 | 191.897 | 1.298 × 10¹³ | ||
| 15 | 172.921 | 5.380 × 10¹¹ | ||
| FWO | 5 | 188.916 | 1.076 × 10¹³ | |
| 10 | 239.596 | 4.102 × 10¹⁶ | ||
| 15 | 147.728 | 6.987 × 10¹¹ | ||
| FR | 5 | 170.836 | 4.533 × 10¹¹ | |
| 10 | 151.663 | 1.216 × 10¹⁰ | ||
| 15 | 148.172 | 7.448 × 10⁹ | ||
| ST | 5 | 188.715 | 1.039 × 10¹³ | |
| 10 | 215.937 | 8.604 × 10¹⁴ | ||
| 15 | 148.157 | 7.428 × 10¹⁴ | ||
| MM | 5 | 308.343 | 1.309 × 10²² | |
| 10 | 182.589 | 2.586 × 10¹² | ||
| 15 | 148.012 | 7.245 × 10⁹ |
| Β (K min−1) | Ea (kJ mol−1) | A (s−1) | ∆H (kJ mol−1) | ∆G (kJ mol−1) | ∆S (kJ mol−1) |
|---|---|---|---|---|---|
| 5 | 188.715 | 1.039 × 10¹³ | 1.830 × 10² | 1.905 × 10² | −1.098 × 10⁻² |
| 10 | 215.937 | 8.604 × 10¹⁴ | 2.102 × 10² | 1.931 × 10² | −2.463 × 10⁻² |
| 15 | 148.157 | 7.428 × 10¹⁴ | 1.424 × 10² | 1.920 × 10² | −7.130 × 10⁻² |
Disclaimer/Publisher’s Note: The statements, opinions and data contained in all publications are solely those of the individual author(s) and contributor(s) and not of MDPI and/or the editor(s). MDPI and/or the editor(s) disclaim responsibility for any injury to people or property resulting from any ideas, methods, instructions or products referred to in the content. |
© 2023 by the authors. Licensee MDPI, Basel, Switzerland. This article is an open access article distributed under the terms and conditions of the Creative Commons Attribution (CC BY) license (https://creativecommons.org/licenses/by/4.0/).
Share and Cite
Palmay, P.; Pillajo, L.; Andrade, M.; Medina, C.; Barzallo, D. Kinetic Analysis of Thermal Degradation of Recycled Polypropylene and Polystyrene Mixtures Using Regenerated Catalyst from Fluidized Catalytic Cracking Process (FCC). Polymers 2023, 15, 2035. https://doi.org/10.3390/polym15092035
Palmay P, Pillajo L, Andrade M, Medina C, Barzallo D. Kinetic Analysis of Thermal Degradation of Recycled Polypropylene and Polystyrene Mixtures Using Regenerated Catalyst from Fluidized Catalytic Cracking Process (FCC). Polymers. 2023; 15(9):2035. https://doi.org/10.3390/polym15092035
Chicago/Turabian StylePalmay, Paul, Leslie Pillajo, Mónica Andrade, Carlos Medina, and Diego Barzallo. 2023. "Kinetic Analysis of Thermal Degradation of Recycled Polypropylene and Polystyrene Mixtures Using Regenerated Catalyst from Fluidized Catalytic Cracking Process (FCC)" Polymers 15, no. 9: 2035. https://doi.org/10.3390/polym15092035