
Fungal Screening for Potential PET Depolymerization
 , and
, and
Abstract
:1. Introduction
2. Material and Methods
2.1. Microorganisms
2.1.1. Enzymatic Assays with PET nanoparticles
2.1.2. Assays to Detect Cutinase Production
Plate Tests with Cutin and Polycaprolactone (PCL) as the Sole Carbon Sources
- Polycaprolactone: 4 g (NH4)2SO4 (CAS 7783-20-2); 6 g KH2PO4 (CAS 7778-77-0); 0.2 g Na2HPO4 (CAS 7558-79-4); 1 mg FeSO4·7H2O (CAS 7782-63-0); 1 mg CaCl2 (CAS 10043-52-4); 10 µg H3BO3 (CAS 10043-35-3); 10 µg MnSO4 (CAS 10034-96-5); 70 µg ZnSO4 (CAS 7446-20-0); 50 µg CuSO4 (CAS 7758-98-7); 10 µg MoO3 (CAS 1313-27-5); 500 mg PCL (acetone:water); and 1 L distilled water [35].
2.2. PET Depolymerization Assays
2.3. Analysis of Post-Fermentation PET Fragments
2.3.1. Attenuated total reflectance/Fourier transform infrared spectroscopy (FTIR/ATR)
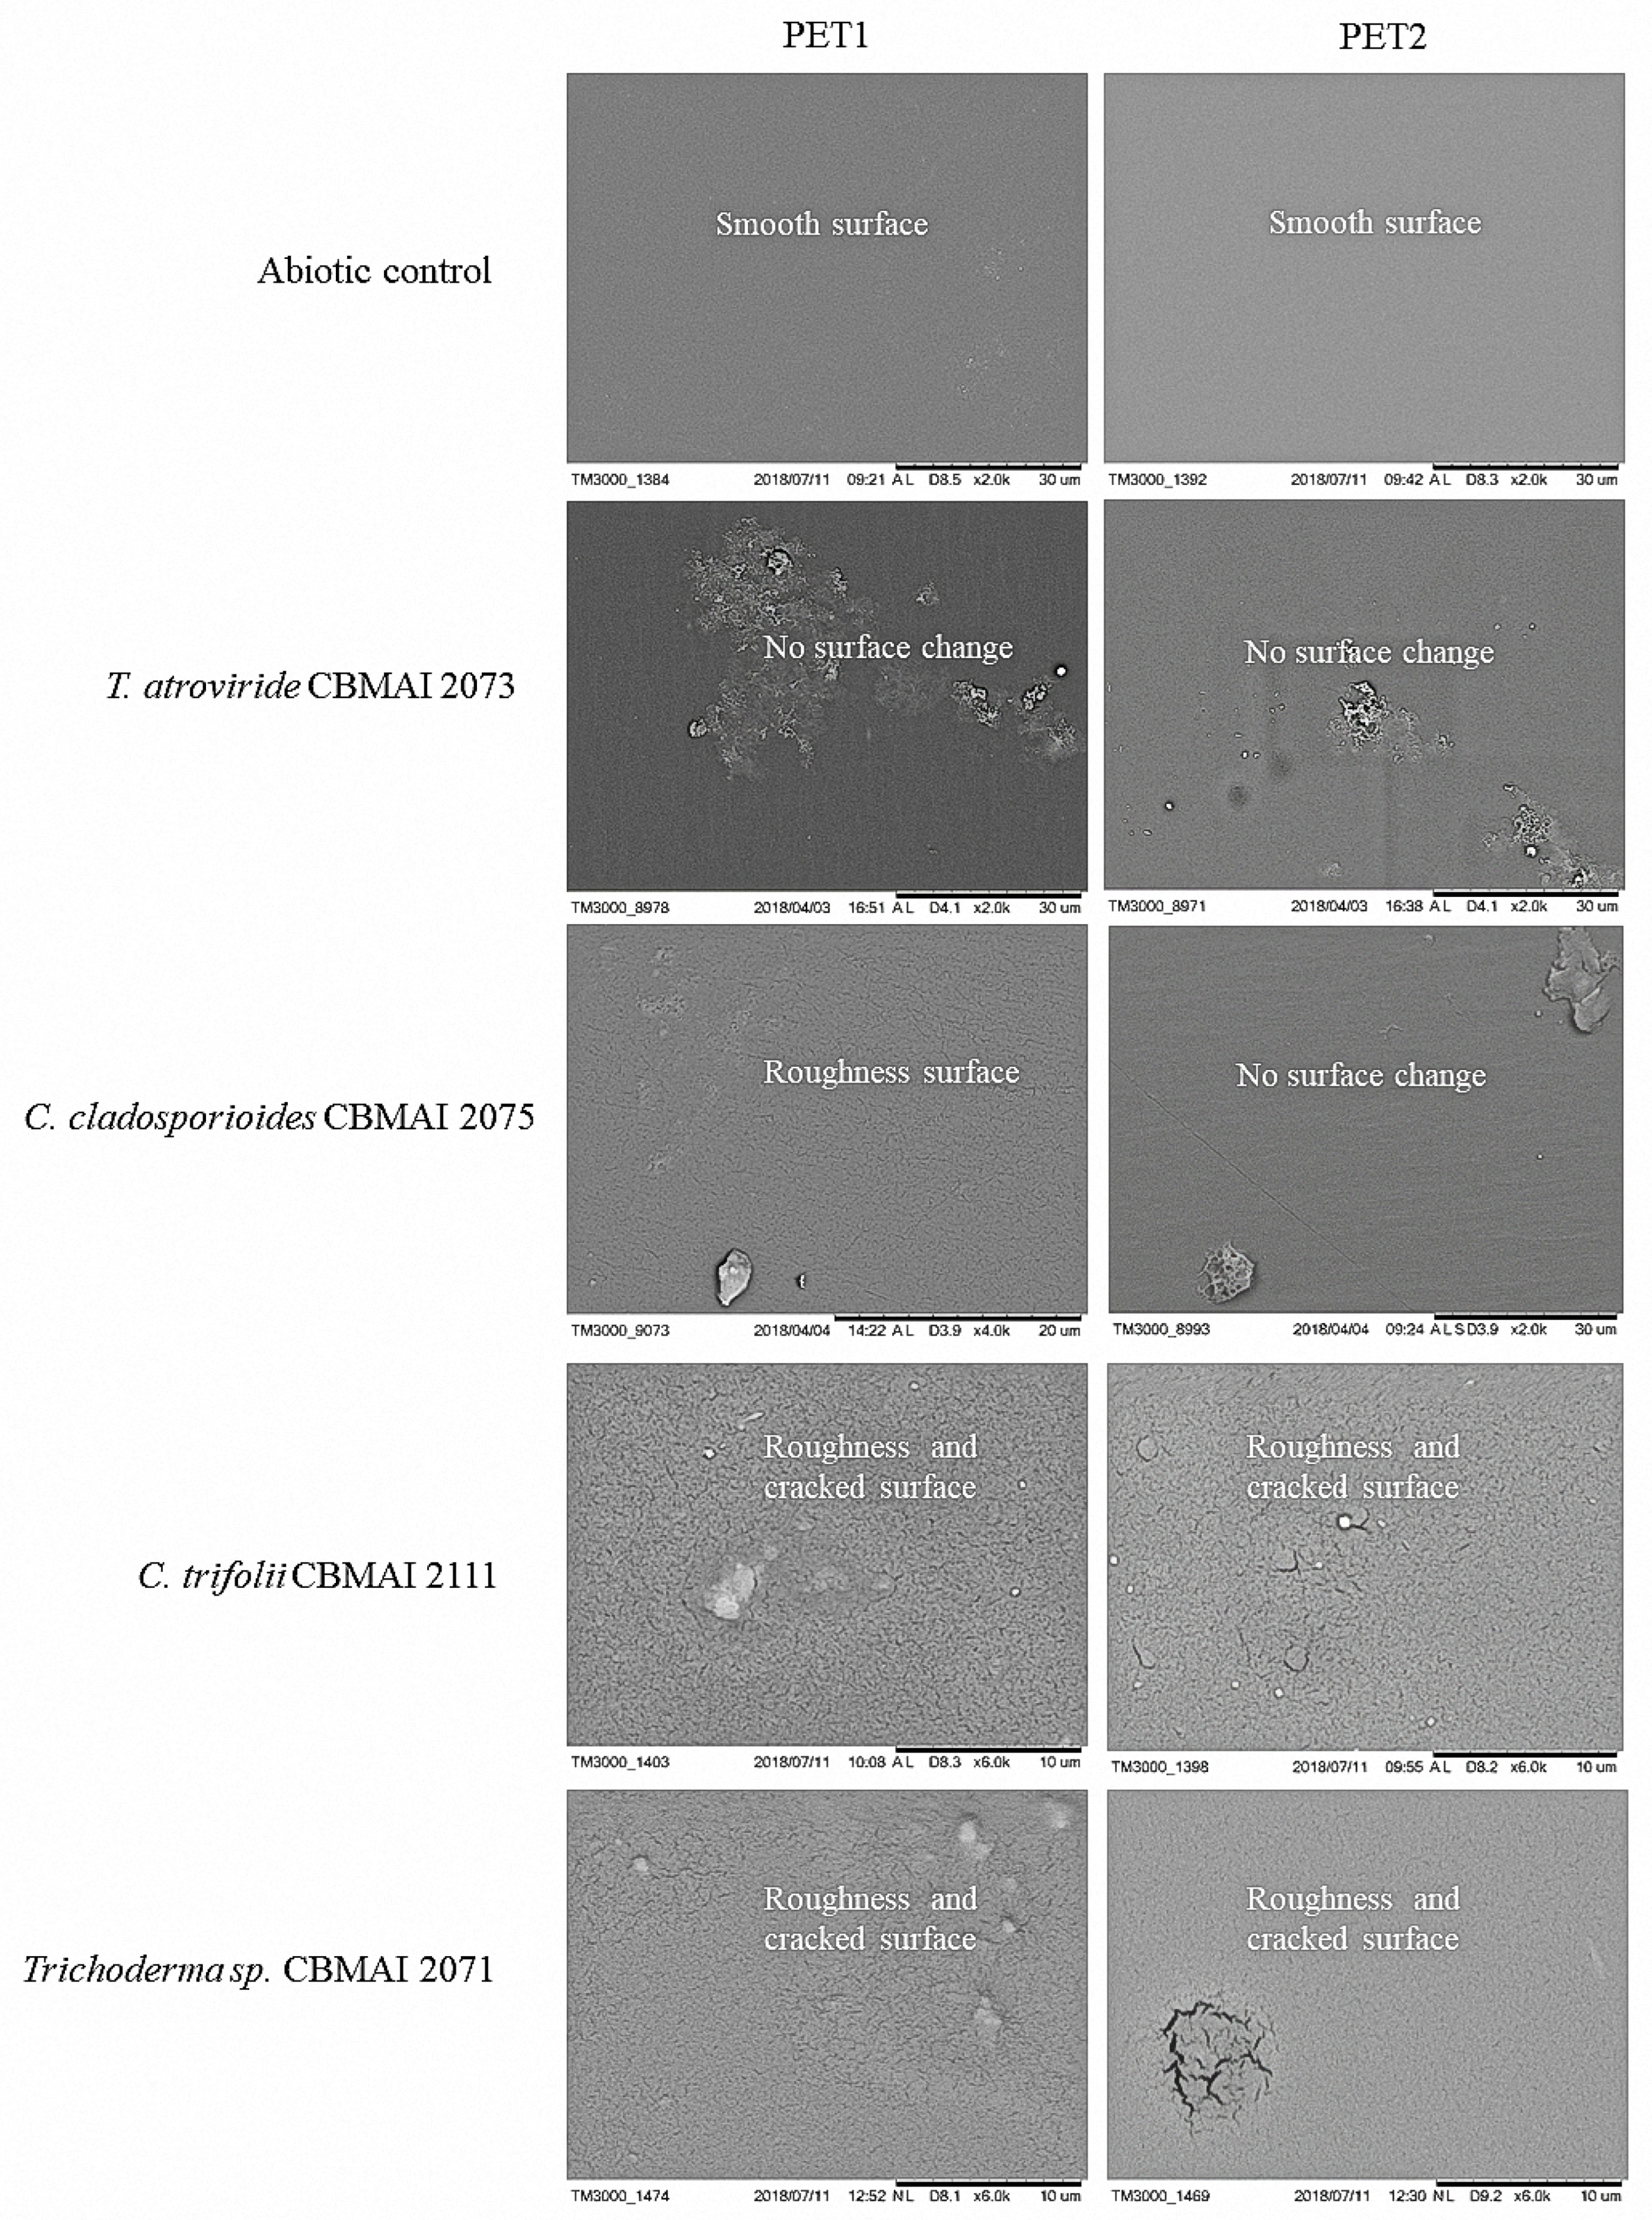
2.3.2. Scanning Electron Microscopy (SEM)
2.3.3. Analysis of the Post-Fermentation Broth
Total Proteins
2.4. Enzymatic Activities
2.5. Terephthalic Acid (PTA) and Oligomers (BHET and MHET) Using HPLC-UV
2.6. Fungal Identification
2.7. Statistical Analyses
3. Results
3.1. Enzymatic Assays with PET Nanoparticles
3.2. Cutinase Production
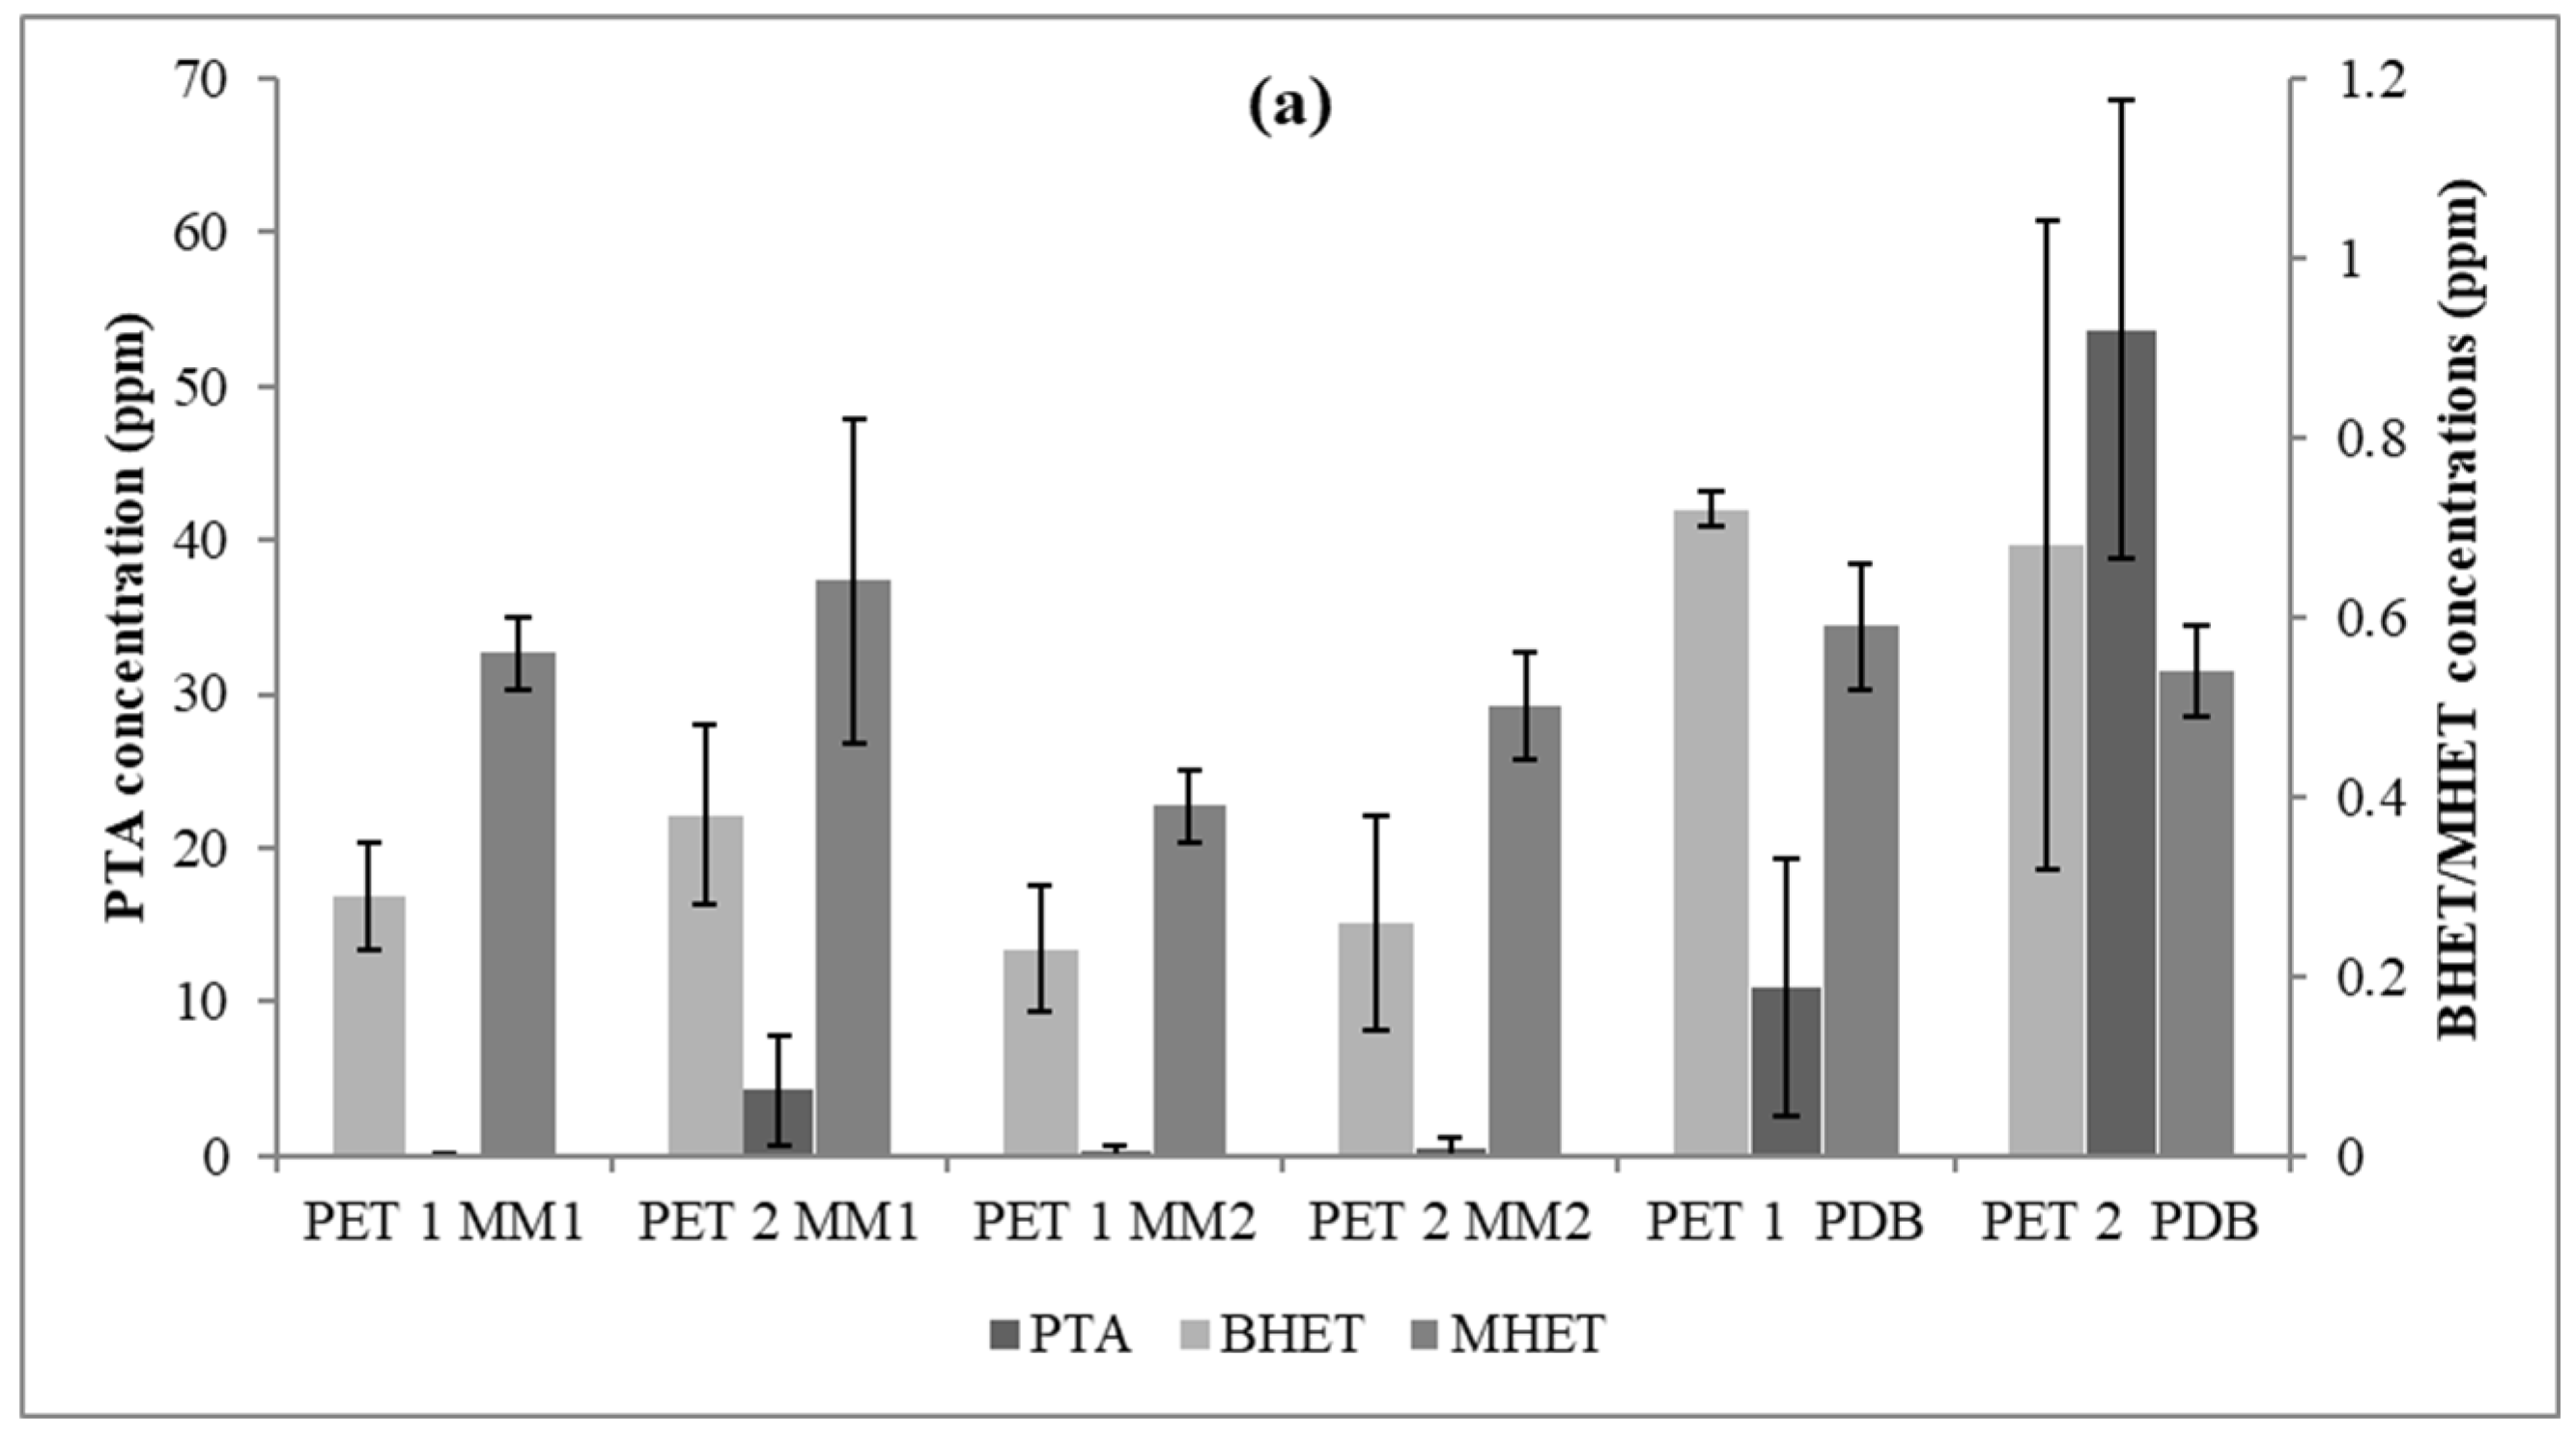
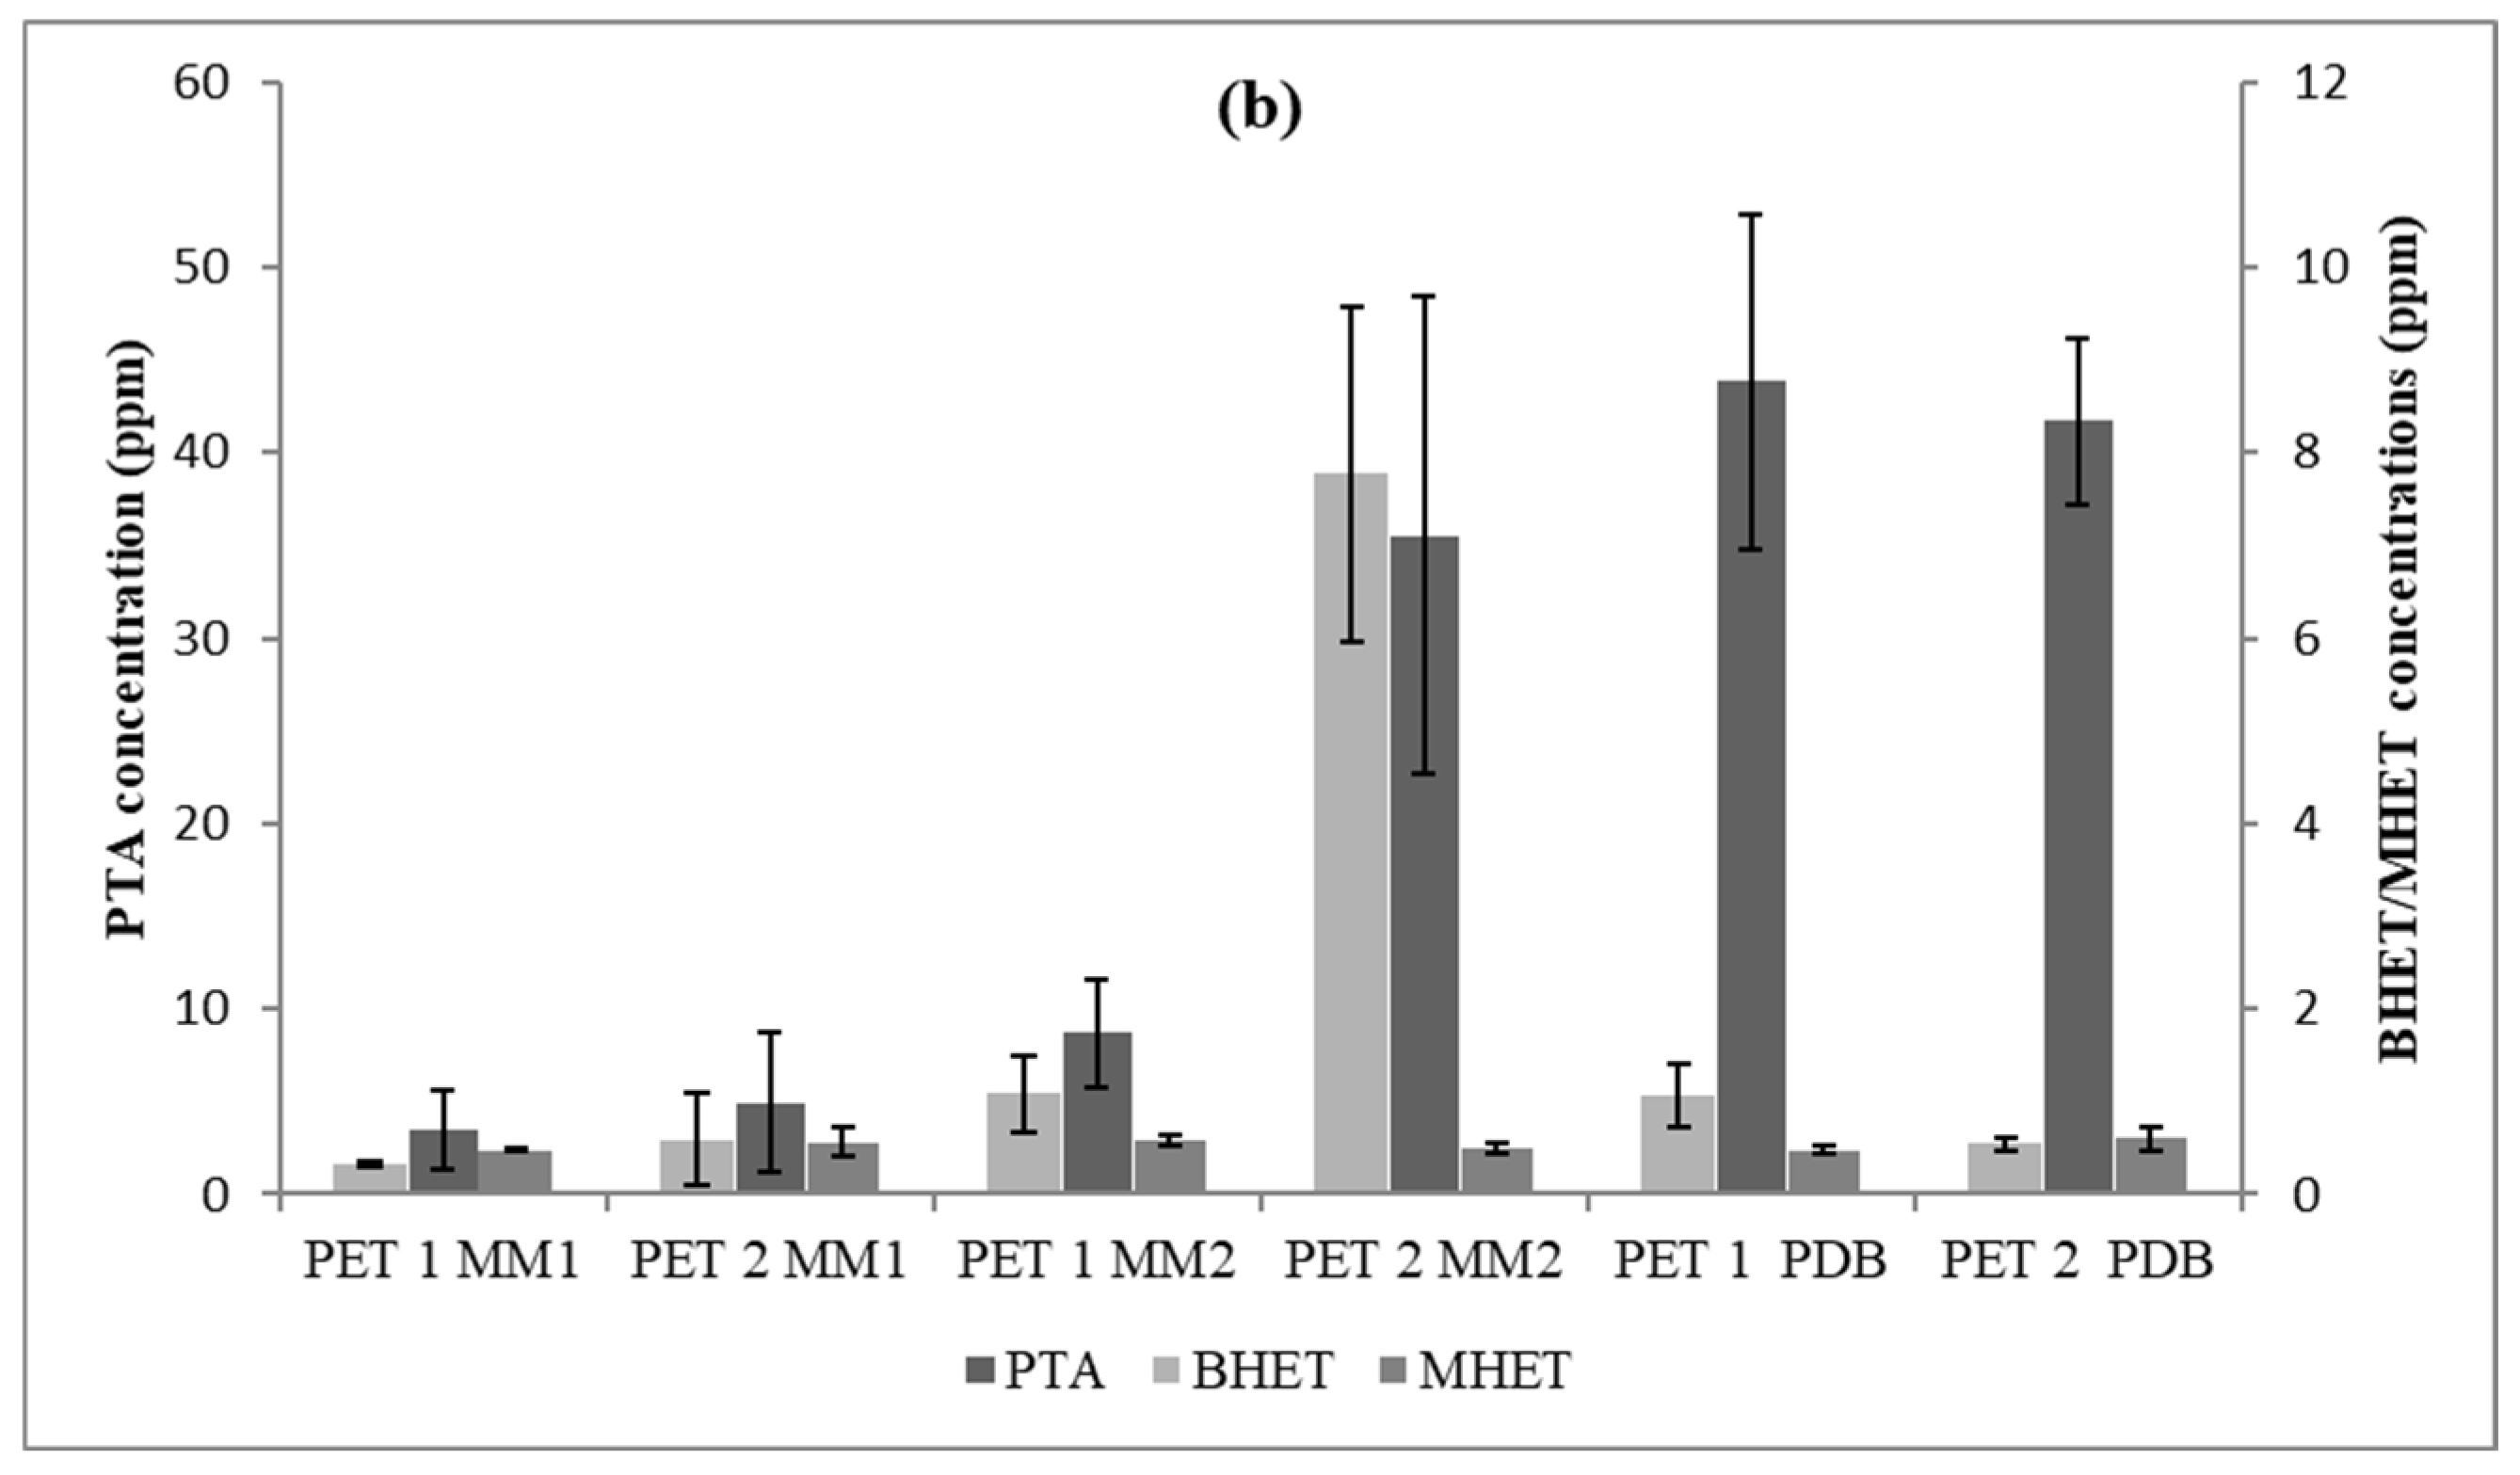
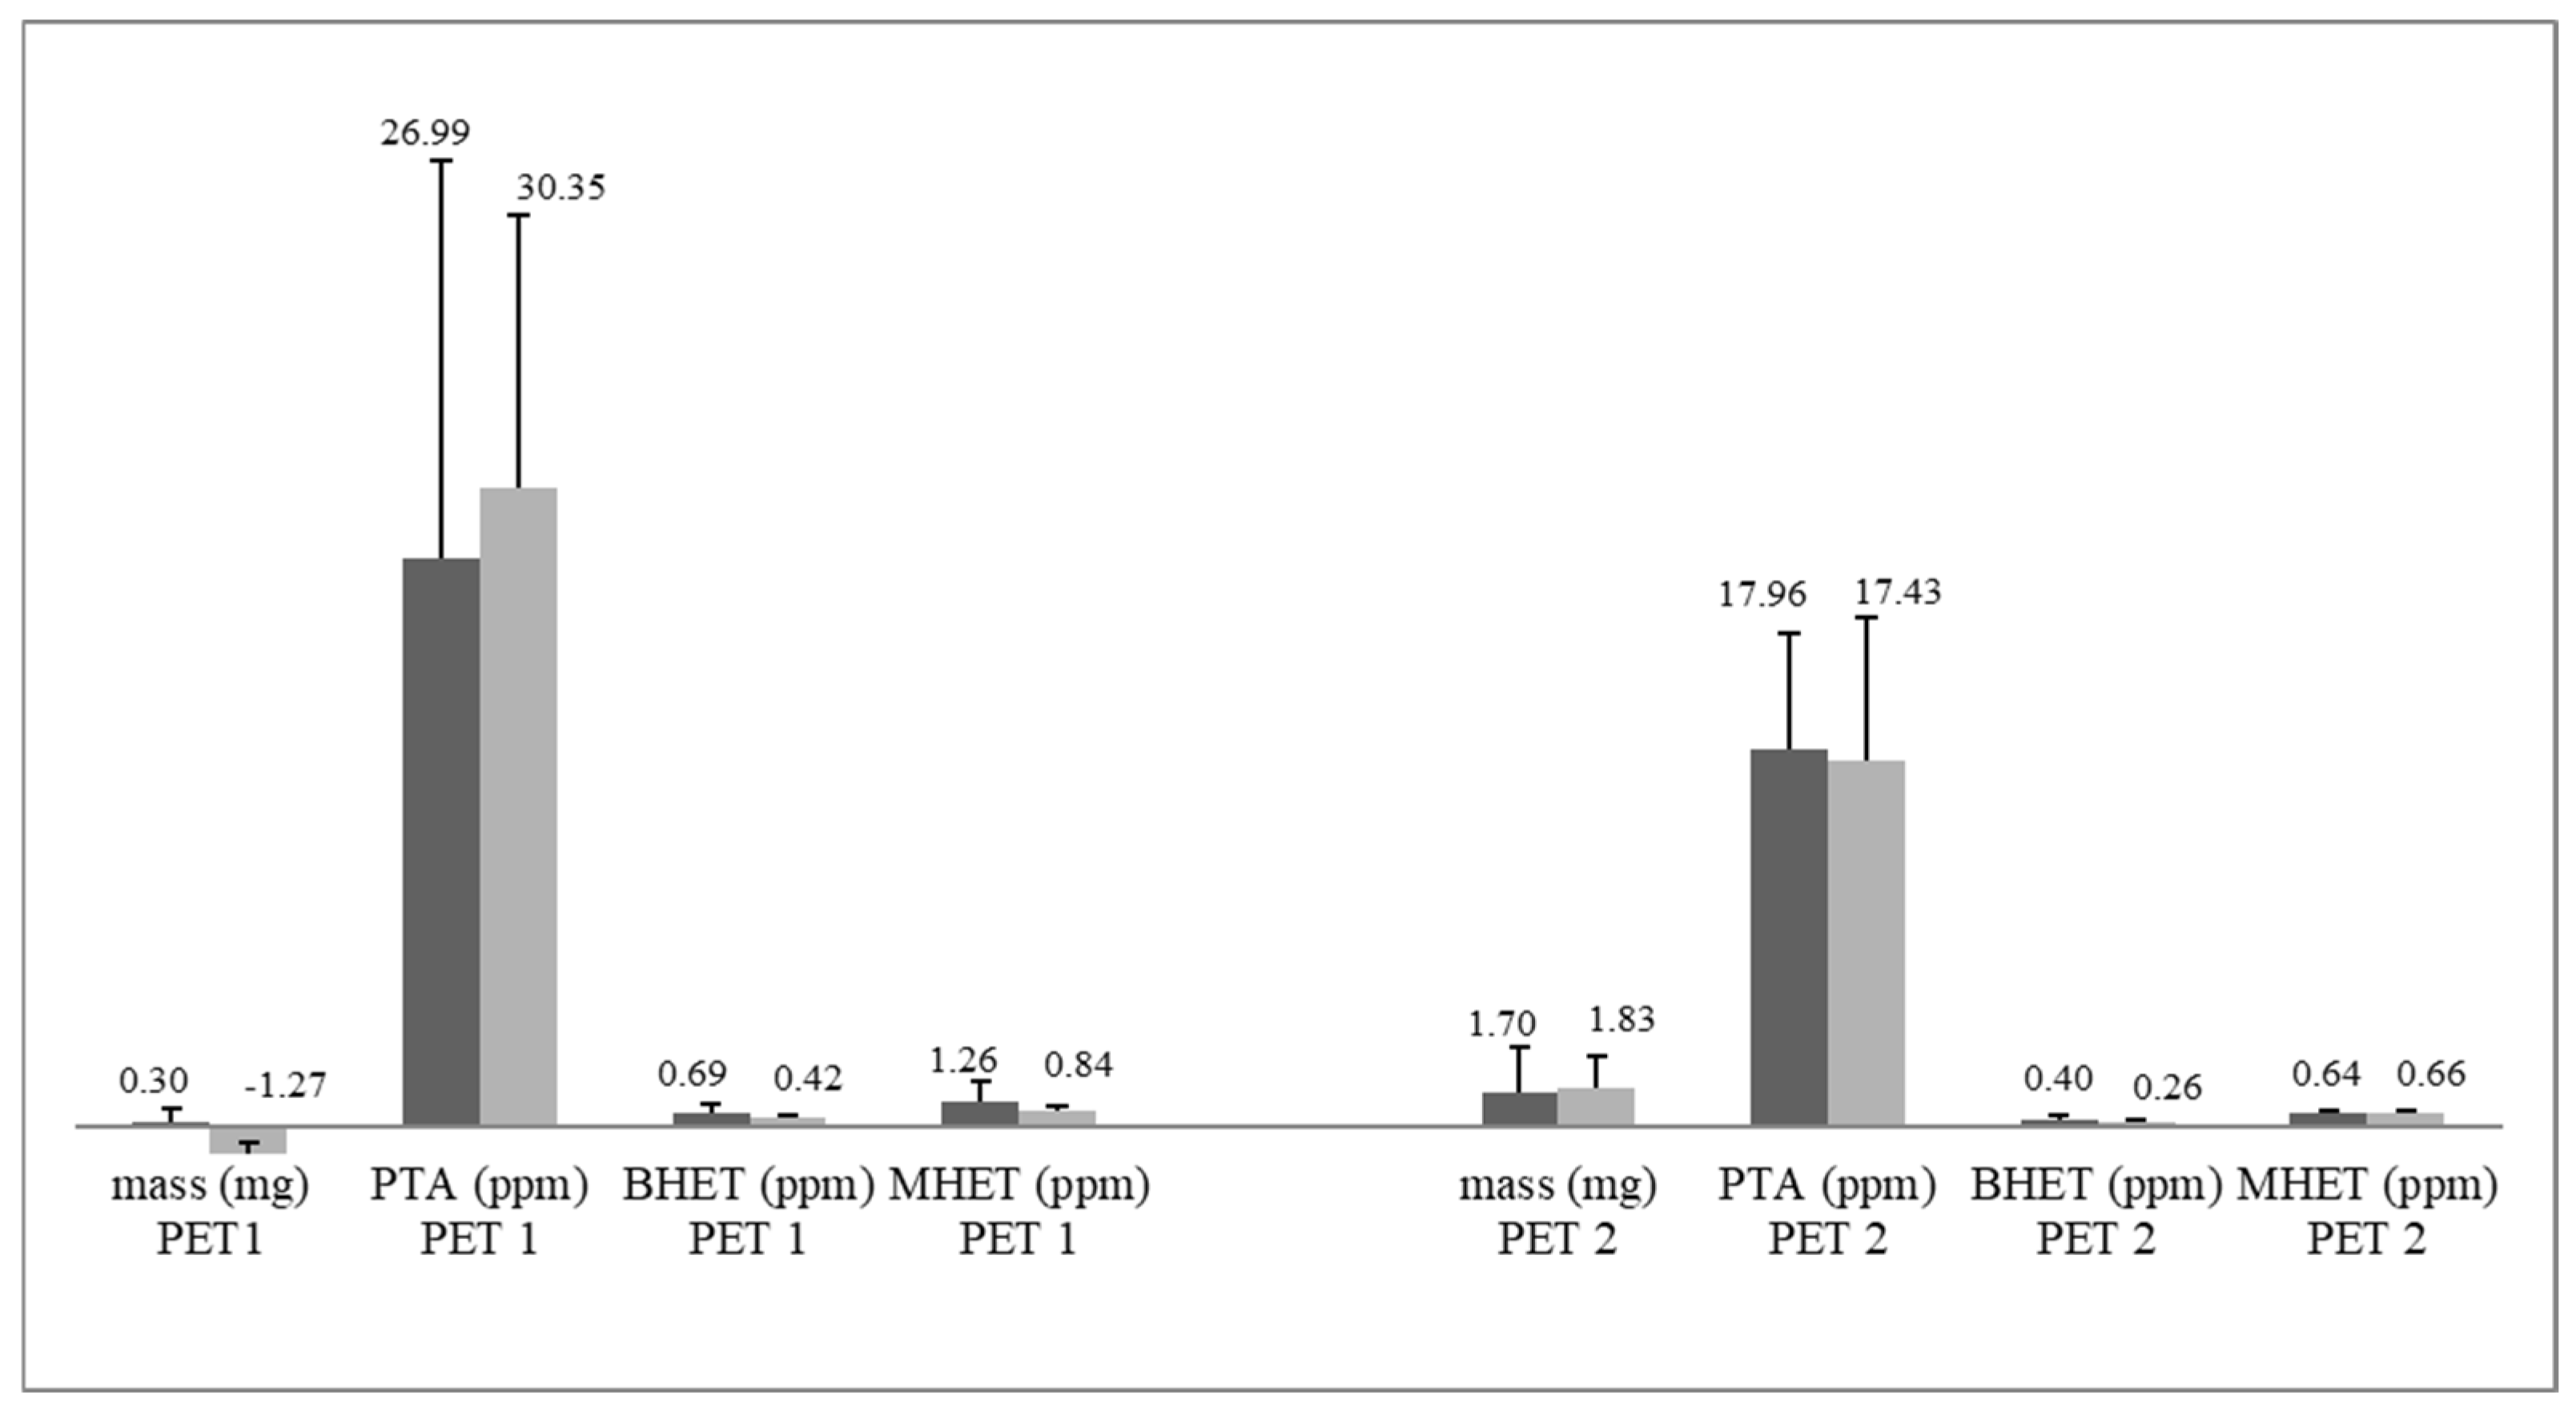
3.3. PET Depolymerization Assays
4. Discussion
5. Conclusions
Supplementary Materials
Author Contributions
Funding
Institutional Review Board Statement
Informed Consent Statement
Data Availability Statement
Acknowledgments
Conflicts of Interest
References
- Geyer, R.; Jambeck, J.R.; Law, K.L. Production, uses, and fate of all plastics ever made. Sci. Adv. 2017, 3, e1700782. [Google Scholar] [CrossRef] [Green Version]
- Plastics Europe’s Market Research and Statistics Group; Conversio Market Strategy GmbH. Plastics—The Facts 2019. 2019, Volume 14, p. 35. Available online: https://plasticseurope.org/knowledge-hub/plastics-the-facts-2019/ (accessed on 15 January 2020).
- Taniguchi, I.; Yoshida, S.; Hiraga, K.; Miyamoto, K.; Kimura, Y.; Oda, K. Biodegradation of PET: Current Status and Application Aspects. ACS Catal. 2019, 9, 4089–4105. [Google Scholar] [CrossRef]
- Goldsberry, C. Packaging Sustainability, Recycling, Consumer Products, Materials. Plastics Today. 2019. Available online: https://www.plasticstoday.com/packaging/europe-will-miss-2025-recycling-target-if-current-trends-continue/23949909261315 (accessed on 15 January 2020).
- Euromonitor International. Global Trends in Food and Drinks Packaging a Report Compiled for Auspack. 2017. Available online: https://go.euromonitor.com/00-EV-APAC2017-AUSPACK_Landing-Page.html (accessed on 15 January 2020).
- Gregory, M.R.; Andrady, A.L. Plastics in the Marine Environment. Biogeosciences 2016, 6, 1–13. [Google Scholar] [CrossRef]
- Koelmans, A.A.; Gouin, T.; Thompson, R.; Wallace, N.; Arthur, C. Plastics in the marine environment. Environ. Toxicol. Chem. 2014, 33, 5–10. [Google Scholar] [CrossRef] [PubMed]
- Thiounn, T.; Smith, R.C. Advances and approaches for chemical recycling of plastic waste. J. Polym. Sci. 2020, 58, 1347–1364. [Google Scholar] [CrossRef] [Green Version]
- Grigore, M.E. Methods of recycling, properties and applications of recycled thermoplastic polymers. Recycling 2017, 2, 24. [Google Scholar] [CrossRef] [Green Version]
- Kalita, N.K.; Hakkarainen, M. Integrating biodegradable polyesters in a circular economy. Curr. Opin. Green Sustain. Chem. 2022, 40, 100751. [Google Scholar] [CrossRef]
- Kalita, N.K.; Kalamdhad, A.; Katiyar, V. Recent Trends and Advances in the Biodegradation of Conventional Plastics. In Advances in Sustainable Polymers. Materials Horizons: From Nature to Nanomaterials; Katiyar, V., Kumar, A., Mulchandani, N., Eds.; Springer: Singapore, 2020. [Google Scholar] [CrossRef]
- Al-Sabagh, A.M.; Yehia, F.Z.; Eshaq, G.; Rabie, A.M.; ElMetwally, A.E. Greener routes for recycling of polyethylene terephthalate. Egypt. J. Pet. 2016, 25, 53–64. [Google Scholar] [CrossRef] [Green Version]
- Danso, D.; Schmeisser, C.; Chow, J.; Zimmermann, W.; Wei, R.; Leggewie, C.; Li, X.; Hazen, T.; Streit, W.R. New insights into the function and global distribution of polyethylene terephthalate (PET)-degrading bacteria and enzymes in marine and terrestrial metagenomes. Appl. Environ. Microbiol. 2018, 84, e02773-17. [Google Scholar] [CrossRef] [Green Version]
- Di Souza, L.; Torres, M.C.M.; Ruvolo Filho, A.C. Despolimerização do poli (tereftalato de etileno)—PET: Efeitos de tensoativos e excesso de solução alcalina. Polímeros 2008, 18, 334–341. [Google Scholar] [CrossRef] [Green Version]
- Billig, S.; Oeser, T.; Birkemeyer, C.; Zimmermann, W. Hydrolysis of cyclic poly(ethylene terephthalate) trimers by a carboxylesterase from Thermobifida fusca KW3. Appl. Microbiol. Biotechnol. 2010, 87, 1753–1764. [Google Scholar] [CrossRef]
- Eberl, A.; Heumann, S.; Brückner, T.; Araujo, R.; Cavaco-Paulo, A.; Kaufmann, F.; Kroutil, W.; Guebitz, G.M. Enzymatic surface hydrolysis of poly(ethylene terephthalate) and bis(benzoyloxyethyl) terephthalate by lipase and cutinase in the presence of surface active molecules. J. Biotechnol. 2009, 143, 207–212. [Google Scholar] [CrossRef]
- Guo, C.; Zhou, L.; Lv, J. Effects of expandable graphite and modified ammonium polyphosphate on the flame-retardant and mechanical properties of wood flour-polypropylene composites. Polym. Polym. Compos. 2013, 21, 449–456. [Google Scholar] [CrossRef]
- Malafatti-Picca, L.; de Barros Chaves, M.R.; de Castro, A.M.; Valoni, É.; de Oliveira, V.M.; Marsaioli, A.J.; de Franceschi de Angelis, D.; Attili-Angelis, D. Hydrocarbon-associated substrates reveal promising fungi for Poly (ethylene terephthalate) (PET) depolymerization. Braz. J. Microbiol. 2019, 50, 633–648. [Google Scholar] [CrossRef]
- Nimchua, T.; Eveleigh, D.E.; Punnapayak, H. Screening of tropical fungi producing polyethylene terephthalate-hydrolyzing enzyme for fabric modification. J. Ind. Microbiol. Biotechnol. 2008, 35, 843–850. [Google Scholar] [CrossRef] [PubMed]
- Zimmermann, W.; Billig, S. Enzymes for the biofunctionalization of Poly (ethylene Terephthalate). Adv. Biochem. Eng. Biotechnol. 2011, 125, 97–120. [Google Scholar] [CrossRef]
- Yoshida, S.; Hiraga, K.; Takehana, T.; Taniguchi, I.; Yamaji, H.; Maeda, Y.; Toyohara, K.; Miyamoto, K.; Kimura, Y.; Oda, K. A bacterium that degrades and assimilates poly(ethylene terephthalate). Science 2016, 351, 1196–1199. [Google Scholar] [CrossRef]
- Lear, G.; Kingsbury, J.M.; Franchini, S.; Gambarini, V.; Maday, S.D.M.; Wallbank, J.A.; Weaver, L.; Pantos, O. Plastics and the microbiome: Impacts and solutions. Environ. Microbiomes 2021, 16, 2. [Google Scholar] [CrossRef] [PubMed]
- Hiraga, K.; Taniguchi, I.; Yoshida, S.; Kimura, Y.; Oda, K. Biodegradation of waste PET. EMBO Rep. 2019, 20, e49365. [Google Scholar] [CrossRef] [PubMed]
- Ronkvist, Å.M.; Xie, W.; Lu, W.; Gross, R.A. Cutinase-Catalyzed hydrolysis of poly(ethylene terephthalate). Macromolecules 2009, 42, 5128–5138. [Google Scholar] [CrossRef]
- Sato, M. Deterioration of filaments and films of Polyethyleneterephthalate with enzyme of Cladosporium cladosporioides FERM J-8. Sen-I Gakkaishi 1983, 39, T209–T219. [Google Scholar] [CrossRef] [Green Version]
- Liebminger, S.; Eberl, A.; Sousa, F.; Heumann, S.; Fischer-Colbrie, G.; Cavaco-Paulo, A.; Guebitz, G.M. Hydrolysis of PET and bis-(benzoyloxyethyl) terephthalate with a new polyesterase from Penicillium citrinum. Biocatal. Biotransform. 2007, 25, 171–177. [Google Scholar] [CrossRef]
- Wang, X.; Lu, D.; Jönsson, L.J.; Hong, F. Preparation of a PET-hydrolyzing lipase from Aspergillus oryzae by the addition of bis(2-hydroxyethyl) terephthalate to the culture medium and enzymatic modification of PET fabrics. Eng. Life Sci. 2008, 8, 268–276. [Google Scholar] [CrossRef]
- Ru, J.; Huo, Y.; Yang, Y. Microbial degradation and valorization of plastic wastes. Front. Microbiol. 2020, 11, 442. [Google Scholar] [CrossRef] [PubMed] [Green Version]
- Wei, R.; Oeser, T.; Billig, S.; Zimmermann, W. A high-throughput assay for enzymatic polyester hydrolysis activity by fluorimetric detection. Biotechnol. J. 2012, 7, 1517–1521. [Google Scholar] [CrossRef] [PubMed]
- Chaves, M.R.B.; Lima, M.L.S.O.; Malafatti-Picca, L.; de Angelis, D.A.; de Castro, A.M.; Valoni, É.; Marsaioli, A.G. A practical fluorescence-based screening protocol for polyethylene terephthalate degrading microorganisms. J. Braz. Chem. Soc. 2018, 29, 1278–1285. [Google Scholar] [CrossRef]
- Welzel, K.; Müller, R.J.; Deckwer, W.D. Enzymatischer Abbau von Polyester-Nanopartikeln. Chem. Ing. Tech. 2002, 74, 1496–1500. [Google Scholar] [CrossRef]
- Macedo, G.A.; Pio, T.F. A rapid screening method for cutinase producing microorganisms. Braz. J. Microbiol. 2005, 36, 388–394. [Google Scholar] [CrossRef] [Green Version]
- Chen, Z.; Franco, C.F.; Baptista, R.P.; Cabral, J.M.S.; Coelho, A.V.; Rodrigues, C.J.; Melo, E.P. Purification and identification of cutinases from Colletotrichum kahawae and Colletotrichum gloeosporioides. Appl. Microbiol. Biotechnol. 2007, 73, 1306–1313. [Google Scholar] [CrossRef]
- Dickman, M.; Patil, S. A rapid plate assay for detection of cutinases produced by plant pathogenic fungi. Phytopathology 1986, 76, 473–475. [Google Scholar] [CrossRef]
- Murphy, C.A.; Cameron, J.A.; Huang, S.J.; Vinopal, R.T. Fusarium polycaprolactone depolymerase is cutinase. Appl. Environ. Microbiol. 1996, 62, 456–460. [Google Scholar] [CrossRef] [Green Version]
- Sharon, C.; Sharon, M. Studies on Biodegradation of Polyethylene terephthalate: A synthetic polymer Studies on Biodegradation of Polyethylene terephthalate: A synthetic polymer. J. Microbiol. Biotechnol. Res. 2012, 2, 258–264. [Google Scholar]
- De Castro, A.M.; Carniel, A.; Nicomedes Junior, J.; da Conceição Gomes, A.; Valoni, E. Screening of commercial enzymes for poly(ethylene terephthalate) (PET) hydrolysis and synergy studies on different substrate sources. J. Ind. Microbiol. Biotechnol. 2017, 44, 835–844. [Google Scholar] [CrossRef]
- Khanna, Y.P.; Kuhn, W.P. Measurement of crystalline index in nylons by DSC: Complexities and recommendations. J. Polym. Sci. Part B Polym. Phys. 1997, 35, 2219–2231. [Google Scholar] [CrossRef]
- Gams, W.; Hoekstra, E.S.; Aptoot, A. CBS-Course of Mycology, 4th ed.; Centraalbureau voor Schimmelculturesthe: Baarn, The Netherlands, 1998; p. 165. [Google Scholar]
- Sepperumal, U.; Markandan, M.; Palraja, I. Micromorphological and chemical changes during biodegradation of Polyethylene terephthalate (PET) by Penicillium sp. J. Microbiol. Biotechnol. Res. 2013, 3, 47–53. [Google Scholar]
- Bradford, M.M. A rapid and sensitive method for the quantitation of microgram quantities of protein utilizing the principle of protein-dye binding. Anal. Biochem. 1976, 72, 248–254. [Google Scholar] [CrossRef]
- Shafei, M.S.; Mohamed, T.A.; Elsalam, I.S.A. Optimization of extracellular lipase production by Penicillium chrysogenum using factorial design. Malays. J. Microbiol. 2011, 7, 71–77. [Google Scholar] [CrossRef]
- He, X. A continuous spectrophotometric assay for the determination of diamondback moth esterase activity. Arch. Insect. Biochem. Physiol. 2003, 54, 68–76. [Google Scholar] [CrossRef]
- Kim, D.J.; Lee, K.T. Determination of monomers and oligomers in polyethylene terephthalate trays and bottles for food use by using high performance liquid chromatography- electrospray ionization-mass spectrometry. Polym. Test 2012, 31, 490–499. [Google Scholar] [CrossRef]
- Aamir, S.; Sutar, S.; Singh, S.K.; Baghela, A. A rapid and efficient method of fungal genomic DNA extraction, suitable for PCR based molecular methods. Plant Pathol Quar. 2015, 5, 74–81. [Google Scholar] [CrossRef]
- White, T.J.; Bruns, T.; Lee, S.; Taylor, J. 38-Amplification and Direct Sequencing of Fungal Ribosomal RNA Genes for Phylogenetics. In PCR Protocols, a Guide to Methods and Applications; Academic Press: London, UK, 1990; pp. 315–322. [Google Scholar]
- Carbone, I.; Kohn, L.M. A Method for Designing Primer Sets for Speciation Studies in Filamentous Ascomycetes. Mycologia 1999, 91, 553–556. [Google Scholar] [CrossRef]
- Hall, T.A. BioEdit: A User-Friendly Biological Sequence Alignment Editor and Analysis Program for Windows 95/98/NT. Nucleic Acids Symp. Ser. 1999, 41, 95–98. [Google Scholar]
- Larkin, M.A.; Blackshields, G.; Brown, N.P.; Chenna, R.; Mcgettigan, P.A.; Mcwilliam, H.; Valentin, F.; Wallace, I.M.; Wilm, A.; Lopez, R.; et al. Clustal W and Clustal X version. Bioinformatics 2018, 23, 2947–2948. [Google Scholar] [CrossRef] [Green Version]
- Tamura, K.; Dudley, J.; Nei, M.; Kumar, S. MEGA4: Molecular Evolutionary Genetics Analysis (MEGA) software version 4.0. Mol. Biol. Evol. 2007, 24, 1596–1599. [Google Scholar] [CrossRef]
- Saitou, N.; Nei, M.; Saitou, N.N.M. The neighbor-joining method: A new method for reconstructing phylogenetic trees. Mol. Biol. Evol. 1987, 4, 406–425. [Google Scholar] [CrossRef]
- Barth, M.; Oeser, T.; Wei, R.; Then, J.; Schmidt, J.; Zimmermann, W. Effect of hydrolysis products on the enzymatic degradation of polyethylene terephthalate nanoparticles by a polyester hydrolase from Thermobifida Fusca. Biochem. Eng. J. 2015, 93, 222–228. [Google Scholar] [CrossRef]
- Walter, T.; Augusta, J.; Muller, R.J.; Widdecke, H.; Klein, J. Enzymatic Degradation of a Model Polyester by Lipase from Rhizopus delemar. Enzym. Microb. Technol. 1995, 17, 218–224. [Google Scholar] [CrossRef]
- Dos Santos, P.R.R.; Leão, E.U.; Aguiar, R.W.d.S.; de Melo, M.P.; dos Santos, G.R. Morphological and molecular characterization of Curvularia lunata pathogenic to andropogon grass. Bragantia 2018, 77, 326–332. [Google Scholar] [CrossRef]
- Bensch, K.; Braun, U.; Groenewald, J.Z.; Crous, P.W. The genus Cladosporium. Stud. Mycol. 2012, 72, 1–401. [Google Scholar] [CrossRef] [PubMed] [Green Version]
- Verma, D.; Jin, S.; Kanagaraj, A.; Singh, N.D.; Daniel, J.; Kolattukudy, P.E.; Miller, M.; Daniell, H. Expression of Fungal Cutinase and Swollenin in Tobacco Chloroplasts Reveals Novel Enzyme Functions and/or Substrates. PLoS ONE 2013, 8, e57187. [Google Scholar] [CrossRef]
- Crous, P.W.; Verkleij, G.J.M.; Groenewald, J.Z.; Houbraken, J. Fungal Biodiversity; Westerdijk Laboratory Manual Series No. 1; Westerdijk Fungal Biodiversity Institute: Utrecht, The Netherlands, 2019; 425p. [Google Scholar]
- De Wit, P.J.G.M.; van der Burgt, A.; Ökmen, B.; Stergiopoulos, I.; Abd-Elsalam, K.A.; Aerts, A.L.; Bahkali, A.H.; Beenen, H.G.; Chettri, P.; Cox, M.P.; et al. The Genomes of the fungal plant pathogens Cladosporium fulvum and Dothistroma septosporum reveal adaptation to different hosts and lifestyles but also signatures of common ancestry. PLoS Genet. 2012, 8, e1003088. [Google Scholar] [CrossRef] [PubMed]
- Roussel, A.; Amara, S.; Nyyssölä, A.; Mateos-Diaz, E.; Blangy, S.; Kontkanen, H.; Westerholm-Parvinen, A.; Carrière, F.; Cambillau, C. A Cutinase from Trichoderma reesei with a lid-covered active site and kinetic properties of true lipases. J. Mol. Biol. 2014, 426, 3757–3772. [Google Scholar] [CrossRef] [PubMed]
- Liu, T.; Hou, J.; Wang, Y.; Jin, Y.; Borth, W.; Zhao, F.; Liu, Z.; Hu, J.; Zuo, Y. Genome-wide identification, classification and expression analysis in fungal–plant interactions of cutinase gene family and functional analysis of a putative ClCUT7 in Curvularia lunata. Mol. Genet. Genom. 2016, 291, 1105–1115. [Google Scholar] [CrossRef]
- Wurm, F.R.; Weiss, C.K. Nanoparticles from renewable polymers. Front. Chem. 2014, 2, 49. [Google Scholar] [CrossRef] [PubMed] [Green Version]
- THE COCA-COLA COMPANY. PlantBottle Frequently Asked Questions: The Coca-Cola Company. 2020. Available online: https://www.coca-cola.co.uk/our-business/faqs/what-is-plantbottle (accessed on 15 January 2020).
- Wei, R.; Zimmermann, W. Microbial enzymes for the recycling of recalcitrant petroleum-based plastics: How far are we? Microb. Biotechnol. 2017, 10, 1308–1322. [Google Scholar] [CrossRef] [PubMed] [Green Version]
- Müller, R.J.; Schrader, H.; Profe, J.; Dresler, K.; Deckwer, W.D. Enzymatic degradation of poly(ethylene terephthalate): Rapid hydrolyse using a hydrolase from T. fusca. Macromol. Rapid Commun. 2005, 26, 1400–1405. [Google Scholar] [CrossRef]
- Belal, E.B. Biodegradation of Aliphatic-aromatic Coplyester under Thermophilic Conditions. Res. J. Environ. Earth Sci. 2013, 5, 677–690. [Google Scholar] [CrossRef]
- Bonhomme, S.; Cuer, A.; Delort, A.M.; Lemaire, J.; Sancelme, M.; Scott, G. Environmental biodegradation of polyethylene. Polym. Degrad. Stab. 2003, 81, 441–452. [Google Scholar] [CrossRef]
- Shah, A.A.; Hasan, F.; Hameed, A.; Ahmed, S. Isolation and characterization of poly(3-hydroxybutyrate-co-3-hydroxyvalerate) degrading bacteria and purification of PHBV depolymerase from newly isolated Bacillus sp. AF3. Int. Biodeterior. Biodegrad. 2007, 60, 109–115. [Google Scholar] [CrossRef]
- Awasthi, S.; Srivastava, N.; Singh, T. Biodegradation of thermally treated low density polyethylene by fungus Rhizopus oryzae NS 5. 3 Biotech 2017, 7, 73. [Google Scholar] [CrossRef] [Green Version]
- Das, M.P.; Kumar, S. An approach to low-density polyethylene biodegradation by Bacillus amyloliquefaciens. 3 Biotech 2015, 5, 81–86. [Google Scholar] [CrossRef] [Green Version]
- Nowak, B.; Paja̧K, J.; Labuzek, S.; Rymarz, G.; Talik, E. Biodegradation of poly(ethylene terephthalate) modified with polyester “Bionolle®” by Penicillium funiculosum. Polymery 2011, 56, 35–44. [Google Scholar] [CrossRef]
- El-Shafei, H.A.; El-Nasser, N.H.A.; Kansoh, A.L.; Ali, A.M. Biodegradation of disposable polyethylene by fungi and Streptomyces species. Polym. Degrad. Stab. 1998, 62, 361–365. [Google Scholar] [CrossRef]
- Holland, B.J.; Hay, J.N. The thermal degradation of poly(vinyl acetate) measured by thermal analysis-Fourier transform infrared spectroscopy. Polymer 2002, 43, 2207–2211. [Google Scholar] [CrossRef]
- Vijayakumar, S.; Rajakumar, P.R. Infrared spectral analysis of waste PET samples. Int. Lett. Chem. Phys. Astron. 2012, 4, 58–65. [Google Scholar] [CrossRef]
- Yamada-Onodera, K.; Mukumoto, H.; Katsuyaya, Y.; Saiganji, A.; Tani, Y. Degradation of polyethylene by a fungus, Penicillium simplicissimum YK. Polym. Degrad. Stab. 2001, 72, 323–327. [Google Scholar] [CrossRef]
- Jumaah, O.S. Screening of Plastic Degrading Bacteria from Dumped Soil Area. IOSR J. Environ. Sci. Toxicol. Food Technol. 2017, 11, 93–98. [Google Scholar] [CrossRef]
- Webb, H.K.; Arnott, J.; Crawford, R.J.; Ivanova, E.P. Plastic degradation and its environmental implications with special reference to Poly(ethylene terephthalate). Polymers 2013, 5, 1–18. [Google Scholar] [CrossRef] [Green Version]
- Restrepo-Flórez, J.M.; Bassi, A.; Thompson, M.R. Microbial degradation and deterioration of polyethylene—A review. Int. Biodeterior. Biodegrad. 2014, 88, 83–90. [Google Scholar] [CrossRef]
- Gong, J.; Li, Y.; Wang, H.; Li, H.; Zhang, J. Depolymerization and Assimilation of Poly (Ethylene Terephthalate) by Whole-Cell Bioprocess. IOP Conf. Ser. Mater. Sci. Eng. 2018, 394, 022047. [Google Scholar] [CrossRef]
- Zhang, J.; Wang, X.; Gong, J.; Gu, Z. A study on the biodegradability of Polyethylene terephthalate fiber and diethylene glycol terephthalate. J. Appl. Polym. Sci. 2004, 93, 1089–1096. [Google Scholar] [CrossRef]
- Furukawa, M.; Kawakami, N.; Tomizawa, A.; Miyamoto, K. Efficient Degradation of Poly(ethylene terephthalate) with Thermobifida fusca Cutinase Exhibiting Improved Catalytic Activity Generated using Mutagenesis and Additive-based Approaches. Sci. Rep. 2019, 9, 16038. [Google Scholar] [CrossRef] [PubMed] [Green Version]
- Espino-Rammer, L.; Ribitsch, D.; Przylucka, A.; Marold, A.; Greimel, K.J.; Acero, E.H.; Guebitz, G.M.; Kubicek, C.P.; Druzhinina, I.S. Two novel class ii hydrophobins from Trichoderma spp. stimulate enzymatic hydrolysis of poly(ethylene terephthalate) when expressed as fusion proteins. Appl. Environ Microbiol. 2013, 79, 4230–4238. [Google Scholar] [CrossRef] [PubMed] [Green Version]
- Shah, A.A.; Hasan, F.; Hameed, A.; Ahmed, S. Biological degradation of plastics: A comprehensive review. Biotechnol. Adv. 2008, 26, 246–265. [Google Scholar] [CrossRef] [PubMed]


| Assay | Fungal Cells (Suspension, 1 mg·mL−1, in 20 mM Borate Buffer—pH 7.8) | PET Nanoparticles * (Suspension, 0.11 mg·mL−1) | Terephthalic Acid (Solution, 2.6 mM) | Borate Buffer (20 mM—pH 7.8) |
|---|---|---|---|---|
| Enzymatic | 100 µL | 30 µL | -- | --- |
| Positive control | 100 µL | --- | 100 µL | --- |
| Negative control | --- | 30 µL | 100 µL | --- |
| Microbial control | 100 µL | --- | --- | 30 µL |
| Sample | Thickness (mm) | Tm(°C) | ΔHm (J·g−1) | X (%) |
|---|---|---|---|---|
| PET1 | 0.10 ± 0.01 | 251.12 | 49.66 | 35.47 |
| PET2 | 0.21 ± 0.01 | 253.41 | 14.57 | 10.41 |
| Liquid Culture Media * | Components and Amounts in g·L−1 | |
|---|---|---|
| Minimal mineral media (MM1) | KH2PO4 | 1.0 |
| KNO3 | 1.0 | |
| MgSO4 | 0.5 | |
| KCl | 0.5 | |
| Yeast extract | 0.2 | |
| Sucrose | 0.2 | |
| Glucose | 0.2 | |
| Distilled water | 1 L | |
| Minimal mineral medium supplemented with palm oil (MM2) | KH2PO4 | 1.0 |
| KNO3 | 1.0 | |
| MgSO4 | 0.5 | |
| KCl | 0.5 | |
| Yeast extract | 0.2 | |
| Palm oil | 0.4 | |
| Distilled water | 1 L | |
| Sigma-Aldrich® Potato dextrose broth (PDB) | Glucose (Dextrose) | 20 |
| Potato infusion | 4.0 | |
| Distilled water | 1 L | |
| Region | Primer | Sequence (5′–3′) | Amplification Program | References |
|---|---|---|---|---|
| ITS | ITS1 (forward) | TCCGTAGGTGAACCTGCGG | Initial denaturation at 94 °C for 2 min, 30 denaturation cycles at 94 °C for 1 min, annealing at 55 °C for 1 min, extension at 72 °C for 3 min, and final extension step at 72 °C for 3 min and 4 °C. | [46] |
| ITS4 (reverse) | TCCTCCGCTTATTGATATGC | |||
| Elongation factor 1α (tef1) | EF1-728F (forward) | CATCGAGAAGTTCGAGAAGG | Initial denaturation at 94 °C for 2 min, 15 denaturation cycles at 94 °C for 30 s, annealing at 65 °C for 30 s, extension at 72 °C for 1 min, followed by 35 cycles at 94 °C for 30 s, 48 °C for 30 s, and final extension step at 72 °C for 1 min. | [47] |
| TEF1R (reverse) | GCCATCCTTGGAGATACCAGC |
| Code | Identification | npPET Conversion (%) * | Code | Identification | npPET Conversion (%) * |
|---|---|---|---|---|---|
| CBMAI 2111 | Curvularia trifolii | 9.0 ± 1.1 | CBMAI 2203 | Paraconiothyrium cyclothyrioides | 0.6 ± 0.3 |
| CBMAI 2073 | Trichoderma atroviride | 6.1 ± 0.2 | LMA 216 | Phoma herbarum | 0.6 ± 0.6 |
| CBMAI 2071 | Trichoderma sp. | 3.6 ± 0.8 | LMA 28 | Aspergillus fumigatus | 0.5 ± 0.0 |
| CBMAI 2110 | Microsphaeropsis arundinis | 2.7 ± 0.9 | LMA 1825 | Fusarium sp. | 0.4 ± 0.0 |
| CBMAI 2109 | Microsphaeropsis arundinis | 2.0 ± 0.4 | LMA 1172 | Fusarium sp. | 0.4 ± 0.0 |
| LMA 1269 | Fusarium sp. | 1.9 ± 0.5 | CBMAI 2190 | Aspergillus fumigatus | 0.4 ± 0.2 |
| CBMAI 2159 | Pseudallescheria sp. (Complexo Pseudallescheria/Scedosporium) | 1.9 ± 1.0 | CBMAI 2186 | Talaromyces veerkampii | 0.3 ± 0.2 |
| CBMAI 2083 | Paecylomyces sp. | 1.7 ± 0.7 | CBMAI 2187 | Paraconiothyrium cyclothyrioides | 0.3 ± 0.3 |
| CBMAI 2189 | Aspergillus fumigatus | 0.8 ± 0.6 | CBMAI 2149 | Trichoderma capillare | 0.3 ± 0.0 |
| CBMAI 2075 | Cladosporium cladosporioides | 0.8 ± 0.6 | CBMAI 2155 | Microsphaeropsis arundinis | 0.3 ± 0.2 |
| LMA1251 | Trichoderma sp. | 0.7 ± 0.4 | LMA 167 | Penicillium sp. | 0.3 ± 0.1 |
| CBMAI 2158 | Paraconiothyrium cyclothyrioides | 0.7 ± 0.1 | LMA 11 | Paecilomyces-like | 0.2 ± 0.0 |
| CBMAI 2191 | Penicillium koreense | 0.7 ± 0.1 | LMA 1145 | Fusarium sp. | 0.1 ± 0.0 |
| T. atroviride CBMAI 2073 | PET 1 | PET 2 | ||||
|---|---|---|---|---|---|---|
| MM1 | MM2 | PDB | MM1 | MM2 | PDB | |
| Lipase (UA) | 0.69 ± 0.0 | 0.64 ± 0.2 | 0.47 ± 0.1 | 0.58 ± 0.1 | 0.87 ± 0.3 | 0.18 ± 0.3 |
| Esterase (µmol α-naftol per µg of protein) | 535.6 ± 310.8 | 1968.2 ± 772.8 | 761.03.0 ± 384.9 | 1635.8 ± 681.0 | 631.7 ± 230.2 | 860.5 ± 341.5 |
| C. cladosporioides CBMAI 2075 | MM1 | MM2 | PDB | MM1 | MM2 | PDB |
| Lipase (UA) | 0.97 ± 0.4 | 0.64 ± 0.3 | 0.83 ± 0.0 | 0.69 ± 0.2 | 1.47 ± 0.4 | 0.87 ± 0.0 |
| Esterase (µmol α-naftol per µg of protein) | 1239.78 ± 727.3 | 1.91 ± 1.49 | 1034.1 ± 437.28 | 392.3 ± 278.4 | 30.35 ± 28.83 | 139.1 ± 75.9 |
| Wavelength in cm−1 | T. atroviride CBMAI 2073 | C. cladosporioides CBMAI 2075 |
|---|---|---|
| 3000–2500 | Increased absorption intensity with the disappearance of bands between 2980 cm−1 and 2953 cm−1 | No changes |
| 2500–2000 | No changes | No changes |
| 2000–1500 | Disappearance of bands at 1764 cm−1 and 1666 cm−1, intensity reduction in band at 1579 cm−1, and increase in absorption intensity of bands at 1502 cm−1 and 1500 cm−1 | Increased absorption intensity of the bands at 1579 cm−1, 1573 cm−1, 1510 cm−1, and 1508 cm−1 |
| 1500–1000 | Disappearance of bands at 1481 cm−1 and 1008 cm−1 Intensity reduction in the band at 1427 cm−1 | No changes |
| 1000–500 | Disappearance of bands at 983 cm−1, 962 cm−1, 835 cm−1, and 507 cm−1 | Intensity reduction in bands at 860 cm−1 and increased absorption intensity of the band at 740 cm−1 |
| 500–400 | Disappearance of bands at 499 cm−1, 437 cm−1, and 428 cm−1 | Disappearance of band at 437 cm−1 |
| Enzymatic Activities in Fermented Broth Per Strain | PET1 | PET2 |
|---|---|---|
| C. trifolii CBMAI 2111 | ||
| Lipase (UA) | 0.31 ± 0.2 | 0.47 ± 0.1 |
| Esterase (µmol α-naphthol per µg of protein) | 0.55 ± 0.2 | 1.04 ± 0.4 |
| Trichoderma sp. CBMAI 2071 | ||
| Lipase (UA) | 0.6 ± 0.1 | 0.42 ± 0.1 |
| Esterase (µmol α-naftol per µg of protein) | 0.48 ± 0.1 | 2.37 ± 0.5 |
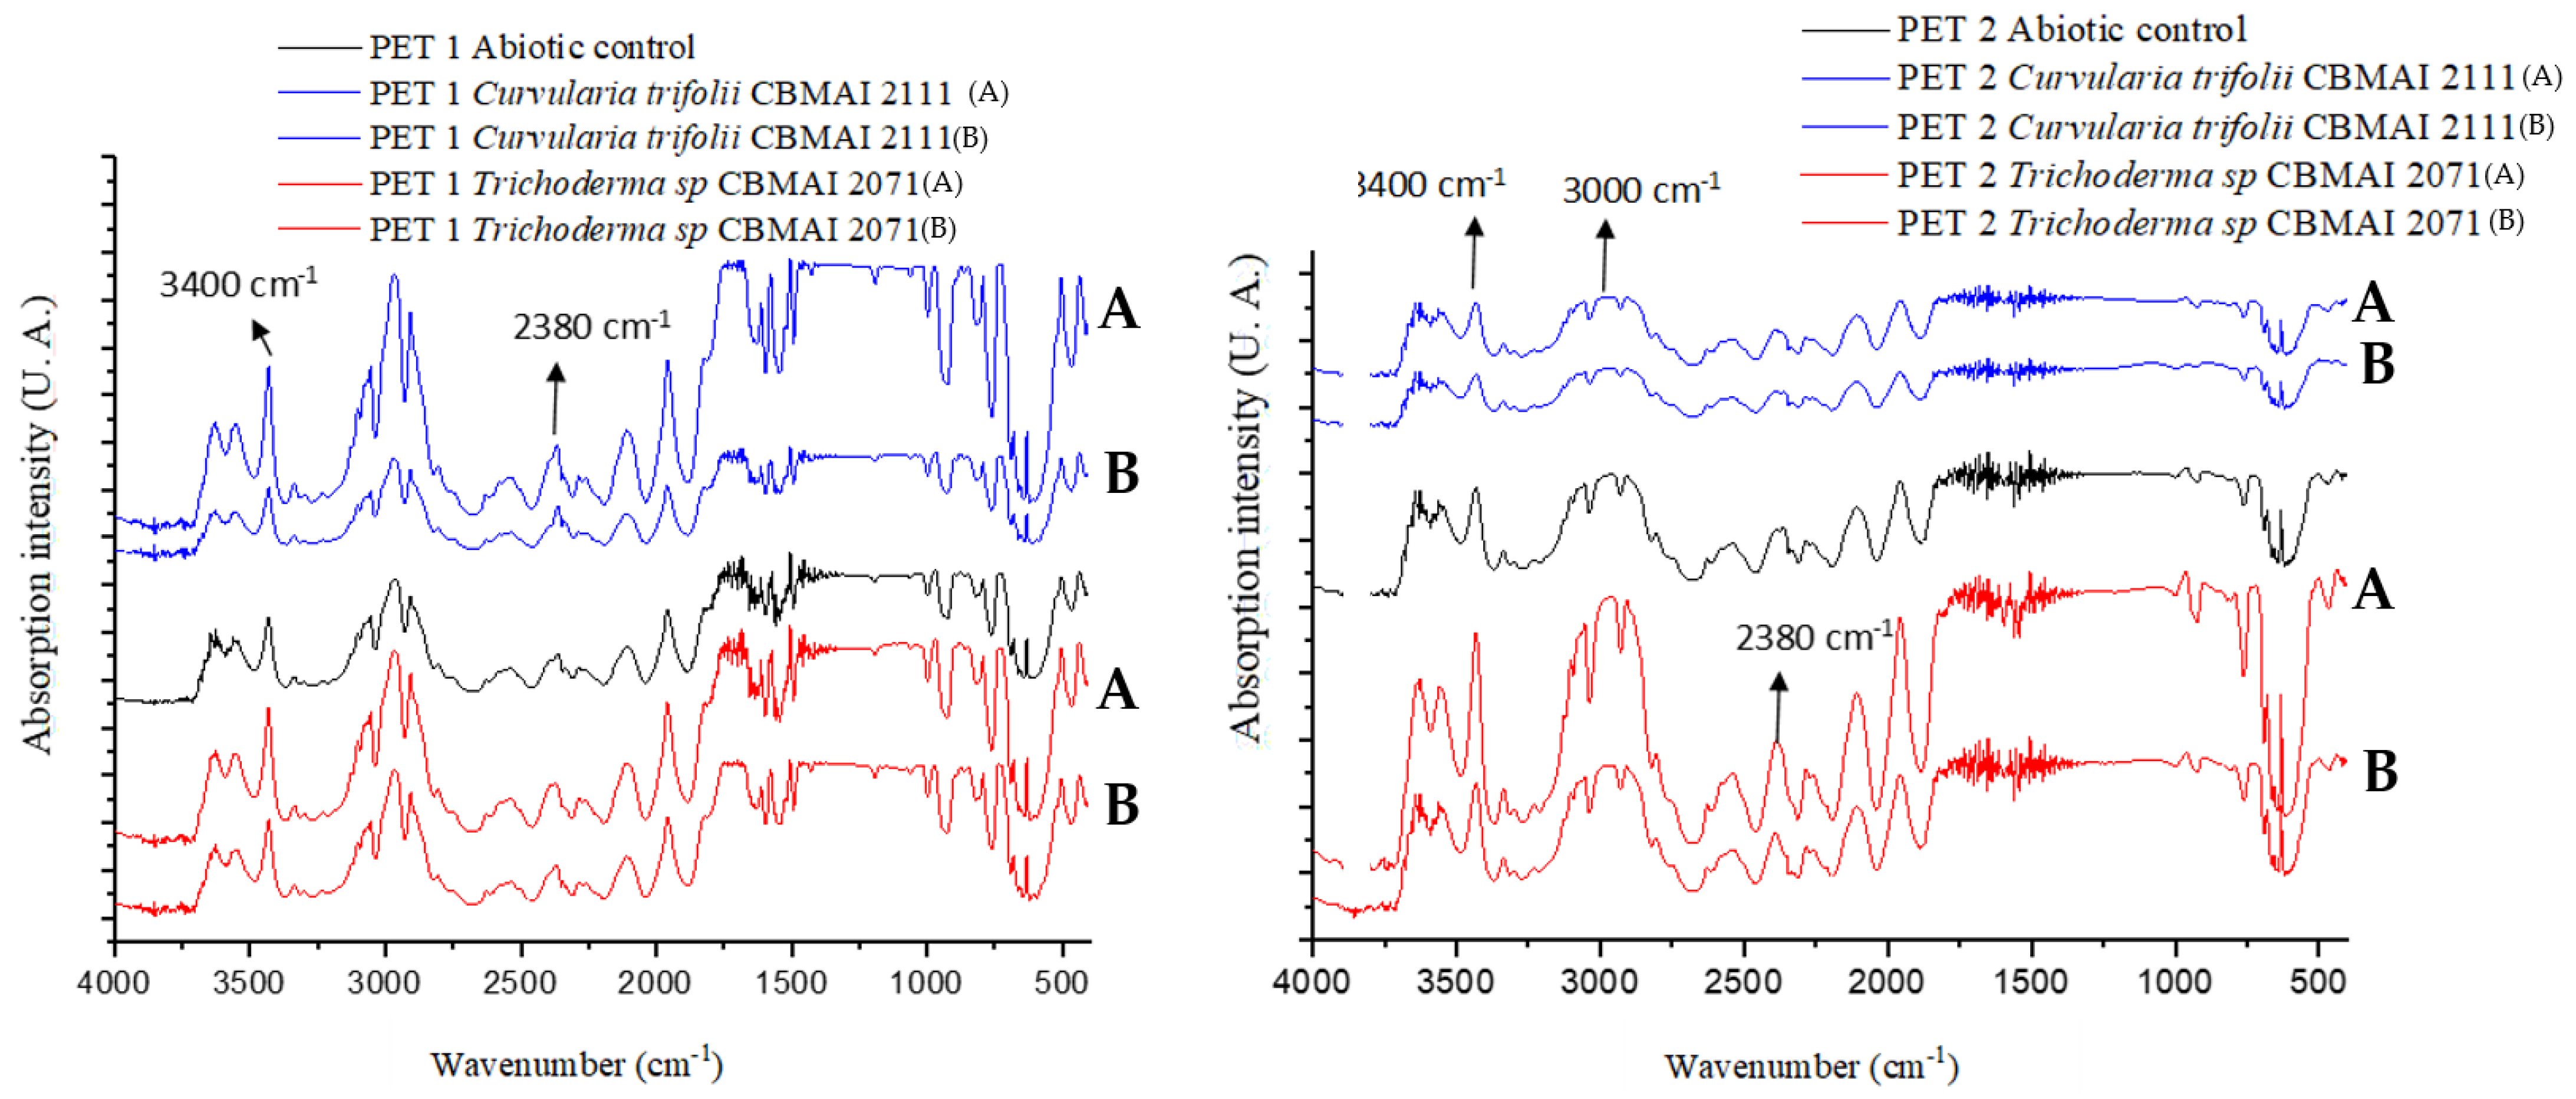
| Wavelength in cm−1 | Trichoderma sp. CBMAI 2071 | C. trifolii CBMAI 2111 | Trichoderma sp. CBMAI 2071 | C. trifolii CBMAI 2111 |
|---|---|---|---|---|
| PET 1 | PET 2 | |||
| 4000–3000 | Disappearance of peaks at 3645 cm−1 and 3626 cm−1, absorption intensity increase in peaks at 3341 cm−1, 3334 cm−1, and 3226 cm−1 | Disappearance of peaks at 3645 cm−1 and 3626 cm−1, absorption intensity increase in peaks at 3341 cm−1, 3334 cm−1, and 3226 cm−1 | Absorption intensity increase in peak at 3646 cm−1 | No changes |
| 3000–2500 | Absorption intensity increase in peaks at 2974 cm−1, 2904 cm−1, 2276 cm−1, 2389 cm−1, and 2340 cm−1, appearance of a new peak at 2540 cm−1 | Absorption intensity increase in peaks at 2974 cm−1, 2904 cm−1, 2276 cm−1, 2389 cm−1, and 2340 cm−1 | No changes | Absorption intensity reduction in peak at 2740 cm−1 |
| 2500–2000 | No changes | No changes | Absorption intensity increase in peaks at 2380 cm−1, 2264 cm−1, and 2112 cm−1 | Disappearance of peaks at 2264 cm−1 |
| 2000–1500 | Absorption intensity increase in band at 1504 cm−1 | Absorption intensity increase in band at 1504 cm−1 | Absorption intensity increase in band at 1502 cm−1 | No changes |
| 1000–500 | No changes | Appearance of a new band at 658 cm−1 | Increase in absorption intensity increase in peaks at 956 cm−1 and 630 cm−1, disappearance of band at 656 cm−1 | Disappearance of band at 656 cm−1, absorption intensity reduction in band at 956 cm−1 |
Disclaimer/Publisher’s Note: The statements, opinions and data contained in all publications are solely those of the individual author(s) and contributor(s) and not of MDPI and/or the editor(s). MDPI and/or the editor(s) disclaim responsibility for any injury to people or property resulting from any ideas, methods, instructions or products referred to in the content. |
© 2023 by the authors. Licensee MDPI, Basel, Switzerland. This article is an open access article distributed under the terms and conditions of the Creative Commons Attribution (CC BY) license (https://creativecommons.org/licenses/by/4.0/).
Share and Cite
Malafatti-Picca, L.; Bucioli, E.C.; de Barros Chaves, M.R.; de Castro, A.M.; Valoni, É.; de Oliveira, V.M.; Marsaioli, A.J.; Govone, J.S.; de Franceschi de Angelis, D.; Brienzo, M.; et al. Fungal Screening for Potential PET Depolymerization. Polymers 2023, 15, 1581. https://doi.org/10.3390/polym15061581
Malafatti-Picca L, Bucioli EC, de Barros Chaves MR, de Castro AM, Valoni É, de Oliveira VM, Marsaioli AJ, Govone JS, de Franceschi de Angelis D, Brienzo M, et al. Fungal Screening for Potential PET Depolymerization. Polymers. 2023; 15(6):1581. https://doi.org/10.3390/polym15061581
Chicago/Turabian StyleMalafatti-Picca, Lusiane, Elaine Cristina Bucioli, Michel Ricardo de Barros Chaves, Aline Machado de Castro, Érika Valoni, Valéria Maia de Oliveira, Anita Jocelyne Marsaioli, José Silvio Govone, Dejanira de Franceschi de Angelis, Michel Brienzo, and et al. 2023. "Fungal Screening for Potential PET Depolymerization" Polymers 15, no. 6: 1581. https://doi.org/10.3390/polym15061581