
Microplastic Removal from Drinking Water Using Point-of-Use Devices


Abstract
:1. Introduction
2. Materials and Methods
2.1. Point-of-Use Treatment Devices
2.2. Preparation of Stock Solutions
2.3. Preparation of Spike Solutions
2.4. Laboratory Control Measures
2.5. System Blanks
2.6. Spike and Recovery
2.7. Spiking Microplastics into POU Devices
2.8. Quantification of Microplastics
2.9. Mass Balance around Microplastic Analysis
3. Results and Discussion
3.1. Blanks
3.2. Microplastic Recovery Determination
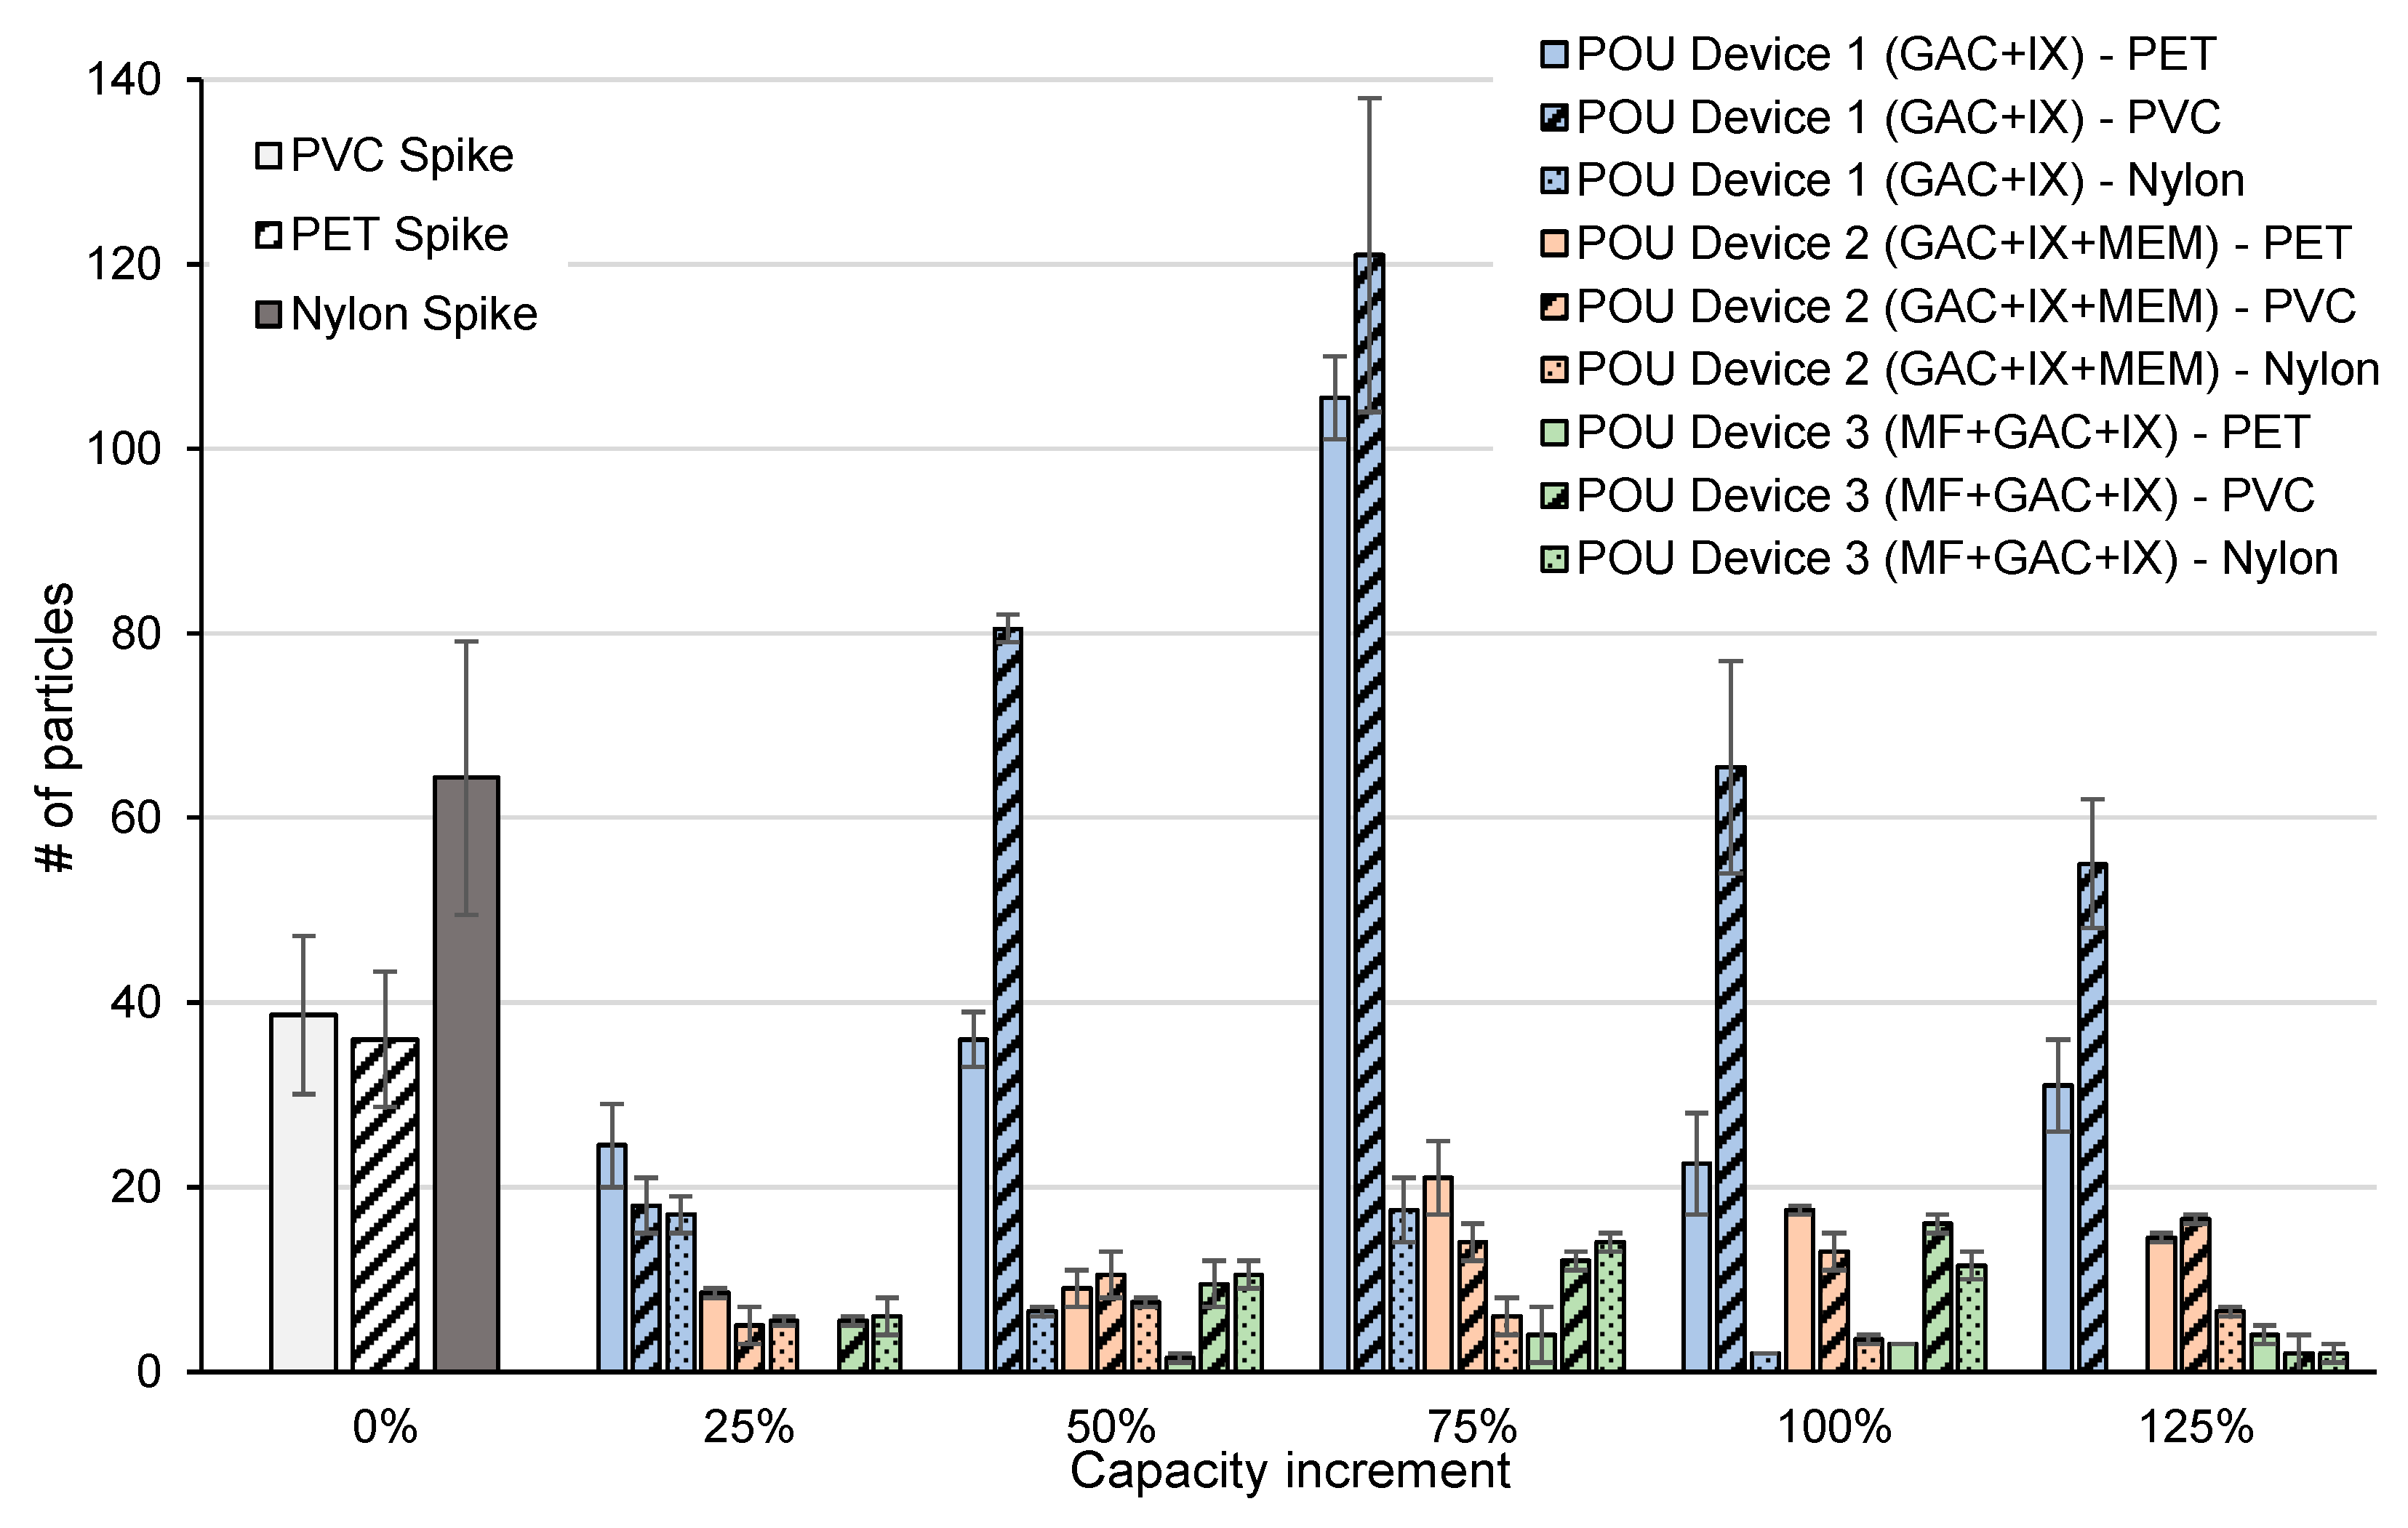
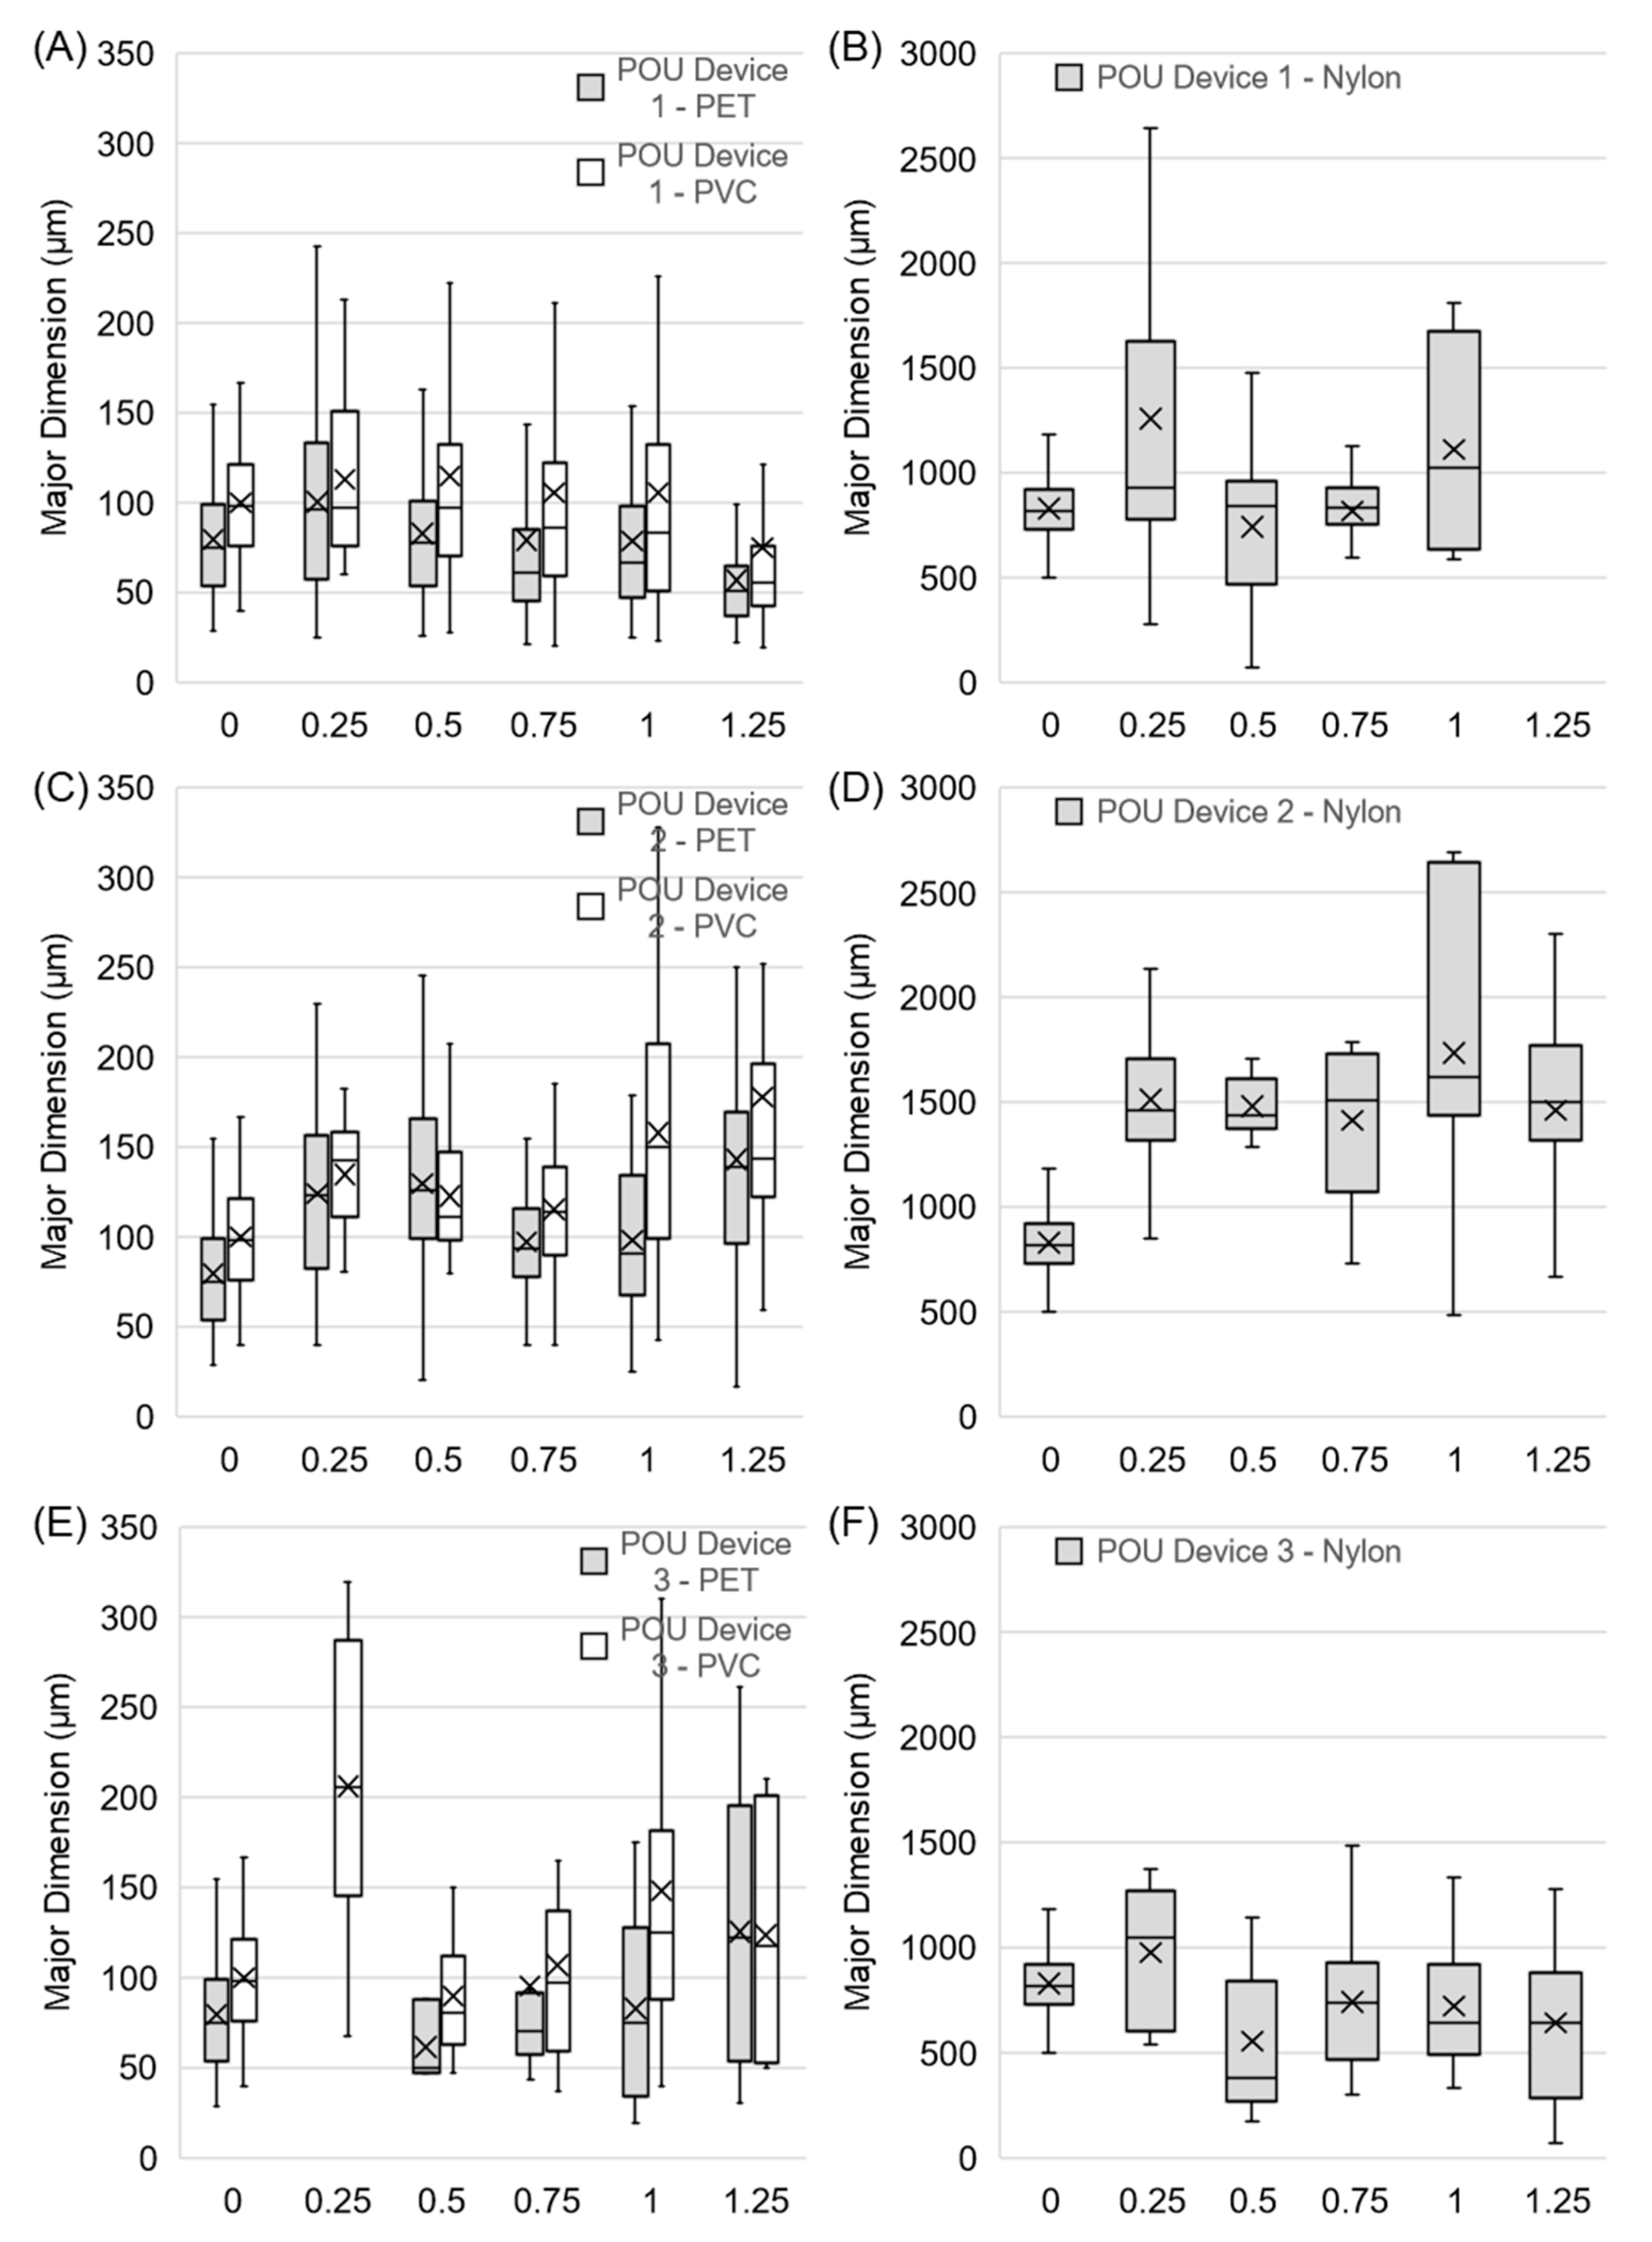
3.3. MP Removal by POU Devices
4. Conclusions
Author Contributions
Funding
Data Availability Statement
Conflicts of Interest
References
- Rochman, C.M.; Brookson, C.; Bikker, J.; Djuric, N.; Earn, A.; Bucci, K.; Athey, S.; Huntington, A.; McIlwraith, H.; Munno, K.; et al. Rethinking Microplastics as a Diverse Contaminant Suite. Environ. Toxicol. Chem. 2019, 38, 703–711. [Google Scholar] [CrossRef] [Green Version]
- Novotna, K.; Cermakova, L.; Pivokonska, L.; Cajthaml, T.; Pivokonsky, M. Microplastics in Drinking Water Treatment—Current Knowledge and Research Needs. Sci. Total Environ. 2019, 667, 730–740. [Google Scholar] [CrossRef] [PubMed]
- Grbić, J.; Helm, P.; Athey, S.; Rochman, C.M. Microplastics Entering Northwestern Lake Ontario Are Diverse and Linked to Urban Sources. Water Res. 2020, 174, 115623. [Google Scholar] [CrossRef] [PubMed]
- Pivokonsky, M.; Cermakova, L.; Novotna, K.; Peer, P.; Cajthaml, T.; Janda, V. Occurrence of Microplastics in Raw and Treated Drinking Water. Sci. Total Environ. 2018, 643, 1644–1651. [Google Scholar] [CrossRef] [PubMed]
- Mintenig, S.M.M.; Löder, M.G.J.G.J.; Primpke, S.; Gerdts, G. Low Numbers of Microplastics Detected in Drinking Water from Ground Water Sources. Sci. Total Environ. 2019, 648, 631–635. [Google Scholar] [CrossRef] [PubMed]
- Wang, Z.; Lin, T.; Chen, W. Occurrence and Removal of Microplastics in an Advanced Drinking Water Treatment Plant (ADWTP). Sci. Total Environ. 2020, 700, 134520. [Google Scholar] [CrossRef] [PubMed]
- Pivokonský, M.; Pivokonská, L.; Novotná, K.; Čermáková, L.; Klimtová, M. Occurrence and Fate of Microplastics at Two Different Drinking Water Treatment Plants within a River Catchment. Sci. Total Environ. 2020, 741, 140236. [Google Scholar] [CrossRef]
- Cherniak, S.L.; Almuhtaram, H.; McKie, M.J.; Hermabessiere, L.; Yuan, C.; Rochman, C.M.; Andrews, R.C. Conventional and Biological Treatment for the Removal of Microplastics from Drinking Water. Chemosphere 2022, 288, 132587. [Google Scholar] [CrossRef]
- Shen, M.; Song, B.; Zhu, Y.; Zeng, G.; Zhang, Y.; Yang, Y.; Wen, X.; Chen, M.; Yi, H. Removal of Microplastics via Drinking Water Treatment: Current Knowledge and Future Directions. Chemosphere 2020, 251, 126612. [Google Scholar] [CrossRef]
- Pittroff, M.; Müller, Y.K.; Witzig, C.S.; Scheurer, M.; Storck, F.R.; Zumbülte, N. Microplastic Analysis in Drinking Water Based on Fractionated Filtration Sampling and Raman Microspectroscopy. Environ. Sci. Pollut. Res. 2021. [Google Scholar] [CrossRef]
- Johnson, A.C.; Ball, H.; Cross, R.; Horton, A.A.; Jürgens, M.D.; Read, D.S.; Vollertsen, J.; Svendsen, C. Identification and Quantification of Microplastics in Potable Water and Their Sources within Water Treatment Works in England and Wales. Environ. Sci. Technol. 2020, 54, 12326–12334. [Google Scholar] [CrossRef]
- Bosscher, V.; Lytle, D.A.; Schock, M.R.; Porter, A.; Del Toral, M. POU Water Filters Effectively Reduce Lead in Drinking Water: A Demonstration Field Study in Flint, Michigan. J. Environ. Sci. Health Part A 2019, 54, 484–493. [Google Scholar] [CrossRef] [Green Version]
- Deshommes, E.; Nour, S.; Richer, B.; Cartier, C.; Prévost, M. POU Devices in Large Buildings: Lead Removal and Water Quality. J. Am. Water Works Assoc. 2012, 104, E282–E297. [Google Scholar] [CrossRef]
- Deshommes, E.; Zhang, Y.; Gendron, K.; Sauvé, S.; Edwards, M.; Nour, S.; Prévost, M. Lead Removal from Tap Water Using POU Devices. J. Am. Water Works Assoc. 2010, 102, 91–105. [Google Scholar] [CrossRef]
- Carrière, A.; Brouillon, M.; Sauvé, S.; Bouchard, M.F.; Barbeau, B. Performance of Point-of-Use Devices to Remove Manganese from Drinking Water. J. Environ. Sci. Health Part A 2011, 46, 601–607. [Google Scholar] [CrossRef]
- Lothrop, N.; Wilkinson, S.; Verhougstraete, M.; Sugeng, A.; Loh, M.; Klimecki, W.; Beamer, P. Home Water Treatment Habits and Effectiveness in a Rural Arizona Community. Water 2015, 7, 1217–1231. [Google Scholar] [CrossRef] [Green Version]
- Pratson, E.; Vengosh, A.; Dwyer, G.; Pratson, L.; Klein, E. The Effectiveness of Arsenic Remediation from Groundwater in a Private Home. Ground. Water Monit. Remediat. 2010, 30, 87–93. [Google Scholar] [CrossRef]
- Statistics Canada. Treatment of Drinking Water by Canadian Households, 2015; Statistics Canada: Ottawa, ON, Canada, 2017. [Google Scholar]
- Sounthararajah, D.P.; Loganathan, P.; Kandasamy, J.; Vigneswaran, S. Adsorptive Removal of Heavy Metals from Water Using Sodium Titanate Nanofibres Loaded onto GAC in Fixed-Bed Columns. J. Hazard. Mater. 2015, 287, 306–316. [Google Scholar] [CrossRef]
- Alfaro-Núñez, A.; Astorga, D.; Cáceres-Farías, L.; Bastidas, L.; Soto Villegas, C.; Macay, K.C.; Christensen, J.H. Microplastic Pollution in Seawater and Marine Organisms across the Tropical Eastern Pacific and Galápagos. Sci. Rep. 2021, 11, 6424. [Google Scholar] [CrossRef] [PubMed]
- Crittenden, J.C.; Trussell, R.R.; Hand, D.W.; Howe, K.J.; Tchobanoglous, G.; Borchardt, J.H. MWH’s Water Treatment Principles and Design, 3rd ed.; John Wiley & Sons, Inc.: Hoboken, NJ, USA, 2012; ISBN 9780470405390. [Google Scholar]
- Meshko, V.; Markovska, L.; Mincheva, M.; Rodrigues, A. Adsorption of Basic Dyes on Granular Acivated Carbon and Natural Zeolite. Water Res. 2001, 35, 3357–3366. [Google Scholar] [CrossRef] [PubMed]
- An, Y.; Wang, Z.; Wu, Z.; Yang, D.; Zhou, Q. Characterization of Membrane Foulants in an Anaerobic Non-Woven Fabric Membrane Bioreactor for Municipal Wastewater Treatment. Chem. Eng. J. 2009, 155, 709–715. [Google Scholar] [CrossRef]
- Tewari, A.; Almuhtaram, H.; McKie, M.J.; Andrews, R.C. Microplastics for Use in Environmental Research. J. Polym. Environ. 2022, 30, 4320–4332. [Google Scholar] [CrossRef]
- Koelmans, A.A.; Mohamed Nor, N.H.; Hermsen, E.; Kooi, M.; Mintenig, S.M.; De France, J. Microplastics in Freshwaters and Drinking Water: Critical Review and Assessment of Data Quality. Water Res. 2019, 155, 410–422. [Google Scholar] [CrossRef] [PubMed]
- Nuelle, M.-T.; Dekiff, J.H.; Remy, D.; Fries, E. A New Analytical Approach for Monitoring Microplastics in Marine Sediments. Environ. Pollut. 2014, 184, 161–169. [Google Scholar] [CrossRef]
- Lusher, A.L.; Burke, A.; O’Connor, I.; Officer, R. Microplastic Pollution in the Northeast Atlantic Ocean: Validated and Opportunistic Sampling. Mar. Pollut. Bull. 2014, 88, 325–333. [Google Scholar] [CrossRef] [PubMed]
- Prata, J.C.; da Costa, J.P.; Girão, A.V.; Lopes, I.; Duarte, A.C.; Rocha-Santos, T. Identifying a Quick and Efficient Method of Removing Organic Matter without Damaging Microplastic Samples. Sci. Total Environ. 2019, 686, 131–139. [Google Scholar] [CrossRef]
- Van Cauwenberghe, L.; Janssen, C.R. Microplastics in Bivalves Cultured for Human Consumption. Environ. Pollut. 2014, 193, 65–70. [Google Scholar] [CrossRef]
- Bannick, C.G.; Szewzyk, R.; Ricking, M.; Schniegler, S.; Obermaier, N.; Barthel, A.K.; Altmann, K.; Eisentraut, P.; Braun, U. Development and Testing of a Fractionated Filtration for Sampling of Microplastics in Water. Water Res. 2019, 149, 650–658. [Google Scholar] [CrossRef]
- Brander, S.M.; Renick, V.C.; Foley, M.M.; Steele, C.; Woo, M.; Lusher, A.; Carr, S.; Helm, P.; Box, C.; Cherniak, S.; et al. Sampling and Quality Assurance and Quality Control: A Guide for Scientists Investigating the Occurrence of Microplastics Across Matrices. Appl. Spectrosc. 2020, 74, 1099–1125. [Google Scholar] [CrossRef]
- Marsh, H.; Rodríguez-Reinoso, F. Applicability of Activated Carbon. In Activated Carbon; Elsevier: Amsterdam, The Netherlands, 2006; pp. 383–453. [Google Scholar]
- Muraviev, D.; Gorshkov, V.; Warshawsky, A. Ion Exchange; Taylor & Francis Group: Abingdon, UK, 1999; ISBN 9780203908341. [Google Scholar]
- Malankowska, M.; Echaide-Gorriz, C.; Coronas, J. Microplastics in Marine Environment: A Review on Sources, Classification, and Potential Remediation by Membrane Technology. Environ. Sci. Water Res. Technol. 2021, 7, 243–258. [Google Scholar] [CrossRef]
- Yuan, C.; Almuhtaram, H.; McKie, M.J.; Andrews, R.C. Assessment of Microplastic Sampling and Extraction Methods for Drinking Waters. Chemosphere 2022, 286, 131881. [Google Scholar] [CrossRef] [PubMed]
- Ziajahromi, S.; Neale, P.A.; Rintoul, L.; Leusch, F.D.L. Wastewater Treatment Plants as a Pathway for Microplastics: Development of a New Approach to Sample Wastewater-Based Microplastics. Water Res. 2017, 112, 93–99. [Google Scholar] [CrossRef] [PubMed]
- Dalmau-Soler, J.; Ballesteros-Cano, R.; Boleda, M.R.; Paraira, M.; Ferrer, N.; Lacorte, S. Microplastics from Headwaters to Tap Water: Occurrence and Removal in a Drinking Water Treatment Plant in Barcelona Metropolitan Area (Catalonia, NE Spain). Environ. Sci. Pollut. Res. 2021, 28, 59462–59472. [Google Scholar] [CrossRef] [PubMed]
- Kirstein, I.V.; Hensel, F.; Gomiero, A.; Iordachescu, L.; Vianello, A.; Wittgren, H.B.; Vollertsen, J. Drinking Plastics?—Quantification and Qualification of Microplastics in Drinking Water Distribution Systems by ΜFTIR and Py-GCMS. Water Res. 2021, 188, 116519. [Google Scholar] [CrossRef]
- Talvitie, J.; Mikola, A.; Koistinen, A.; Setälä, O. Solutions to Microplastic Pollution—Removal of Microplastics from Wastewater Effluent with Advanced Wastewater Treatment Technologies. Water Res. 2017, 123, 401–407. [Google Scholar] [CrossRef] [PubMed] [Green Version]
- Campanale, C.; Massarelli, C.; Savino, I.; Locaputo, V.; Uricchio, V.F. A Detailed Review Study on Potential Effects of Microplastics and Additives of Concern on Human Health. Int. J. Environ. Res. Public Health 2020, 17, 1212. [Google Scholar] [CrossRef] [Green Version]
- Smith, M.; Love, D.C.; Rochman, C.M.; Neff, R.A. Microplastics in Seafood and the Implications for Human Health. Curr. Environ. Heal. Reports 2018, 5, 375–386. [Google Scholar] [CrossRef] [PubMed] [Green Version]
- Rist, S.; Carney Almroth, B.; Hartmann, N.B.; Karlsson, T.M. A Critical Perspective on Early Communications Concerning Human Health Aspects of Microplastics. Sci. Total Environ. 2018, 626, 720–726. [Google Scholar] [CrossRef] [Green Version]
- Rahman, A.; Sarkar, A.; Yadav, O.P.; Achari, G.; Slobodnik, J. Potential Human Health Risks Due to Environmental Exposure to Nano- and Microplastics and Knowledge Gaps: A Scoping Review. Sci. Total Environ. 2021, 757, 143872. [Google Scholar] [CrossRef]
- Almuhtaram, H.; Andrews, R.C. Sampling Microplastics in Water Matrices: A Need for Standardization. ACS ES&T Water 2022, 2, 1276–1278. [Google Scholar] [CrossRef]


| Treatment Technologies | No. of Individual Units Tested | Estimated Maximum Capacity | Certifications | Recommended Operating Limits |
|---|---|---|---|---|
| POU 1 (GAC + IX) | 2 | 150 L (GAC/IX) and 1000 L (MF) | NSF/ANSI Standards 42 and 53 | • Water temperature: 0 °C–29 °C (POU 1), 2 °C–30 °C (POU 2), 0 °C–60 °C (POU 3) • Recommended replacement interval: two months (GAC/IX), one year (MF) |
| POU 2 (GAC + IX + MEM) | 2 | |||
| POU 3 (MF + GAC + IX) | 2 |
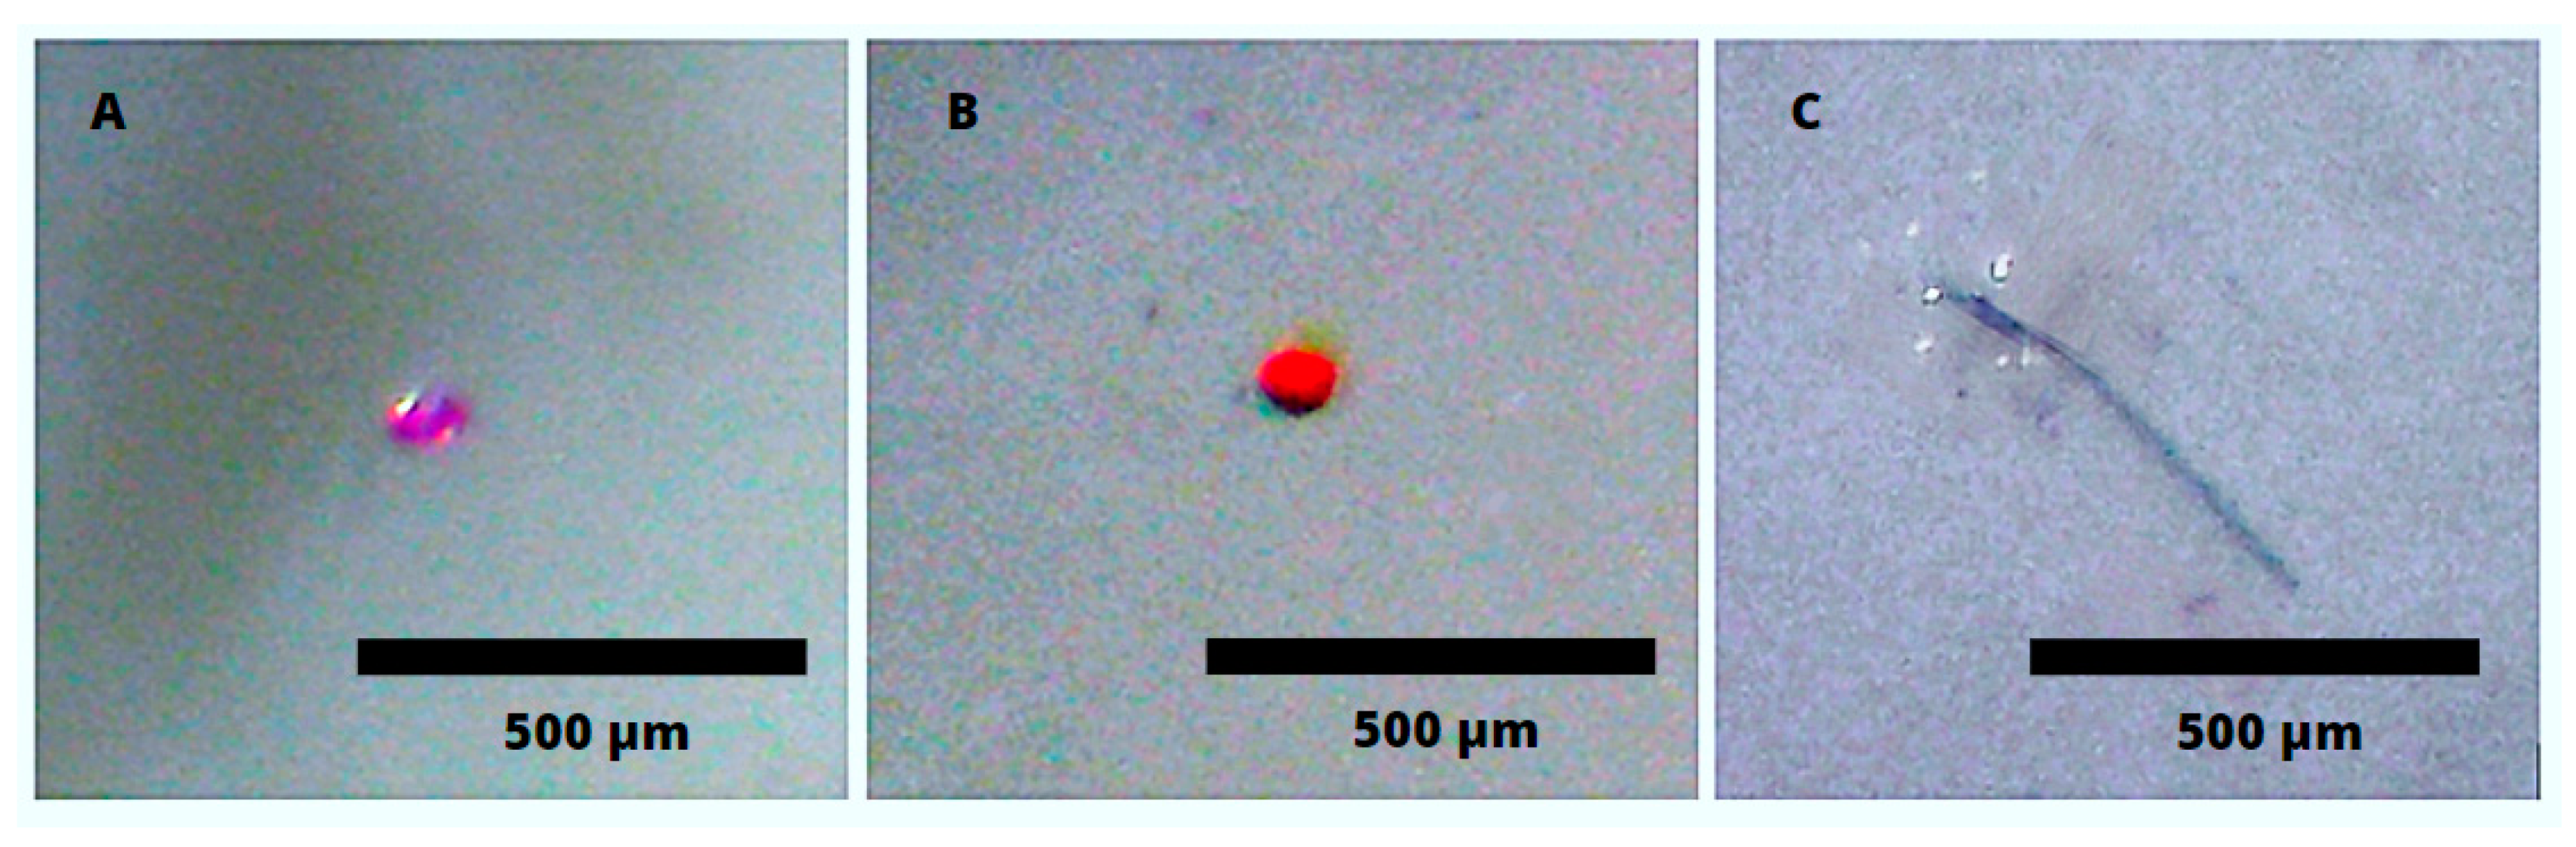
| Composition | Color | Shape | Average Major Dimension (µm) | Average Minor Dimension (µm) | Major Dimension Size Range (µm) | Density (g/cm3) | Number of Particles Spiked | Source |
|---|---|---|---|---|---|---|---|---|
| PVC | Orange (dyed) | Fragments | 79 ± 32 | 58 ± 27 | 39–246 | 1.1–1.35 | 39 ± 9 | SABIC Innovative Plastics (Mt Vernon, IN, USA) a |
| PET | Pink (dyed) | Fragments | 100 ± 33 | 74 ± 25 | 28–121 | 1.37–1.46 | 36 ± 7 | |
| Nylon | Green | Fibers | 826 ± 157 | 33 ± 2 | 496–1862 | 1.15 | 64 ± 15 | Flock It (Rockford, IL, USA) |
Disclaimer/Publisher’s Note: The statements, opinions and data contained in all publications are solely those of the individual author(s) and contributor(s) and not of MDPI and/or the editor(s). MDPI and/or the editor(s) disclaim responsibility for any injury to people or property resulting from any ideas, methods, instructions or products referred to in the content. |
© 2023 by the authors. Licensee MDPI, Basel, Switzerland. This article is an open access article distributed under the terms and conditions of the Creative Commons Attribution (CC BY) license (https://creativecommons.org/licenses/by/4.0/).
Share and Cite
Cherian, A.G.; Liu, Z.; McKie, M.J.; Almuhtaram, H.; Andrews, R.C. Microplastic Removal from Drinking Water Using Point-of-Use Devices. Polymers 2023, 15, 1331. https://doi.org/10.3390/polym15061331
Cherian AG, Liu Z, McKie MJ, Almuhtaram H, Andrews RC. Microplastic Removal from Drinking Water Using Point-of-Use Devices. Polymers. 2023; 15(6):1331. https://doi.org/10.3390/polym15061331
Chicago/Turabian StyleCherian, Ashlyn G., Zeyuan Liu, Michael J. McKie, Husein Almuhtaram, and Robert C. Andrews. 2023. "Microplastic Removal from Drinking Water Using Point-of-Use Devices" Polymers 15, no. 6: 1331. https://doi.org/10.3390/polym15061331