

In Situ Synthesis of AZO-Np in Guar Gum/PVOH Composite Fiber Mats for Potential Bactericidal Release
 , and
, and 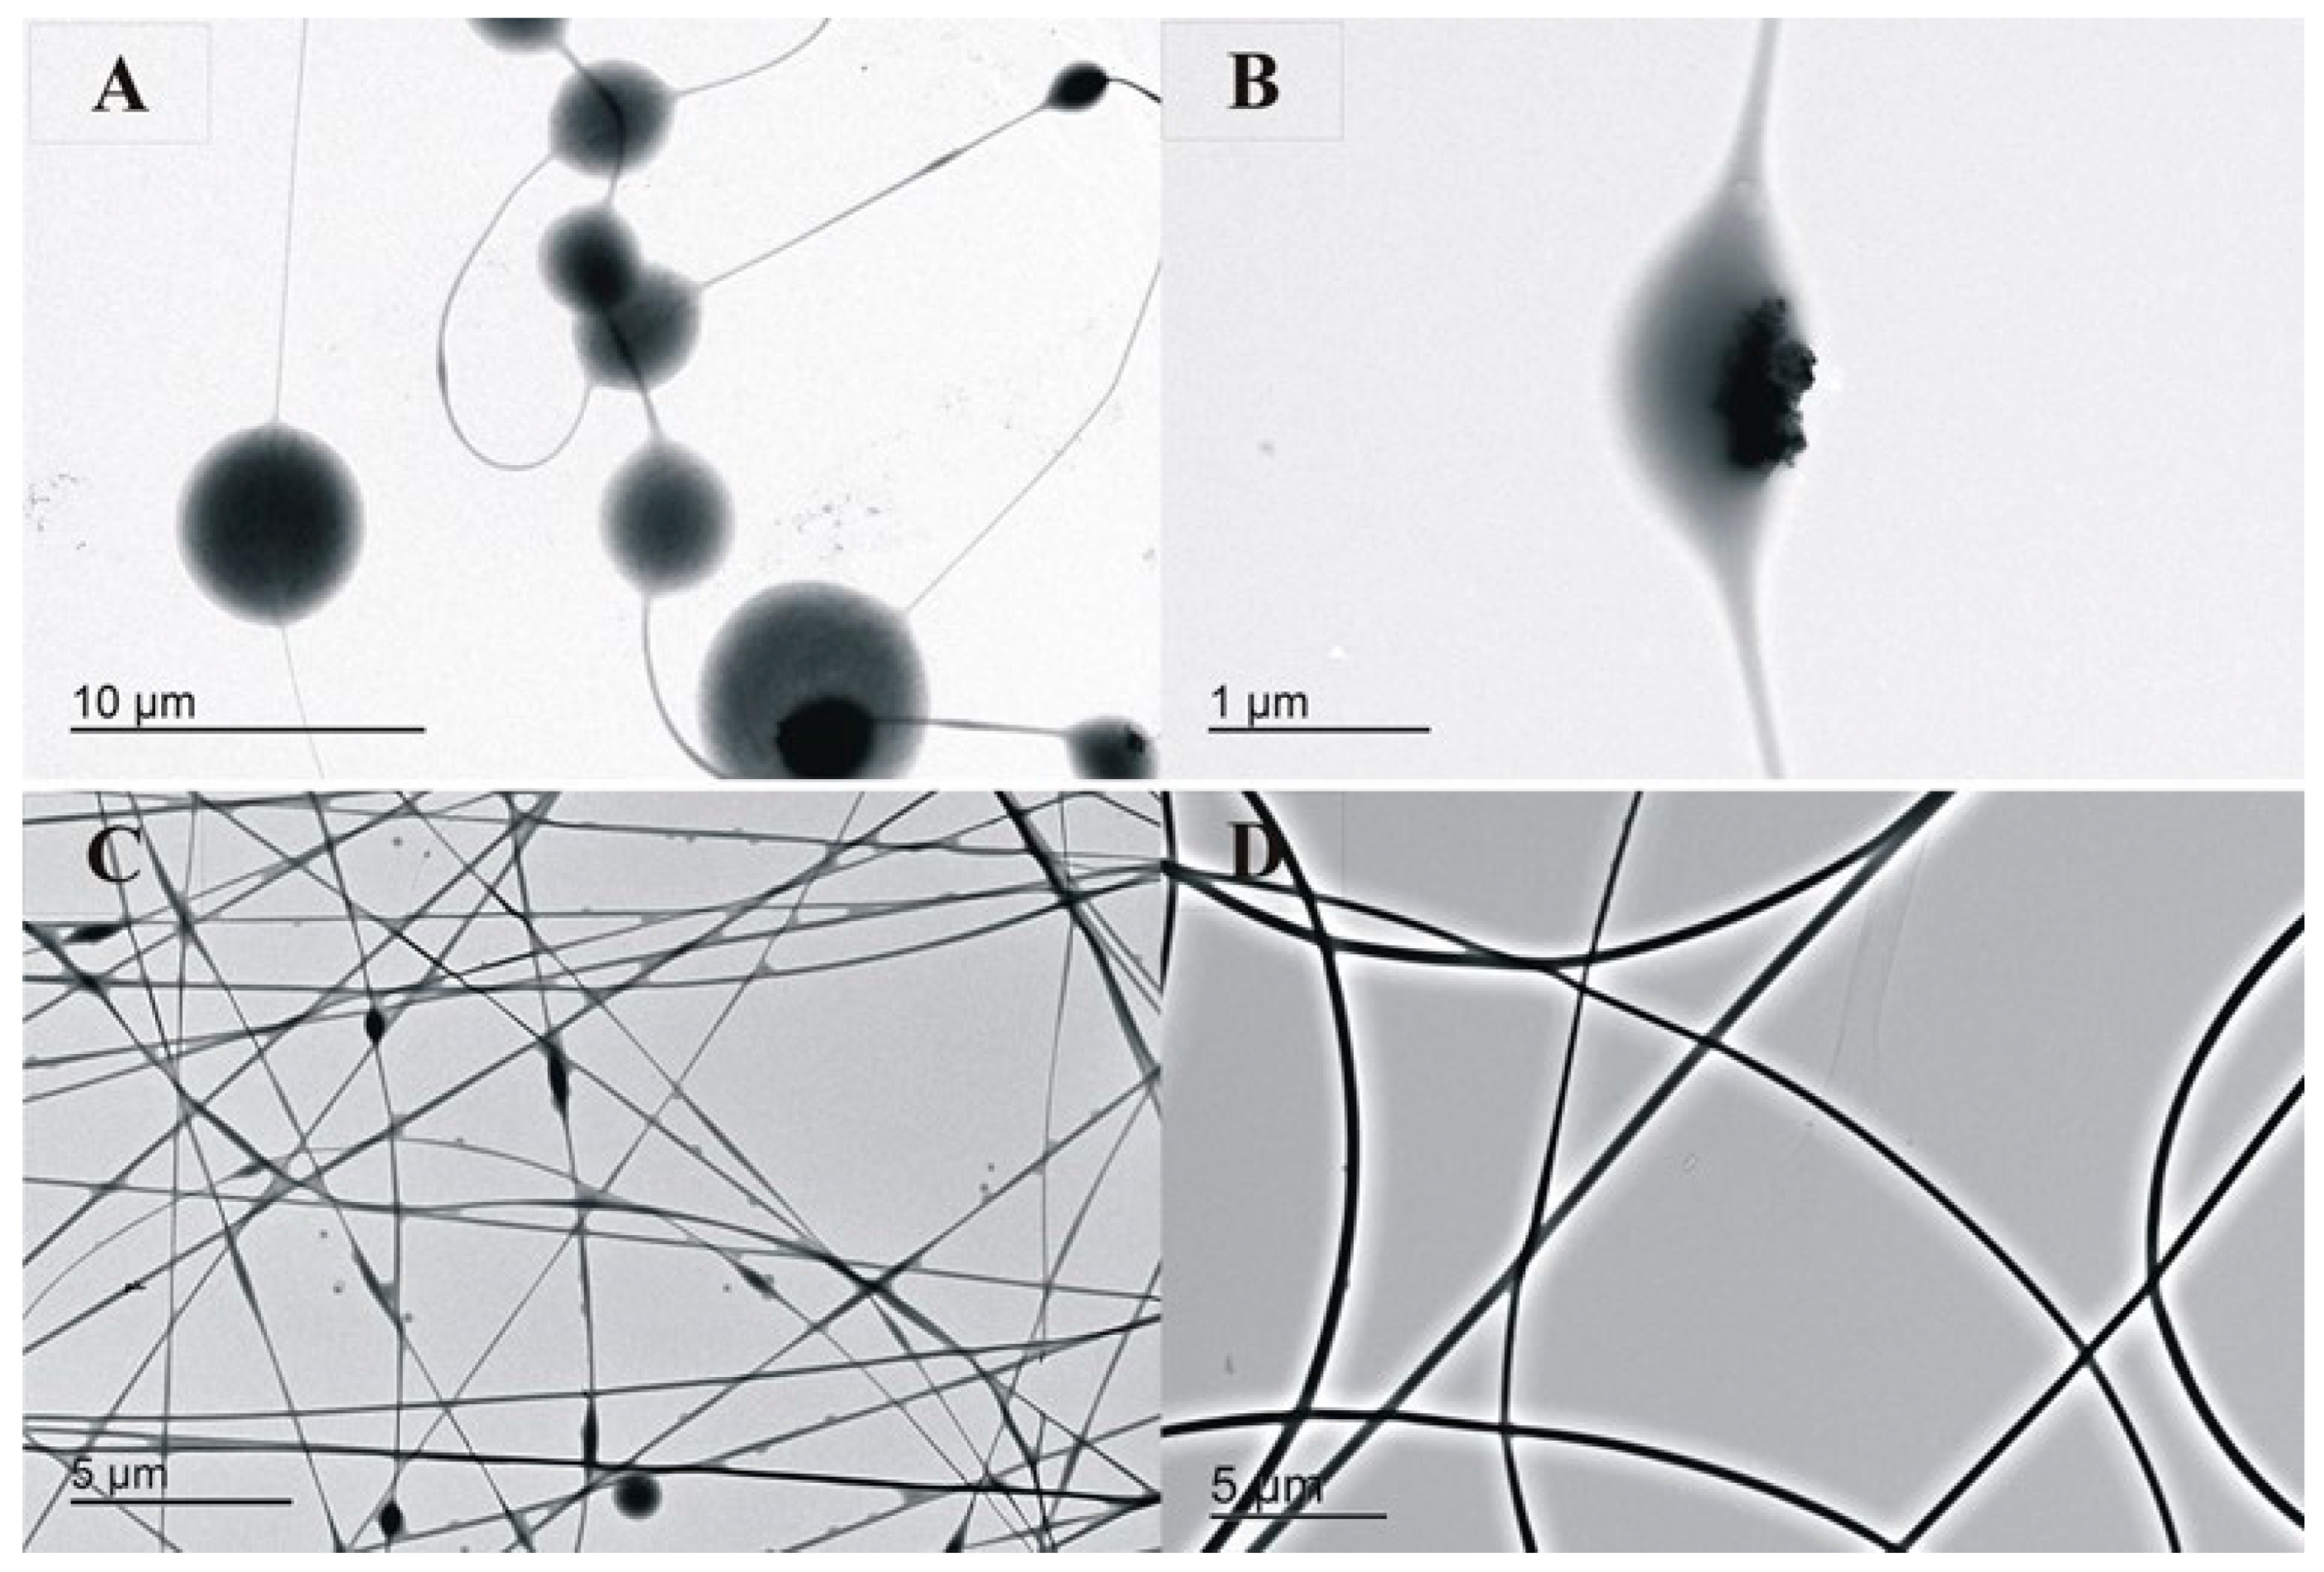
Abstract
:1. Introduction
2. Materials and Methods
2.1. Materials
2.2. Solution Preparation Procedures
- -
- Solubilization of PVOH and GG at pH 7:
- -
- Solubilization of PVOH and GG at pH 7:
- -
- Solubilization of PVOH and GG at acidic pH:
2.3. Electrospinning
2.4. Chemical and Thermal Treatments of Membranes
2.5. Bactericidal Assay Membranes Protocol
2.6. Scanning Electron Microscopy (SEM) and Chemical Analysis
2.7. Transmission Electron Microscopy (TEM)
2.8. Fourier Transform Infrared (FTIR-ATR)
2.9. Rheology
2.10. Antibacterial Assay
3. Results and Discussion
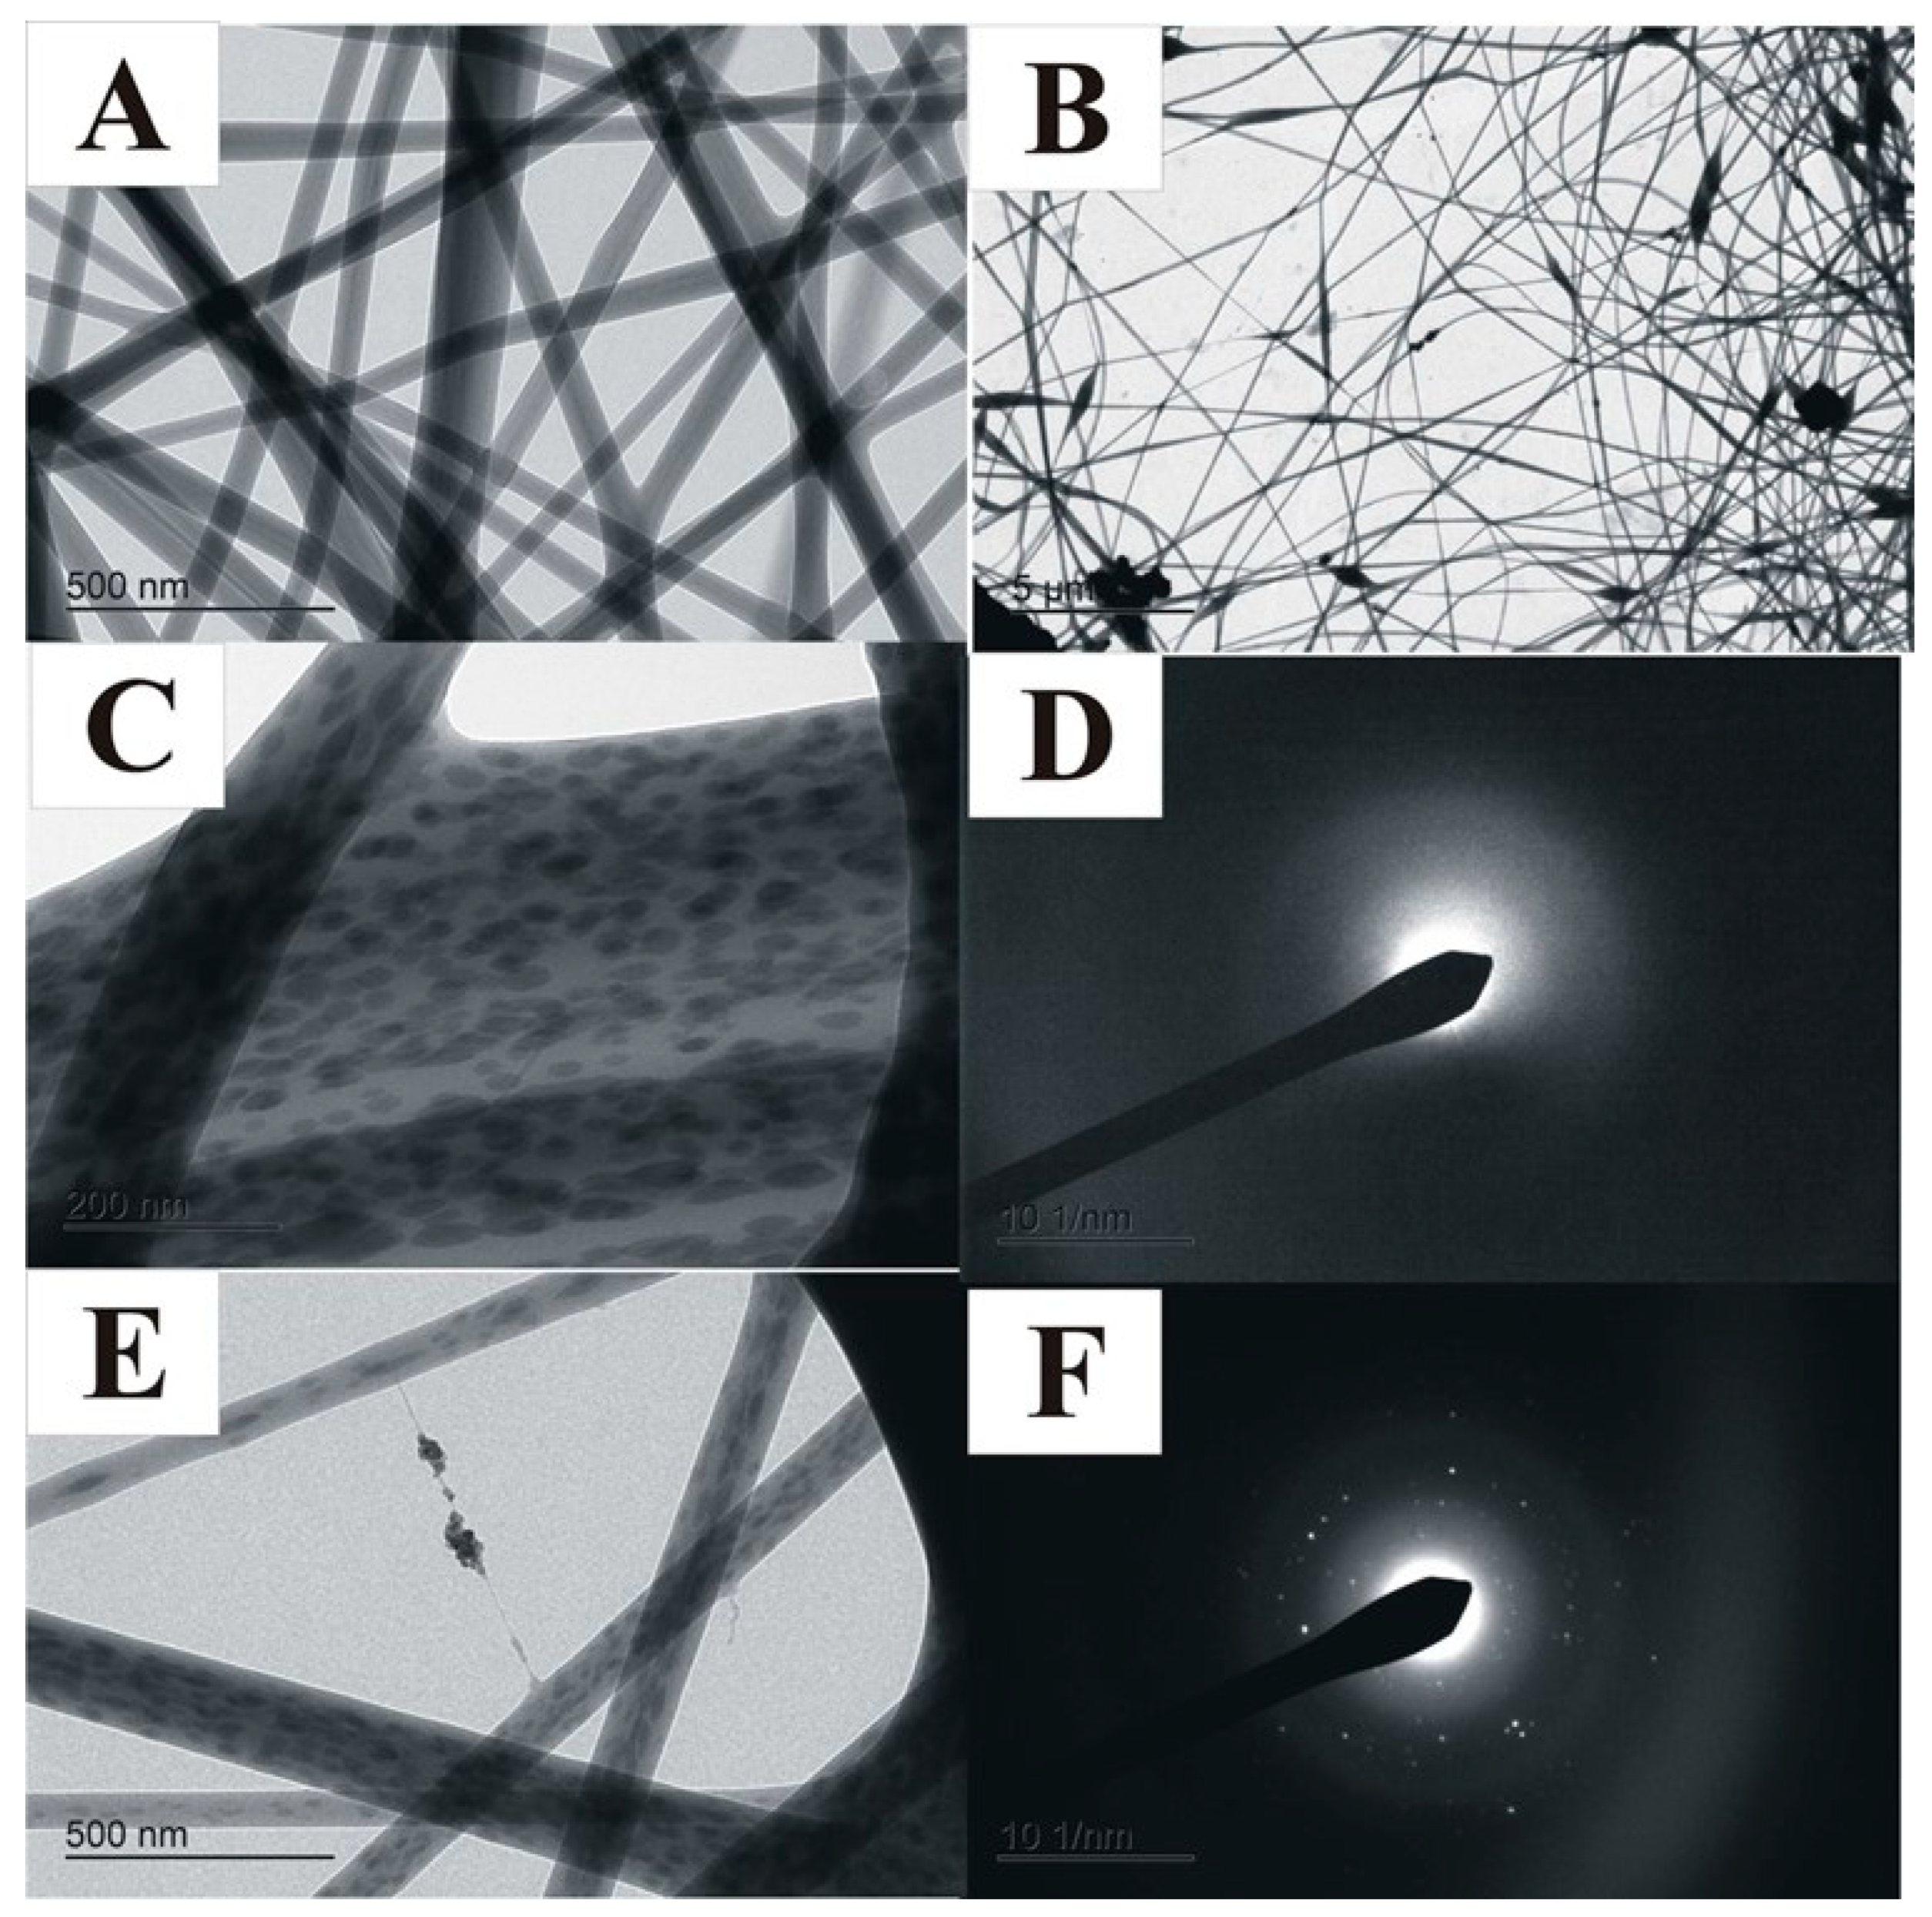
3.1. SEM and TEM Analysis
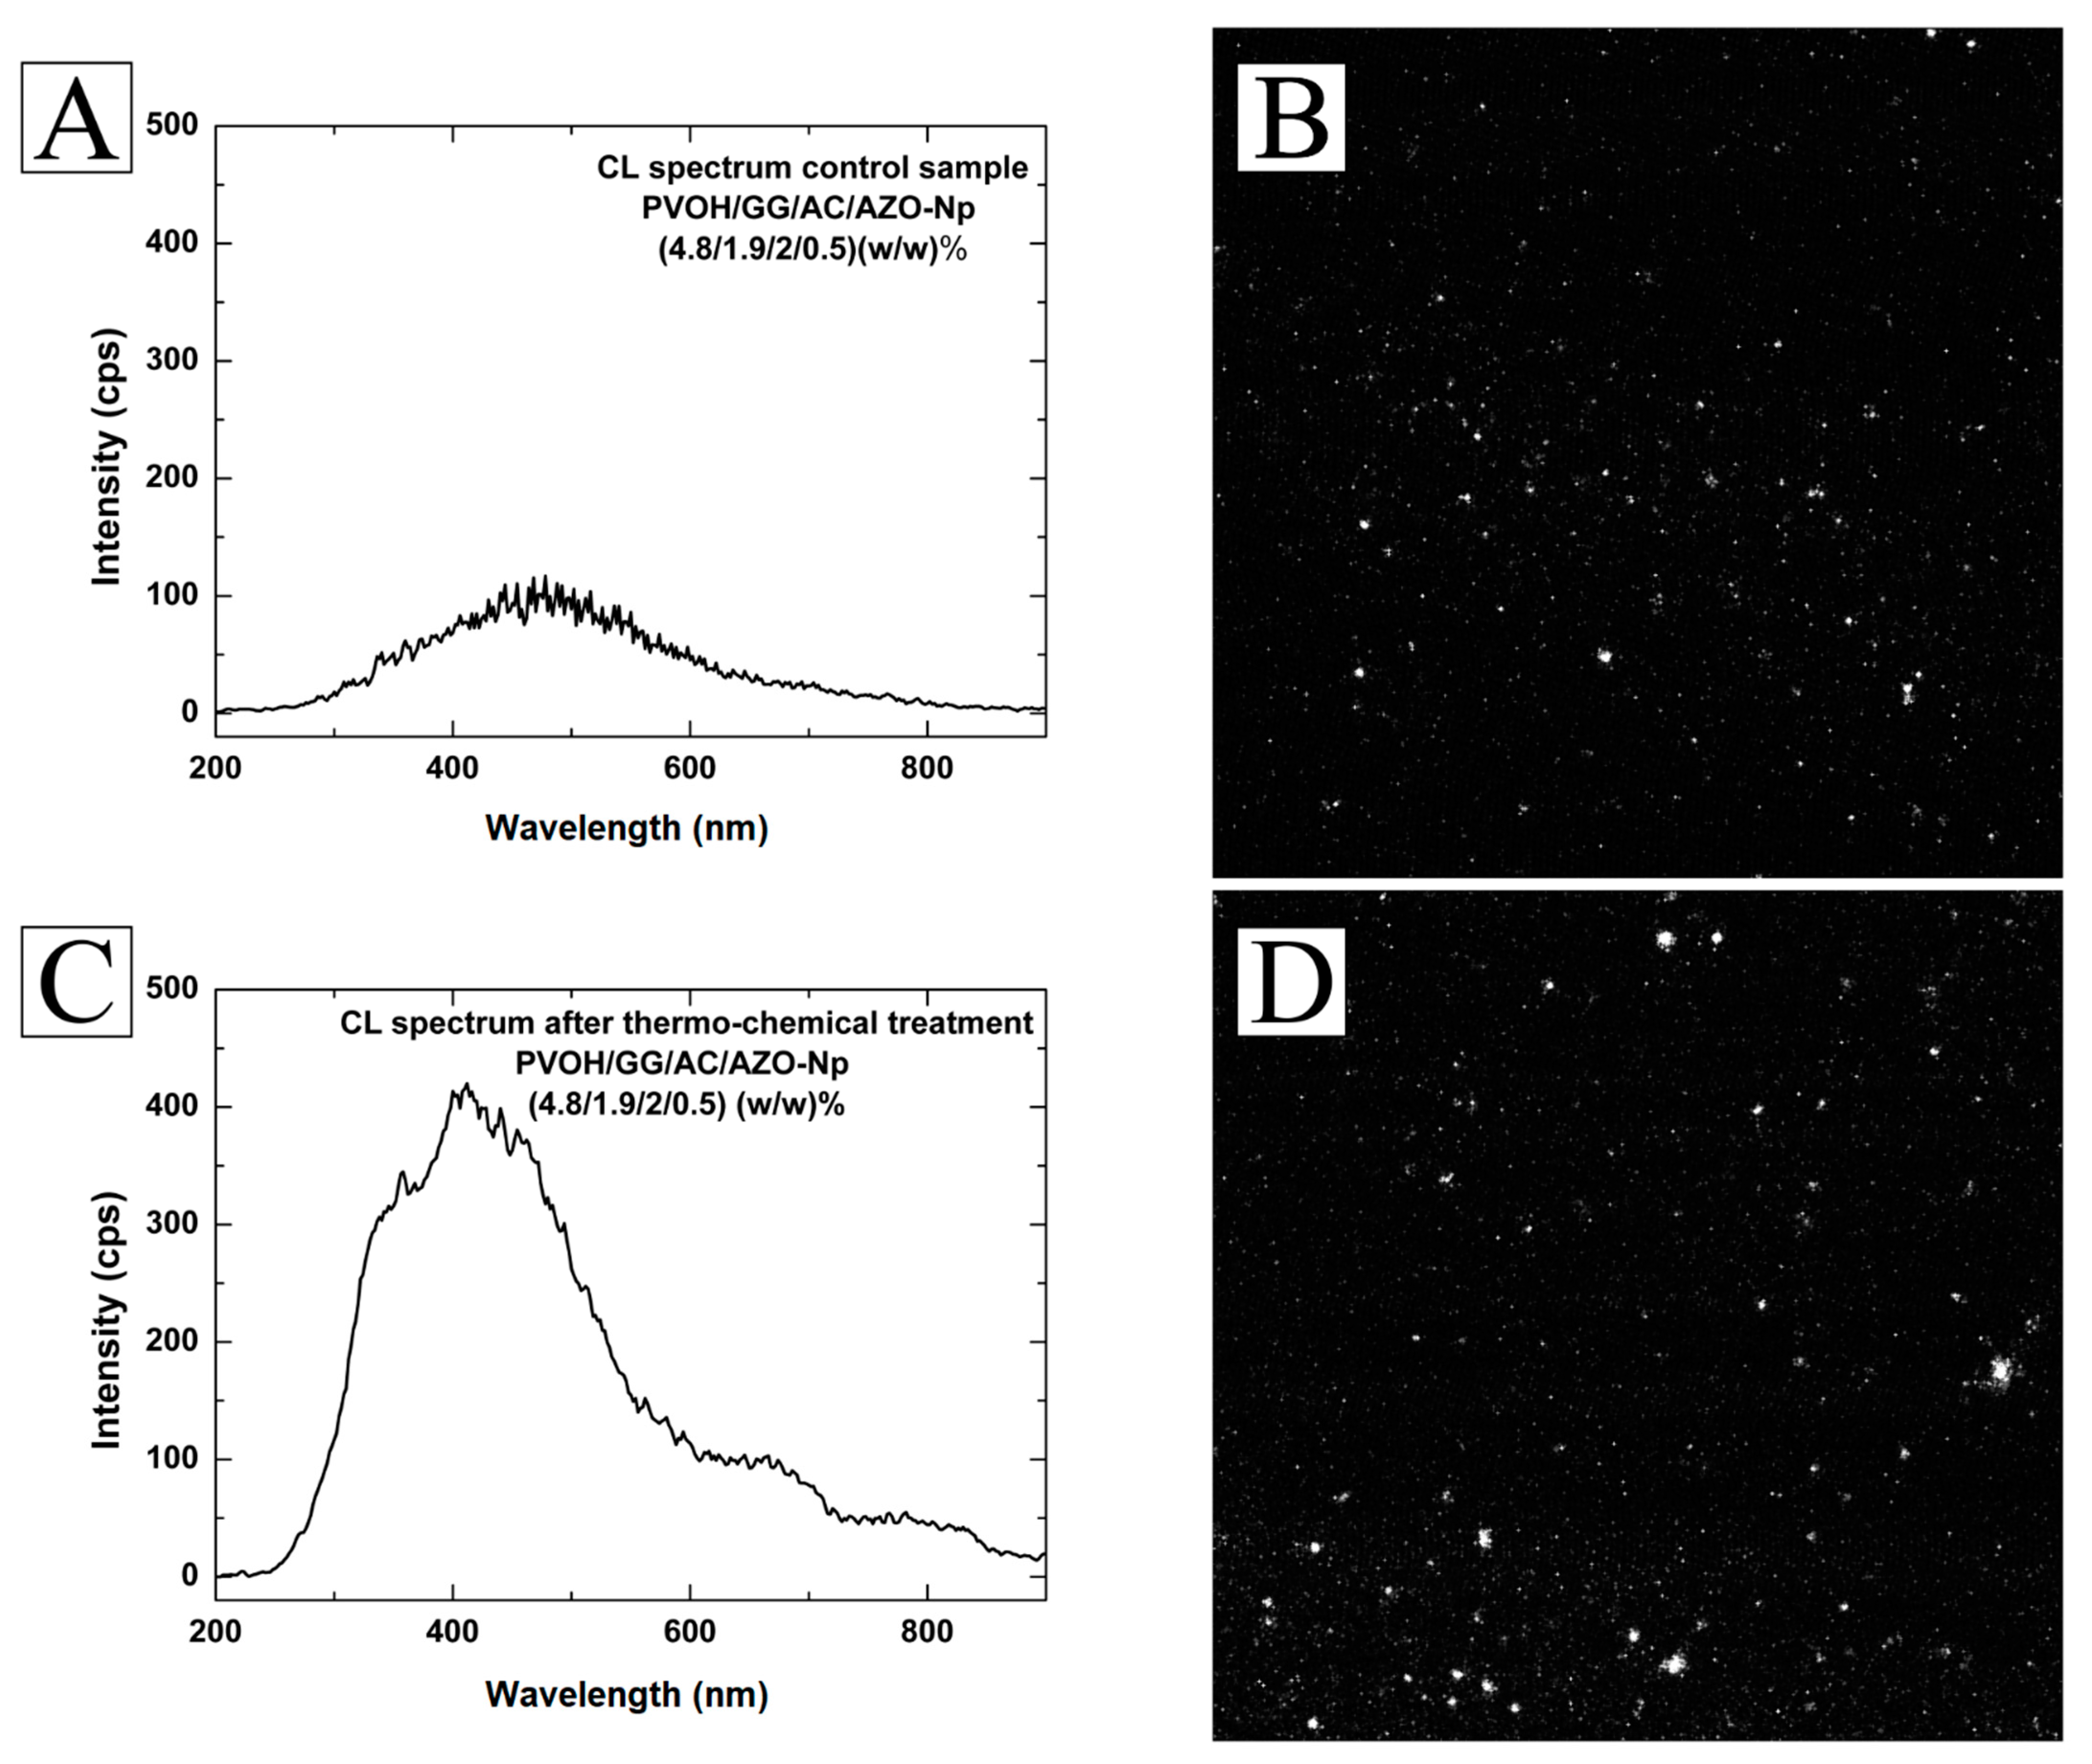
3.2. Cathodoluminescence
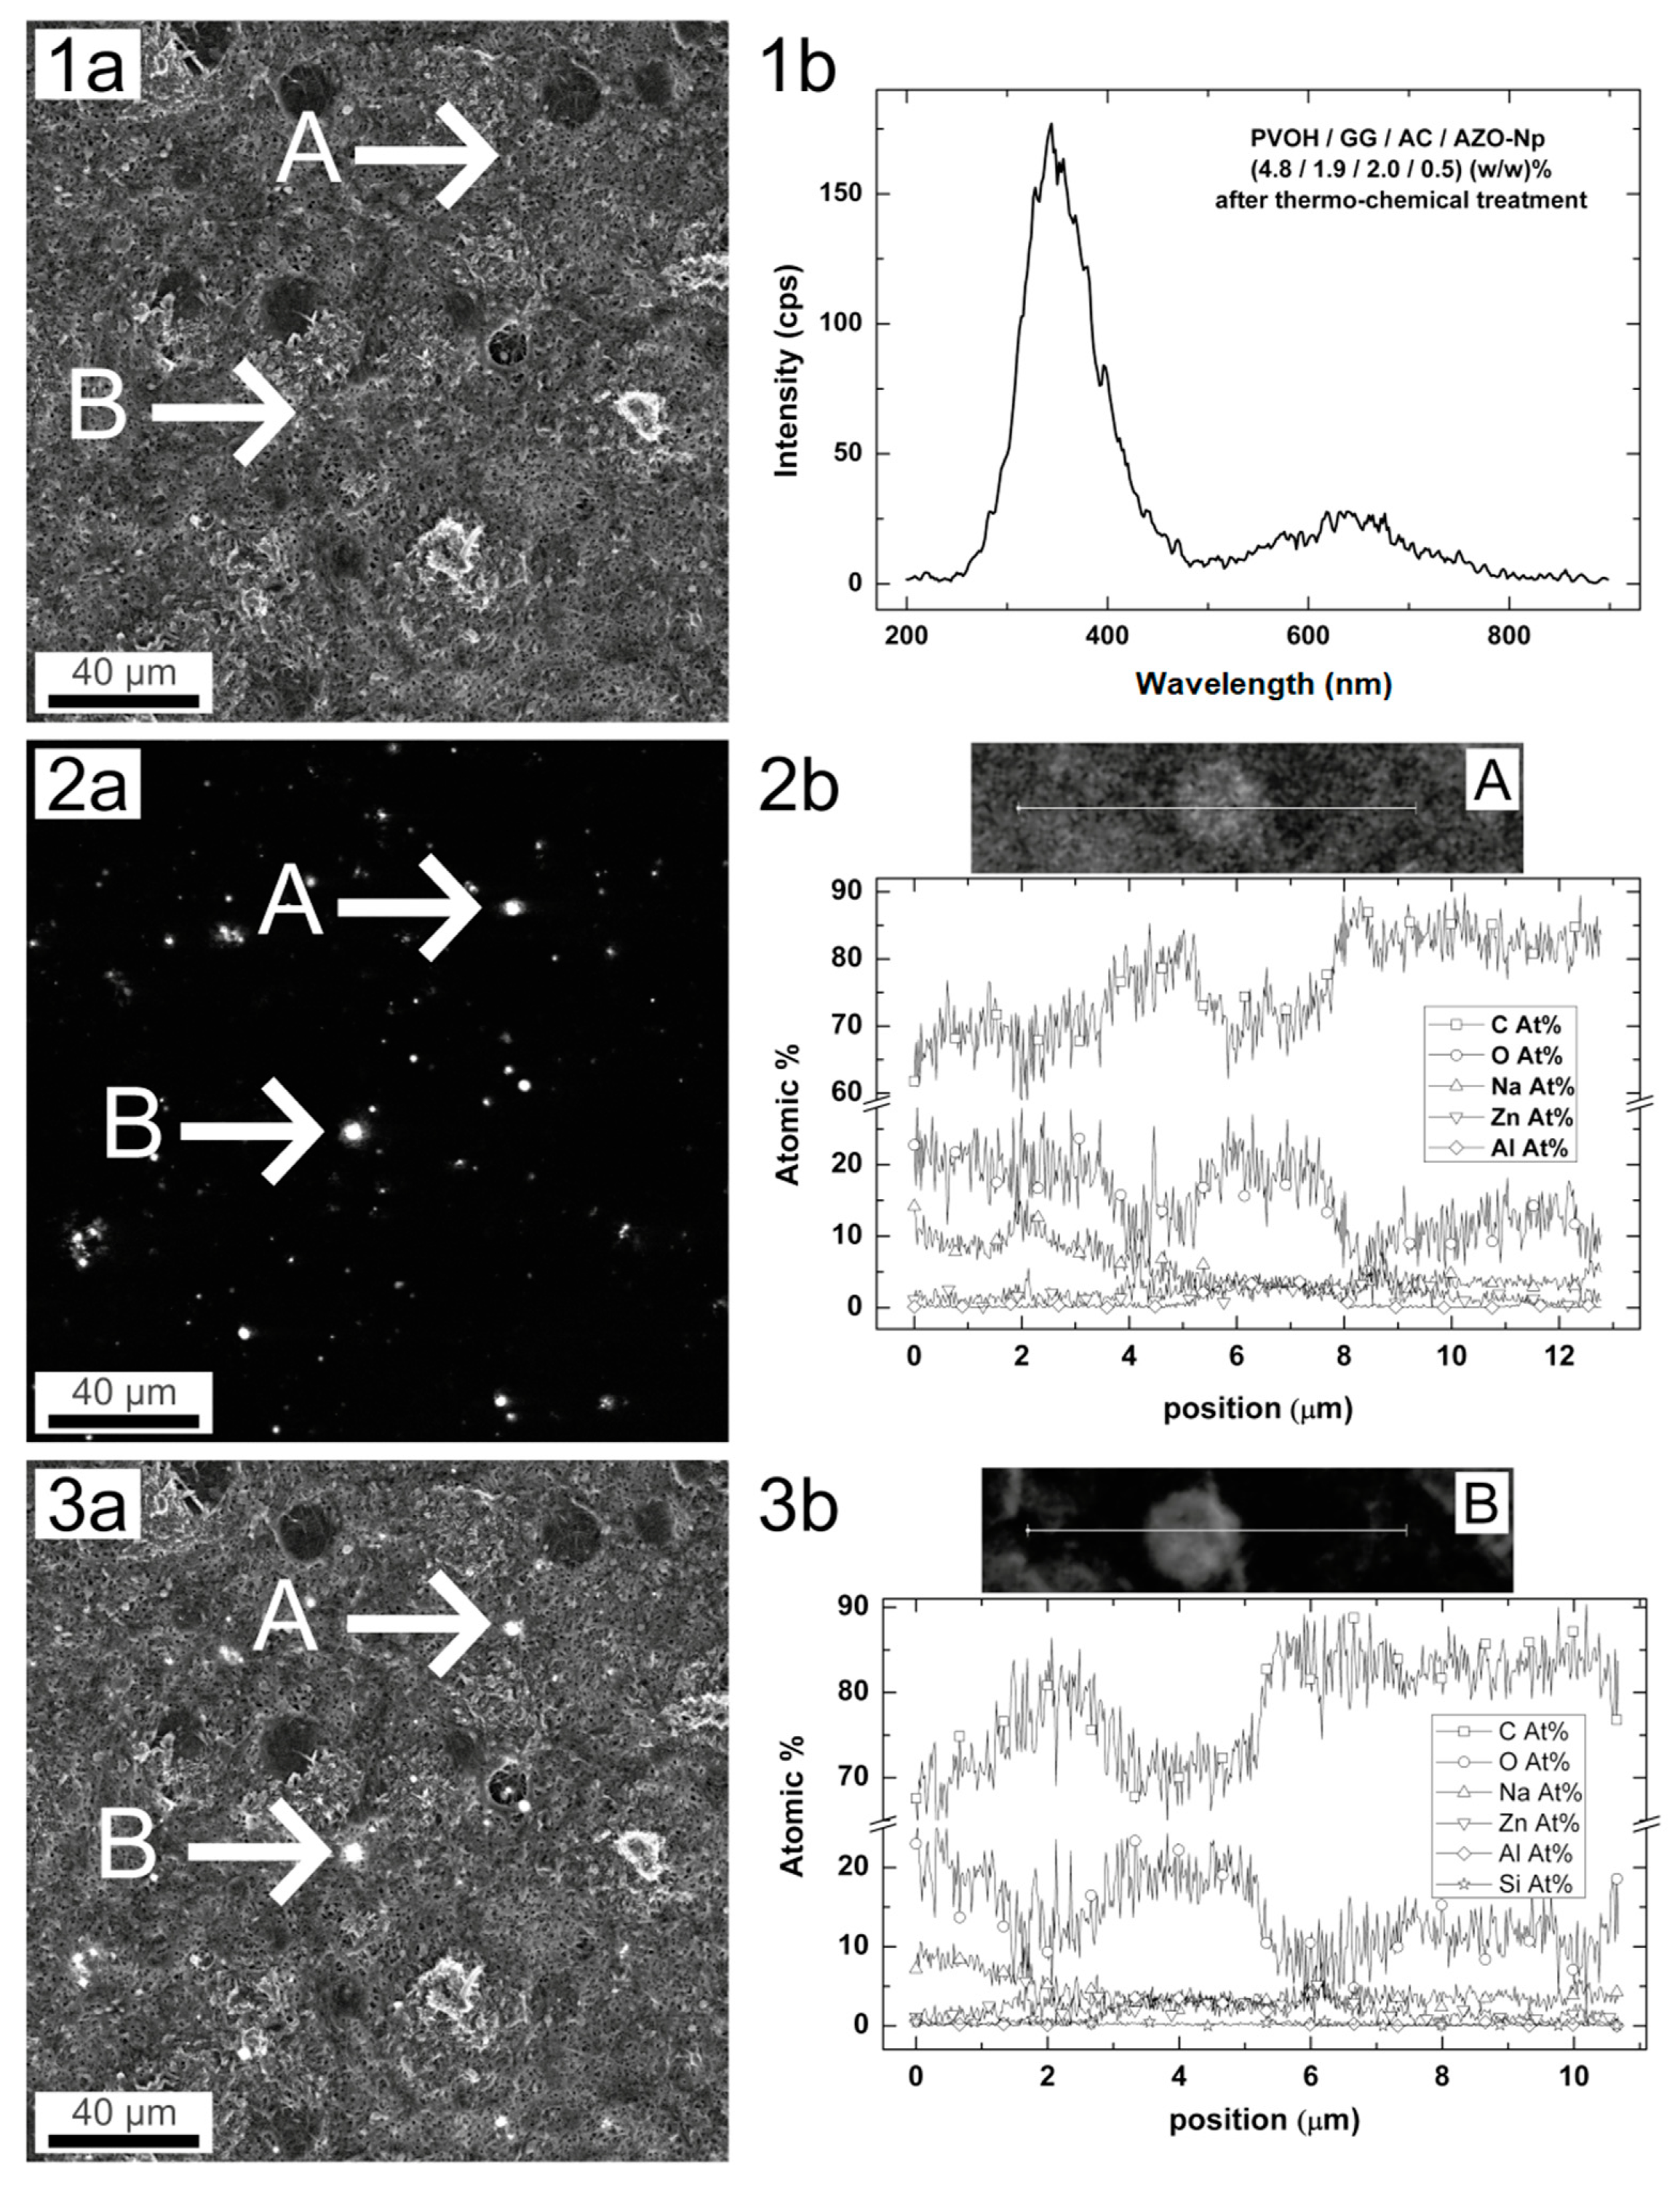
3.3. EDS Spectra
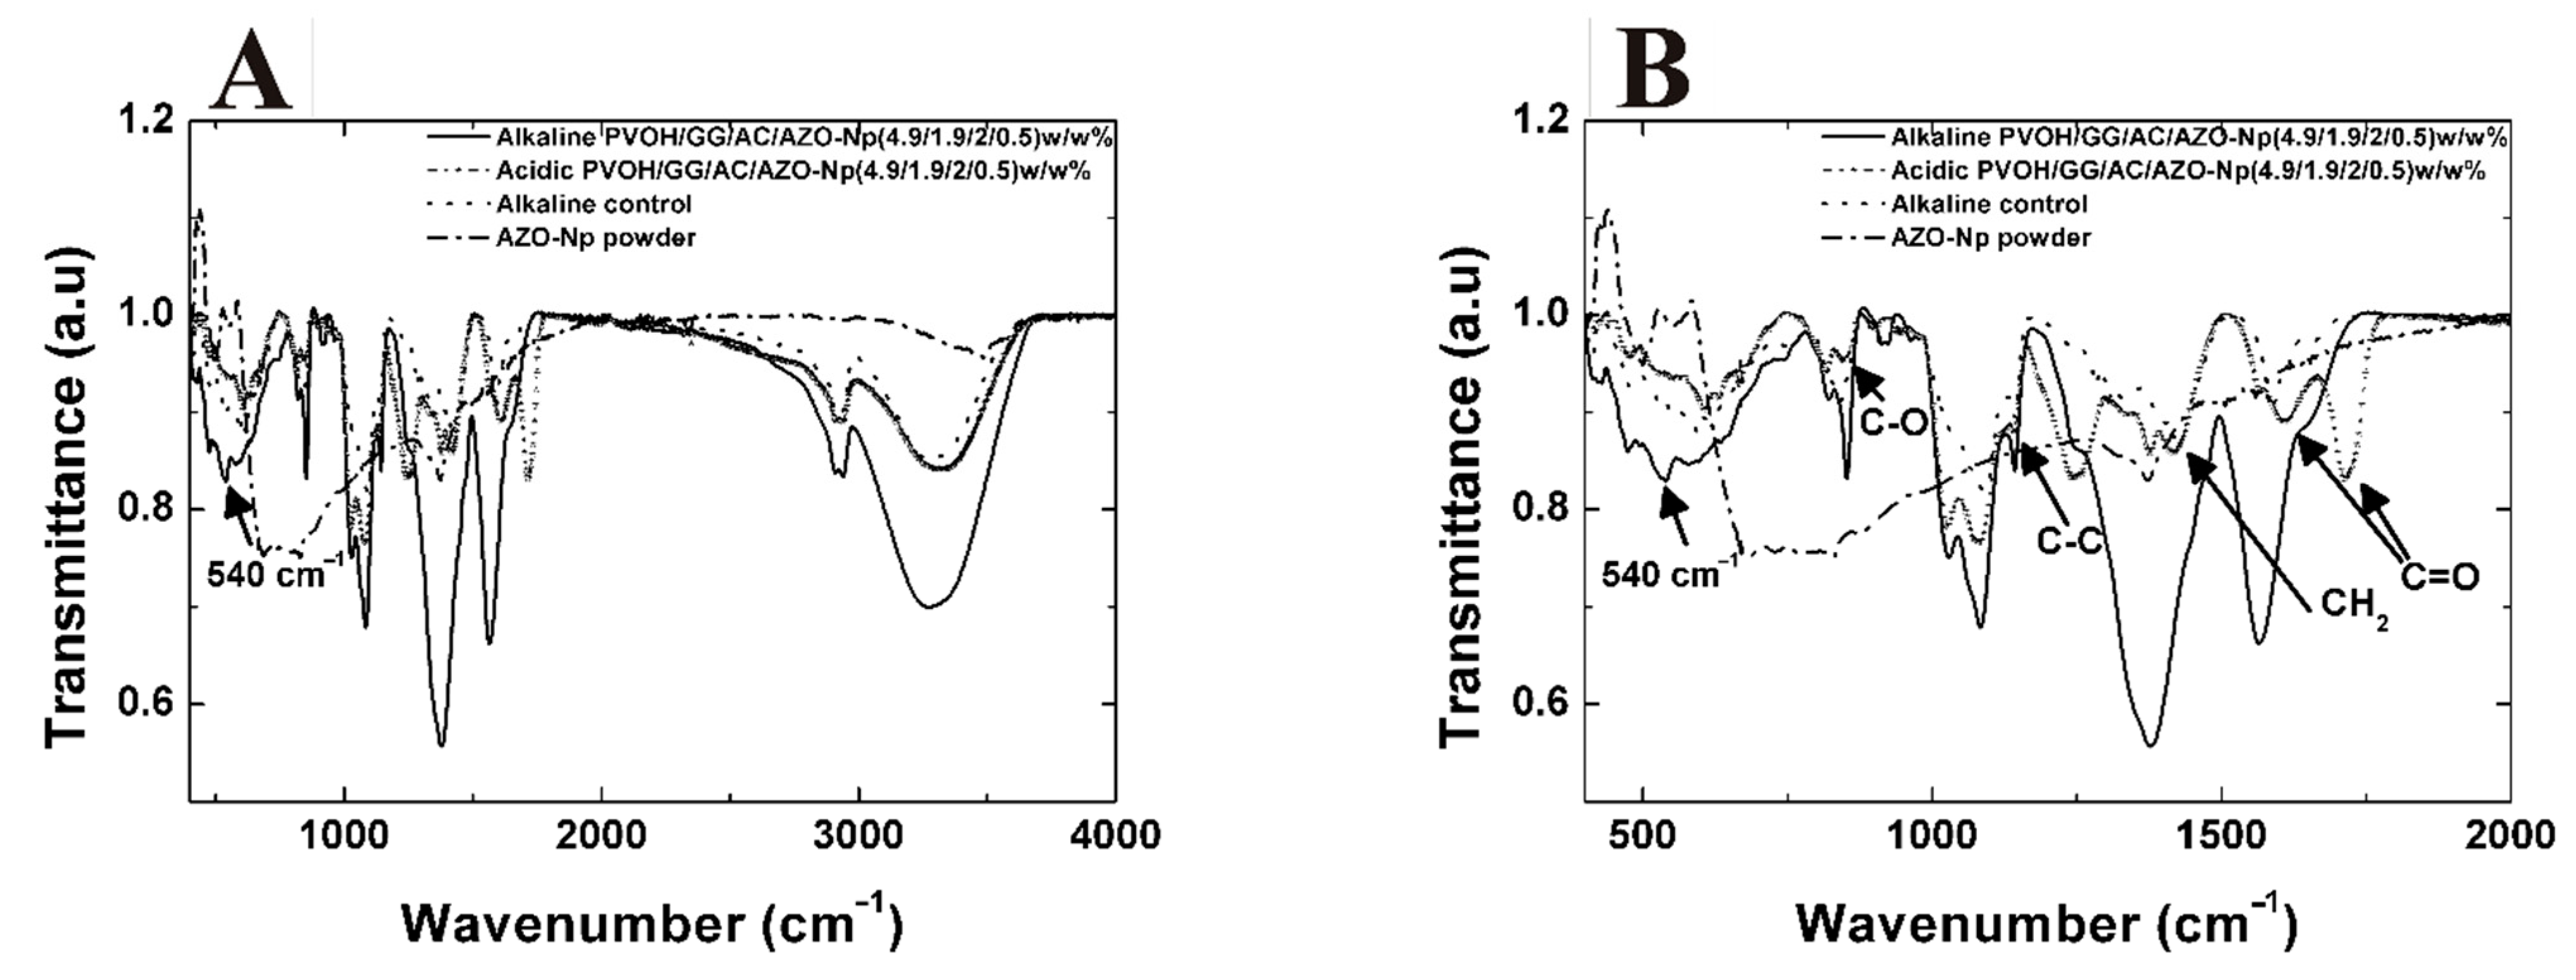
3.4. FTIR Spectra
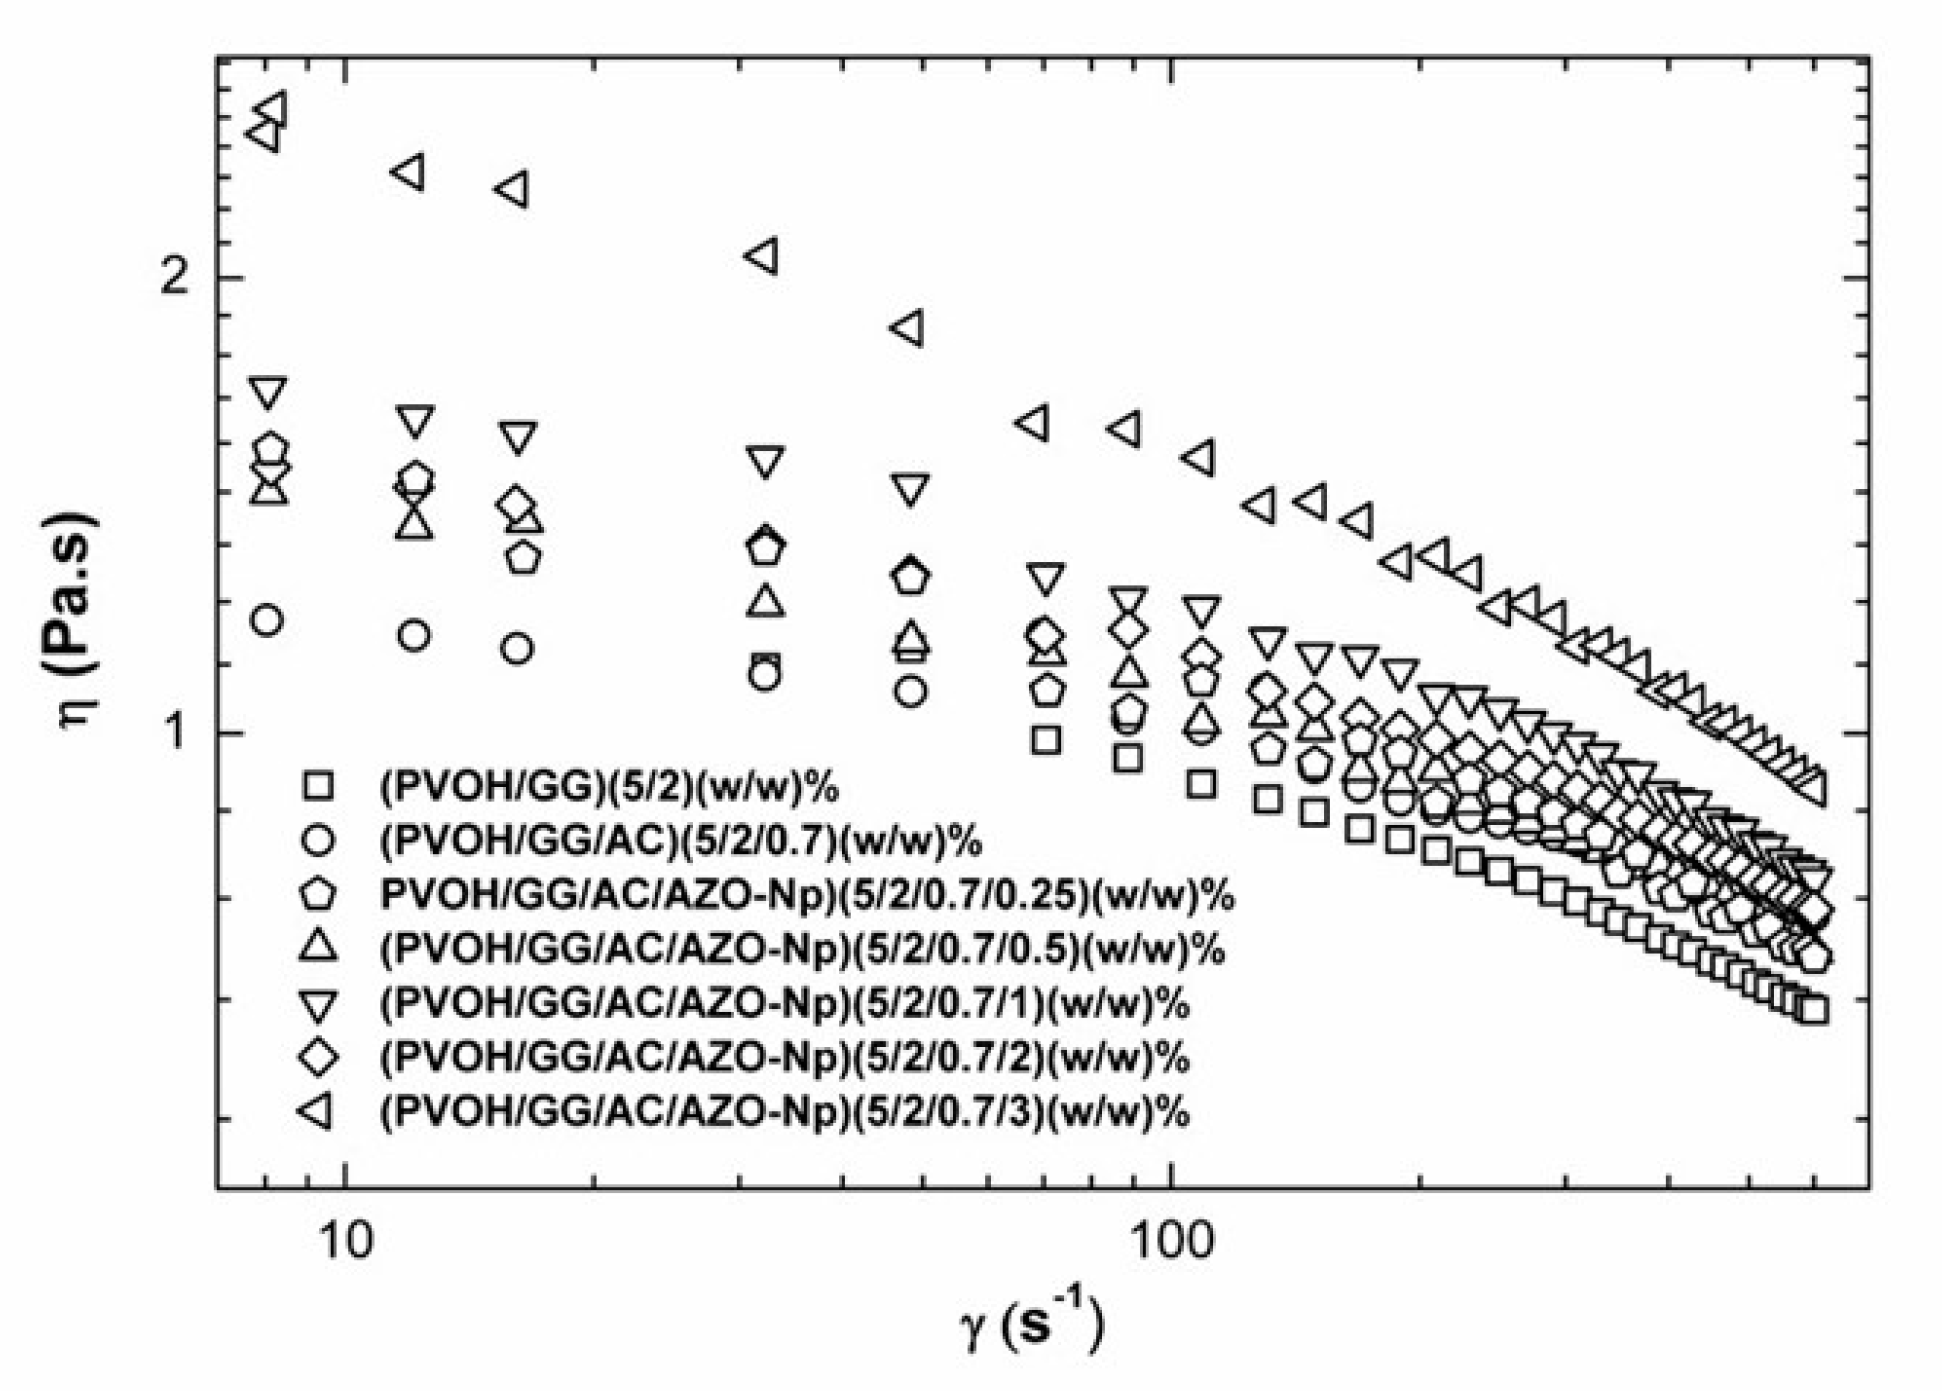
3.5. Rheology
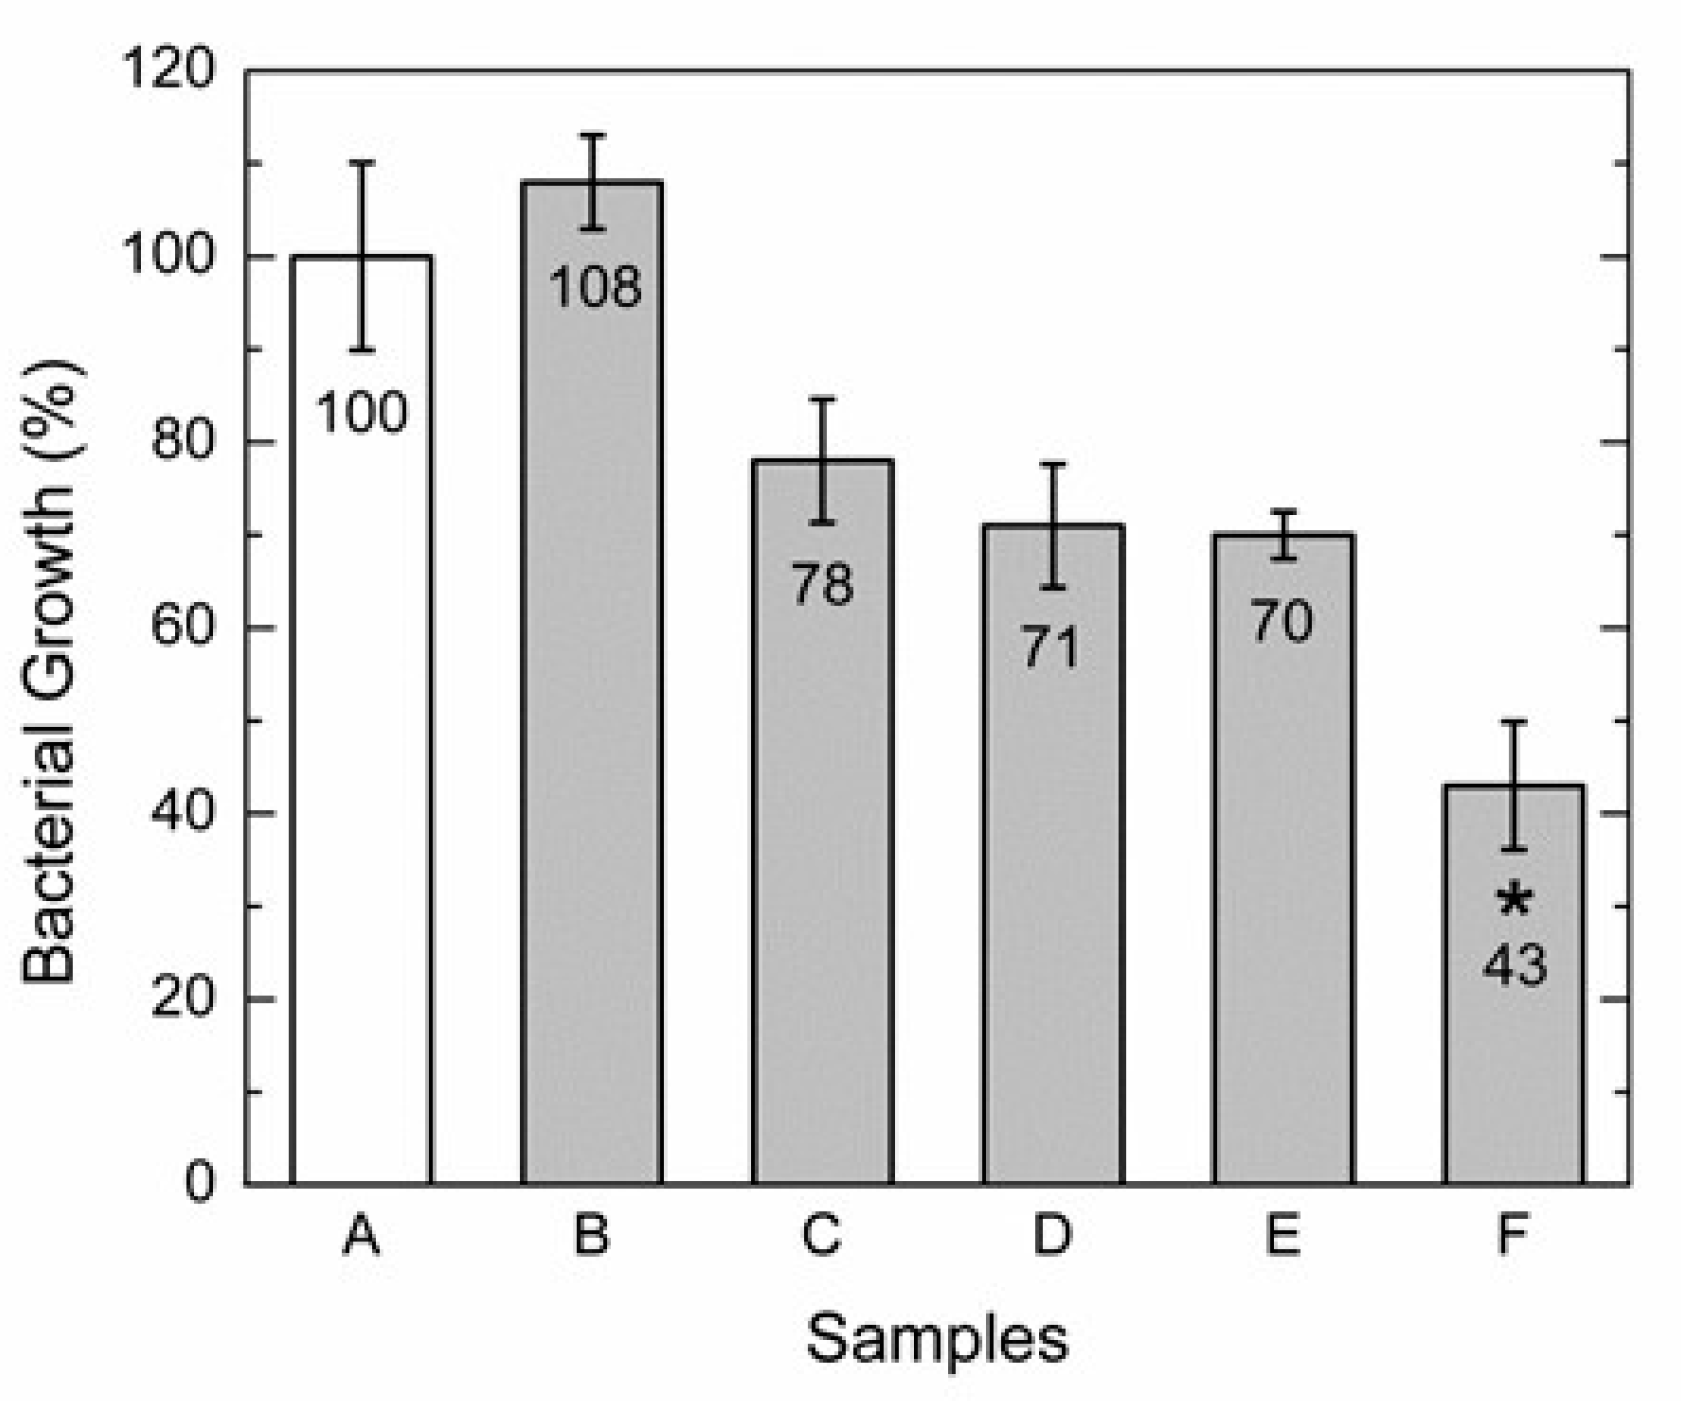
3.6. Antibacterial Assay
4. Conclusions
Supplementary Materials
Author Contributions
Funding
Acknowledgments
Conflicts of Interest
References
- Seil, J.T.; Webster, T.J. Antimicrobial applications of nanotechnology: Methods and literature. Int. J. Nanomed. 2012, 7, 2767–2781. [Google Scholar]
- Kamoun, E.A.; Kenawy, E.R.; Chen, X. A review on polymeric hydrogel membranes for wound dressing applications: PVA-based hydrogel dressings. Adv. Res. 2017, 8, 217–233. [Google Scholar] [CrossRef] [PubMed]
- Bramhill, J.; Ross, S.; Ross, G. Bioactive Nanocomposites for Tissue Repair and Regeneration: A Review. Int. J. Environ. Res. Public Health 2017, 14, 66. [Google Scholar] [CrossRef] [PubMed] [Green Version]
- Corkhill, P.H.; Hamilton, C.J.; Tighe, B.J. Synthetic hydrogels VI. Hydrogel composites as wound dressings and implant materials. Biomaterials 1989, 10, 3–10. [Google Scholar] [CrossRef]
- Kaith, B.S.; Sharma, R.; Kalia, S. Guar gum-based biodegradable, antibacterial and electrically conductive hydrogels. Int. J. Biol. Macromol. 2015, 75, 266–275. [Google Scholar] [CrossRef]
- Thombare, J.U.; Mishra, S.; Siddiqui, M.Z. Guar gum as a promising starting material for diverse applications: A review. Int. J. Biol. Macromol. 2016, 88, 361–372. [Google Scholar] [CrossRef]
- Bhardwaj, N.; Kundu, S.C. Electrospinning a fascinating fiber fabrication technique. Biotechnol. Adv. 2010, 28, 325–347. [Google Scholar] [CrossRef]
- Sramakrishna; Fujihara, K.; Teo, W.E.; Lim, T.C.; Ma, Z. Introduction to Electrospinning and Nanofibers; World Scientific Publishing Co.: Singapore, 2005. [Google Scholar]
- Garg, K.; Bowlin, G.L. Electrospinning jets and nanofibrous structures. Biomicrofluidics 2011, 5, 1–19. [Google Scholar] [CrossRef] [Green Version]
- Li, L.H.; Deng, J.C.; Deng, H.R.; Liu, Z.L.; Xin, L. Synthesis and characterization of chitosan/ZnO nanoparticle composite membranes. Carbohydr. Res. 2010, 345, 994–998. [Google Scholar] [CrossRef]
- Anitha, S.; Brabu, B.; Thiruvadigal, D.J.; Gopalakrishnan, C.; Natarajan, T.S. Optical, bactericidal and water repellent properties of electrospun nano-composite membranes of cellulose acetate and ZnO. Carbohydr. Polym. 2013, 97, 856–863. [Google Scholar] [CrossRef]
- Sawai, J.; Shoji, S.; Igarashi, H.; Hashimoto, A.; Kokugan, T.; Shimizu, M.; Kojima, H. Hydrogen peroxide as an antibacterial factor in zinc oxide powder slurry. Ferment. Bioeng. 1998, 86, 521–522. [Google Scholar] [CrossRef]
- Stoimenov, P.K.; Klinger, R.L.; Marchin, G.L.; Klabunde, K.J. Metal oxide nanoparticles as bactericidal agents. Langmuir 2002, 18, 6679–6686. [Google Scholar] [CrossRef]
- Zhang, L.; Jiang, Y.; Ding, Y.; Povey, M.; York, D. Investigation into antibacterial behavior of suspensions of ZnO nanoparticles (ZnO nanofluids). Nanoparticle Res. 2007, 9, 479–489. [Google Scholar] [CrossRef]
- Reddy, K.M.; Feris, K.; Bell, J.; Winget, D.G.; Hanley, C.; Punnoose, A. Selective toxicity of zinc oxide nanoparticles to prokaryotic and eukaryotic systems. Appl. Phys. Lett. 2007, 90, 1–3. [Google Scholar] [CrossRef] [PubMed] [Green Version]
- Wang, H.; Wick, R.L.; Xing, B. Toxicity of nanoparticulate and bulk ZnO, Al2O3 and TiO2 to the nematode Caenorhabditis elegans. Environ. Pollut. 2009, 157, 1171–1177. [Google Scholar] [CrossRef] [PubMed]
- Fang, T.; Watson, J.-L.; Goodman, J.; Dimkpa, C.O.; Martineau, N.; Das, S.; McLean, J.E.; Britt, D.W.; Anderson, A.J. Does doping with Aluminum alter the effects of ZnO nanoparticles on the metabolism of soil pseudomonads? Microbiol. Res. 2013, 168, 91–98. [Google Scholar] [CrossRef]
- Lee, D.Y.; Cho, J.E.; Cho, N.I.; Lee, M.H.; Lee, S.J.; Kim, B.Y. Characterization of electrospun aluminium-doped zinc oxide nanofibers. Thin Solid Film. 2008, 517, 1262–1267. [Google Scholar] [CrossRef]
- Lotus, A.F.; Kang, Y.C.; Walker, J.I.; Ramsier, R.D.; Chase, G.G. Effect of aluminium oxide doping on the structural, electrical, and optical properties of zinc oxide (AOZO) nanofibers synthesized by electrospinnig. Mater. Sci. Eng. B 2010, 15, 61–66. [Google Scholar] [CrossRef]
- Trandafilović, L.V.; Božanic, D.K.; Dimitrijević-Branković, S.; Luyt, A.S.; Djoković, V. Fabrication and antibacterial propertires of Zn-O alginates nanocomposites. Carbohydr. Polym. 2012, 88, 263–269. [Google Scholar] [CrossRef]
- Vicentin, D.S.; Smania, A., Jr.; Laranjeira, L.C.M. Chitosan/poly (vynyl alcohol) films containing ZnO nanoparticles and plasticizers. Mater. Sci. Eng. C 2010, 30, 503–508. [Google Scholar] [CrossRef]
- Kanmani, P.; Rhim, J.W. Properties and characterization of bionanocomposite films prepared with various biopolymers and ZnO nanoparticles. Carbohydr. Polym. 2014, 106, 190–199. [Google Scholar] [CrossRef] [PubMed]
- Hong, Y.; Li, D.; Zheng, J.; Zou, G. In situ Growth of ZnO nanocrystals from solid Electrospun Nanofibers Matrixes. Langmuir 2006, 22, 7331–7334. [Google Scholar] [CrossRef]
- Jang, D.S.; Jung, S.J.; Lee, J.J. Al doped zinc oxide thin films on polymer substrates deposited by inductively coupled plasma assisted reactive sputtering. Curr. Appl. Phys. 2012, 12, S118–S122. [Google Scholar] [CrossRef]
- Dea, I.C.M.; Morrison, A. Chemistry and interactions of seed galactomannans. Carbohydr. Chem. Biochem. 1975, 31, 241–312. [Google Scholar]
- Shahid, M.; Bukhari, S.A.; Gul, Y.; Munir, H.; Anjum, F.; Zuber, M.; Jamil, T.; Zia, K.M. Graft polymerization of guar gum with acryl amide irradiated by microwaves for colonic drug delivery. Int. J. Biol. Macromol. 2013, 62, 172–179. [Google Scholar] [CrossRef] [PubMed]
- Robinson, G.; Ross-Murphy, S.B.; Morris, E.R. Viscosity-molecular weight relationships, intrinsic chain flexibility, and dynamic solution properties of guar galactomannan. Carbohydr. Res. 1982, 107, 17–32. [Google Scholar] [CrossRef]
- Risica, D.; Dentini, M.; Crescenzi, V. Guar gum methyl ethers. Part I. Synthesis and macromolecular characterization. Polymer 2005, 46, 12247–12255. [Google Scholar] [CrossRef]
- KöK, M.S. Rheological study of galactomannan depolymerisation at elevated temperatures: Effect of varying pH and addition of antioxidants. Carbohydr. Polym. 2010, 81, 567–571. [Google Scholar] [CrossRef]
- Mudgil, D.; Barak, S.; Khatkar, B.S. X-ray diffraction, IR spectroscopy and thermal characterization of partially hydrolyzed guar gum. J. Biol. Macromol. 2012, 50, 1035–1039. [Google Scholar] [CrossRef]
- Venugopal, K.N.; Abhilash, M. Study of hydration kinetics and rheological behavior of guar gum. Int. J. Pharma Sci. Res. 2010, 1, 28–39. [Google Scholar]
- McLean, D.; Agarwal, V.; Stack, K.; Horne, J.; Richardson, D. Synthesis of guar gum-graft-poly(acrylamide-co-diallyldimethylammonium chloride) and its application in the pulp and paper industry. BioResources 2011, 6, 4168–4180. [Google Scholar]
- Lubambo, A.F.; Ono, L.; Drago, V.; Mattoso, N.; Varalda, J.; Sierakowski, M.R.; Sakakibara, C.N.; Freitas, R.A.; Saul, C.K. Tuning Fe3O4 nanoparticle dispersion through pH in PVA/guar gum/electrospun membranes. Carbohydr. Polym. 2015, 134, 775–783. [Google Scholar] [CrossRef]
- Thomas, L.V.; Arun, U.; Remya, S.; Nair, P.D. A biodegradable and biocompatible PVA-Citric Acid polyester with potential applications as matrix for vascular tissue engineering. Mater. Sci. Mater. Med. 2009, 20, 259–269. [Google Scholar] [CrossRef]
- Sill, T.J.; Recum, H.A.V. Electrospinning: Applications in drug delivery and tissue engineering. Biomaterials 2008, 29, 1989–2006. [Google Scholar] [CrossRef]
- Reddy, T.T.; Tammishetti, S. Free radical degradation of Guar Gum. Polym. Degrad. Stab. 2004, 86, 455–459. [Google Scholar] [CrossRef]
- Shi, R.; Zhang, Z.; Liu, Q.; Han, Y.; Zhang, L.; Chen, D.; Tian, W. Characterization of citric acid/glycerol co-plasticized thermoplastic starch prepared by melt blending. Carbohydr. Polym. 2007, 69, 748–755. [Google Scholar] [CrossRef]
- Reichle, R.A.; McCurdy, K.G.; Hepler, L.G. Zinc Hydroxide Solubility Product and Hydroxy-complex Stability Constants from 12.5–75 °C. Can. J. Chem. 1975, 53, 3841–3845. [Google Scholar] [CrossRef]
- Degen, A.; Kosec, M. Effect of pH and impurities on the surface charge of zinc oxide in aqueous solution. Eur. Ceram. Soc. 2000, 20, 667–673. [Google Scholar] [CrossRef]
- Demir, F.; Laçin, O.; Dönmez, B. Leaching Kinetics of Calcined Magnesite in citric acid solutions. Ind. Eng. Chem. Res. 2006, 45, 1307–1311. [Google Scholar] [CrossRef]
- Larba, R.; Boukerche, I.; Alane, N.; Habbache, N.; Djerad, S.; Tifouti, L. Citric acid as an Alternative Lixiviant for Zinc Oxide Dissolution. Hydrometallurgy 2013, 134–135, 117–123. [Google Scholar] [CrossRef]
- Bradley, T.D.; Ball, A.; Harding, S.E.; Mitchell, J.R. Thermal degradation of guar gum. Carbohydr. Polym. 1989, 10, 205–214. [Google Scholar] [CrossRef]
- Yang, H.; Xu, S.; Jiang, L.; Dan, Y. Thermal Decomposition Behavior of Poly (Vinyl Alcohol) with Different Hydroxyl Content. Macromol. Sci. Part B Phys. 2012, 51, 464–480. [Google Scholar] [CrossRef]
- Lubambo, A.F.; Freitas, R.A.; Sierakowski, M.R.; Lucyszyn, N.; Sassaki, G.L.; Serafim, B.M.; Saul, C.K. Electrospinning of commercial guar-gum: Effects of purification and filtration. Carbohydr. Polym. 2013, 93, 484–491. [Google Scholar] [CrossRef]
- Nagy, D.J. A Mark-Houwink Equation for Polyvinyl Alcohol) from Sec-Viscometry. J. Liq. Chromatogr. 1993, 16, 3041–3058. [Google Scholar] [CrossRef]
- Franco, R.A.; Min, Y.-K.; Yang, H.-M.; Lee, B.-T. On stabilization of PVPA/PVA electrospun nanofiber membrane and its effect on material properties and biocompatibility. J. Nanomater. 2012, 2012, 1–9. [Google Scholar] [CrossRef] [Green Version]
- Zhang, J.; Sun, L.; Yin, J.; Liao, C.; Yan, C. Control of ZnO Morphology via a Simple Solution Route. Chem. Mater. 2002, 14, 4172–4177. [Google Scholar] [CrossRef]
- Maturin, L.; Peeler, J.T. Aerobic Plate Count. In Bacteriological Analytical Manual, 8th ed.; FDA: Silver Spring, MD, USA, 2001. [Google Scholar]
- Gupta, A.P.; Arora, G. Preparation and Characterization of cross-linked Guar Gum Poly(vinyl alcohol) green films. Der Chem. Sin. 2012, 3, 1191–1197. [Google Scholar]
- El-Fawal, G. Preparation, characterization and antibacterial activity of biodegradable films prepared from carrageenan. Food Sci. Technol. 2014, 51, 2234–2239. [Google Scholar] [CrossRef] [Green Version]
- Buonsanti, R.; Llordes, A.; Aloni, S.; Helms, B.A.; Milliron, D.J. Tunable infrared absorption and visible transparency of colloidal Aluminum-doped zinc oxide nanocrystals. Nanoletters 2011, 11, 4706–4710. [Google Scholar] [CrossRef]
- Liu, Y.; Zhang, H.; An, X.; Gao, C.; Zhang, Z.; Zhou, J.; Xie, E. Effect of Al doping on the visible photoluminescence of ZnO nanofibers. J. Alloys Compd. 2010, 506, 772–776. [Google Scholar] [CrossRef]
- Dey, K.K.; Kumar, P.; Yadav, R.R.; Dhar, A.; Srivastava, A.K. CuO nanoellipsoids for superior physicochemical response of biodegradable PVA. Soc. Adv. 2012, 4, 10123–10132. [Google Scholar] [CrossRef]
- Dhak, D.; Pramanik, P. Particle size comparison of soft-chemically prepared transition metal (Co, Ni, Cu, Zn) aluminate spinels. Am. Ceram. Soc. 2006, 89, 1014–1021. [Google Scholar] [CrossRef]
- Boccuzzi, F.; Morterra, C.; Scala, R.; Zecchina, A. Infrared Spectrum of Microcrystalline Zinc Oxide. J. Chem. Soc. Faraday Trans. 1981, 77, 2059–2066. [Google Scholar] [CrossRef]
- Karunakaramoorthy, K.; Suresh, G. Synthesis and characterization of the Al-doped and Al-Mn Co- doped ZnO nanoparticles by sol gel method. Indian J. Appl. Res. 2014, 4, 469–471. [Google Scholar] [CrossRef]
- Vajravelu, K.; Sreenadh, S.; Devaki, P.; Prasad, K.V. Peristaltic Transport of a Herschel–Bulkley Fluid in an Elastic Tube. Heat Transf. Asian Res. 2014, 3, 585–598. [Google Scholar] [CrossRef]


Publisher’s Note: MDPI stays neutral with regard to jurisdictional claims in published maps and institutional affiliations. |
© 2022 by the authors. Licensee MDPI, Basel, Switzerland. This article is an open access article distributed under the terms and conditions of the Creative Commons Attribution (CC BY) license (https://creativecommons.org/licenses/by/4.0/).
Share and Cite
Lubambo, A.F.; Mattoso, N.; Ono, L.; da Luz, G.G.; Gavinho, B.; Martin, A.A.; Sierakowski, M.R.; Saul, C.K. In Situ Synthesis of AZO-Np in Guar Gum/PVOH Composite Fiber Mats for Potential Bactericidal Release. Polymers 2022, 14, 4983. https://doi.org/10.3390/polym14224983
Lubambo AF, Mattoso N, Ono L, da Luz GG, Gavinho B, Martin AA, Sierakowski MR, Saul CK. In Situ Synthesis of AZO-Np in Guar Gum/PVOH Composite Fiber Mats for Potential Bactericidal Release. Polymers. 2022; 14(22):4983. https://doi.org/10.3390/polym14224983
Chicago/Turabian StyleLubambo, Adriana Freire, Ney Mattoso, Lucy Ono, Gisele Gomes da Luz, Bruno Gavinho, Andressa Amado Martin, Maria Rita Sierakowski, and Cyro Ketzer Saul. 2022. "In Situ Synthesis of AZO-Np in Guar Gum/PVOH Composite Fiber Mats for Potential Bactericidal Release" Polymers 14, no. 22: 4983. https://doi.org/10.3390/polym14224983