
Quantitative Assessment of Tensile Strength and Degradation Coefficient of m-Aramid/p-Aramid Blended Yarns Used for Outer Layers of Firefighter Clothing under Ultraviolet Light and Correlation with Fabrics Data
 ,
,
Abstract
:1. Introduction
2. Experiment
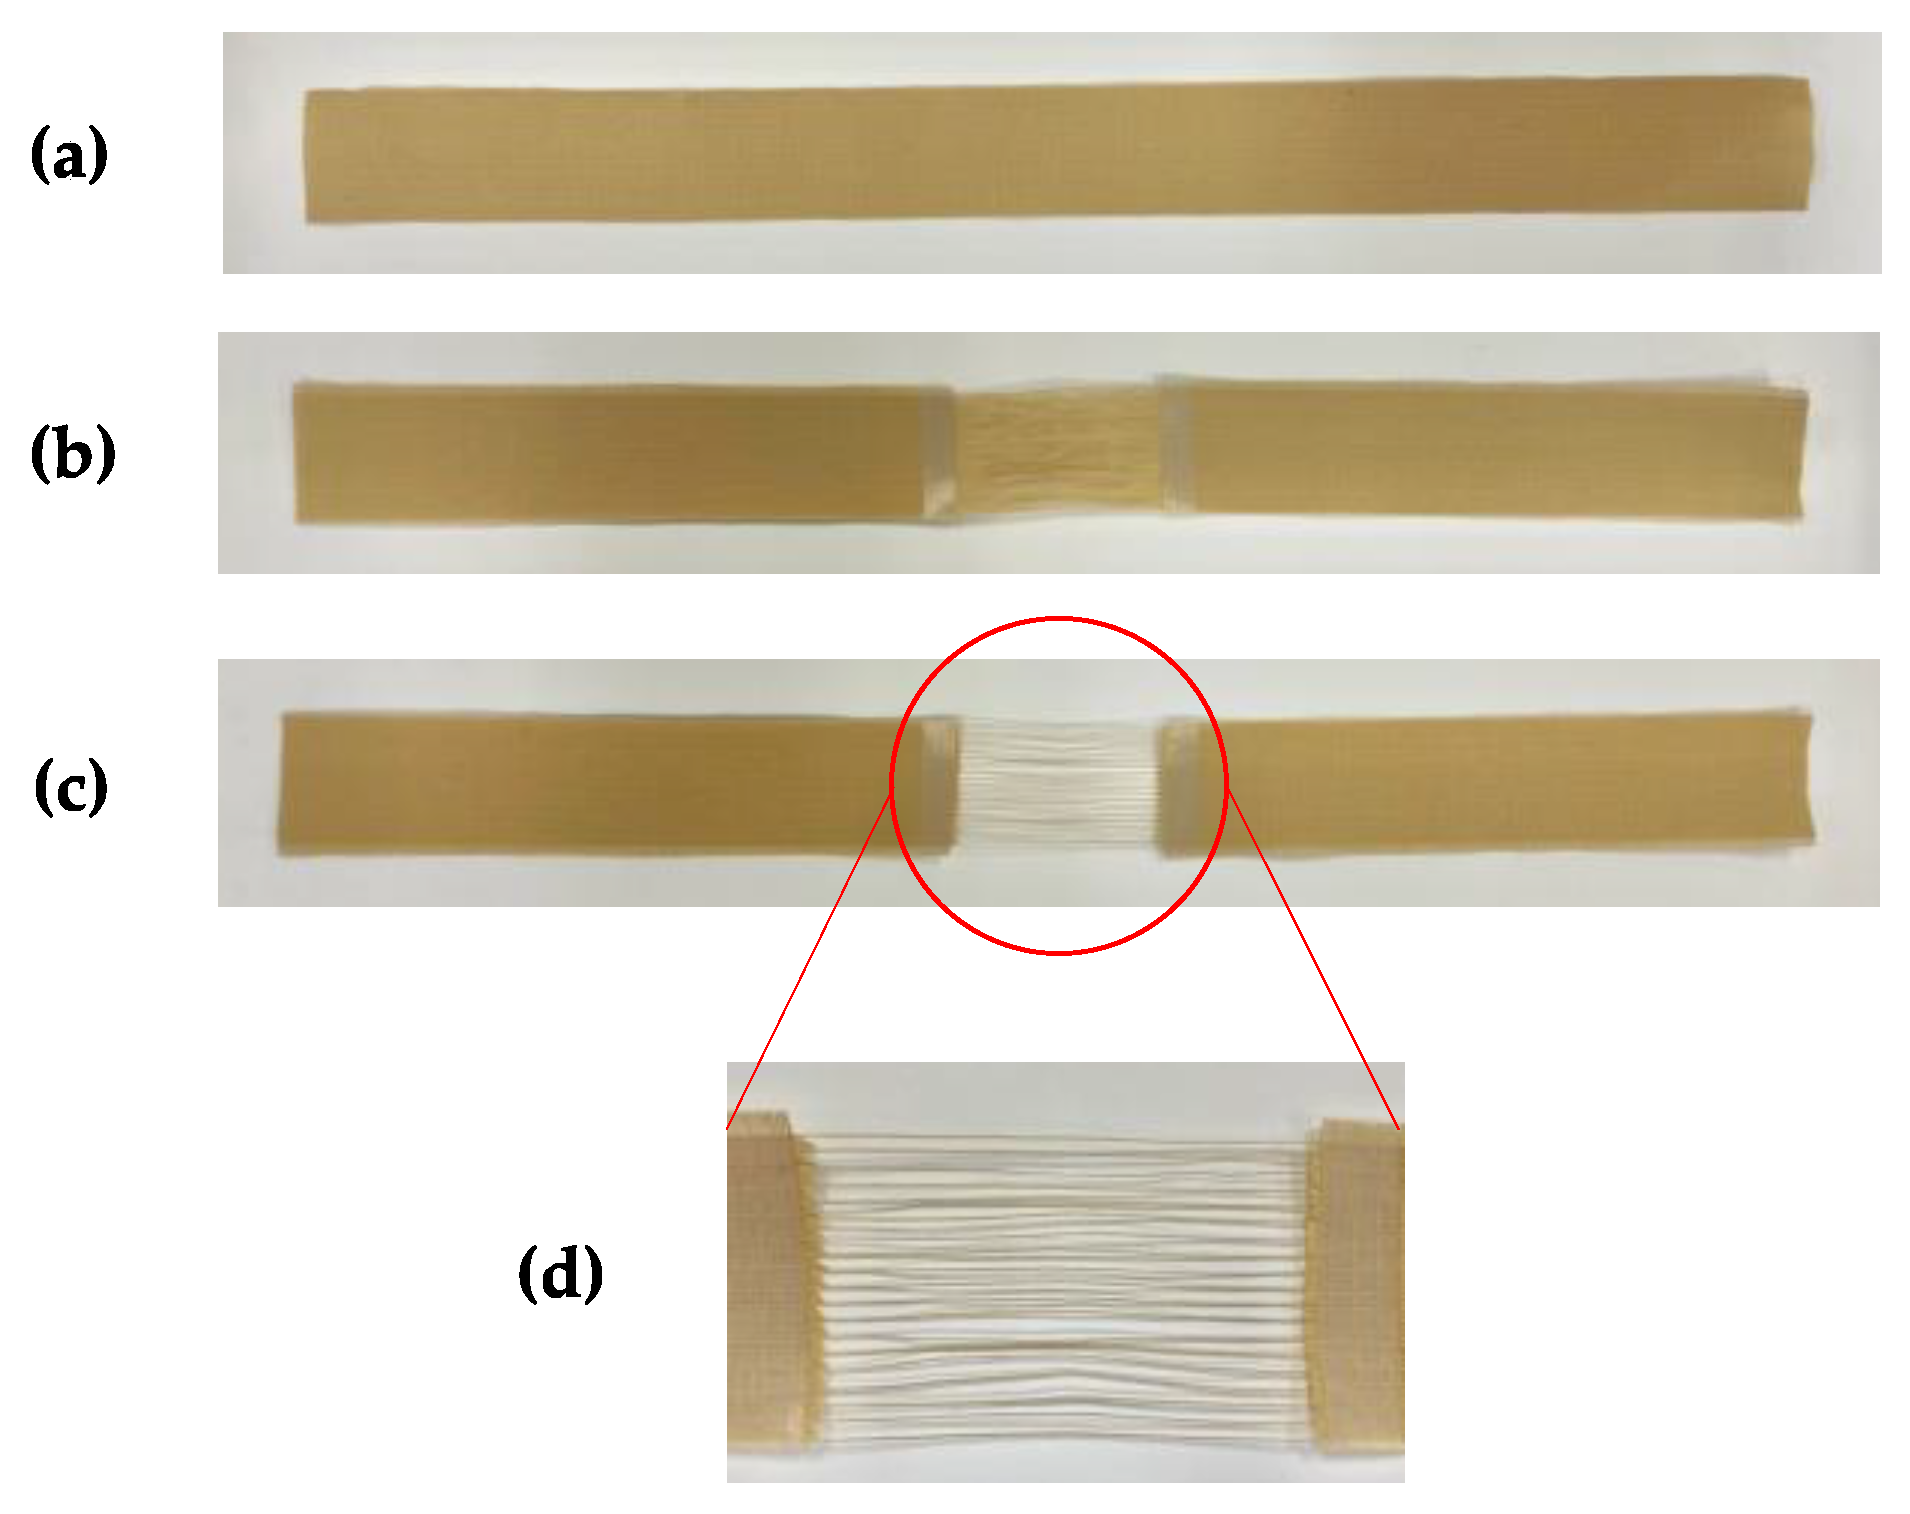
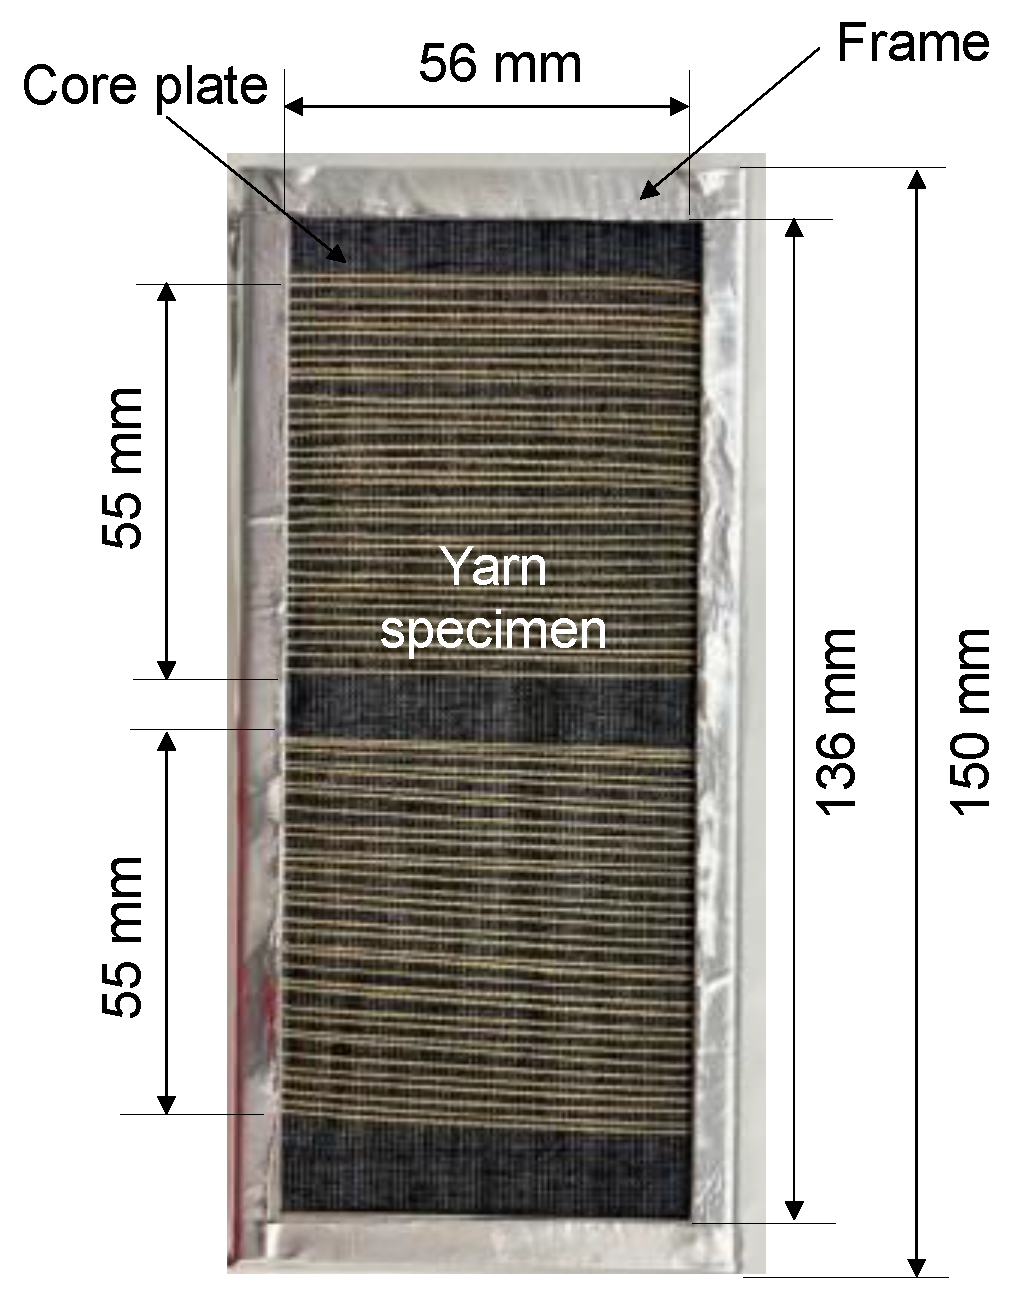
2.1. Specimen Preparation
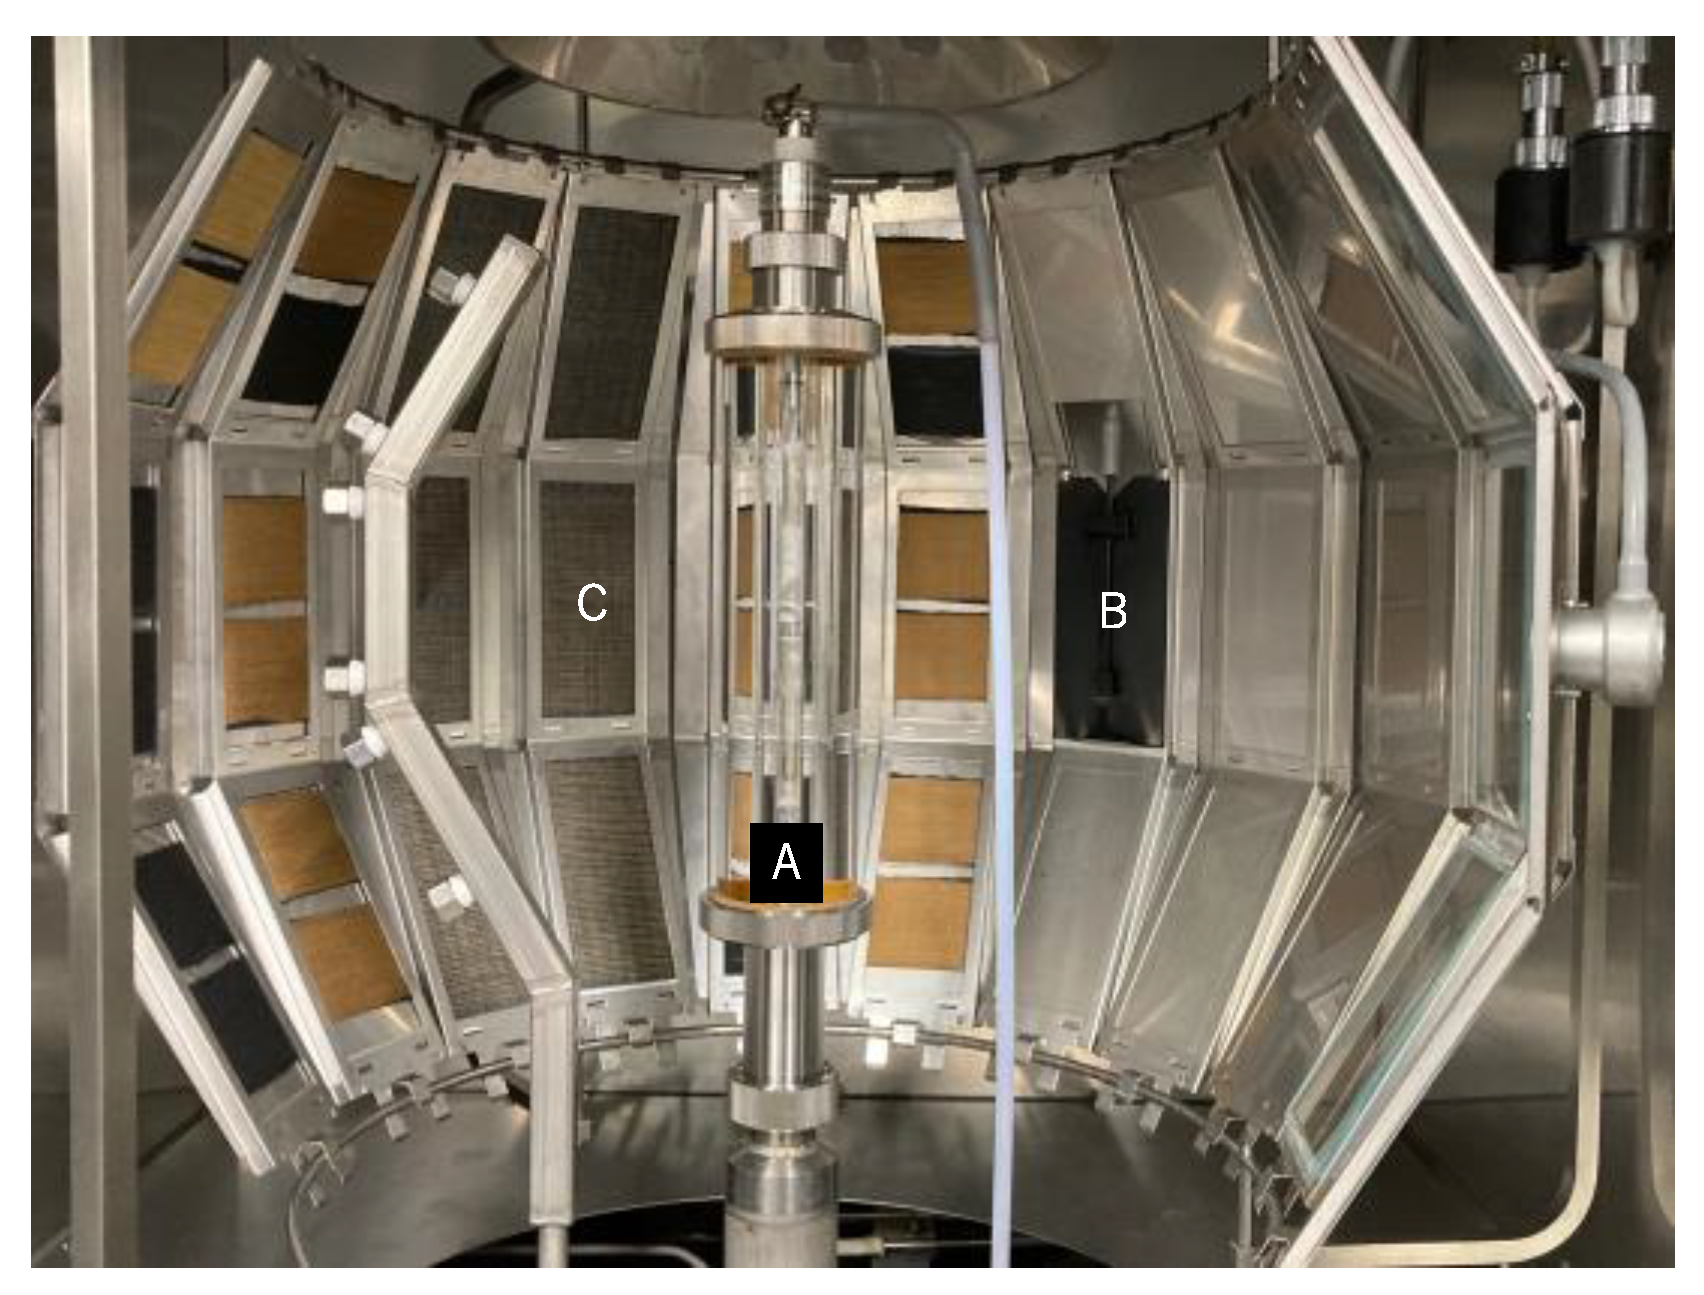
2.2. UV Exposure Methods and Conditions
2.3. Tensile Strength Test
3. Results
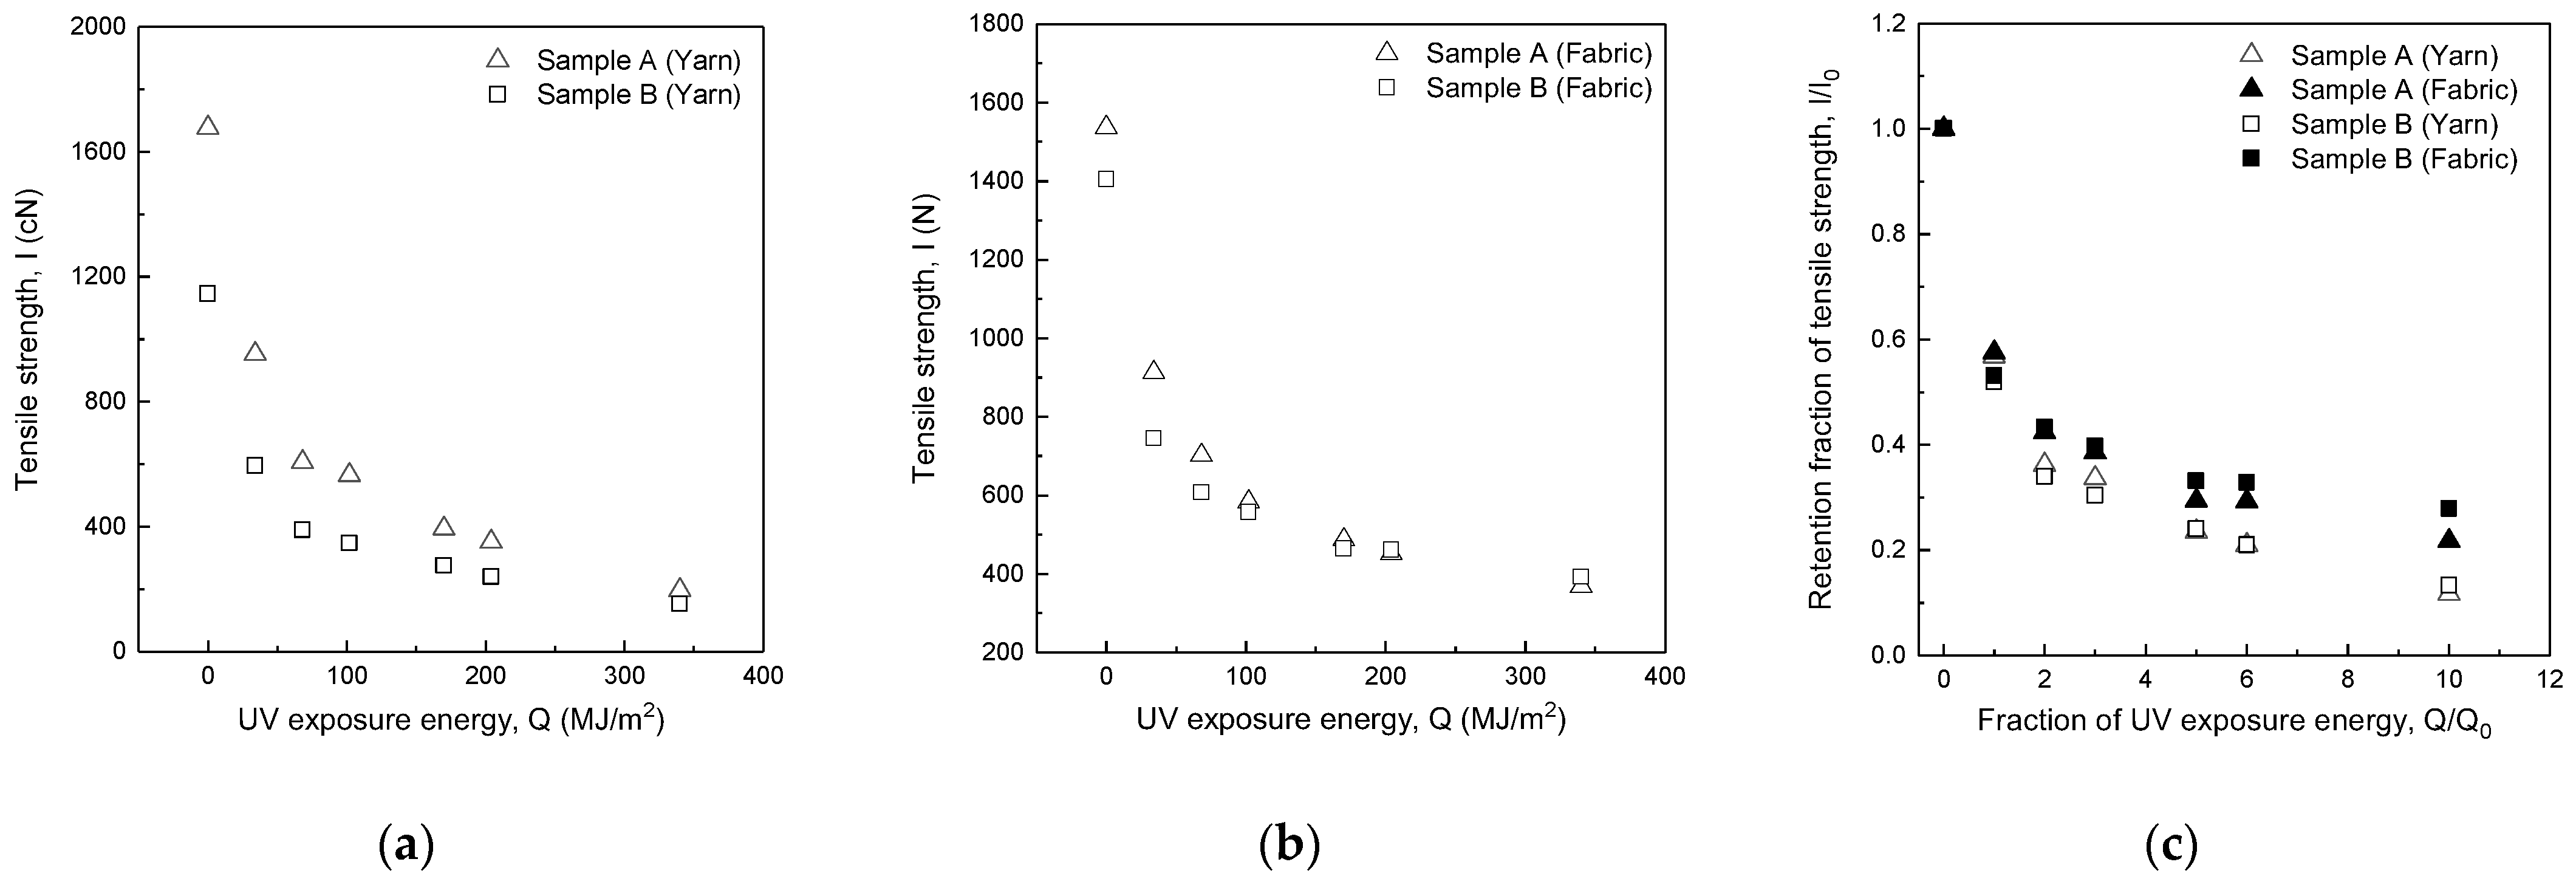
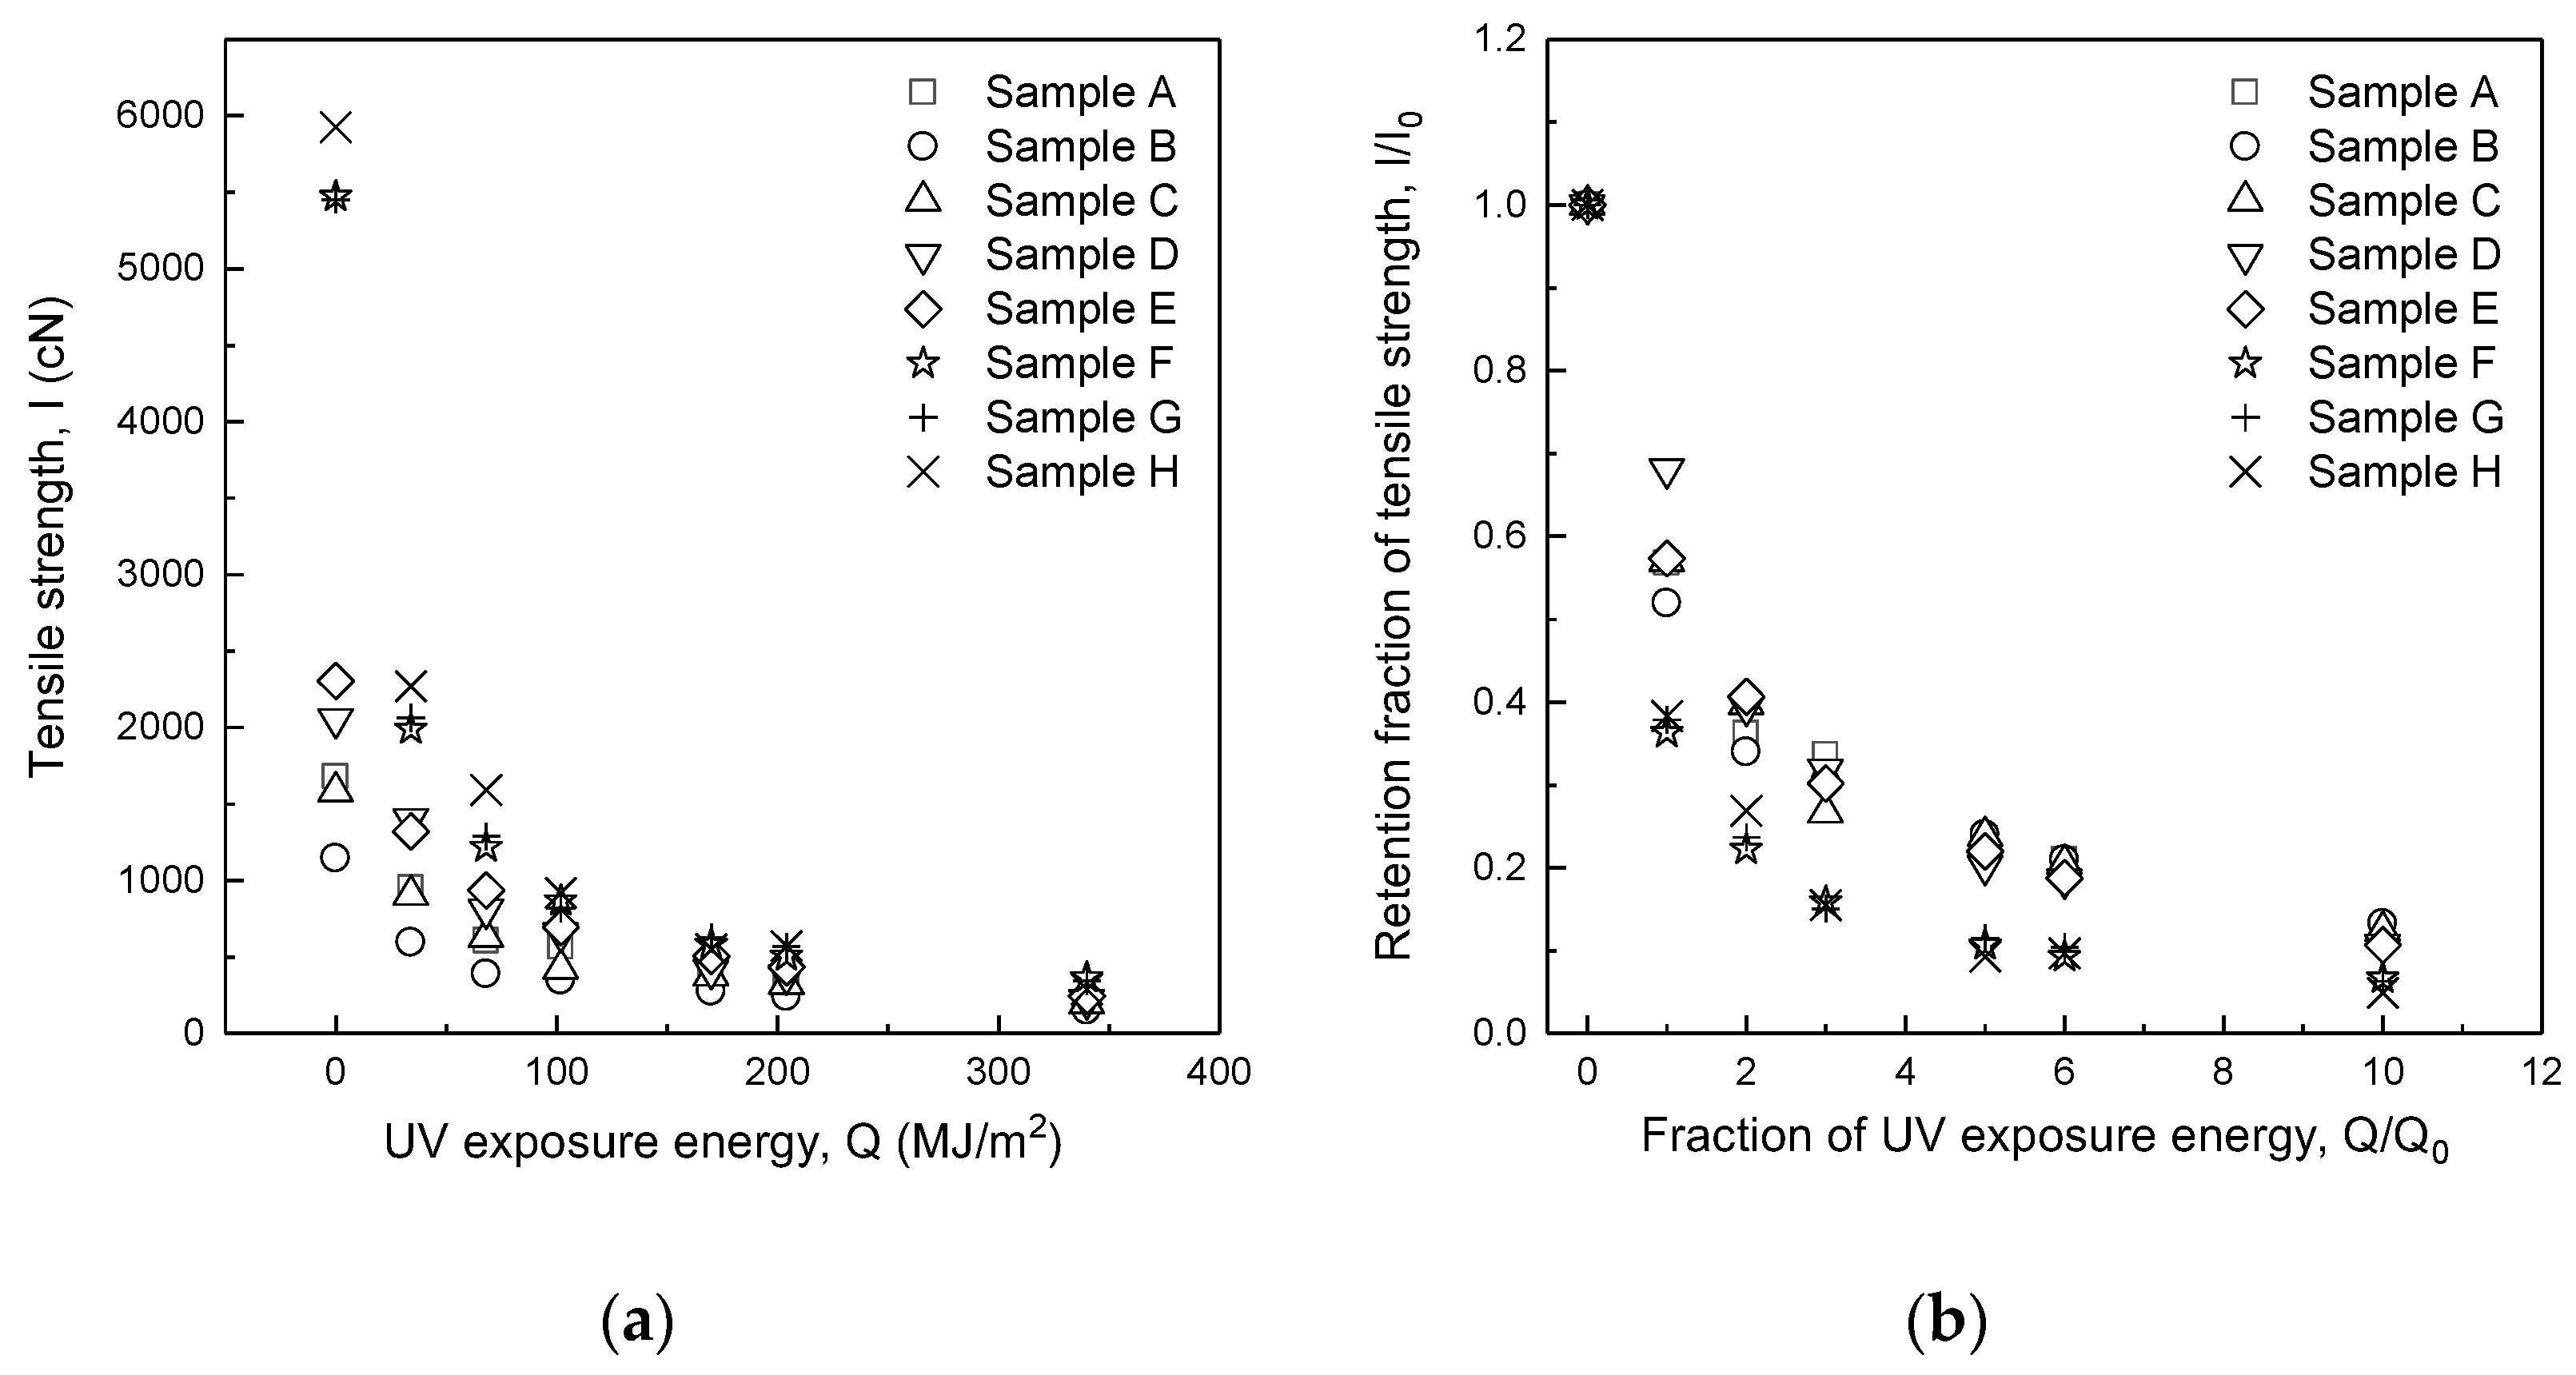
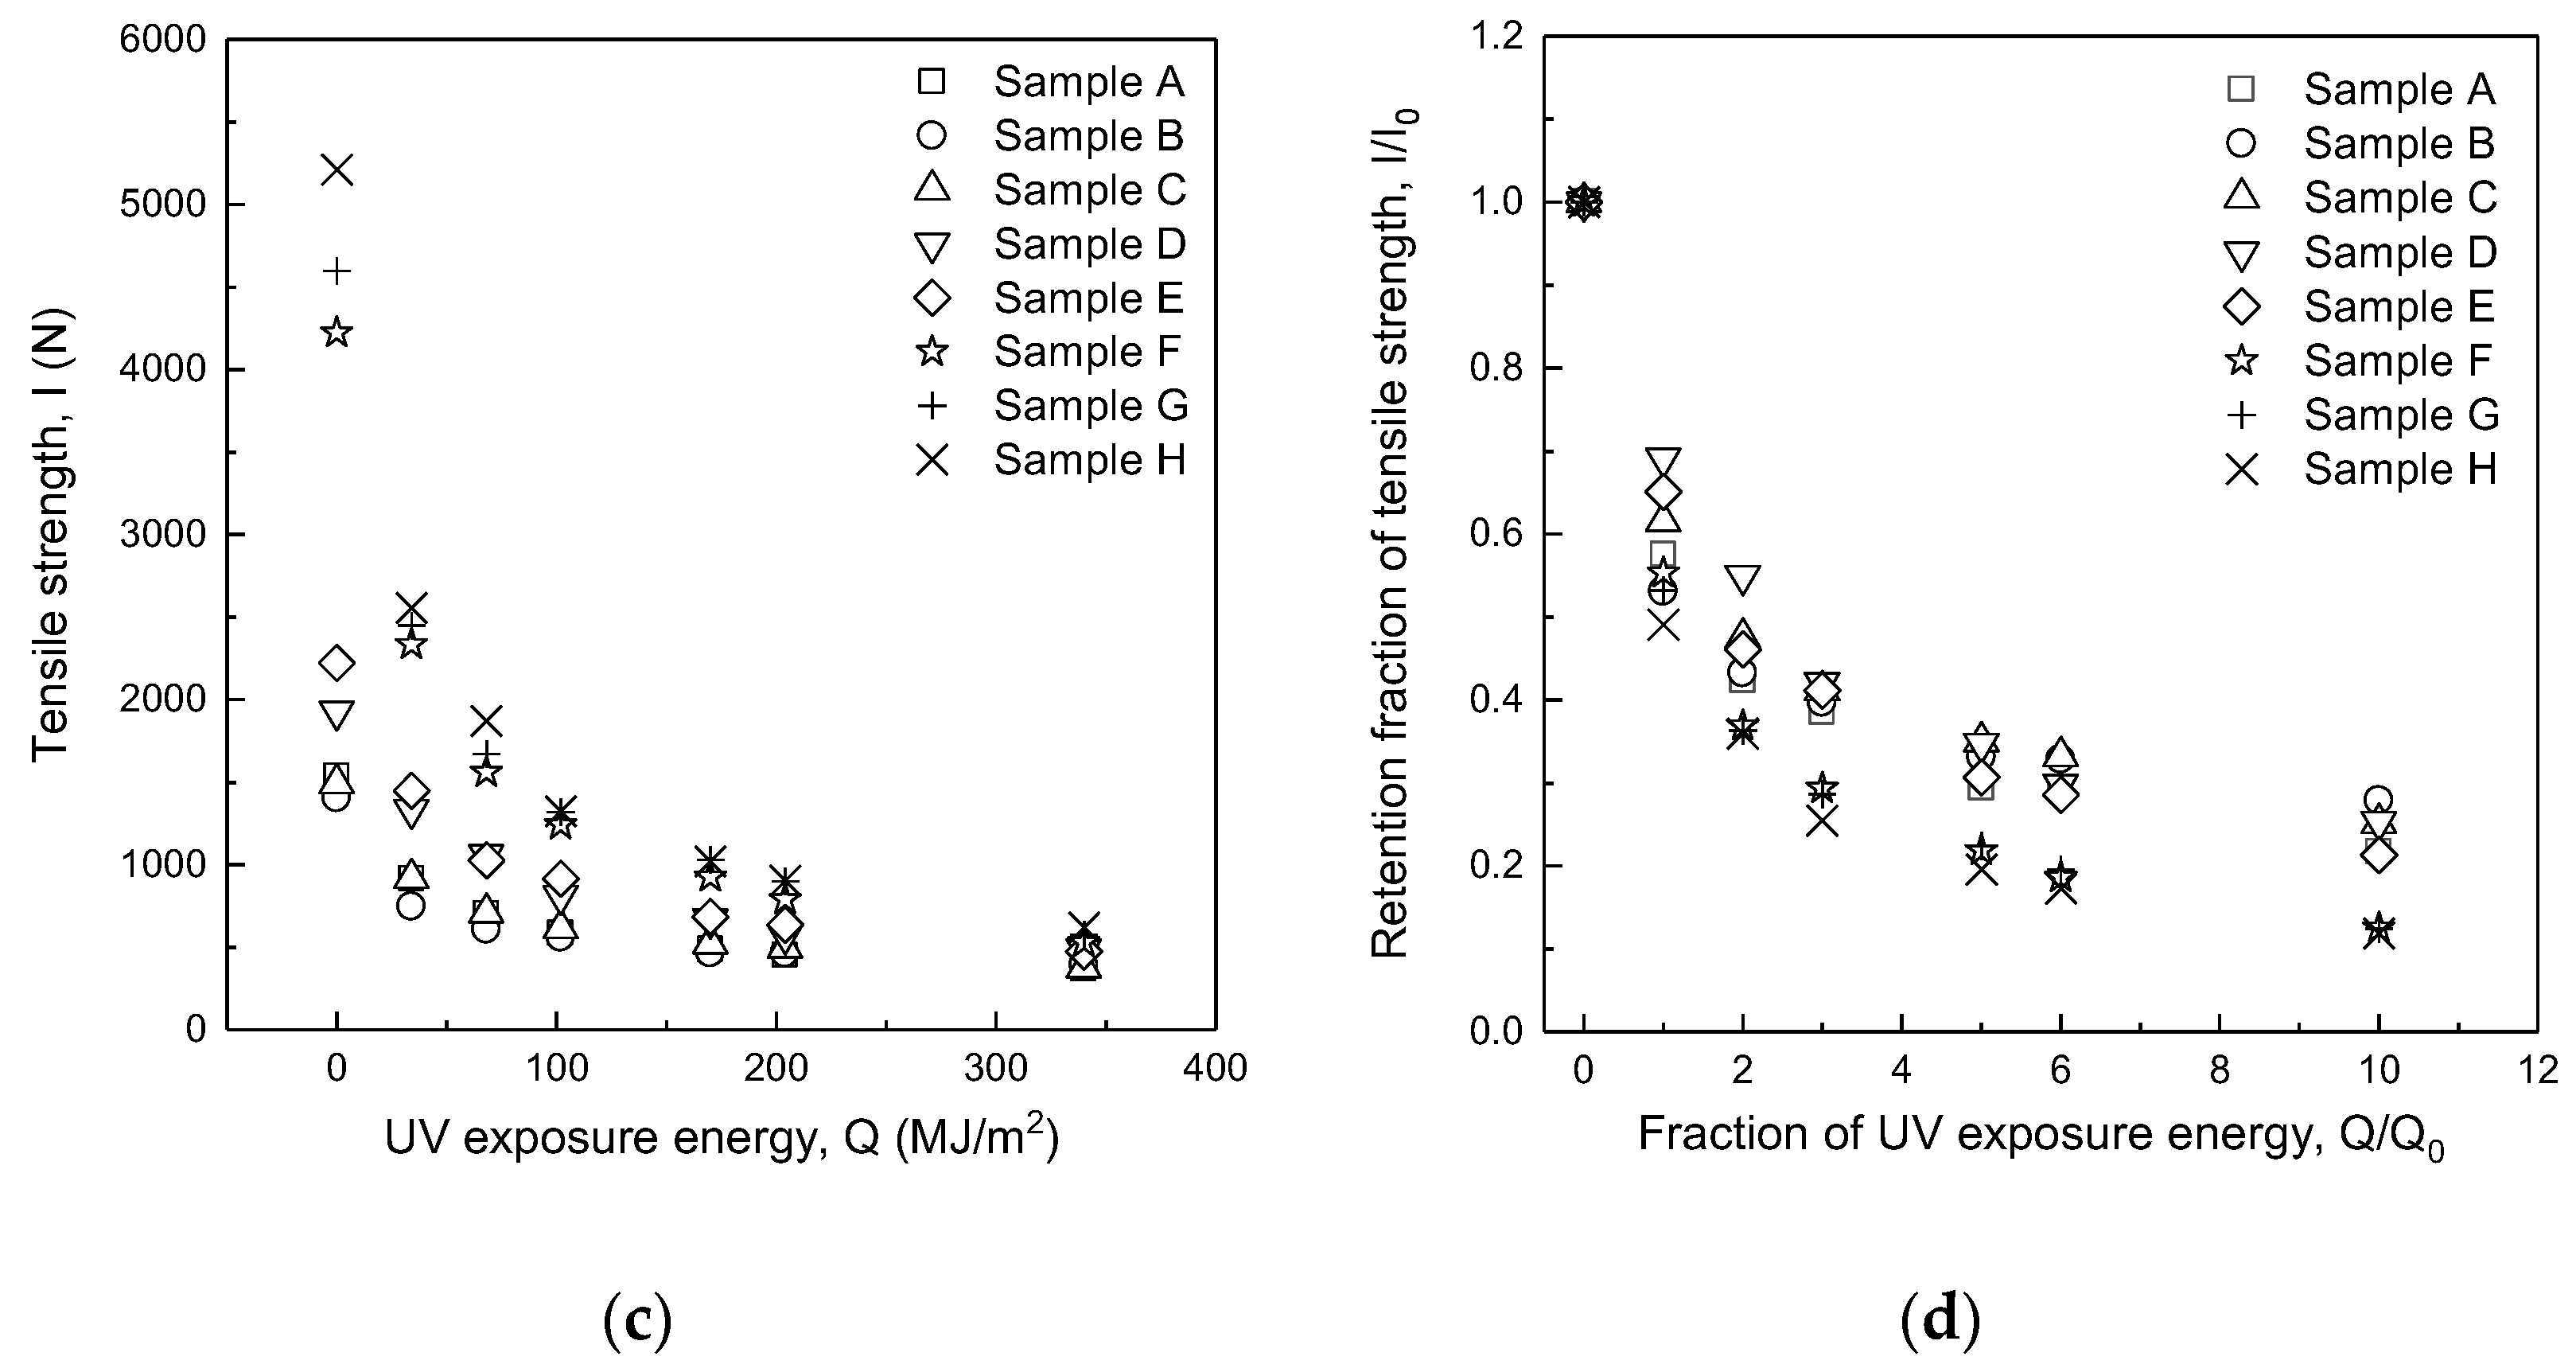
3.1. Effect of Yarn Size on Tensile Strength
3.2. Effect of Blending Ratio of m-Aramid/p-Aramid on Tensile Strength and Retention Fraction of Tensile Strength
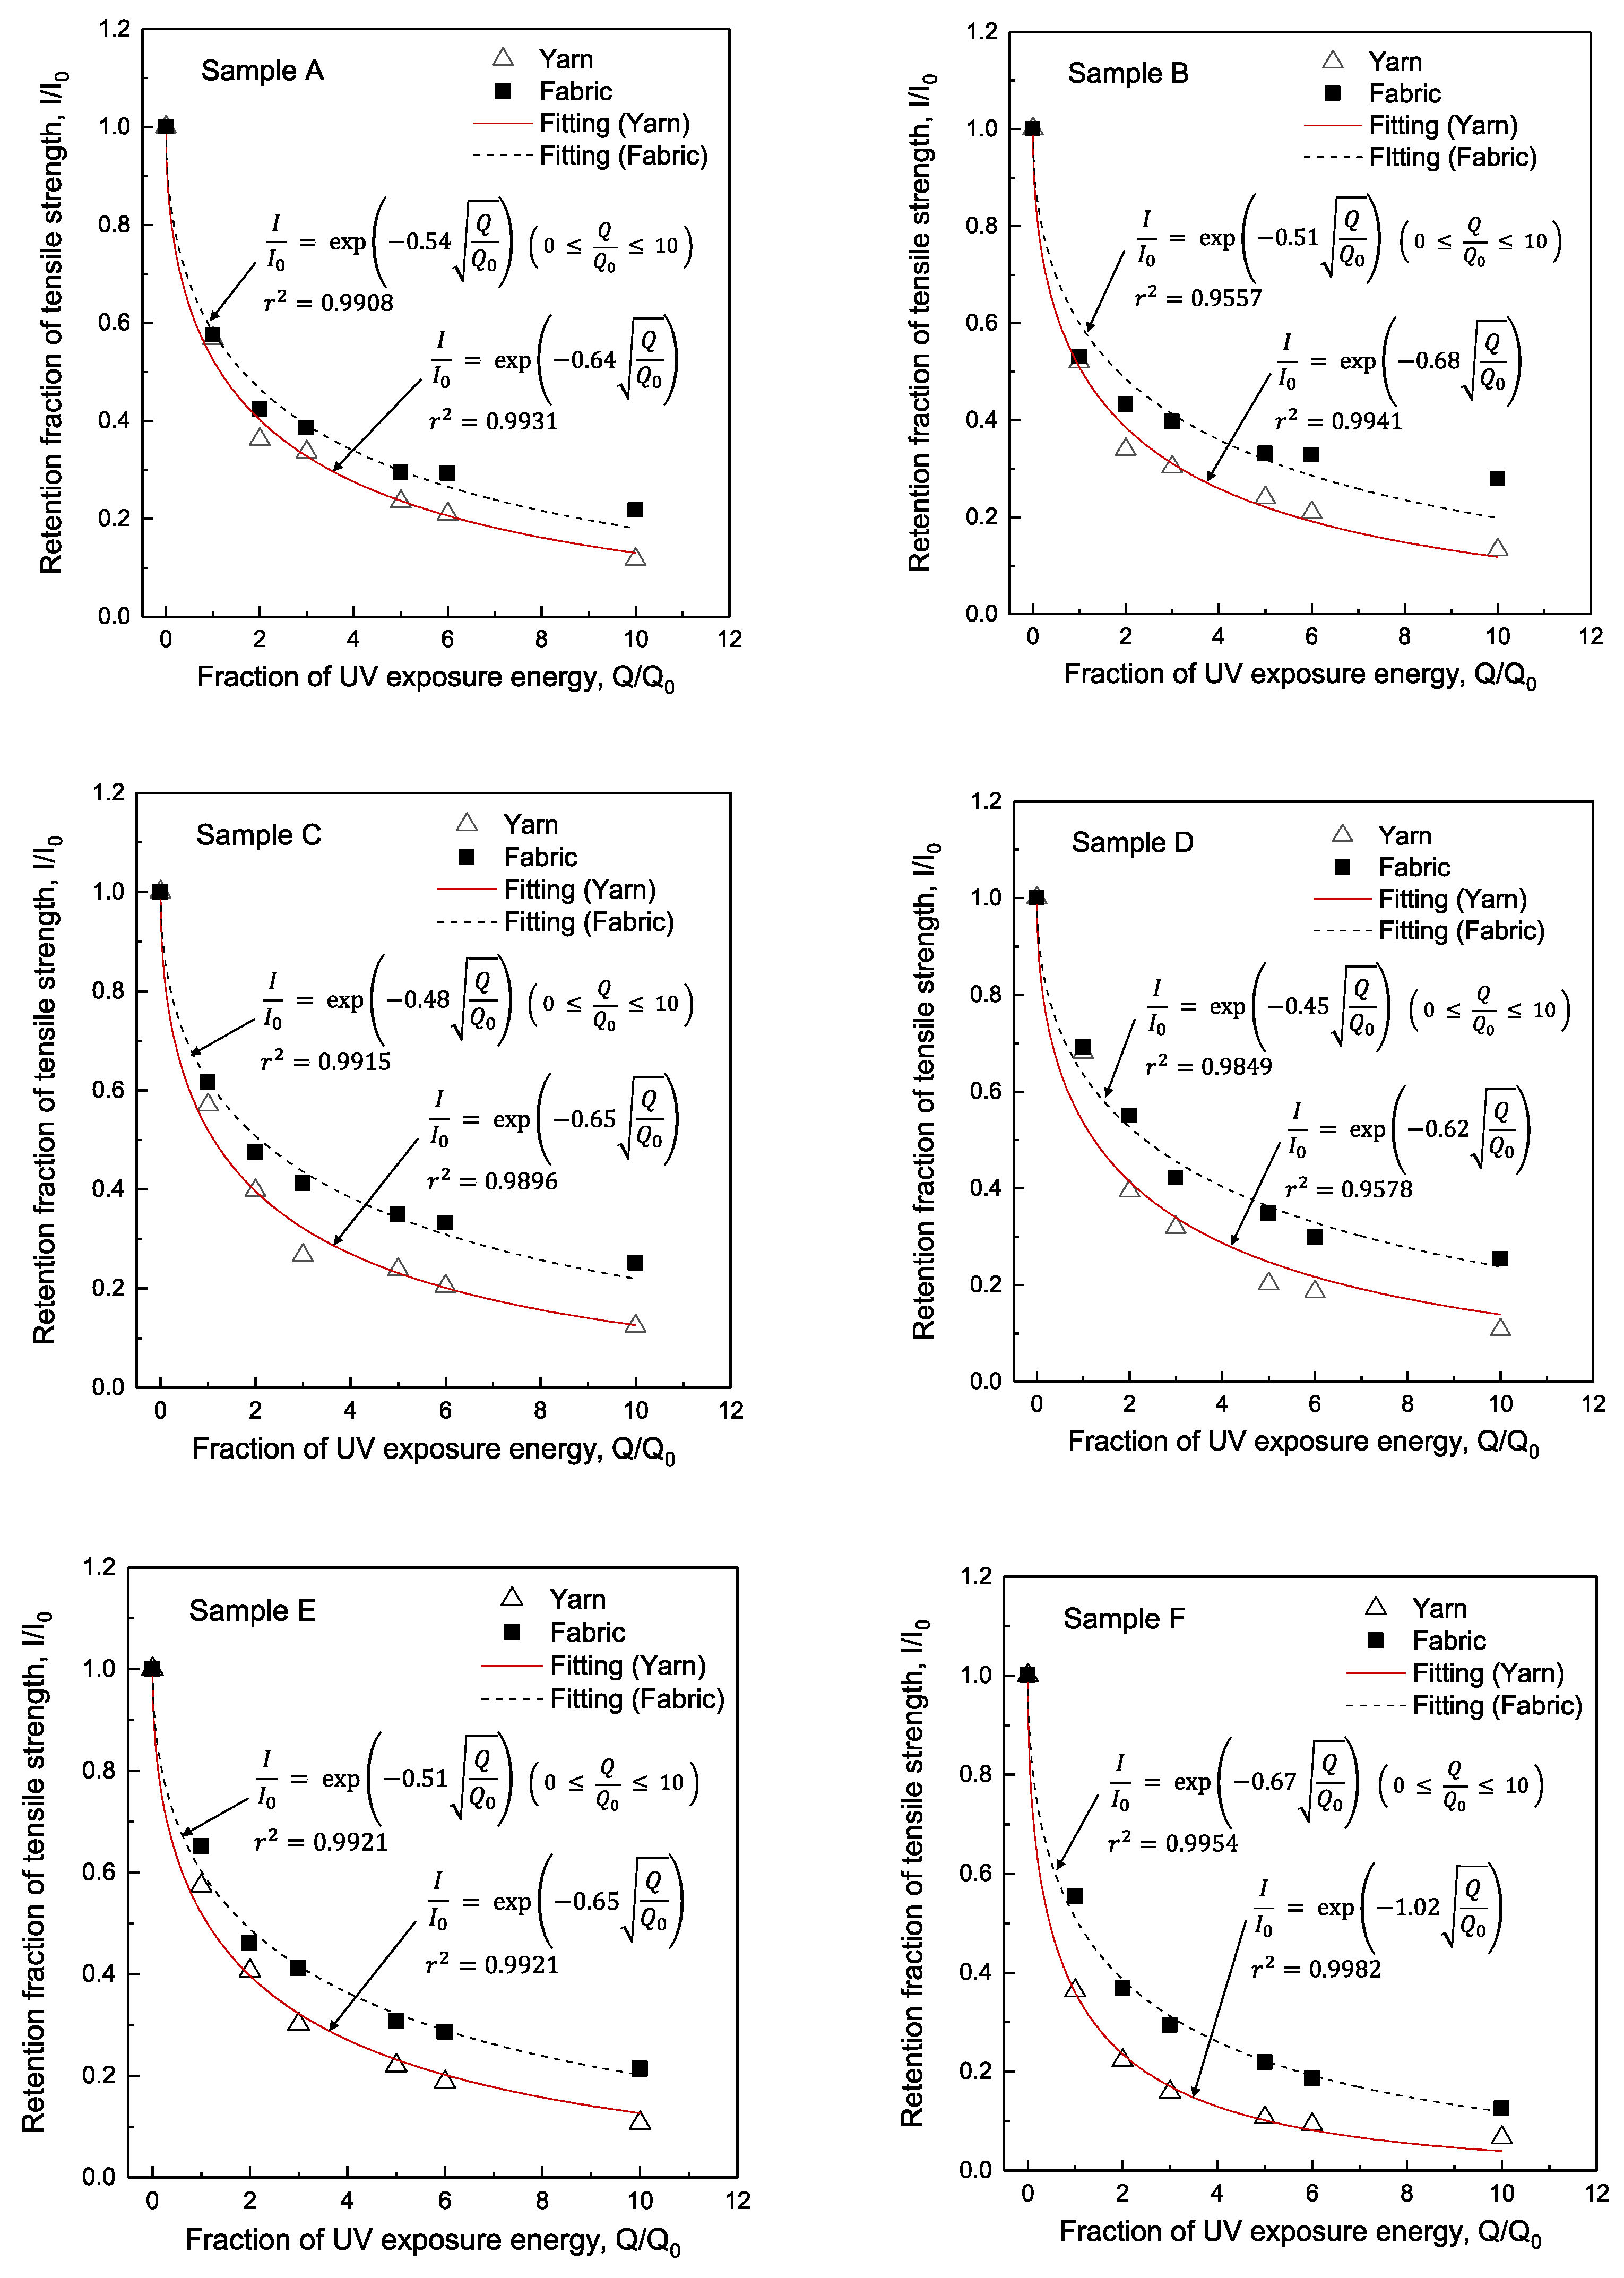
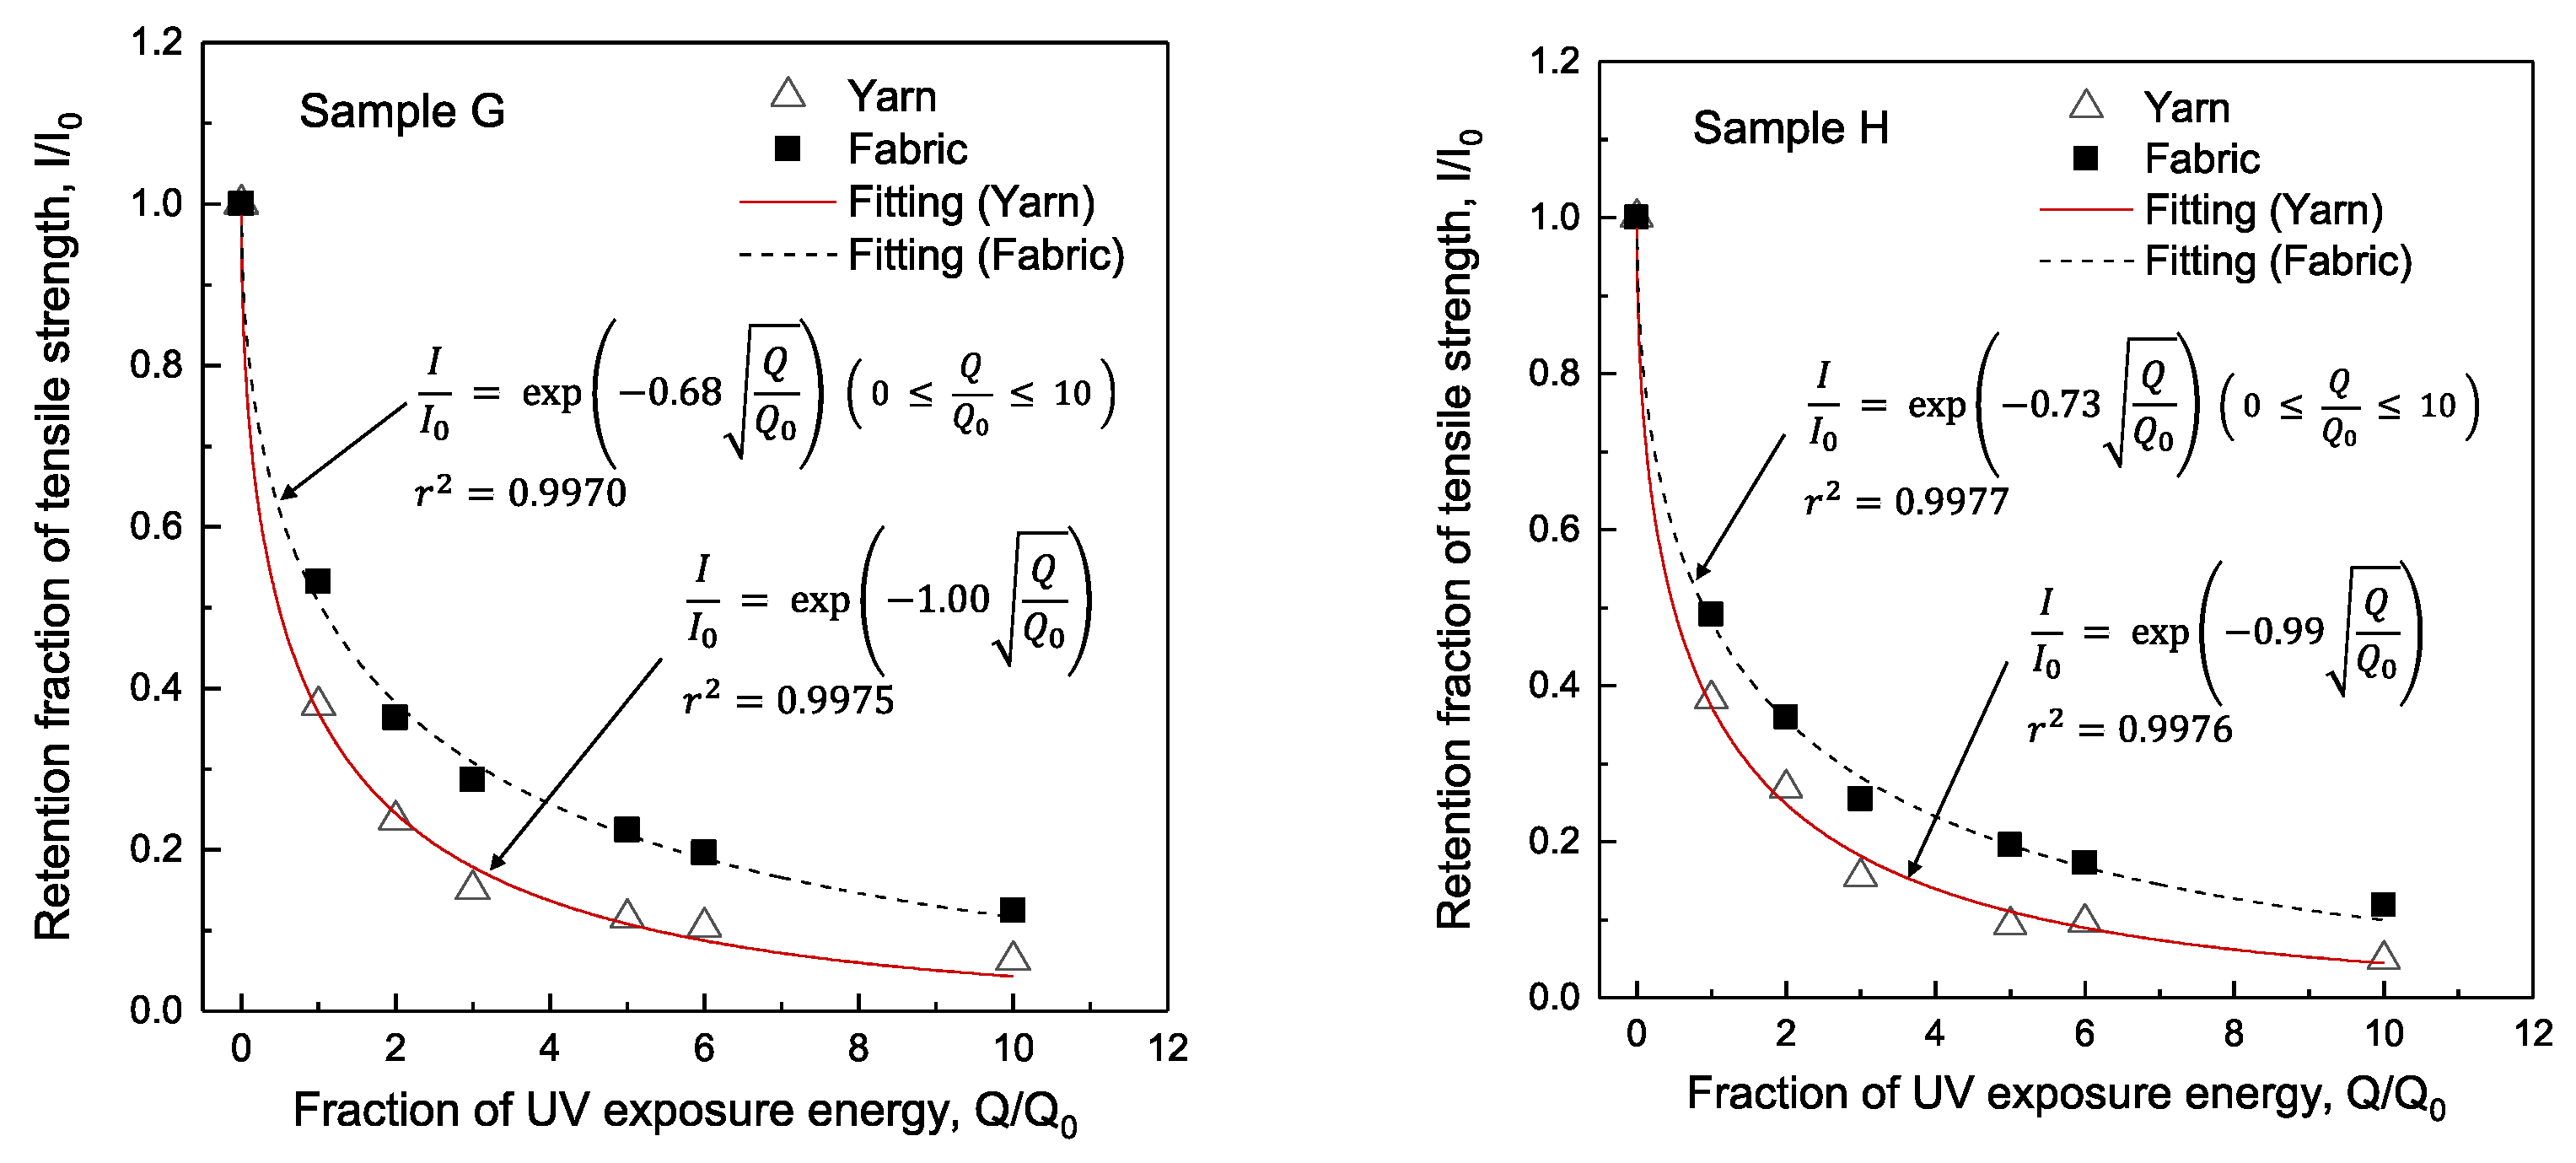
3.3. Curve Fitting of Retention Fraction of Tensile Strength
4. Conclusions
Author Contributions
Funding
Institutional Review Board Statement
Informed Consent Statement
Conflicts of Interest
References
- Niwa, M.; Kawabata, S.; Kawai, H. Mechanical Properties of Fabrics. Part 2: Experimental Studies on Parameters Describing Non-linear Tensile Properties of Plain Woven Fabrics. J. Text. Mach. Soc. Jpn. Trans. 1967, 20, T12–T31. [Google Scholar] [CrossRef]
- Niwa, M.; Kawabata, S.; Kawai, H. Mechanical Properties of Fabrics. Part 3: Theoretical Determination of Parameters Describing Uni-Axial Tensile Properties of Plain Woven Fabrics. J. Text. Mach. Soc. Jpn. Trans. 1967, 20, T258–T269. [Google Scholar] [CrossRef]
- Kawabata, S.; Niwa, M.; Kawai, H. 3—The finite-deformation theory of plain-weave fabrics part i: The biaxial-deformation theory. J. Text. Inst. 1973, 64, 21–46. [Google Scholar] [CrossRef]
- Davis, R.; Chin, J.; Lin, C.C.; Petit, S. Accelerated weathering of polyaramid and polybenzimidazole firefighter protective clothing fabrics. Polym. Degrad. Stab. 2010, 95, 1642–1654. [Google Scholar] [CrossRef]
- El Aidani, R.; Nguyen-Tri, P.; Malajati, Y.; Lara, J.; Vu-Khanh, T. Photochemical aging of an e-PTFE/NOMEX® membrane used in firefighter protective clothing. Polym. Degrad. Stab. 2013, 98, 1300–1310. [Google Scholar] [CrossRef]
- Yamaguchi, T. Study on Ultraviolet Deterioration and Creep Failure of FRP Rods for Concrete Reinforcement. Ph.D. Thesis, University of Tokyo, Tokyo, Japan, 1998. Available online: https://dl.ndl.go.jp/info:ndljp/pid/3157825/1 (accessed on 31 August 2022).
- Weibull, W. A Statistical Distribution Function of Wide Applicability. J. Appl. Mech. 1951, 18, 293–297. [Google Scholar] [CrossRef]
- Rezazadeh, M.; Bespflug, C.J.; Torvi, D.A.; Noble, S.D.; Fulton, M.M. Predicting Mechanical Strength of In-Use Firefighter Protective Clothing Using Near-Infrared Spectroscopy. Fire Technol. 2018, 54, 1759–1781. [Google Scholar] [CrossRef]
- Wakatsuki, K.; Matsubara, M.; Watanabe, N.; Bao, L.; Morikawa, H. Effects of m-Aramid/p-Aramid Blend Ratio on Tensile Strength due to UV Degradation for Firefighter Clothing Fabrics and Development of Predictive Equation for Tensile Strength. Polymers 2022, 14, 3241. [Google Scholar] [CrossRef] [PubMed]
- National Fire Protection Association. Standard on Selection, Care, and Maintenance of Protective Ensembles for Structural Fire Fighting and Proximity Fire Fighting. 2020. Available online: https://www.nfpa.org/codes-and-standards/all-codes-and-standards/list-of-codes-and-standards/detail?code=1851 (accessed on 31 August 2022).
- International Organization for Standardization. Plastics—Methods of Exposure to Laboratory Light Sources—Part 2: Xenon-Arc Lamps. 2013. Available online: https://www.iso.org/standard/55481.html (accessed on 31 August 2022).
- Japanese Industrial Standards. Test Method of Weatherability for Automotive Parts. 1987. Available online: https://webdesk.jsa.or.jp/books/W11M0090/index/?bunsyo_id=JIS+D+0205%3A1987 (accessed on 31 August 2022).
- Japan Meteorological Agency. Data Collection on Solar Radiation and Infrared Radiation. (In Japanese). Available online: https://www.data.jma.go.jp/gmd/env/radiation/data_rad.html (accessed on 31 August 2022).
- Japanese Industrial Standards. Testing Methods for Spun Yarn. 2010. Available online: https://webdesk.jsa.or.jp/books/W11M0090/index/?bunsyo_id=JIS+L+1095%3A2010 (accessed on 31 August 2022).


| Sample | Fiber and Blending Ratio (%) | Yarn Count, Ne (dtex) |
|---|---|---|
| A | m-Aramid = 100 | 18.9 (312) |
| B | m-Aramid = 100 | 25.0 (236) |
| C | m-Aramid/p-Aramid = 90/10 | 20.0 (295) |
| D | m-Aramid/p-Aramid = 80/20 | 18.9 (312) |
| E | m-Aramid/p-Aramid = 60/40 | 18.9 (312) |
| F | m-Aramid/p-Aramid = 40/60 | 18.9 (312) |
| G | m-Aramid/p-Aramid = 20/80 | 18.9 (312) |
| H | p-Aramid = 100 | 25.0 (236) |
| Estimated Years (Year) | 0 | 1 | 2 | 3 | 5 | 6 | 10 |
|---|---|---|---|---|---|---|---|
| UV exposure energy (MJ/m2) | 0 | 34 | 68 | 102 | 170 | 204 | 340 |
| Exposure time (hour) | 0 | 52.4 | 104.8 | 157.2 | 262.0 | 314.4 | 524.0 |
| UV Exposure Dosage (MJ/m2) | ||||||||
|---|---|---|---|---|---|---|---|---|
| Q (MJ/m2) | 0 | 34 | 68 | 102 | 170 | 204 | 340 | |
| Q/Q0 | 0 | 1 | 2 | 3 | 5 | 6 | 10 | |
| A | I (cN) | 1677.2 | 951.9 | 606.8 | 564.6 | 394.1 | 351.4 | 196.3 |
| s(cN) | 132.2 | 67.7 | 52.7 | 62.2 | 44.9 | 57.7 | 45.1 | |
| I/I0 | 1.00 | 0.57 | 0.36 | 0.34 | 0.23 | 0.21 | 0.12 | |
| B | I (cN) | 1145.0 | 594.5 | 389.0 | 347.4 | 275.2 | 239.7 | 151.9 |
| s (cN) | 73.7 | 48.8 | 38.1 | 20.3 | 36.5 | 29.6 | 26.1 | |
| I/I0 | 1.00 | 0.52 | 0.34 | 0.30 | 0.24 | 0.21 | 0.13 | |
| C | I (cN) | 1583.6 | 903.3 | 629.2 | 422.1 | 377.0 | 323.7 | 195.7 |
| s (cN) | 88.6 | 89.4 | 53.9 | 36.9 | 50.4 | 62.1 | 22.2 | |
| I/I0 | 1.00 | 0.57 | 0.40 | 0.27 | 0.24 | 0.20 | 0.12 | |
| D | I (cN) | 2058.1 | 1402.5 | 811.5 | 656.3 | 417.3 | 383.2 | 221.1 |
| s (cN) | 175.4 | 87.1 | 108.5 | 93.5 | 85.9 | 76.2 | 46.8 | |
| I/I0 | 1.00 | 0.68 | 0.39 | 0.32 | 0.20 | 0.19 | 0.11 | |
| E | I (cN) | 2303.2 | 1320.8 | 935.5 | 694.7 | 506.0 | 431.8 | 245.0 |
| s (cN) | 148.4 | 105.5 | 69.1 | 55.6 | 67.1 | 38.7 | 36.7 | |
| I/I0 | 1.00 | 0.57 | 0.41 | 0.30 | 0.22 | 0.19 | 0.11 | |
| F | I (cN) | 5472.1 | 1986.3 | 1215.9 | 867.9 | 582.6 | 505.8 | 363.2 |
| s (cN) | 580.0 | 156.5 | 116.7 | 86.6 | 90.8 | 59.5 | 57.3 | |
| I/I0 | 1.00 | 0.36 | 0.22 | 0.16 | 0.11 | 0.09 | 0.07 | |
| G | I (cN) | 5449.4 | 2063.8 | 1290.6 | 819.8 | 627.6 | 566.9 | 343.7 |
| s (cN) | 408.5 | 187.2 | 119.9 | 80.5 | 75.1 | 67.4 | 32.4 | |
| I/I0 | 1.00 | 0.38 | 0.24 | 0.15 | 0.12 | 0.10 | 0.06 | |
| H | I (cN) | 5925.8 | 2268.3 | 1592.4 | 917.8 | 548.8 | 572.2 | 289.1 |
| s (cN) | 613.8 | 229.6 | 184.8 | 111.2 | 59.9 | 94.8 | 46.5 | |
| I/I0 | 1.00 | 0.38 | 0.27 | 0.15 | 0.09 | 0.10 | 0.05 | |
| UV Exposure Dosage (MJ/m2) | ||||||||
|---|---|---|---|---|---|---|---|---|
| Q (MJ/m2) | 0 | 34 | 68 | 102 | 170 | 204 | 340 | |
| Q/Q0 | 0 | 1 | 2 | 3 | 5 | 6 | 10 | |
| A | I (cN) | 1677.2 | 951.9 | 606.8 | 564.6 | 394.1 | 351.4 | 196.3 |
| I/I0 | 1.00 | 0.57 | 0.36 | 0.34 | 0.23 | 0.21 | 0.12 | |
| B | I (cN) | 1145.0 | 594.5 | 389.0 | 347.4 | 275.2 | 239.7 | 151.9 |
| I/I0 | 1.00 | 0.52 | 0.34 | 0.30 | 0.24 | 0.21 | 0.13 | |
| (cN) | 532.2 | 357.4 | 217.8 | 217.2 | 118.9 | 111.7 | 44.4 | |
| (%) | 46.5 | 60.1 | 56.0 | 62.5 | 43.2 | 46.6 | 29.2 | |
| 0.00 | 0.05 | 0.02 | 0.04 | −0.01 | 0.00 | −0.01 | ||
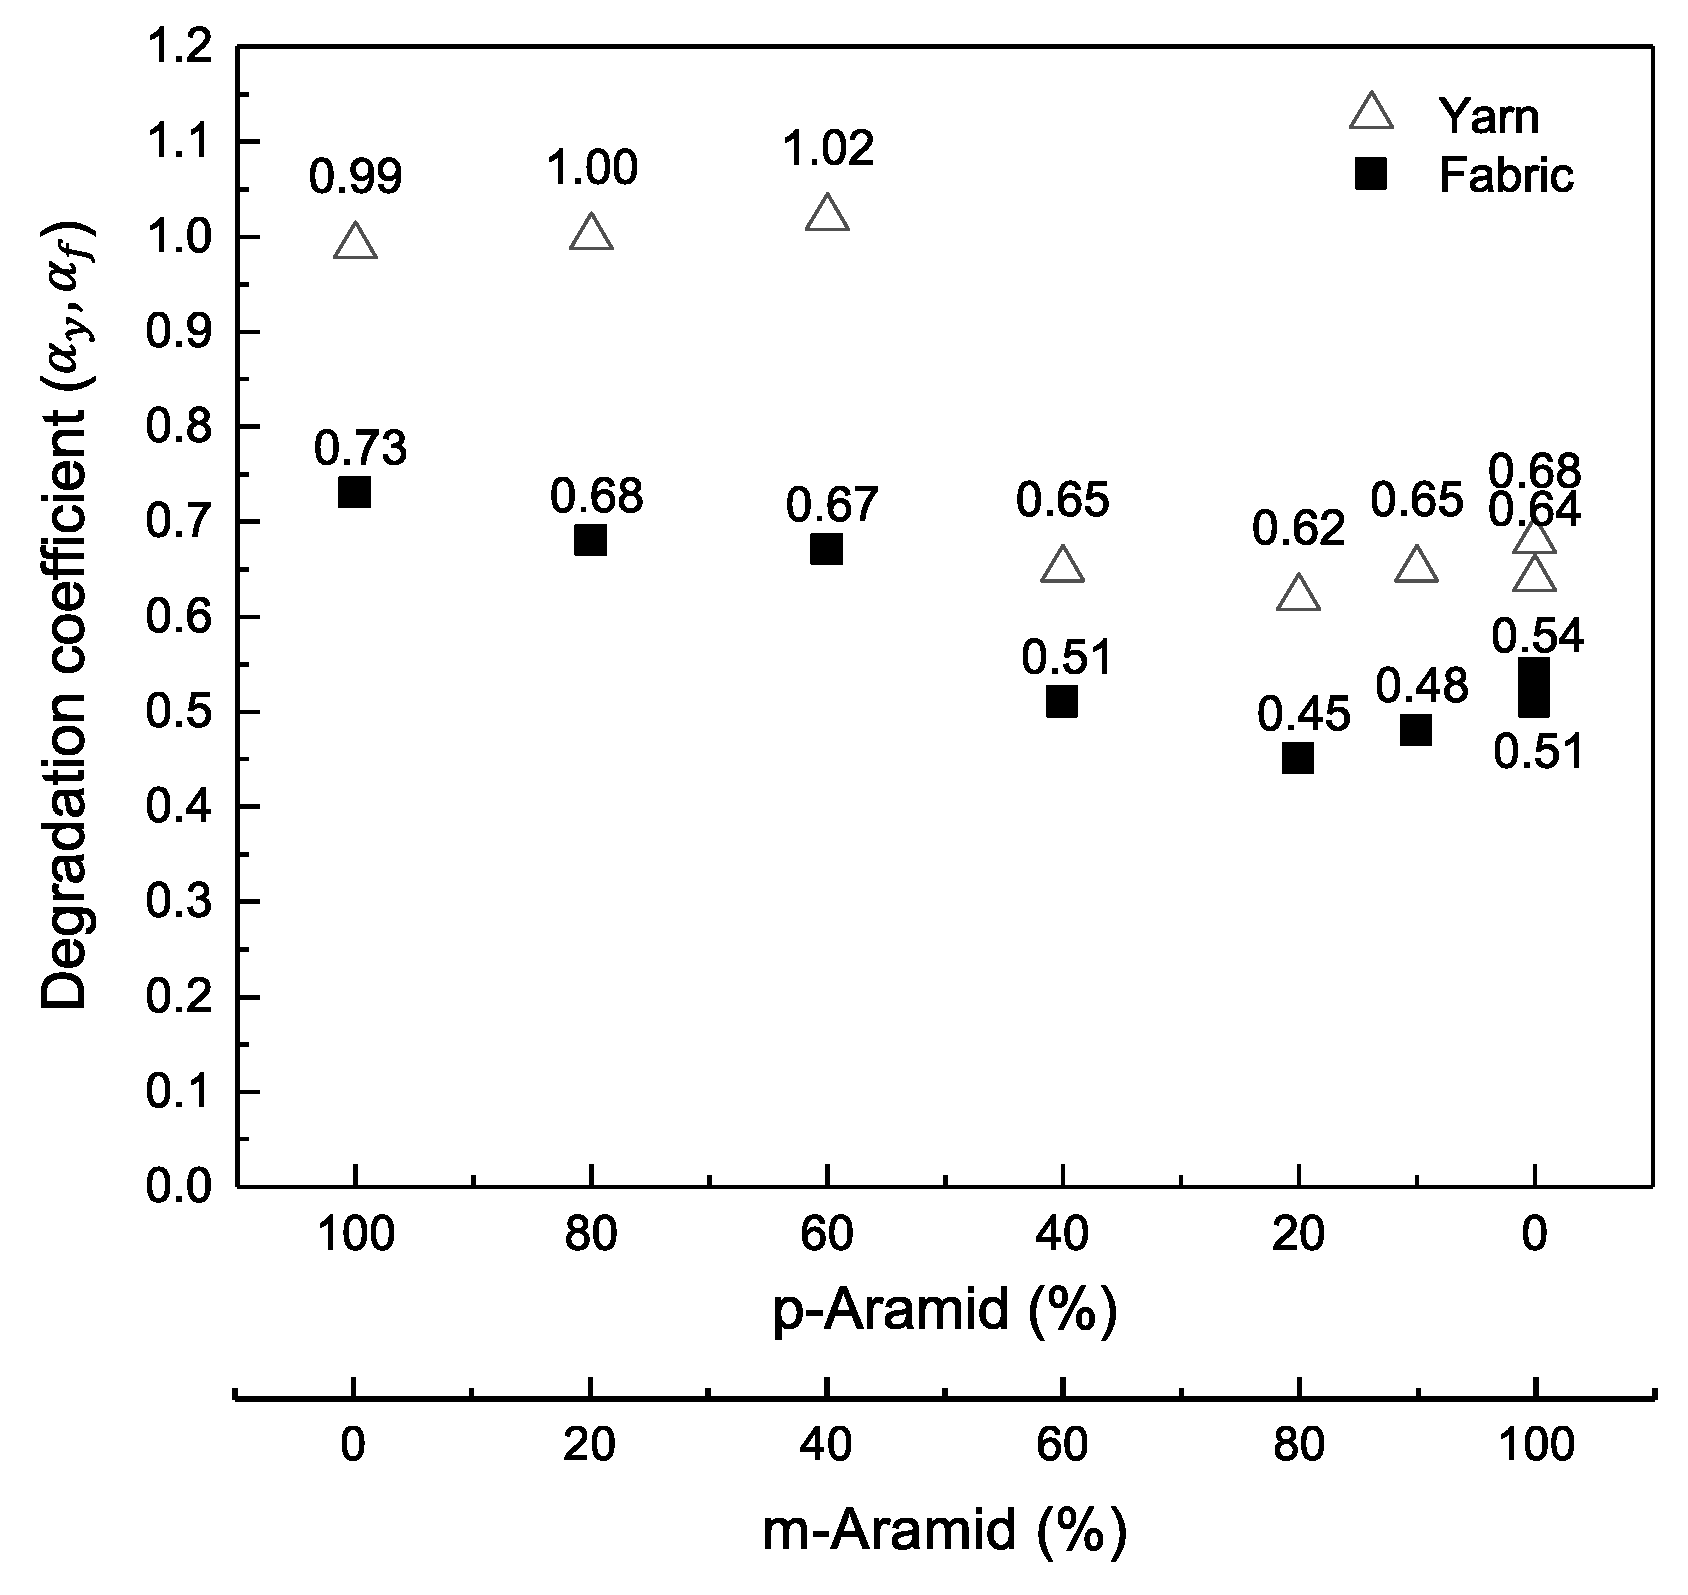
| Sample | A | B | C | D | E | F | G | H |
|---|---|---|---|---|---|---|---|---|
| m-Aramid (%) | 100 | 100 | 90 | 80 | 60 | 40 | 20 | 0 |
| p-Aramid (%) | 0 | 0 | 10 | 20 | 40 | 60 | 80 | 100 |
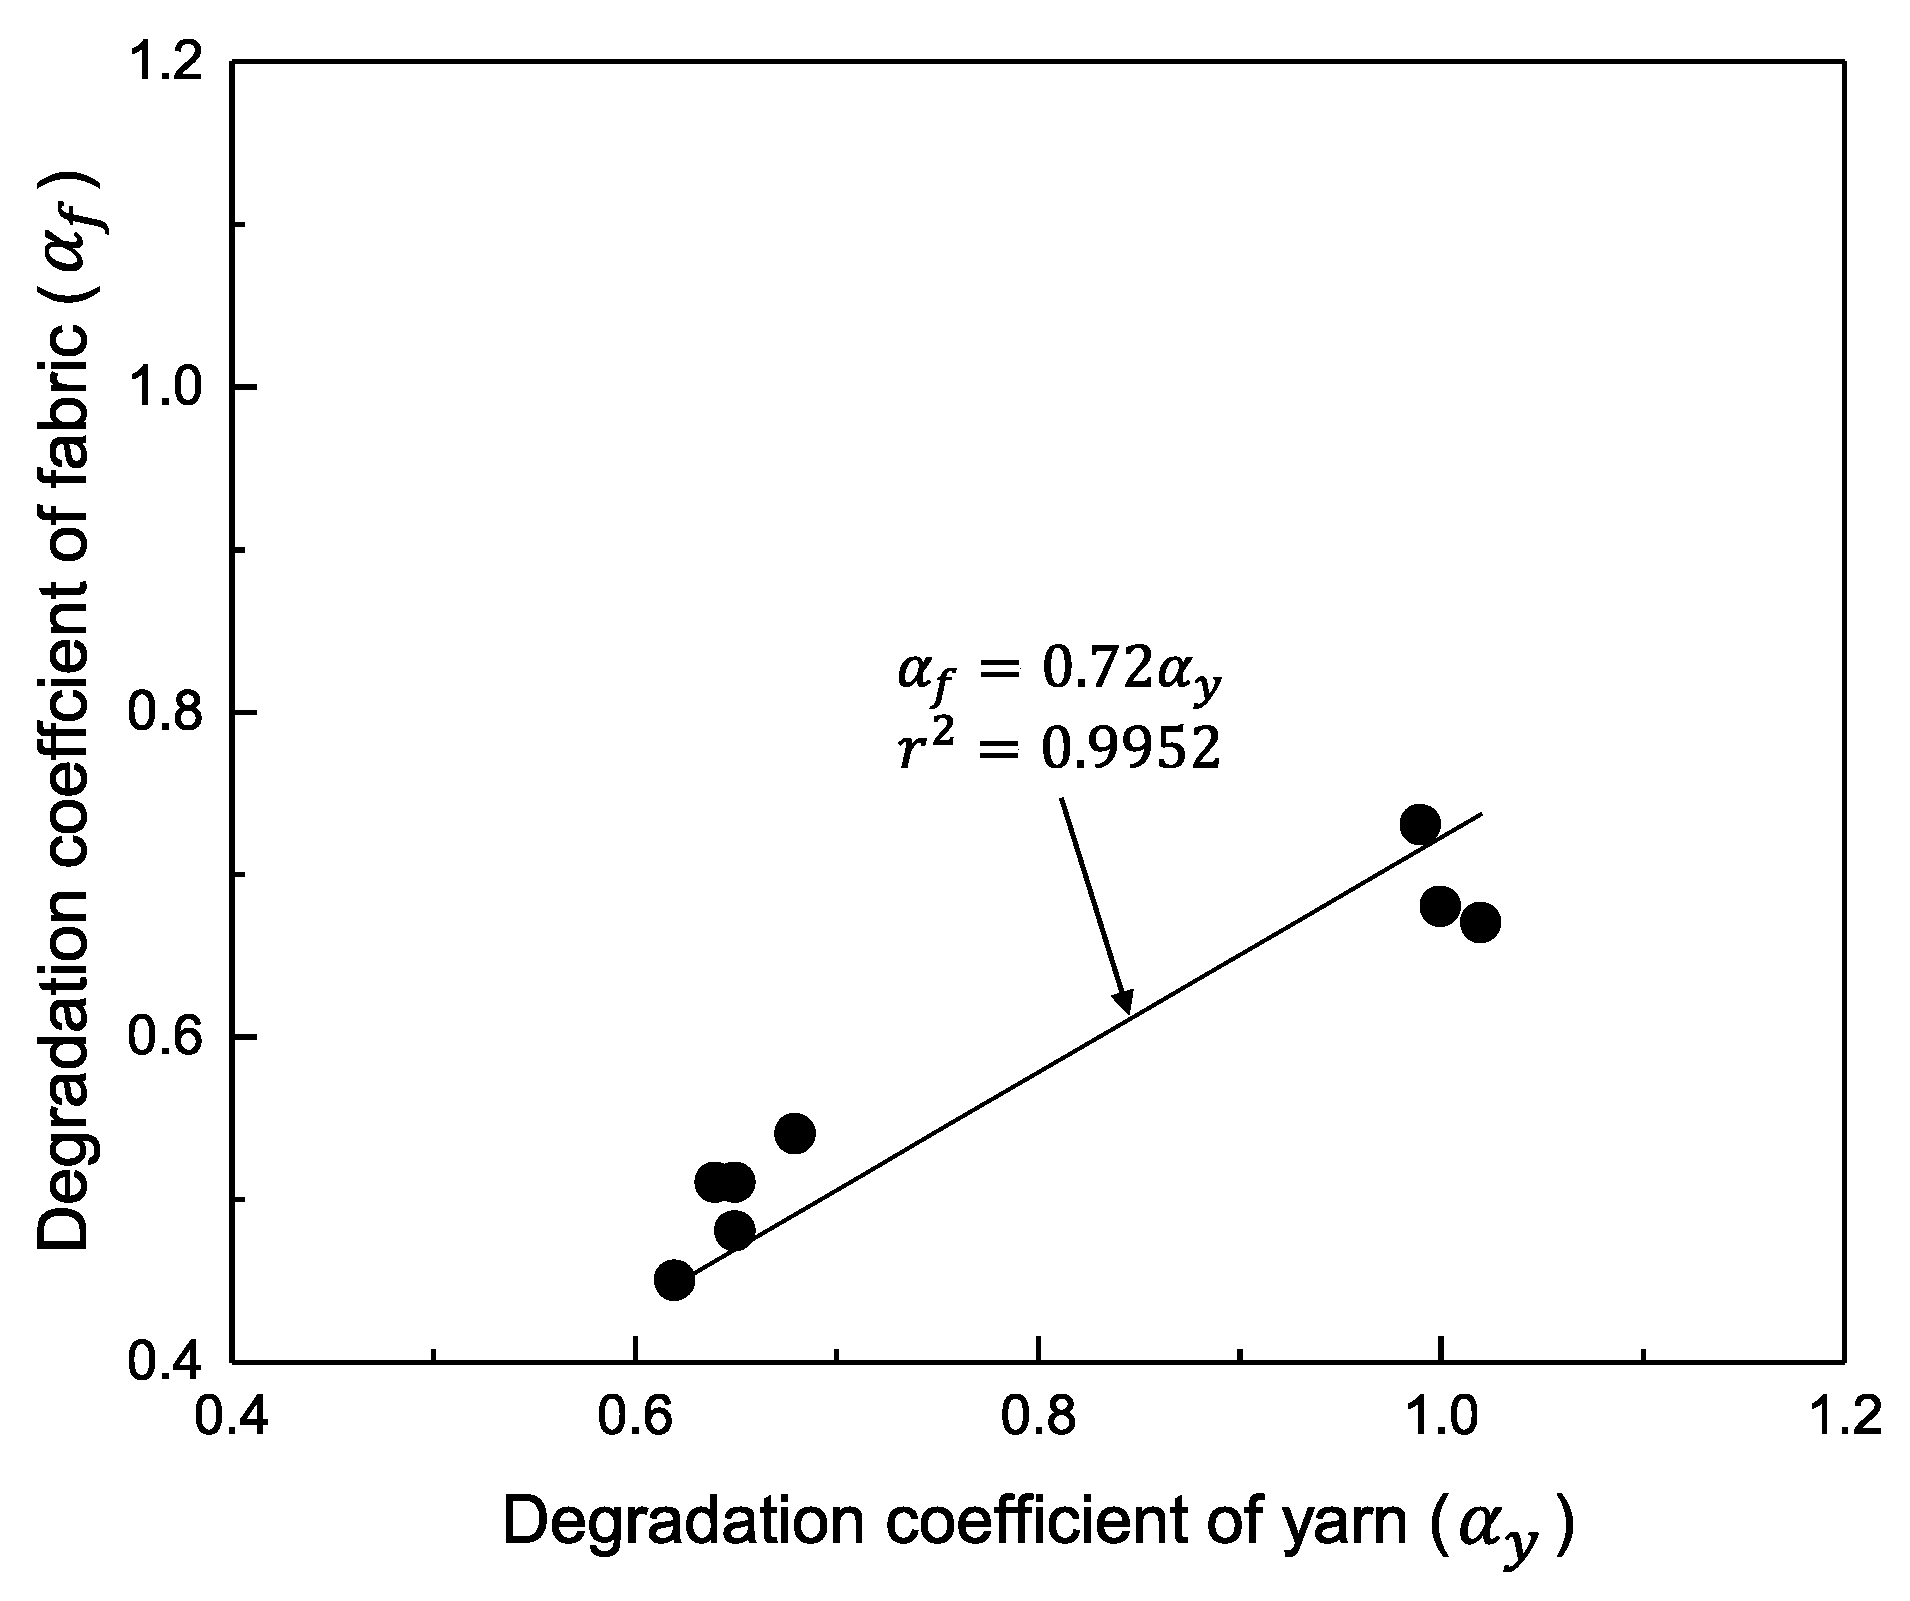
| 0.64 | 0.68 | 0.65 | 0.62 | 0.65 | 1.02 | 1.00 | 0.99 | |
| 0.54 | 0.51 | 0.48 | 0.45 | 0.51 | 0.67 | 0.68 | 0.73 | |
| 0.10 | 0.17 | 0.17 | 0.17 | 0.14 | 0.35 | 0.32 | 0.26 | |
| 18.5 | 33.3 | 35.4 | 37.8 | 27.5 | 52.2 | 47.1 | 35.6 |
Publisher’s Note: MDPI stays neutral with regard to jurisdictional claims in published maps and institutional affiliations. |
© 2022 by the authors. Licensee MDPI, Basel, Switzerland. This article is an open access article distributed under the terms and conditions of the Creative Commons Attribution (CC BY) license (https://creativecommons.org/licenses/by/4.0/).
Share and Cite
Wakatsuki, K.; Onoda, S.; Matsubara, M.; Watanabe, N.; Bao, L.; Morikawa, H. Quantitative Assessment of Tensile Strength and Degradation Coefficient of m-Aramid/p-Aramid Blended Yarns Used for Outer Layers of Firefighter Clothing under Ultraviolet Light and Correlation with Fabrics Data. Polymers 2022, 14, 3948. https://doi.org/10.3390/polym14193948
Wakatsuki K, Onoda S, Matsubara M, Watanabe N, Bao L, Morikawa H. Quantitative Assessment of Tensile Strength and Degradation Coefficient of m-Aramid/p-Aramid Blended Yarns Used for Outer Layers of Firefighter Clothing under Ultraviolet Light and Correlation with Fabrics Data. Polymers. 2022; 14(19):3948. https://doi.org/10.3390/polym14193948
Chicago/Turabian StyleWakatsuki, Kaoru, Souta Onoda, Minami Matsubara, Norimichi Watanabe, Limin Bao, and Hideaki Morikawa. 2022. "Quantitative Assessment of Tensile Strength and Degradation Coefficient of m-Aramid/p-Aramid Blended Yarns Used for Outer Layers of Firefighter Clothing under Ultraviolet Light and Correlation with Fabrics Data" Polymers 14, no. 19: 3948. https://doi.org/10.3390/polym14193948