Article

Loading and Release of Phenolic Compounds Present in Mexican Oregano (Lippia graveolens) in Different Chitosan Bio-Polymeric Cationic Matrixes

by
Melissa Garcia-Carrasco
1,
Lorenzo A. Picos-Corrales
2,
Erick P. Gutiérrez-Grijalva
3,
Miguel A. Angulo-Escalante
1,
Angel Licea-Claverie
4,* and
J. Basilio Heredia
1,*
1
Nutraceuticals and Functional Foods Laboratory, Centro de Investigación en Alimentación y Desarrollo, A.C., Carretera a Eldorado Km. 5.5, Col. Campo El Diez, Culiacán 80110, Sinaloa, Mexico
2
Facultad de Ingeniería Culiacán, Universidad Autónoma de Sinaloa, Ciudad Universitaria, Culiacán 80013, Sinaloa, Mexico
3
Cátedras CONACYT-Centro de Investigación en Alimentación y Desarrollo, A.C., Carretera a Eldorado Km. 5.5, Col. Campo El Diez, Culiacán 80110, Sinaloa, Mexico
4
Centro de Graduados e Investigación en Química, Tecnológico Nacional de Mexico/Instituto Tecnológico de Tijuana, A.P. 1166, Tijuana 22000, Baja California, Mexico
*
Authors to whom correspondence should be addressed.
Polymers 2022, 14(17), 3609; https://doi.org/10.3390/polym14173609
Submission received: 1 July 2022 / Revised: 17 August 2022 / Accepted: 25 August 2022 / Published: 1 September 2022

Abstract

:
Mexican oregano (Lippia graveolens) polyphenols have antioxidant and anti-inflammatory potential, but low bioaccessibility. Therefore, in the present work the micro/nano-encapsulation of these compounds in two different matrixes of chitosan (CS) and chitosan-b-poly(PEGMA2000) (CS-b-PPEGMA) is described and assessed. The particle sizes of matrixes of CS (~955 nm) and CS-b-PPEGMA (~190 nm) increased by 10% and 50%, respectively, when the phenolic compounds were encapsulated, yielding loading efficiencies (LE) between 90–99% and 50–60%, correspondingly. The release profiles in simulated fluids revealed a better control of host–guest interactions by using the CS-b-PPEGMA matrix, reaching phenolic compounds release of 80% after 24 h, while single CS retained the guest compounds. The total reducing capacity (TRC) and Trolox equivalent antioxidant capacity (TEAC) of the phenolic compounds (PPHs) are protected and increased (more than five times) when they are encapsulated. Thus, this investigation provides a standard encapsulation strategy and relevant results regarding nutraceuticals stabilization and their improved bioaccessibility.

1. Introduction

The secondary metabolites present in plants, such as phenolic compounds, better known as phytochemicals, have gained great interest in recent years since they play an important role in the prevention of different diseases such as cancer, diabetes, and obesity, which are related to oxidative stress [1]. Mexican oregano (L. graveolens) is an endemic species from northwestern Mexico mostly known for its culinary uses but is also a rich source of phenolic compounds that can bring great benefits to human health due to their pharmacological properties, which include the anti-inflammatory, antifungal, and antibacterial activities, among others [2,3,4]. In this subject, essential oils and polyphenols are the major secondary metabolites found in oregano that are responsible for its biological properties [2,5]. Previous works have shown that oregano polyphenols have low bioaccessibility, and in-vitro digestion assays have demonstrated that phenolic acids, flavones, and flavanones of oregano seem to be susceptible to the pH changes during each digestion stage [6,7,8]. Thus, despite the bioactive properties of oregano polyphenols, they may be affected during their journey through the gastrointestinal (GI) tract, mainly due to pH changes favoring the ionization of these compounds or they are degraded, and thus the active compounds could lose their properties [1,9,10].
The low bioaccessibility of polyphenols is a subject highly reported; hence, different alternatives have been proposed to protect these metabolites from degradation. Among the technologies useful for this purpose are: (1) spray drying (for microencapsulation), (2) biopolymeric-type systems such as pectin, alginate, gums, and chitosan used to encapsulate different phytochemical compounds such as curcumin, thymol, and carvacrol [11,12,13,14,15,16,17]. Although most of these loading and release studies have been carried out with isolated compounds, it has also been found that when there is a combination of phenolic compounds, they can create synergism between them and enhance their activity [18].
The biopolymer chitosan (CS), which is obtained from a natural polysaccharide called chitin, represents a biocompatible and biodegradable platform with outstanding performance in sorption-oriented processes. This is one of the main polymeric matrixes used for the encapsulation of synthetic or natural agents due to polyelectrolyte character, which means that the charge of its functional groups can be modified depending on the pH of the medium, where the amino and the hydroxyl groups give this character [19,20,21,22]. However, this biopolymer is insoluble in normal deionized water, limiting biological applications; regarding this, some studies have been focused on modifying these molecules with different polymers to improve their solubility, such as polyethylene glycol (PEG). PEG has been one of the polymers with better biocompatibility [23]. Modified biopolymers have shown the capacity to adhere to peptide sequences [24], growth factors [25], and the ability to control mechanical properties regardless of polymerization conditions [26].
As it is well known, PEG is one of the few polymers approved by the U.S. FDA; moreover, the polyethylene glycol methyl methacrylate (PEGMA) properties are attributed to PEG due to their similar structures [27]. In addition, in case a certain percentage passes into the blood system, these particles avoid a response by the immune system, thus expanding the areas of application [28,29]. In some approaches, the use of PEGMA is related to the increase in the lower critical solution temperature (LCST) of the synthesized copolymers, increasing the LCST at temperatures greater than 32 °C, which ensures that the matrix can remain stable at temperatures higher than the LCST in aqueous medium [30].
Based on the abovementioned, in the present work the encapsulation of phenolic compounds extracted from the aerial part of Mexican oregano (L. graveolens) was carried out in systems based on chitosan (CS) and chitosan modified with PEGMA (Chitosan-block-poly(PEGMA2000) (CS-b-PPEGMA), their release profiles at different pH levels were studied and their antioxidant activity before and after encapsulation was assessed. For that, a simple encapsulation method involving mechanical stirring was used.

2. Materials and Methods

2.1. Reagents

Polyethylene glycol methyl methacrylate 2000 g mol−1 (PEGMA), ammonium persulfate (APS, 98%, Sigma Aldrich, Toluca, Mexico), sodium chloride (NaCl, Jalmek, San Nicolás de los Garza, Mexico), chitosan (Low weight, 98%, Sigma Aldrich), glacial acetic acid (99.7%, Fermont, Monterrey, Mexico), deuterium chloride/deuterium oxide (D2O/DCl 35% by weight, 99.9% deuterium, Sigma Aldrich), Folin-Ciocalteu reagent, aluminum chloride, potassium acetate, quercetin, DPPH radical, ABTS radical, potassium persulfate, HPLC grade water, and formic acid were purchased from Sigma-Aldrich (Toluca, Mexico). Moreover, sodium hydroxide (97.8%, Chemical Products of Monterrey SA de CV, Monterrey, Mexico) was purchased through a local provider.

2.2. Chitosan Purification

CS was dissolved in an aqueous acetic acid solution at 1% in volume, up to a concentration of 10 mg mL−1; afterward, the mixture was filtered under reduced pressure with Büchner. CS was precipitated from the acidic solution using 1 M sodium hydroxide solution. The alkaline CS suspension was filtered under reduced pressure with a 5 µm particle cutoff filter. The CS was washed with deionized water until neutralization, frozen, and finally lyophilized (Labconco, FreeZone® 1 L, Kansas City, MI, USA).

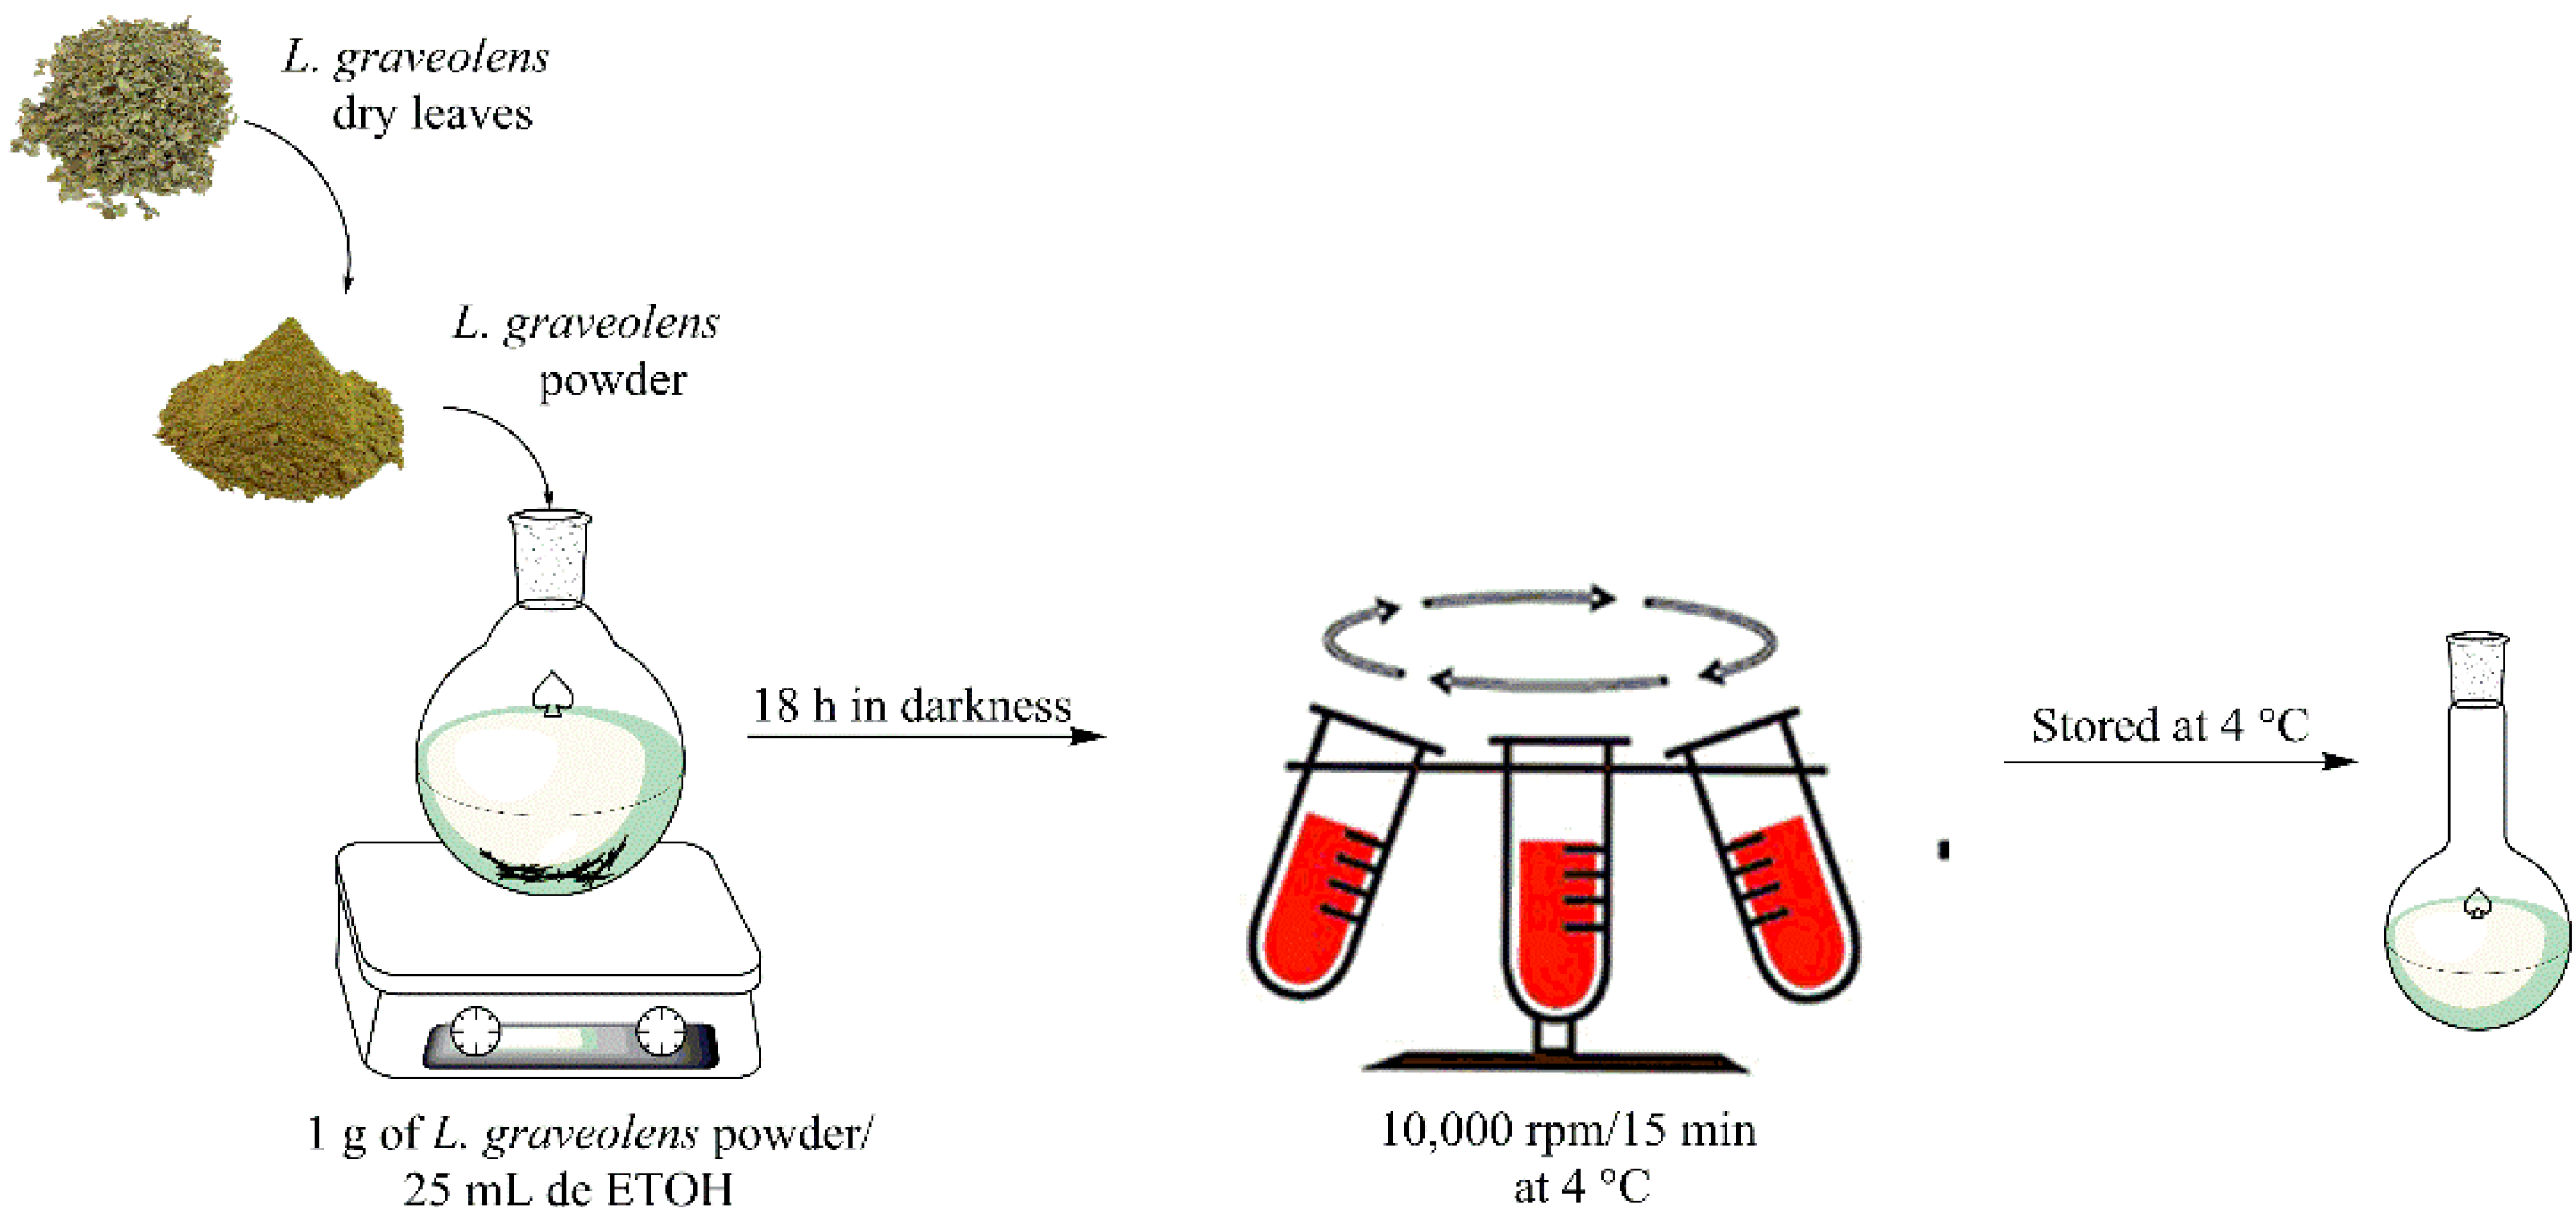
2.3. Plant Material and Extraction of Free Polyphenols

Oregano (L. graveolens) was collected in Santa Gertrudis, Durango, Mexico. Dried oregano leaves were ground using an Ika Werke M20 grinder (IKA, Staufen, Germany) until a fine powder consistency was obtained. Oregano powder was stored at −4 °C until use. The extract of phenolic compounds was obtained using 25 mL of absolute ethanol for 1 g of oregano powder, where the mixture was stirred and homogenized on a stirring plate (Thermo Scientific Cimarec, Waltham, MA, USA) at room temperature for 18 h. Subsequently, the extract obtained was centrifuged at 10,000 rpm for 15 min, and the supernatant was collected and stored at 4 °C until use. This technique was performed repeatedly to obtain approximately 1 L of extract. Figure 1 is a schematic representation for the process involving the extraction of phenolic compounds.

2.4. Characterization of the Extract of L. graveolens

2.4.1. Total Reducing Capacity

The total reducing capacity was evaluated through phenolic content analysis using the Folin–Ciocalteu (FC) method proposed by Swain and Hillis [31], with some modifications. The procedure consisted of mixing 10 μL of the samples, 230 μL of distilled water, and 10 μL of FC reagent in a 96-well microplate. The mixture was incubated for 3 min, and then 25 μL of 4N Na2CO3 were added, incubating again at room temperature for 2 h in the darkness. After incubation, absorbance at 725 nm was measured (Synergy HT microplate reader). Calculations were made using a gallic acid standard curve (from 0 to 0.4 mg mL−1) and the results were expressed in milligrams of gallic acid equivalents per gram of powder obtained (mg AG g−1). Each sample was measured in triplicate (n = 3).

2.4.2. Total Flavonoids Content (TFC)

The total flavonoid content was performed according to the methodology described by Ghasemi, et al. [32], with slight modifications. The process consists of taking 30 µL of the extract, then 250 µL of distilled water are added, and then 10 µL of aluminum chloride and 10 µL of 1 M potassium acetate, and it is left incubating in the darkness for 30 min; after incubation, absorbance is read at 415 nm in a Synergy HT microplate reader (Synergy HT, Bio-Tek Instruments, Inc., Winooski, VT, USA). The content of total flavonoids is determined from a quercetin standard curve (from 0 to 0.4 mg mL−1); the results are expressed in equivalent mg of quercetin per gram of dry extract (mg QE g−1 of dry sample). Each sample was measured in triplicate (n = 3).

2.4.3. Antioxidant Capacity Methods

Inhibition of the 2,2-Diphenyl-1-Picrylhydrazyl Radical (DPPH)
This method uses the DPPH radical, which reduces its purple chromogen by the action of an antioxidant compound to hydrazine, a compound that colors a pale-yellow tone. This DPPH radical scavenging assay was carried out according to Karadag, et al. [33], for which 20 μL of the sample was placed in a 96-well flat-bottomed transparent microplate. Then, 280 μL of the DPPH radical were added and incubated for 30 min in the absence of white light. Finally, the absorbance at 515 nm was measured (Synergy HT microplate reader). A Trolox curve from 0.1 to 1 mmol TE g−1 was used to calculate the results, which are expressed as mmol Trolox equivalent per gram of powder (mmol TE g−1). Each sample was measured in triplicate (n = 3).
Trolox Equivalent Antioxidant Capacity (TEAC)
The antioxidant capacity by the TEAC assay of the encapsulated sample was determined as described by Thaipong, et al. [34]. ABTS was dissolved in distilled water at a concentration of 7.4 mM (stock solution). The ABTS•+ radical was produced by mixing the ABTS stock solution with 2.6 mM potassium persulfate (1:1 v/v) and incubating the mixture in the dark at 25 °C for 12–16 h before use. Subsequently, the reaction solution was prepared by taking 100 μL of the radical and dissolving in 2900 μL of solvent to adjust the absorbance. For the assay, aliquots of 15 μL of extract and 285 μL of the reaction solution were added and homogenized using a vortex. Subsequently, it was incubated in the darkness for 2 h. After the time elapsed, the absorbance at 734 nm was read in a Synergy HT microplate using transparent 96-well flat-bottom plates. The reaction solution was taken as a blank. A Trolox curve from 0.1 to 1 mmol TE g−1 was used to calculate the results, which are expressed as mmol Trolox equivalent per gram of powder (mmol TE g−1). Each sample was measured in triplicate (n = 3).

2.5. Identification of Phenolic Compounds by Ultra High-Resolution Liquid Chromatography/Mass Spectrometry (UPLC/MS)

Mass-liquid chromatography was used to carry out the separation for the identification of individual phenolic compounds from unencapsulated oregano extract. The analysis was performed in a class H UPLC unit (Waters Corporation, Milford, MA, USA) coupled to a G2-XS QT of mass analyzer (quadrupole and time of flight). The separation of phenolic acids was performed with a UPLC BEH C18 column (1.7 μm × 2.1 mm × 100 mm) at 40 °C, with gradient elution solution A (water-0.1% formic acid) and solution B (methanol), which is supplied at a flow rate of 0.3 mL min−1. On the other hand, the separation of flavonoids was performed with a different set of conditions, including a UPLC BEH C18 column (1.7 μm × 2.1 mm × 100 mm) at 30 °C, with gradient elution solution A (water-0.05% formic acid) and solution B (acetonitrile), which is supplied at a flow rate of 0.3 mL min−1. The ionization of the compounds was performed by electrospray (ESI), and the parameters used consisted of a capillary voltage of 1.5 kV, sampling cone: 30 V, desolvation gas of 800 (L h−1), and a temperature of 500 °C. A collision ramp of 0–30 V was used. The Massbank of North America (MoNA) database was used for compound identification. The identification of phenolic compounds by UPLC was performed in duplicate (n = 2).

2.6. Synthesis of Chitosan-Block-Poly(PEGMA)

The methodology for the synthesis of CS-b-PPEGMA blocks was carried out as published by Ganji and Abdekhodaie [35], with slight modifications. Briefly, the preparation was done using conventional free radical polymerization with a weight ratio of 50:50 CS:PEGMA and 0.01 M free radical initiator (KPS). CS (0.5 g), PEGMA (0.46 mL, 0.5 g), KPS (0.135 g, 0.01 M), an inert atmosphere (N2) in a three-necked flask with a magnetic stir bar, and 50 mL of water containing 1% (v/v) acetic acid were used. First, CS and initiator (KPS) were added followed by stirring for 30 min at 60 °C using an oil bath, and then the PEGMA2000 was added dropwise, and the reaction was stirred (350 rpm) for 6 h. After the reaction time, the flask was removed from the oil bath and placed in a cold-water bath. For the purification of the solution, NaOH 4M was first added to the solution to precipitate the CS; next, the product was filtered and subsequently washed with acetone to remove the residual PEGMA2000. Finally, the sample was dialyzed for 48 h, with changes of water periodically; after that, the recovered sample was lyophilized and weighed to determine the yield of the reaction, resulting around 70%. Chitosan-b-PPEGMA; 1H-NMR (400 MHz, CDCl3, δ, ppm): 4.00–4.30 (HOCH2CH2OCHCH2OH of the polysaccharide ring of Chitosan), 3.87 (CH2CH2O of the PEG chain), 5.13 (CHNH of acetylglucosamine ring), 3.50 (CHNH2 of glucosamine ring), 2.29 (CH2 aliphatic from the CS backbone).

2.7. Preparation of Nanometric Polymer Aggregates

The copolymer aggregates were prepared through a direct dissolution consisting of the solubilization of the bulk copolymer CS-b-PPEGMA (10 mg) in distilled water (10 mL) under magnetic stirring at room temperature for 24 h. For CS, a solution of 1 wt% was prepared in 15 mL of water with 1% (v/v) of acetic acid under magnetic stirring at room temperature for 24 h.

2.8. Loading of Phenolics Compounds

The loading was performed based on a solvent evaporation method [36] and adapted from the methodology reported by Picos-Corrales, et al. [37]. Briefly, 10 mg of block copolymers were dissolved in 10 mL of distilled water, and 1.5 mg of phenolic compounds were dissolved in 5 mL of ethanol. The phenolic compounds (PPHs) solution was added dropwise into the polymer solution and left under magnetic stirring for 24 h. The phenolic compounds that were not loaded were removed by centrifugation for 20 min. The purified material was filtered using a disc filter with a pore size of 1 µM and then frozen and freeze-dried. The mass of phenolic compounds loaded in the CS and block copolymers was determined by preparing a 0.3 mg mL−1 solution in PBS pH 2, measuring the absorbance by UV analysis at a wavelength (λmax) of 280 nm, and then quantified by using a calibration curve of phenolic compounds in PBS pH 2. The loading efficiency of phenolic compounds (LE) and the loaded PPHs content (LC) were calculated using Equations (1) and (2).
LE(%) = (mass of PPHs in polymer/mass of PPHs in loading solution) × 100
LC(%) = (mass of PPHs in polymers/mass of dry polymer) × 100

2.9. Measurements

Hydrogen nuclear magnetic resonance (1H-NMR) spectra were collected on a Bruker AMX-400 (Bruker Corporation, Billerica, MA, USA) (400 MHz) spectrometer and reported in ppm using tetramethylsilane (TMS) as the NMR reference standard. The solvent used was deuterium chloride (37%), D2O + DCl, for all samples.
Thermogravimetric analysis (TGA) was performed on a TA-Instruments Discovery-TGA equipment (TA-Instruments, New Castle, DE, USA). Measurements were performed for cationic matrixes and phenolic compounds loaded by heating under nitrogen flow from room temperature up to 600 °C using a heating rate of 10 °C min−1.
Differential Scanning Calorimetry (DSC) was performed on a TA Instrument DSC2000, New Castle, DE, USA). Measurements were performed for cationic matrixes and were used to determine the melting point (Tm), the glass transition temperature (Tg) and thermal decomposition temperatures (Td). For measurements, samples were cooled to −10 °C; maintained isothermally for 5 min, and afterward heated with modulation (±0.5 °C every 60 s) at a rate of 5 °C min−1 to 375 °C in a nitrogen atmosphere using. Two cycles of measurement were run, and the results reported corresponded to the second cycle.
Dynamic light scattering (DLS) measurements were carried out on 1.0 mg mL−1 block copolymer and 1 wt% of CS solutions at 25 °C using a Malvern Instruments Nano-ZS Nanosizer (ZEN 3690) (Malvern, Worcestershire, UK) equipment. The instrument is equipped with a helium-neon laser (633 nm) with size detection between 0.6 nm and 5 μm. DLS experiments were performed at the scattering angle of 90°, and the distribution of sizes was calculated using Malvern Instruments dispersion technology software, based on CONTIN analysis and Stokes-Einstein equation for spheres as usual.
UV–Vis spectra of Phenolics Compounds (PPHs) dispersions for the measurement were acquired using a UV-Vis Varian Cary 100 spectrophotometer system (Agilent Technologies, Santa Clara, CA, USA) at room temperature from aqueous dispersion.
The Zeta potential (ζ) of PPHs and PPHs-loaded polymeric matrixes dispersions (at 1 mg mL−1) was measured using a Malvern ZetaSizer Nano ZS instrument (Malvern, Worcestershire, UK). The measurements were the average of three runs performed at 25 °C and distilled water.

2.10. In Vitro Release Studies

For release profile studies, 0.3 mg mL−1 of PPHs-loaded polymeric matrixes were dispersed in 10 mL of distilled water (pH ~5 for CS-b-PPEGMA@PPHs) or aqueous acetic acid solution (1% v/v) (pH ~4.5 for CS@PPHs) and then added to a dialysis tube (Spectra/Por® MWCO: 12–14 KDa, diameter 10 mm, Spectrum, Los Angeles, CA, USA). The dialysis tube was introduced into a 100 mL release medium, with mixture of 30% ethanol and 70% PBS inside an Erlenmeyer flask. The flask was placed in a shaking bath (Shel Lab, model SWBR17, Sheldon Manufacturing, Inc., Cornelius, OR, USA), operating at 37 °C and a shaking speed of 100 rpm. Medium aliquots of 2 mL were taken out at different times and replaced by 2 mL of fresh PBS at every sampling point. The released fraction of phenolic compounds was calculated from UV measurements at λmax = 280 nm and 320 nm depending on the pH of the release medium and was then quantified using a calibration curve of phenolics compound in PBS.

2.11. In Vitro Gastrointestinal Digestion

A simulation of gastrointestinal digestion was performed according to the static in-vitro digestion method reported by Brodkorb, et al. [38]. This standardized procedure simulates the physiological conditions in the mouth, stomach, and small intestine, mimicking the chemical and pH conditions. Briefly, 1 mg of sample was mixed with simulated salivary fluids (SSF), then pH was adjusted to pH 7 with 6M NaOH; after that, the mixture was incubated for 5 min at 37 °C. Then, 1 mL of simulated gastric fluids (SGF), pH was adjusted to pH 3 and incubated for 2 h at 37 °C. Finally, 2 mL of simulated intestinal fluids (SIF) were added, pH was adjusted to pH 7, and the mixture was incubated for 2 h at 37 °C. In the final digestion step, the samples were centrifuged (9390× g at 4 °C for min), and the supernatant was collected and freeze-dried. After that, samples were resuspended in ethanol for antioxidant capacity assays.

3. Results and Discussion

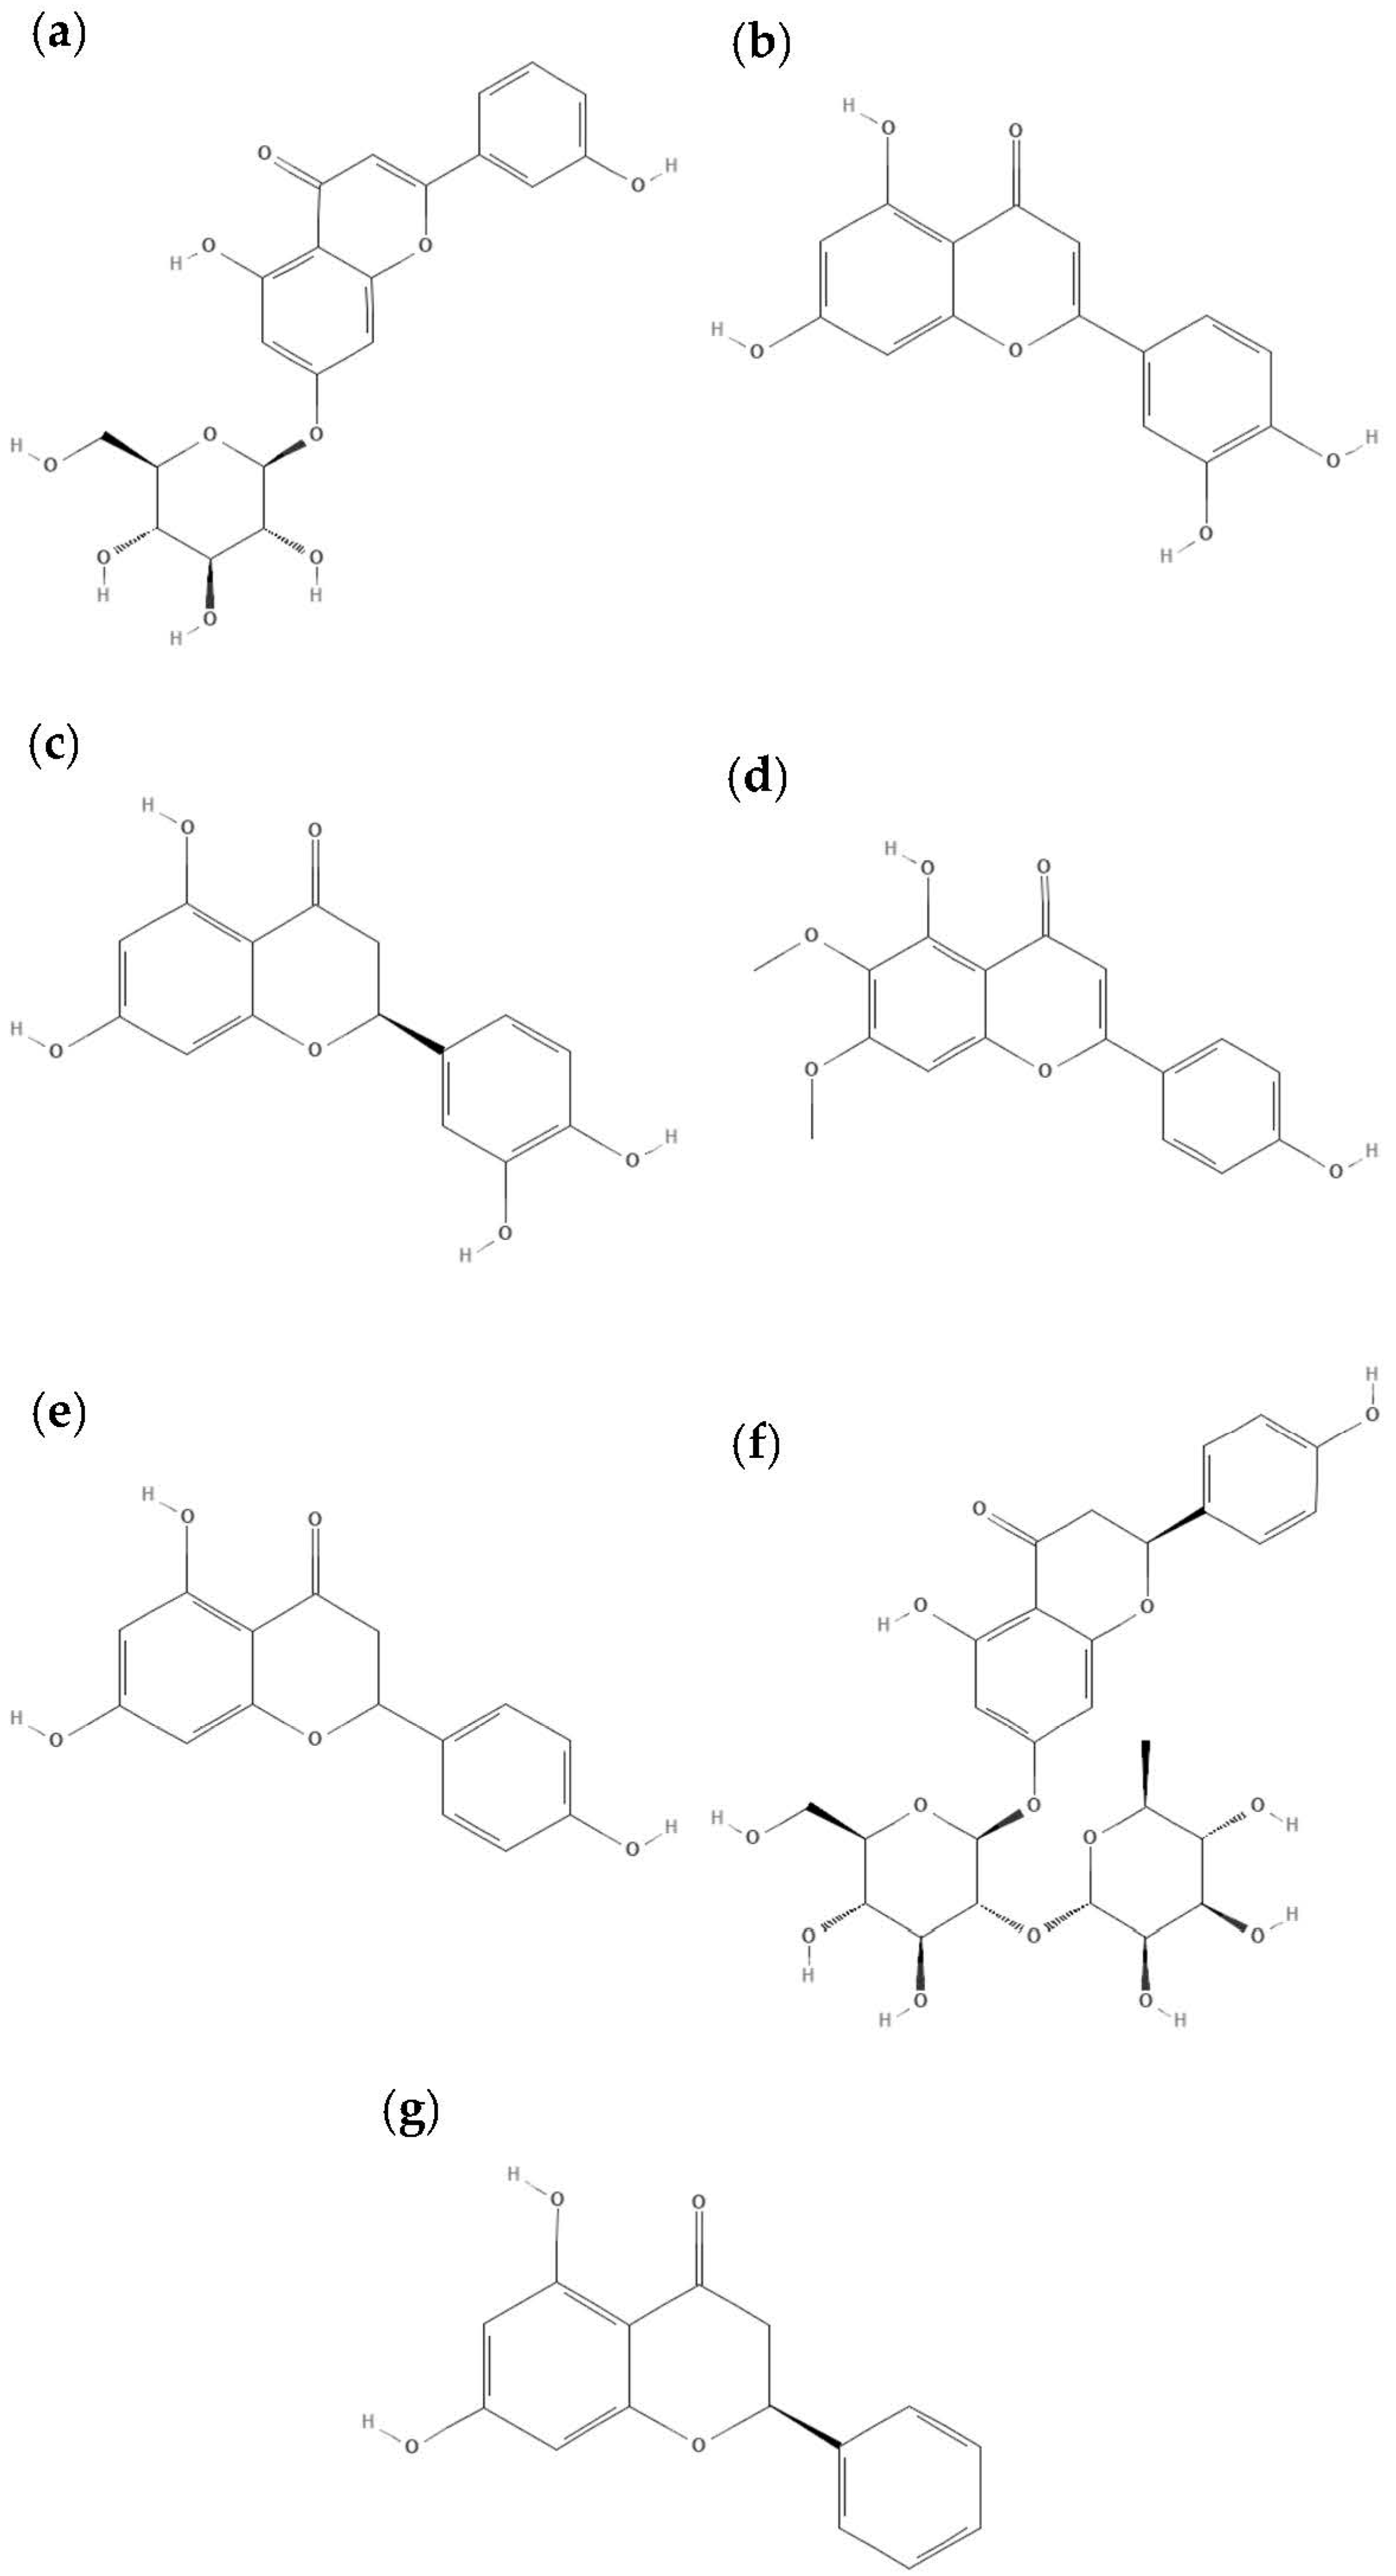
3.1. Characterization of the Phenolic Compounds Present in L. graveolens

The results obtained from the nutraceutical characterization of the phenolic compounds in L. graveolens obtained by maceration in ethanol are found in Table 1, where the extracted compounds show antioxidant capacity. It can be seen that the extracted compounds have antioxidant activity against the different free-radical DPPH, AAPH, and ABTS. Comparing our results with the literature (TRC, 51.26 ± 2.36 mg EAG g−1; TFC, 11.80 ± 0.12 mg QE g−1; DPPH, 500.54 ± 9.63 µmol TE g−1; ORAC, 812.31 ± 35.46 µmol TE g−1; and ABTS, 350.07 ± 0.45 µmol TE g−1) [9], it was observed that the TRC of both extracts is very similar, showing differences mainly in the TFC where a lower value was registered with the extraction in absolute ethanol. Cortes-Chitala, et al. [39], reported that the TRC of the L. graveolens was around 99.71 mg AGE g−1 dried weight; the higher reducing activity might be mainly because they used ethanol:water (58:42) as a solvent for extraction, plus the region where the sample was taken is different [39].

Characterization by UPLC-MS

The L. graveolens ethanolic extract was characterized by UPLC-MS, where it was possible to observe that the sample had a diversity of flavonoids and some phenolic acids (Table 2). Some of the identified compounds are flavones such as luteolin-glycoside, cosmoside, eriodictyol, and cirsimaritin; others are flavanones such as naringin, naringenin, and pinocembrin (Figure 2). The phenolic profile in this study is consistent with previous studies in L. graveolens extracts [9,39,40]. However, the distribution and content of phenolic content in our study could be different, owing to factors such as recollection time and the extraction method used for phenolic recovery. Moreover, in previous studies, the most abundant phenolics in methanolic extracts were naringenin, kaempferol-glucoside, kaempferide, caffeic acid, cirsimaritin, kaempferol, and taxifolin; most of these molecules were also found in our extracts. These metabolites have been associated with anti-inflammatory, antiapoptotic, and antimicrobial activity [4,39,41].

3.2. Synthesis and Characterization of Cationic Matrixes
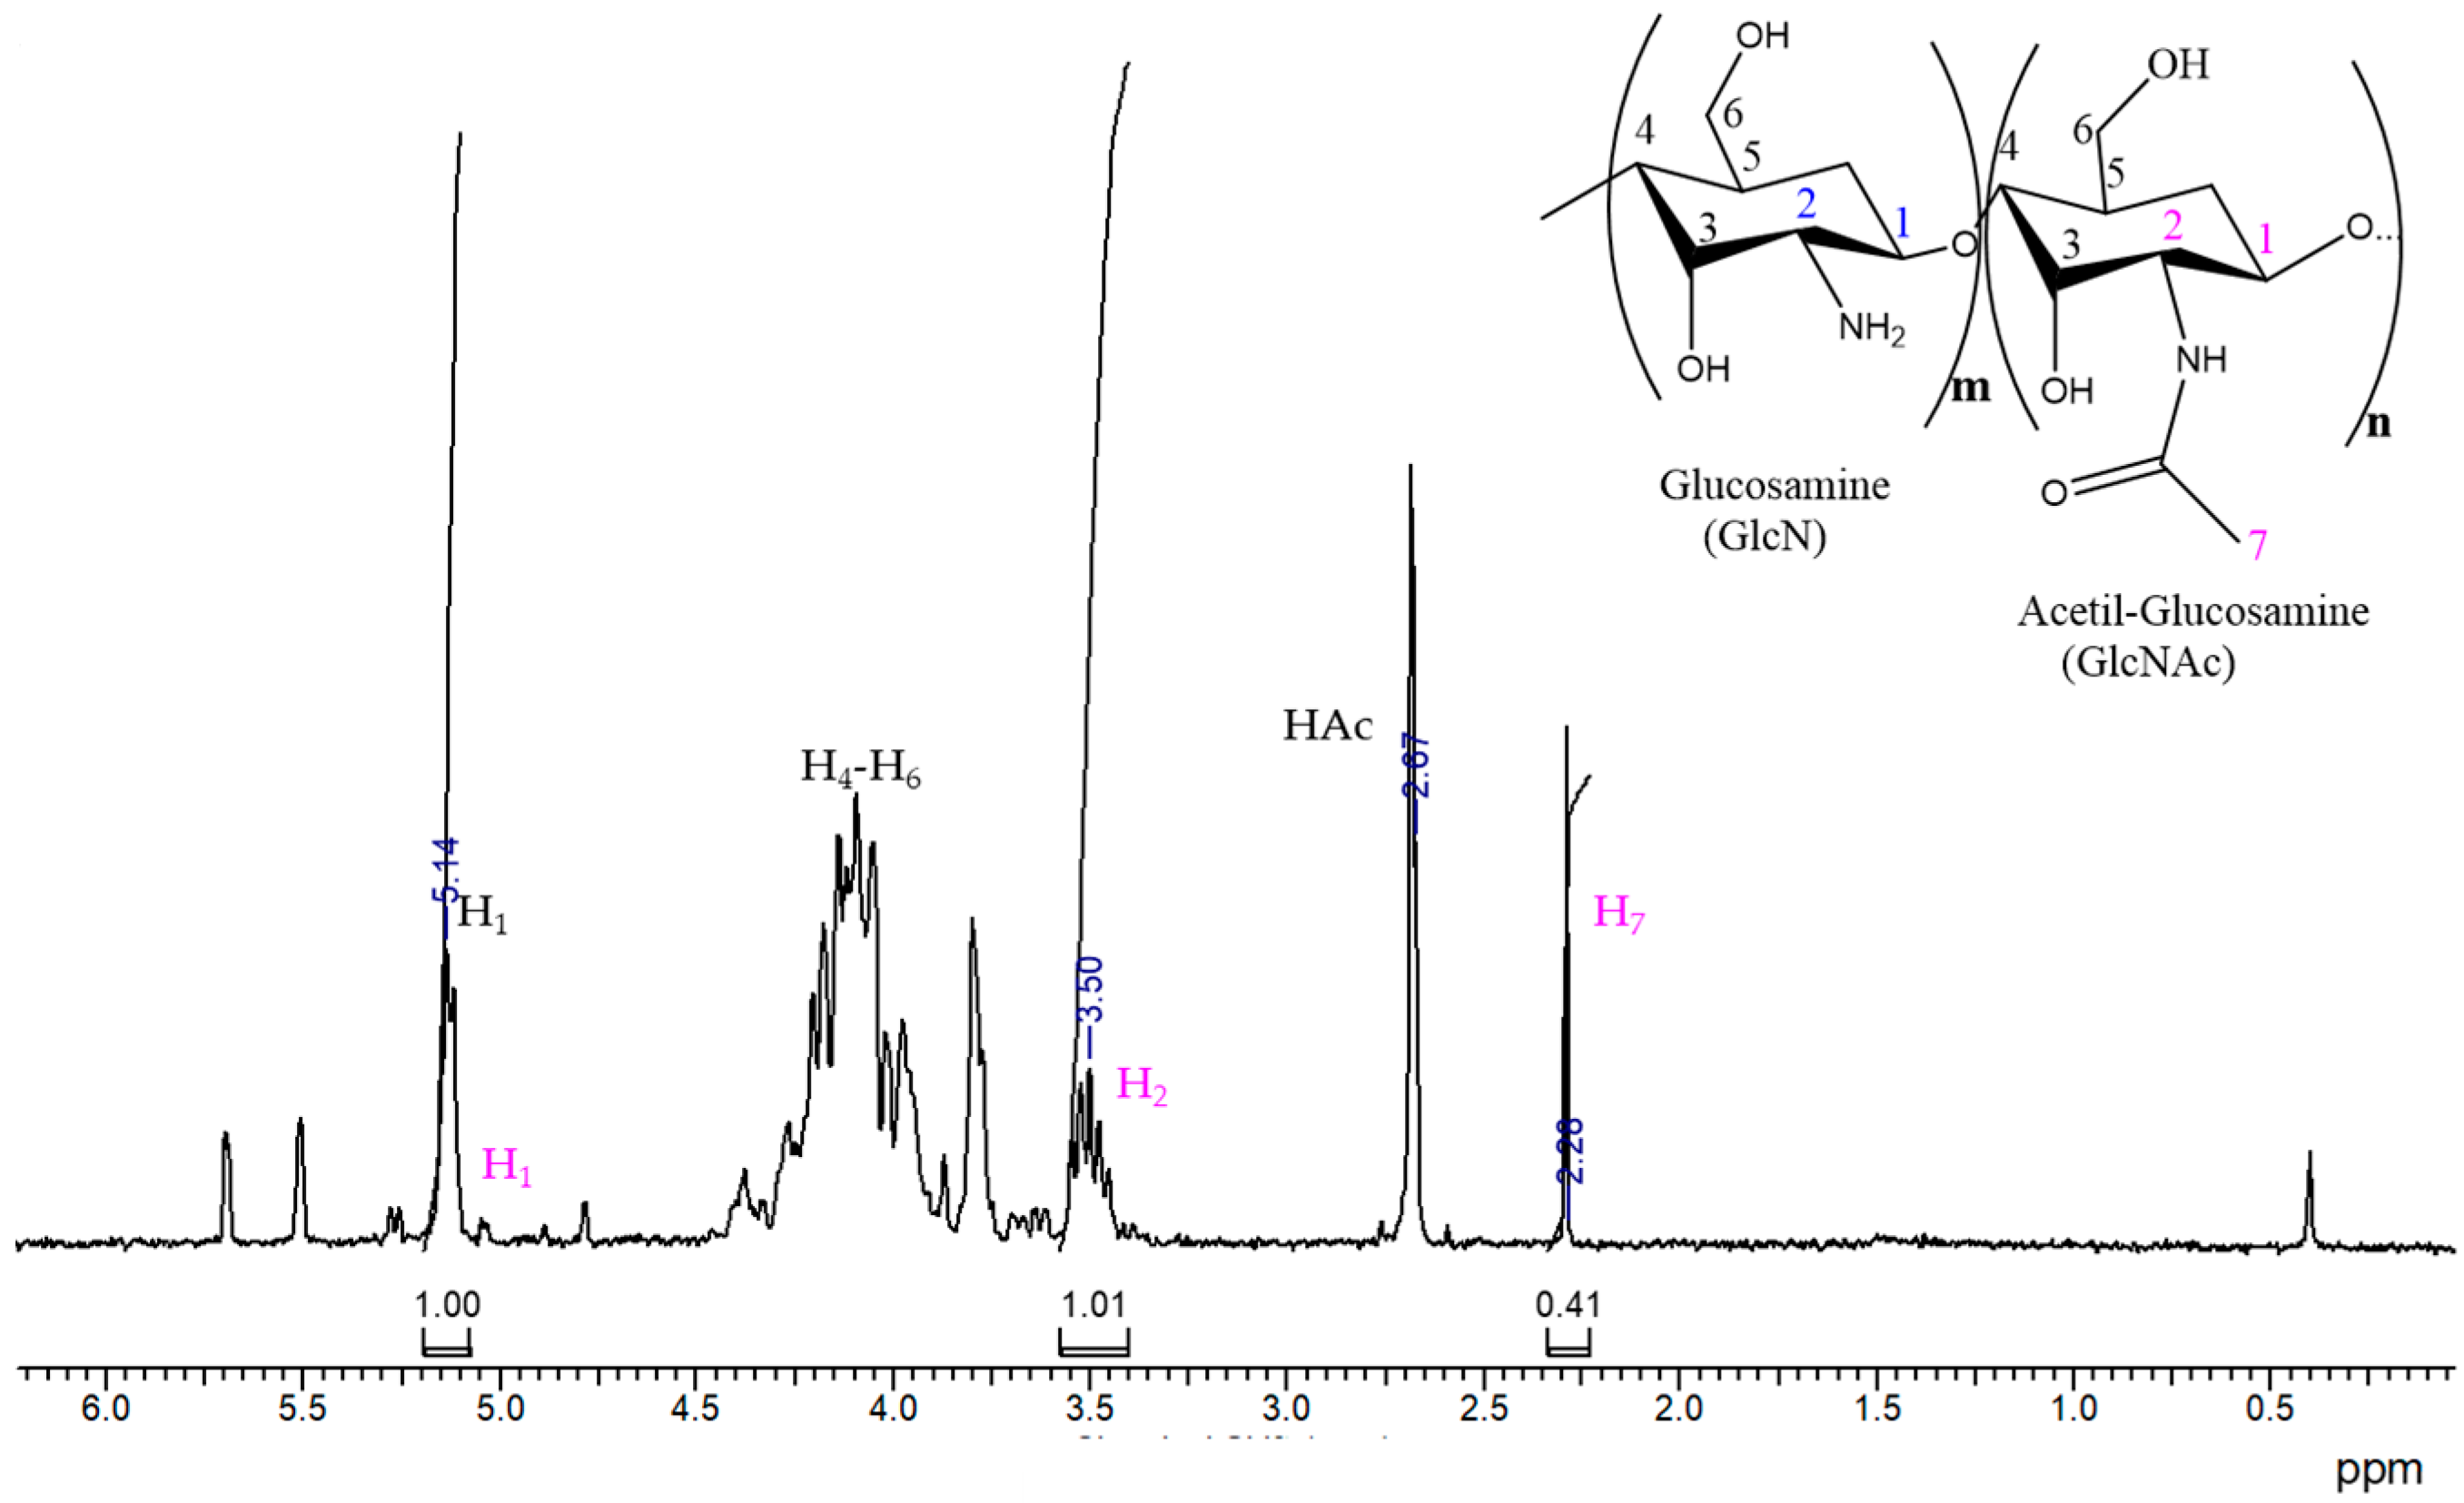
3.2.1. Chitosan

After performing the purification of CS by precipitation in aqueous medium, it was characterized by 1H-NMR (Figure 3). The assignment of the hydrogens corresponding to CS, which is a polysaccharide containing units of glucosamine (GlcN) and acetyl-glucosamine (GlcNAc), is the following: at 2.36 ppm, the signal corresponds to the hydrogens of the methyl group of the acetyl-glucosamine units (H7); a signal with an intensity of around 2.67 ppm can also be observed, which corresponds to the signal of residual acetic acid (HAc), which comes from the purification of CS and was difficult to remove completely. Around 3.5 ppm, a multiplet is observed, and the signal is associated to the alpha hydrogen signal to the amino group of the repeating unit of GlcN (H2); the signals located between 3.55 and 4.5 ppm correspond to the hydrogens from the polysaccharide ring (H3-H6); and the signal at 5.14 ppm corresponds to the H1 of the repetitive unit of glucosamine [42].
The degree of deacetylation (DD) of CS was calculated with Equation (3), using the integrations under the curve of the signal of H1 (GlcN) and H7 (GlcNAc), which gave us an 88% deacetylation degree of CS.
After obtaining the intrinsic viscosity, the viscosity-average molecular weight was calculated using the Mark–Houwink–Sakurada constants, with K and a being 2.14 × 10⁻³ mL g−1 and 0.657, respectively [43]. As a result, the viscosimetric molecular weight obtained was 114 KDa, classified as relatively low molecular weight, which is suitable for using CS as a nanocarrier of different drugs.
D D = { ( H 1 ( G l c N ) H 1 ( G l c N ) + H 7 ( G l c N A c ) 3 ) × 100 }

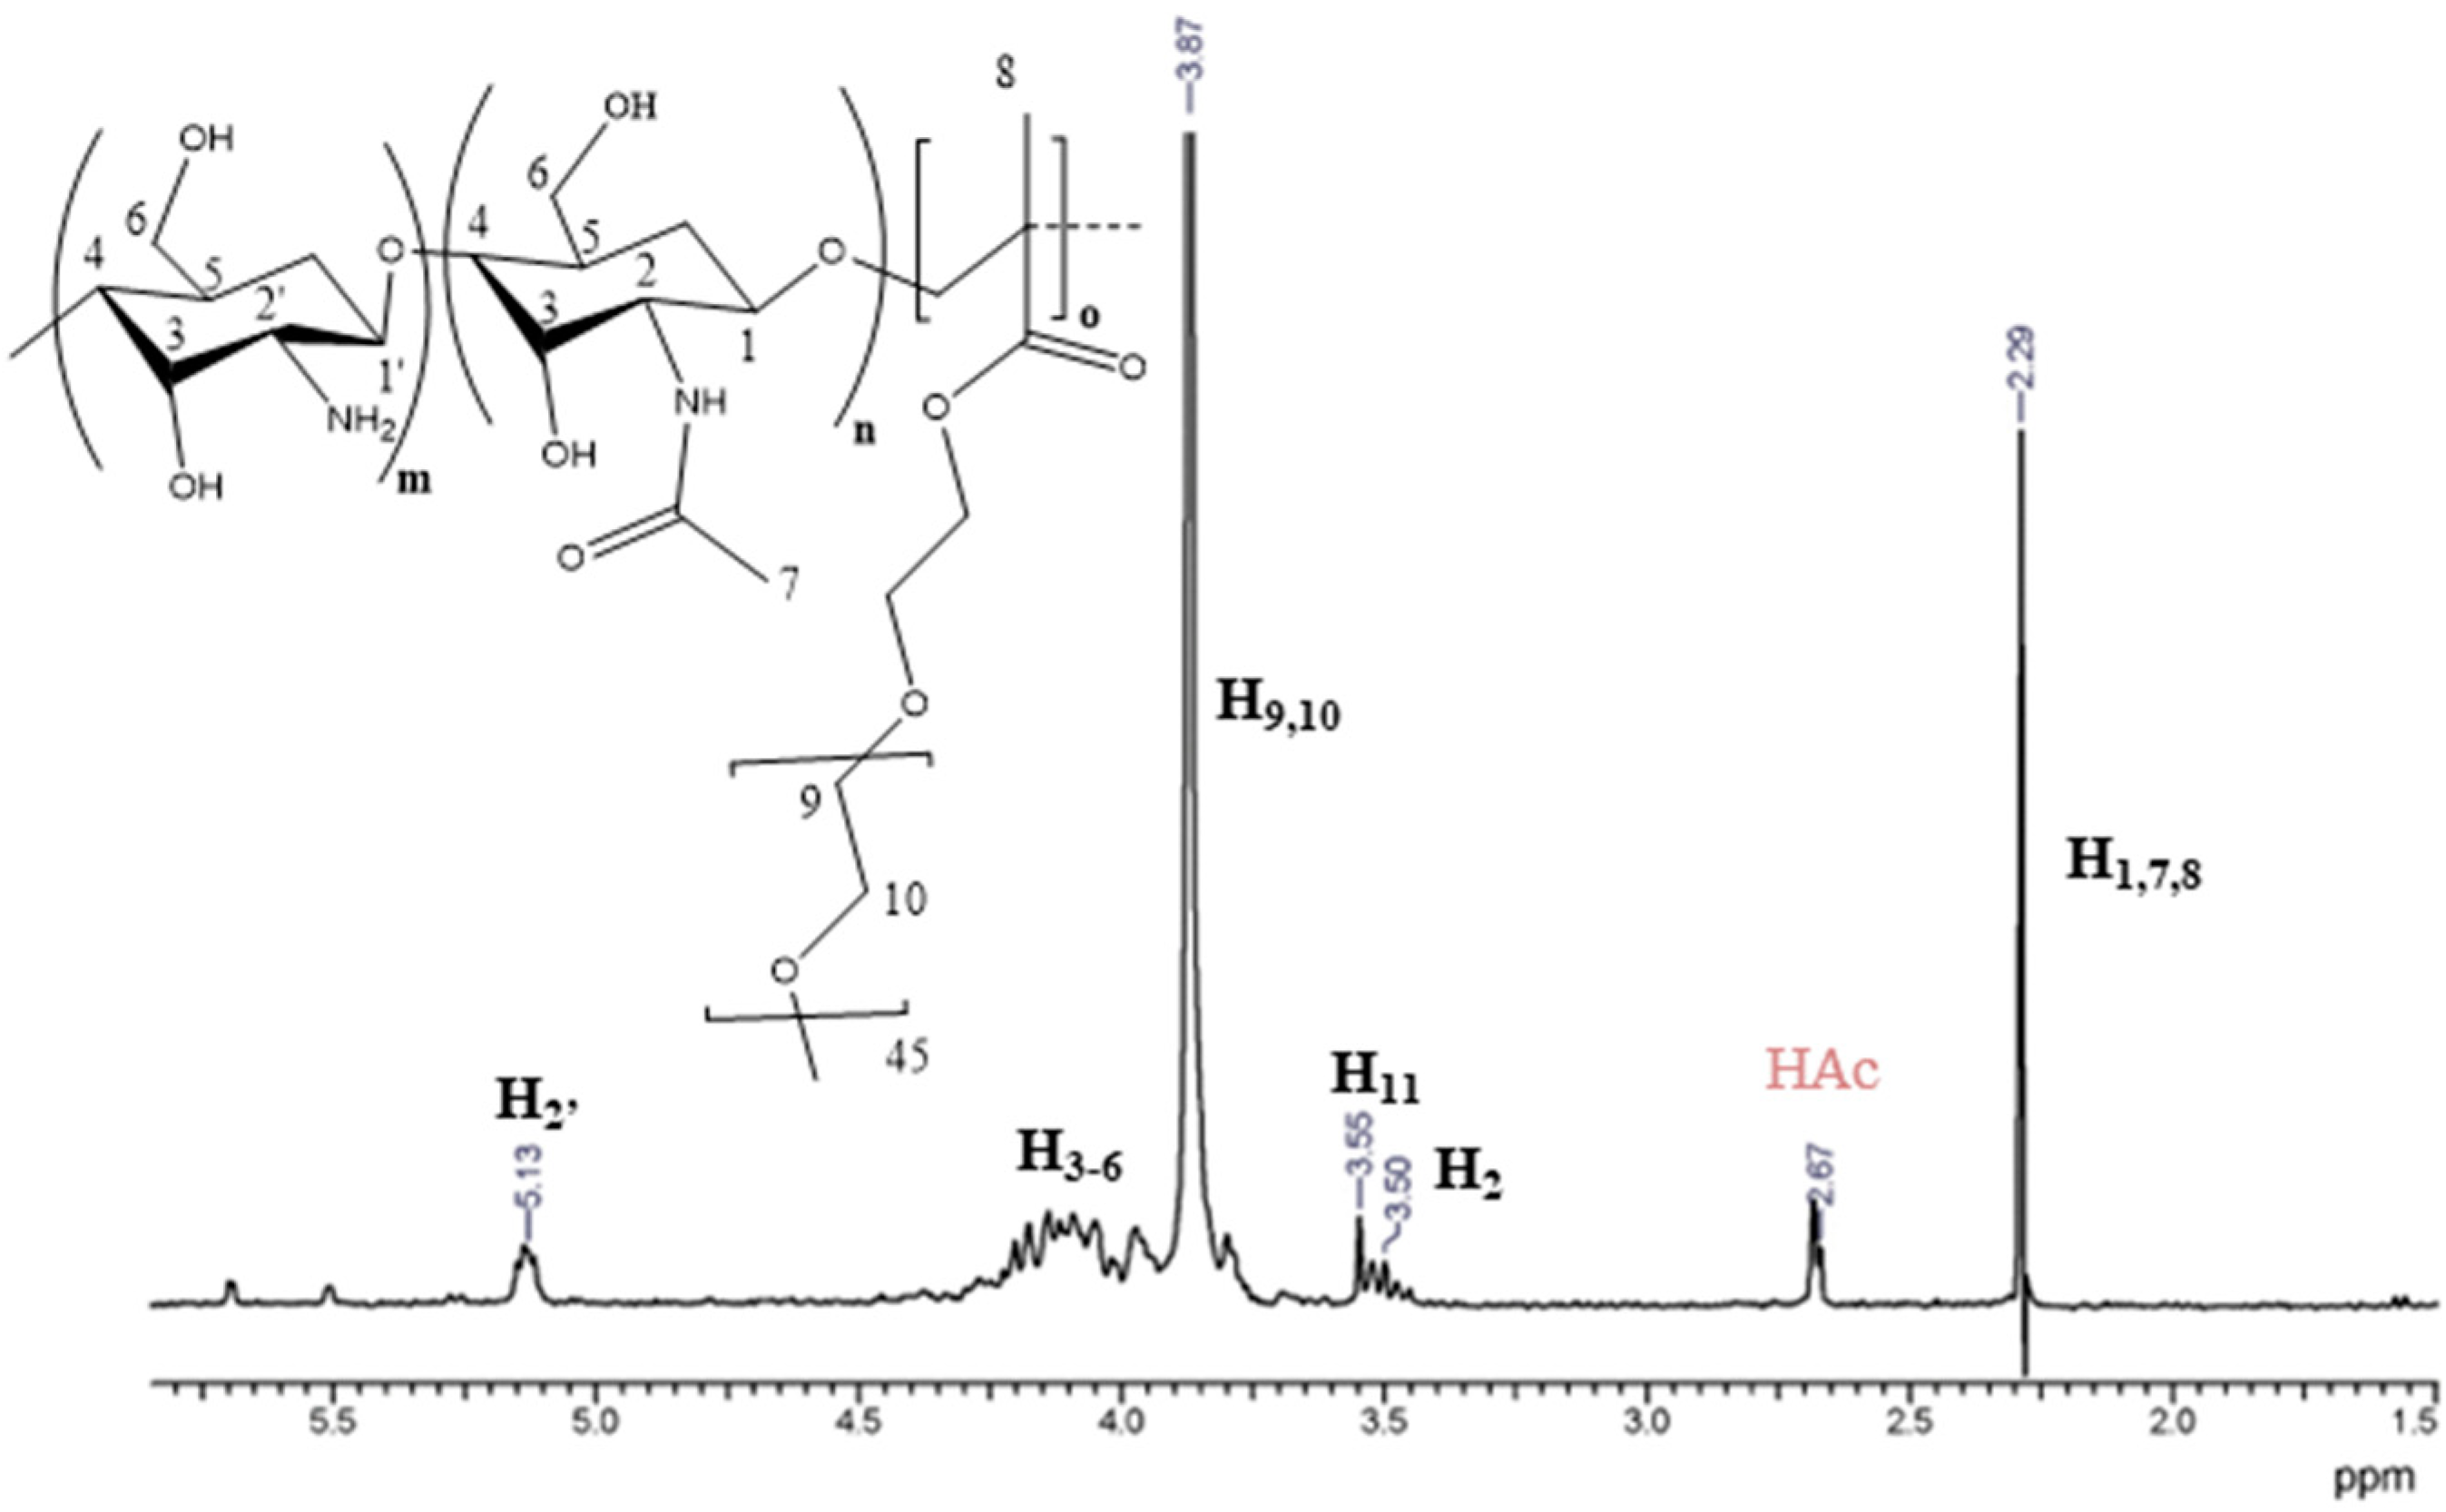
3.2.2. Chitosan-b-PPEGMA

The block copolymer based on CS and PEGMA2000, was prepared following the methodology reported by Ganji and Abdekhodaie [35] applying some modifications. The product was characterized by 1H-NMR (Figure 4). In the spectrum, the intense signal can be highlighted at 3.87 ppm that corresponds to the hydrogens (H9 and H10) of the repetitive ethoxy units in PEGMA2000; and the signal of lower intensity at 3.55 ppm (H11) corresponds to the hydrogen of methylene bound to oxygen at the end of the PPEGMA chain. Besides, the signals previously described for the chitosan backbone are also observed. This analysis indicated that the synthesis of chitosan-b-poly(PEGMA2000) was successfully accomplished.
The percentage of PEGMA2000 present as polyPEGMA2000 block was determined by 1H-NMR. For that, the integration from 3.6 ppm to 4.4 ppm was related to the signal at 5.15 ppm, which turned out to be higher than 90%, which makes the copolymer very soluble in an aqueous medium. This is an important factor when using this type of biopolymer in different pharmacological applications because of its good reservoir capacity for loading different drugs. Furthermore, the average size of the CS backbone was shortened during the free-radical high-temperature synthesis; this was also determined by viscosimetry in an experiment without PEGMA2000. The results showed that the size of the polysaccharide chains decreased by more than 90%, therefore it is not surprising that the CS content in the block copolymer is much lower than expected from the synthetic recipe [44].

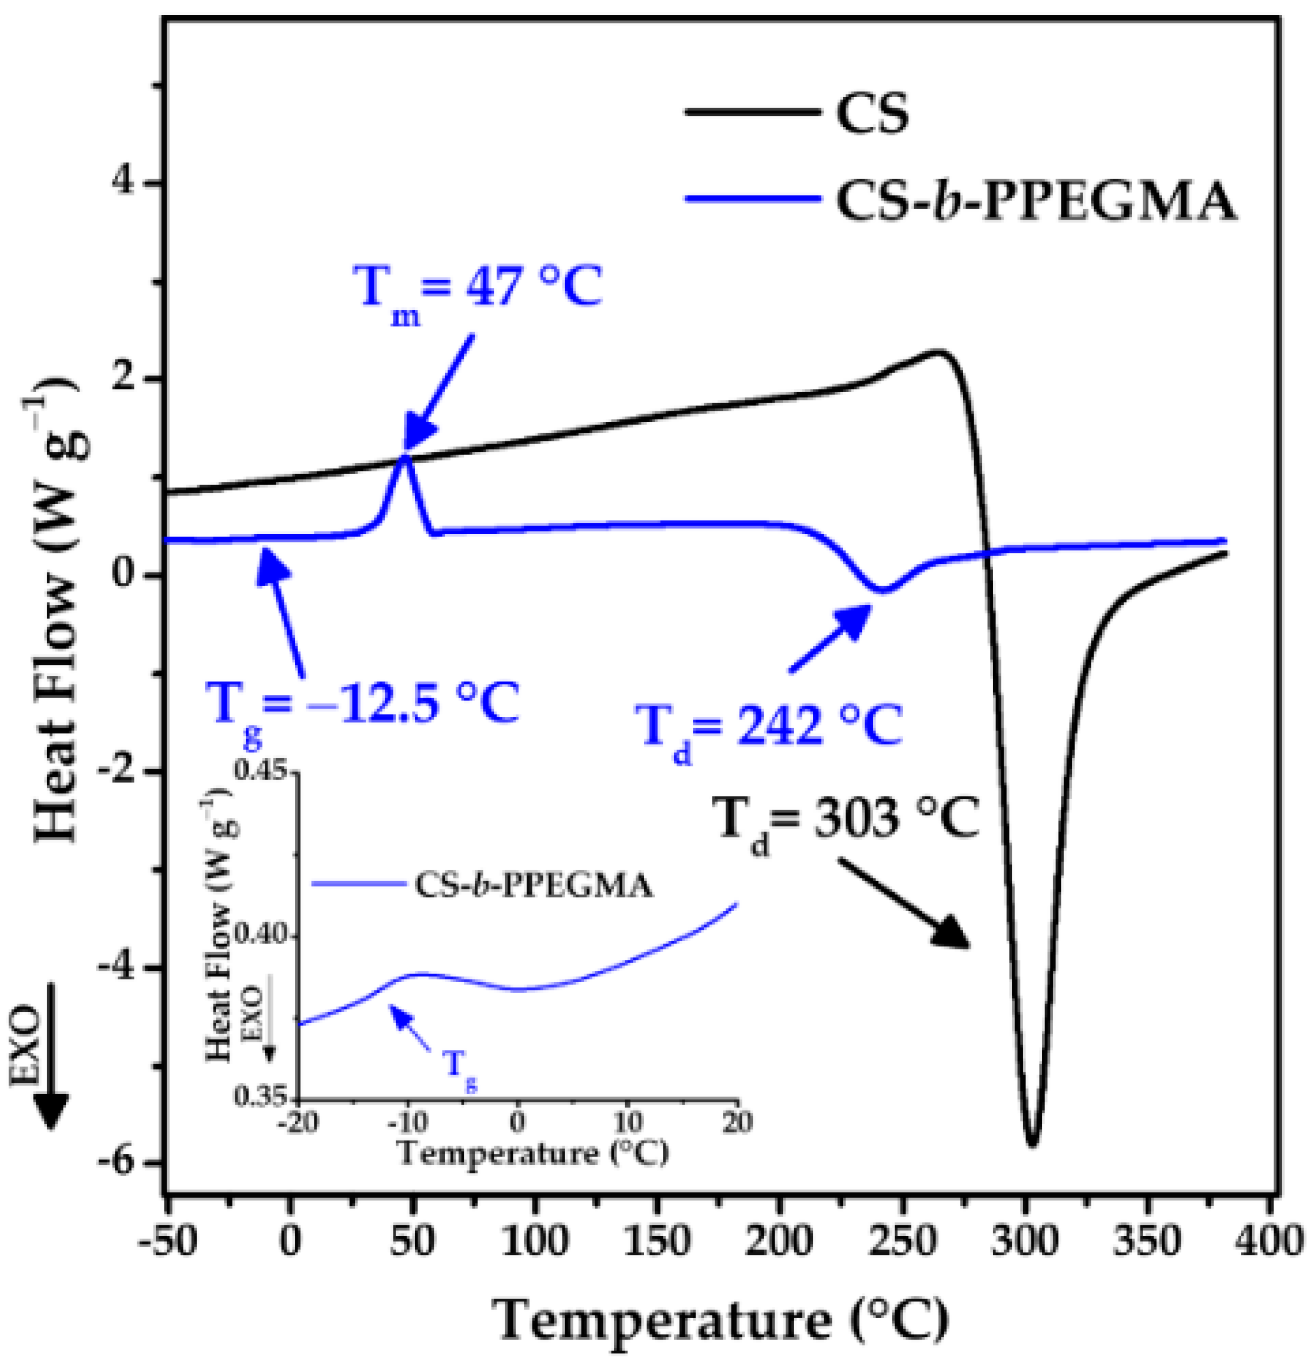
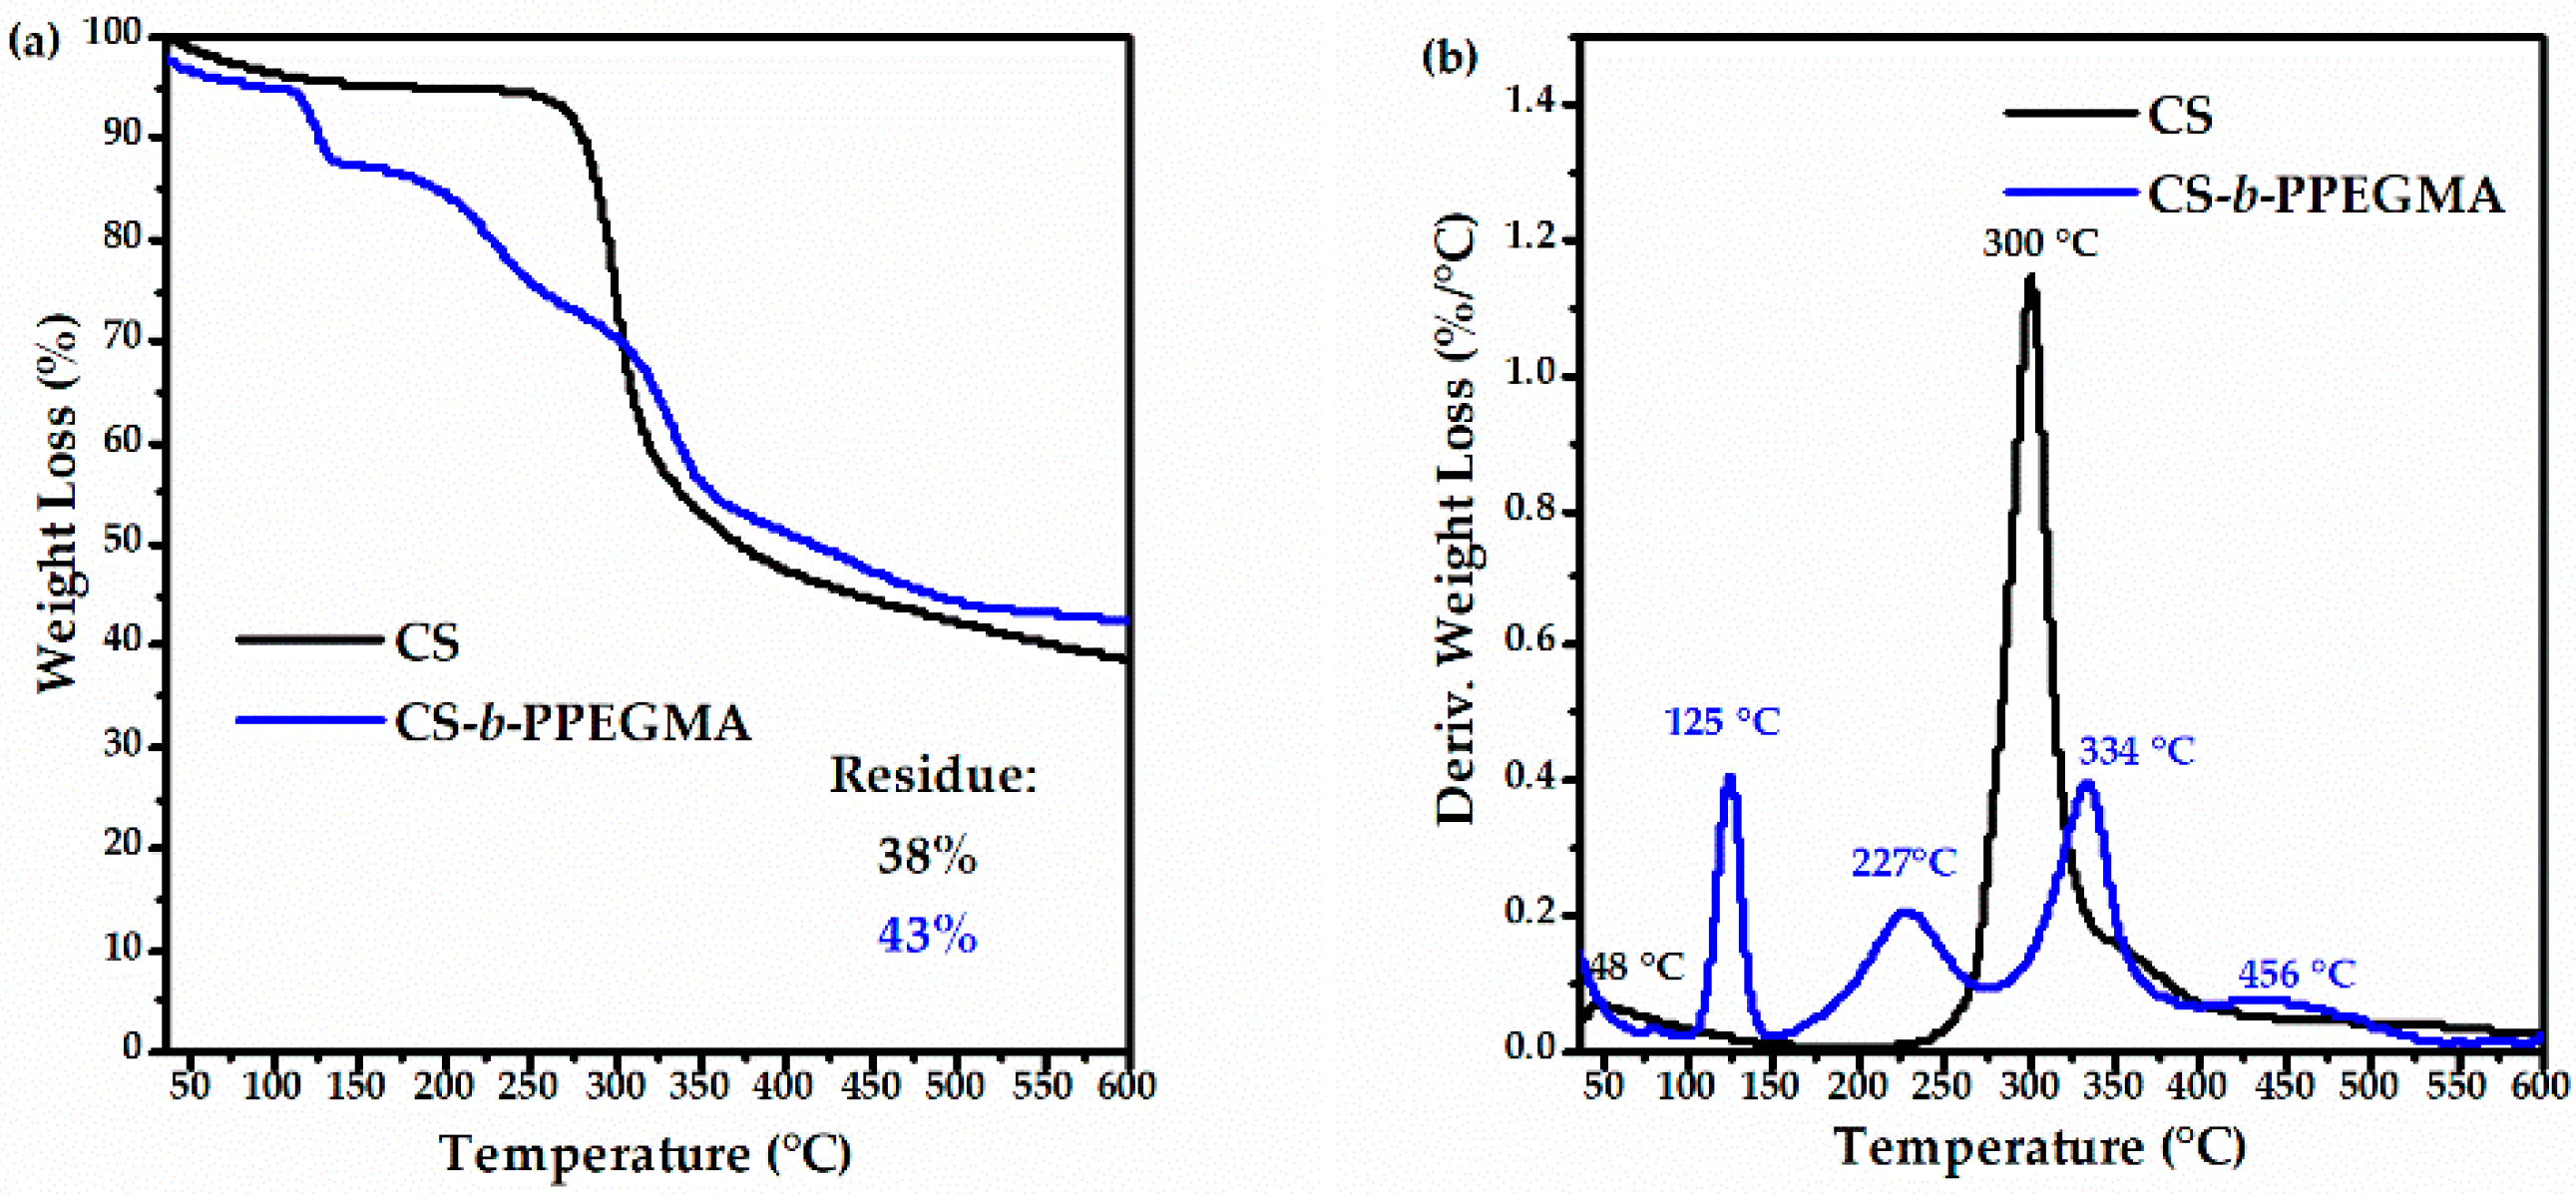
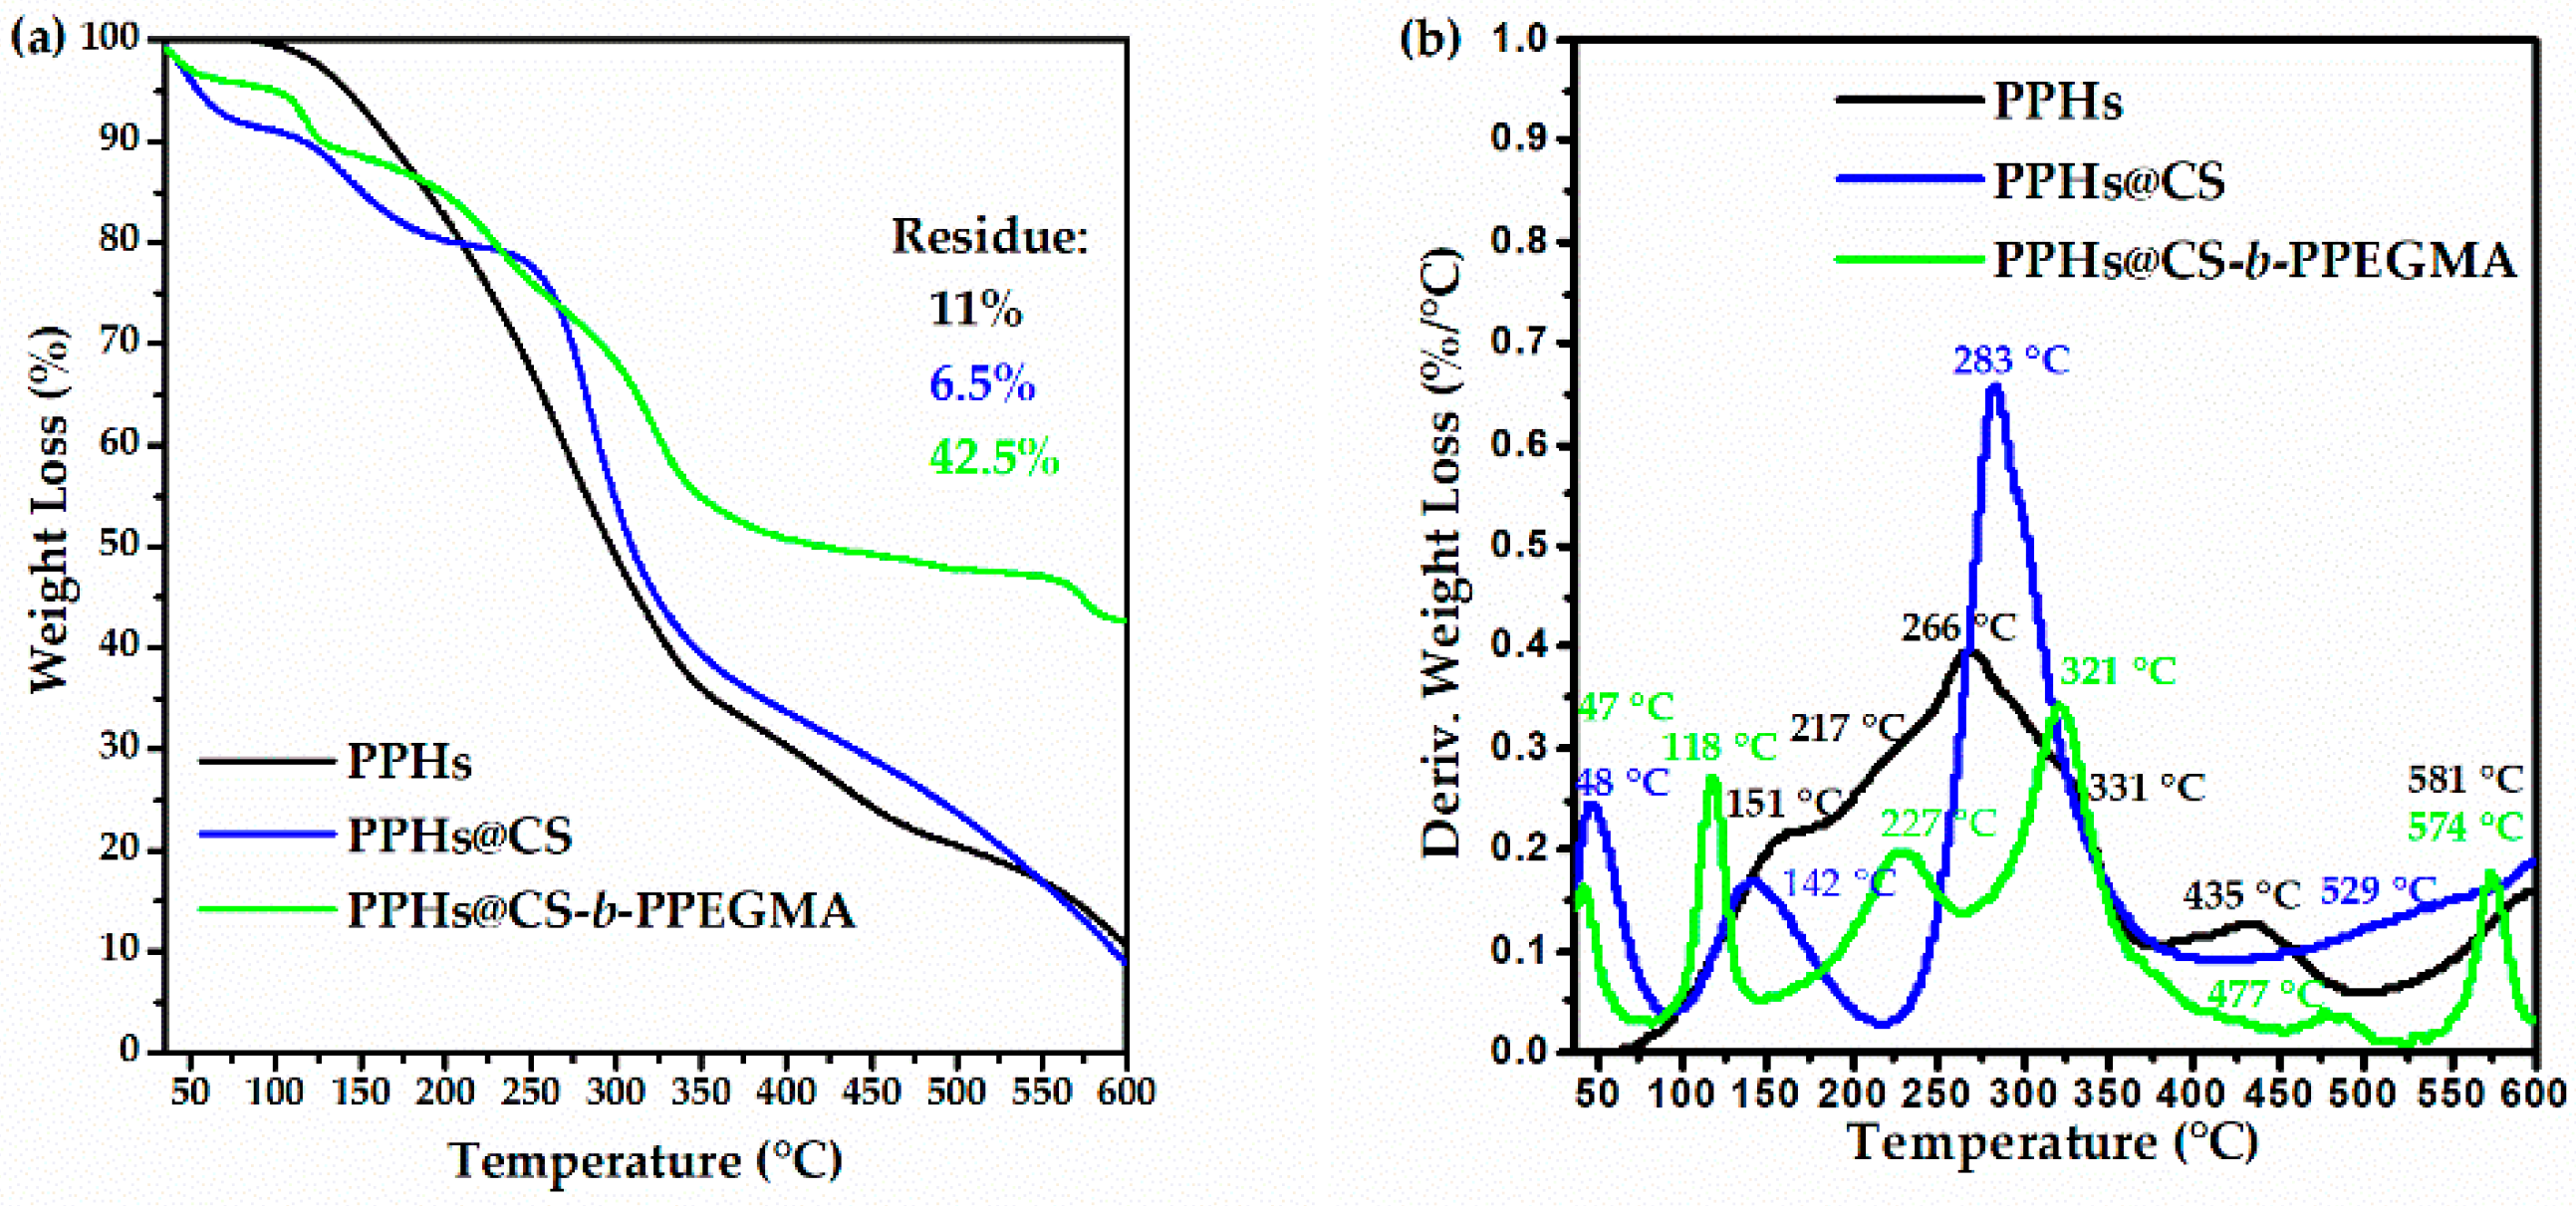
3.2.3. Thermal Characterization

A change in the structure of CS can be observed in the differential scanning calorimetry analysis (Figure 5); in the respective thermogram, only one thermal event can be observed at 303 °C, which is characteristic of the decomposition of glucosamine groups [45,46]. On the other hand, in the thermogram of the CS-b-PPEGMA blocks, two transition temperatures can be observed: the first at −12.5 °C, representing the glass transition temperature (Tg) of PEGMA2000 (an expanded view is presented), and the second at 47 °C representing the melting point (Tm) also of PEGMA2000 [35,47]; a third thermal event observed at 242 °C is related to the decomposition temperature of PEGMA and CS. The decrease in the decomposition temperature of CS could be attributed to the smaller size of the CS chain after the synthetic procedure.
Thermogravimetric analysis shows differences between both compounds, highlighting that the decomposition temperatures of CS and the CS-b-PPEGMA block copolymer are similar (Figure 6a). Figure 6b shows the decomposition of these biopolymers; in the case of CS, a single decomposition around 300 °C is shown [48]. As for the CS-b-PPEGMA block copolymer, four decomposition steps can be observed: the first one at temperatures below 100 °C, which represents the loss of moisture from the sample; at 125 °C, this first decomposition step can be attributed to the low molecular weight chains of CS that formed after breaking the backbone, the next step at 227 °C corresponds to the first decomposition of PEGMA2000, the third step at 334 °C corresponds to the decomposition of CS chains, and finally a weight loss at 456 °C, which would correspond to the second decomposition of PEGMA2000 [49,50]. In both systems, a residue of around 40% is observed, being attributed to the formation of coke.

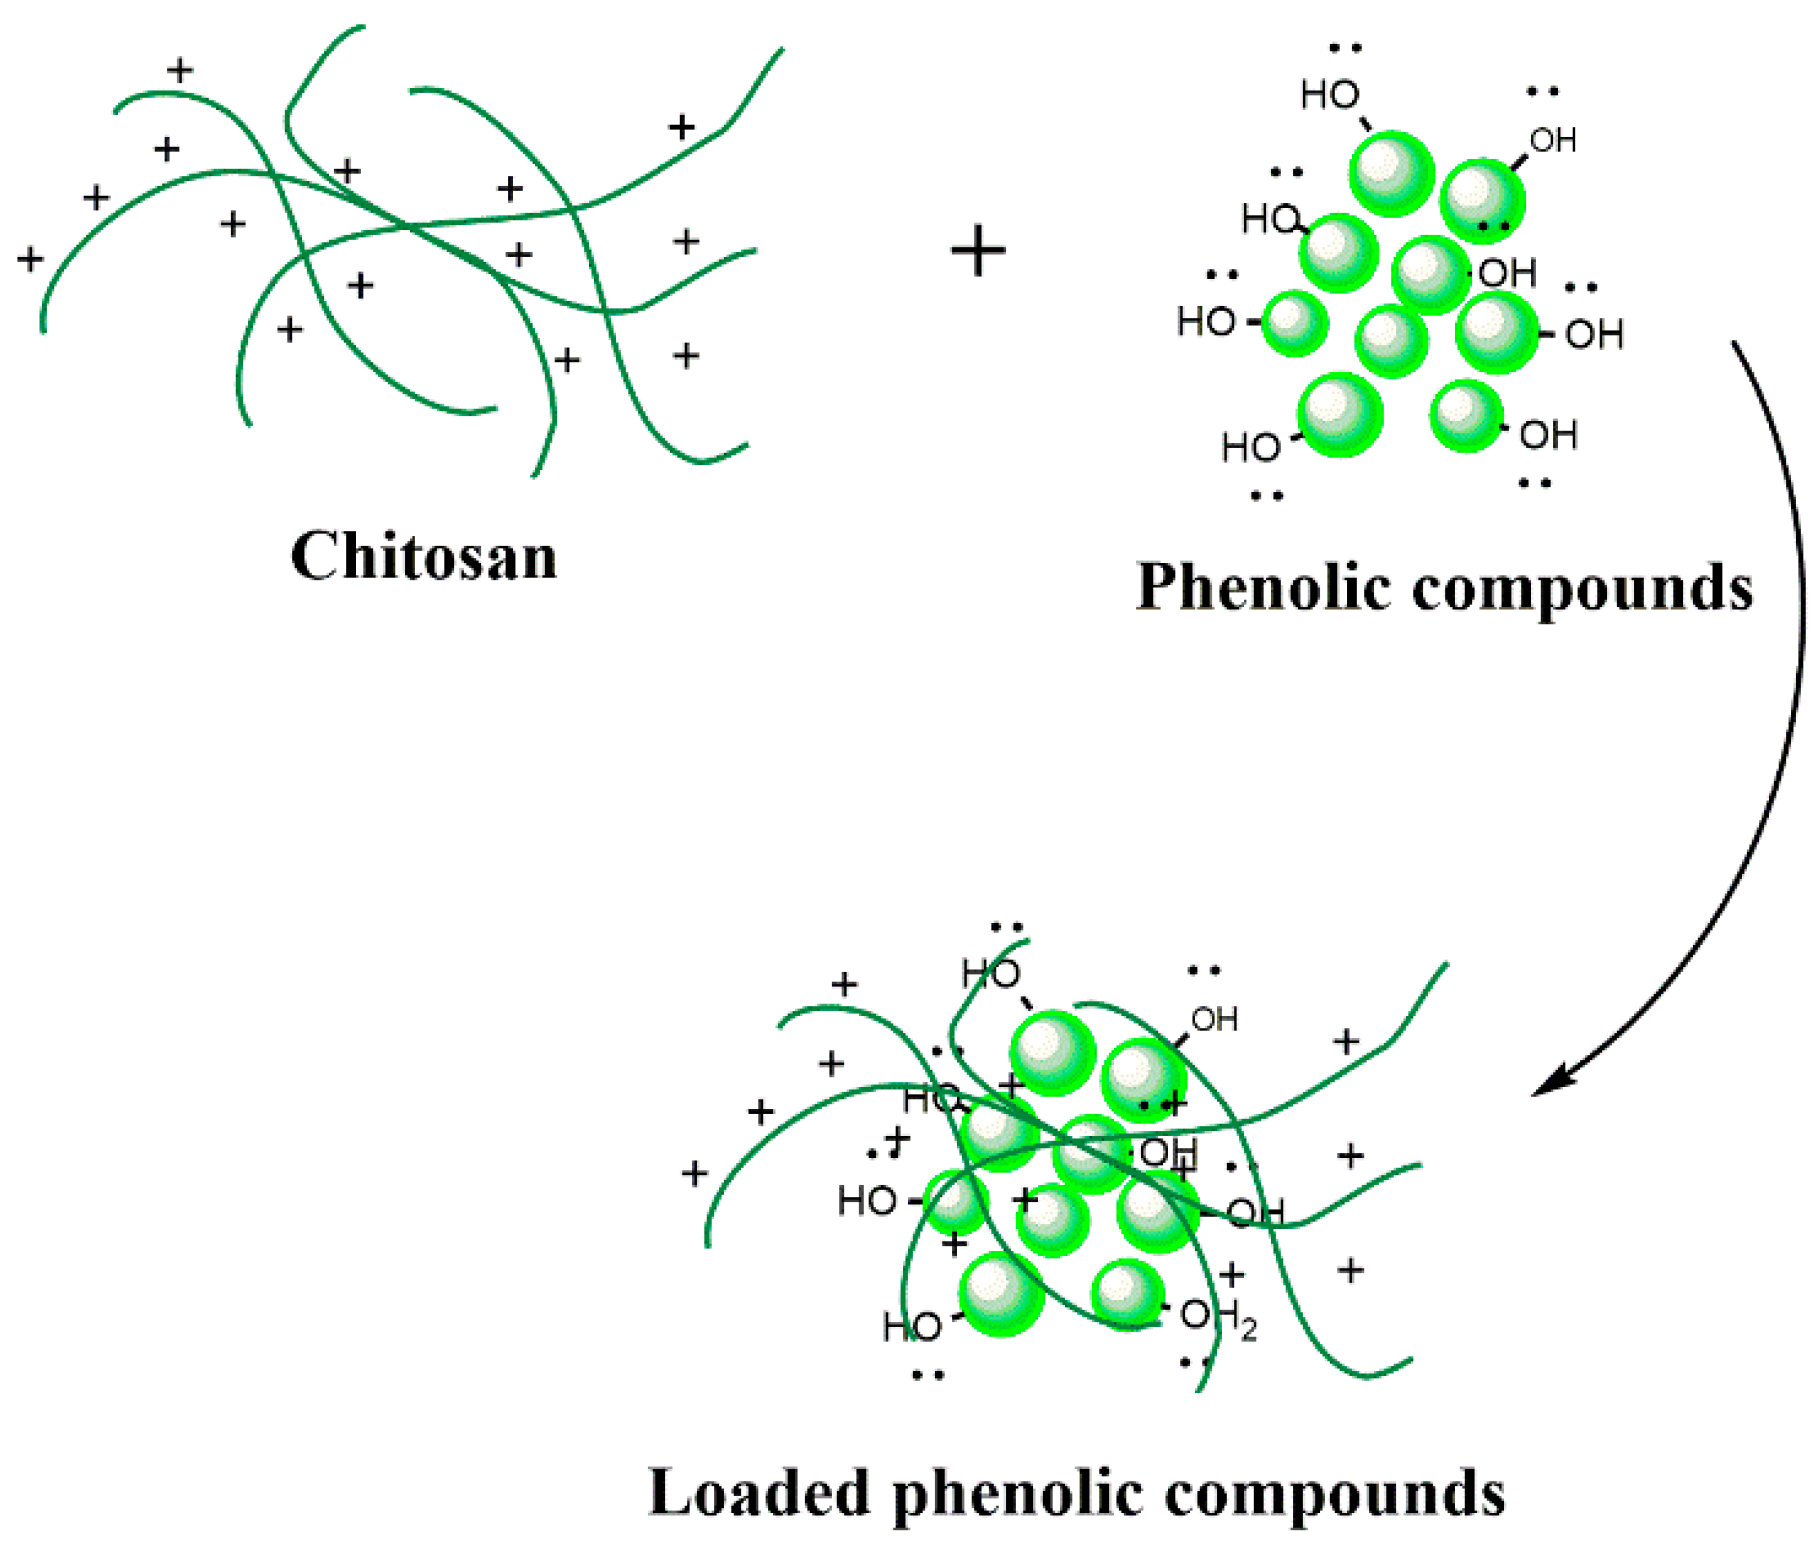
3.3. Loading of Phenolic Compounds into Different Cationic Polymers

After loading the different matrixes, samples were analyzed by UV-vis spectroscopy to determine the content of phenolic compounds (Table 3). It was observed that CS had a loading efficiency between 90–99%, while for the blocks of CS-b-PPEGMA the efficiency was lower from 50–60%; on the other hand, the loading content was 65% and 99%, respectively [51,52]. The pKa of phenolic compounds varies around 6–9 [53,54,55,56,57,58], and the solubility of these is affected depending on the pH of the medium; considering that, their loading was carried out in an aqueous medium acidified with 1% v/v of acetic acid (pH = 4.5), it could be said that some of the compounds were partially soluble. An opposite case for CS with a pKa around 6.17–6.51 [59,60,61], is completely soluble at acidic pH due to its protonated amines. When those amines are in contact with the hydroxyl groups (-OH) of the phenolic compounds (Figure 2) they can form hydrogen bonds or present electrostatic interactions (neutralization of charges) (Figure 7). Due to this molecular interaction in the case of CS, which has a higher content of free amines, it can encapsulate a higher concentration of the phenolic compounds; on the other hand, in the CS-b-PPEGMA blocks, the shorter CS chains and the fact that the ends are blocked with PPEGMA leads to less free amines per chain that can be available for interaction with the -OH of the phenolic compounds (Table 3). Moreover, a significant difference was registered in ζ change when a simple mixture of matrix and PPHs was prepared as compared with PPHs-loaded polymeric matrixes, so the stabilization and loading with the different matrixes can be inferred.
To determine if these matrixes protected the phenolic compounds, the stability of these systems before and after loading was determined by zeta potential (Figure 8a) and particle size (Figure 8b) in measurements for about 15 days. From these experiments, the most stable system resulted to be the CS matrix, whilst the particle size of the CS-b-PPEGMA blocks increased with the time, although the latter presented good size stability for up to 5 days. On the other hand, the study of zeta potential for the two different systems and the unencapsulated polyphenols can be observed, and it was found that the zeta potential (positive or negative) of the samples increased with the time. This effect may be because most of these compounds are not soluble in aqueous medium, so they precipitate, and those partially soluble compounds can be ionized [9,12].
On the other hand, in the case of CS systems, it can be observed how there was a drastic decrease in the surface charge after day 3 (compared with day 5), which could be caused by a decrease in the number of free amino groups improving the polymer-organic compounds interactions, maintaining similar particle size and colloidal stability along the days (Figure 8). In the case of the CS-PPHs system (PPHs@CS), the variations in the zeta potential did not significantly affect the size, and formation of more complex aggregates was not detected. In general, surface charge variations depend on free groups in their ionized form or forming hydrogen bonds, belonging to the polymer or the nutraceuticals. Figure 7 shows the possible interaction between CS and the polyphenolic compounds.

Thermal Characterization of Phenolic Compounds

The stability of the PPHs in the two different cationic matrixes was determined by thermogravimetric analysis, as is shown in Figure 9. It is shown that the decomposition signals of the single PPHs sample were not overlapped with the signals of the compounds loaded in the different cationic matrixes (CS@PPHs and CS-b-PPEGMA@PPHs). Also, a displacement of the decomposition temperatures of the PPHs can be observed, which would be associated with the cationic matrixes protecting these systems through different interactions, which could also impart on them higher thermal stability [62].

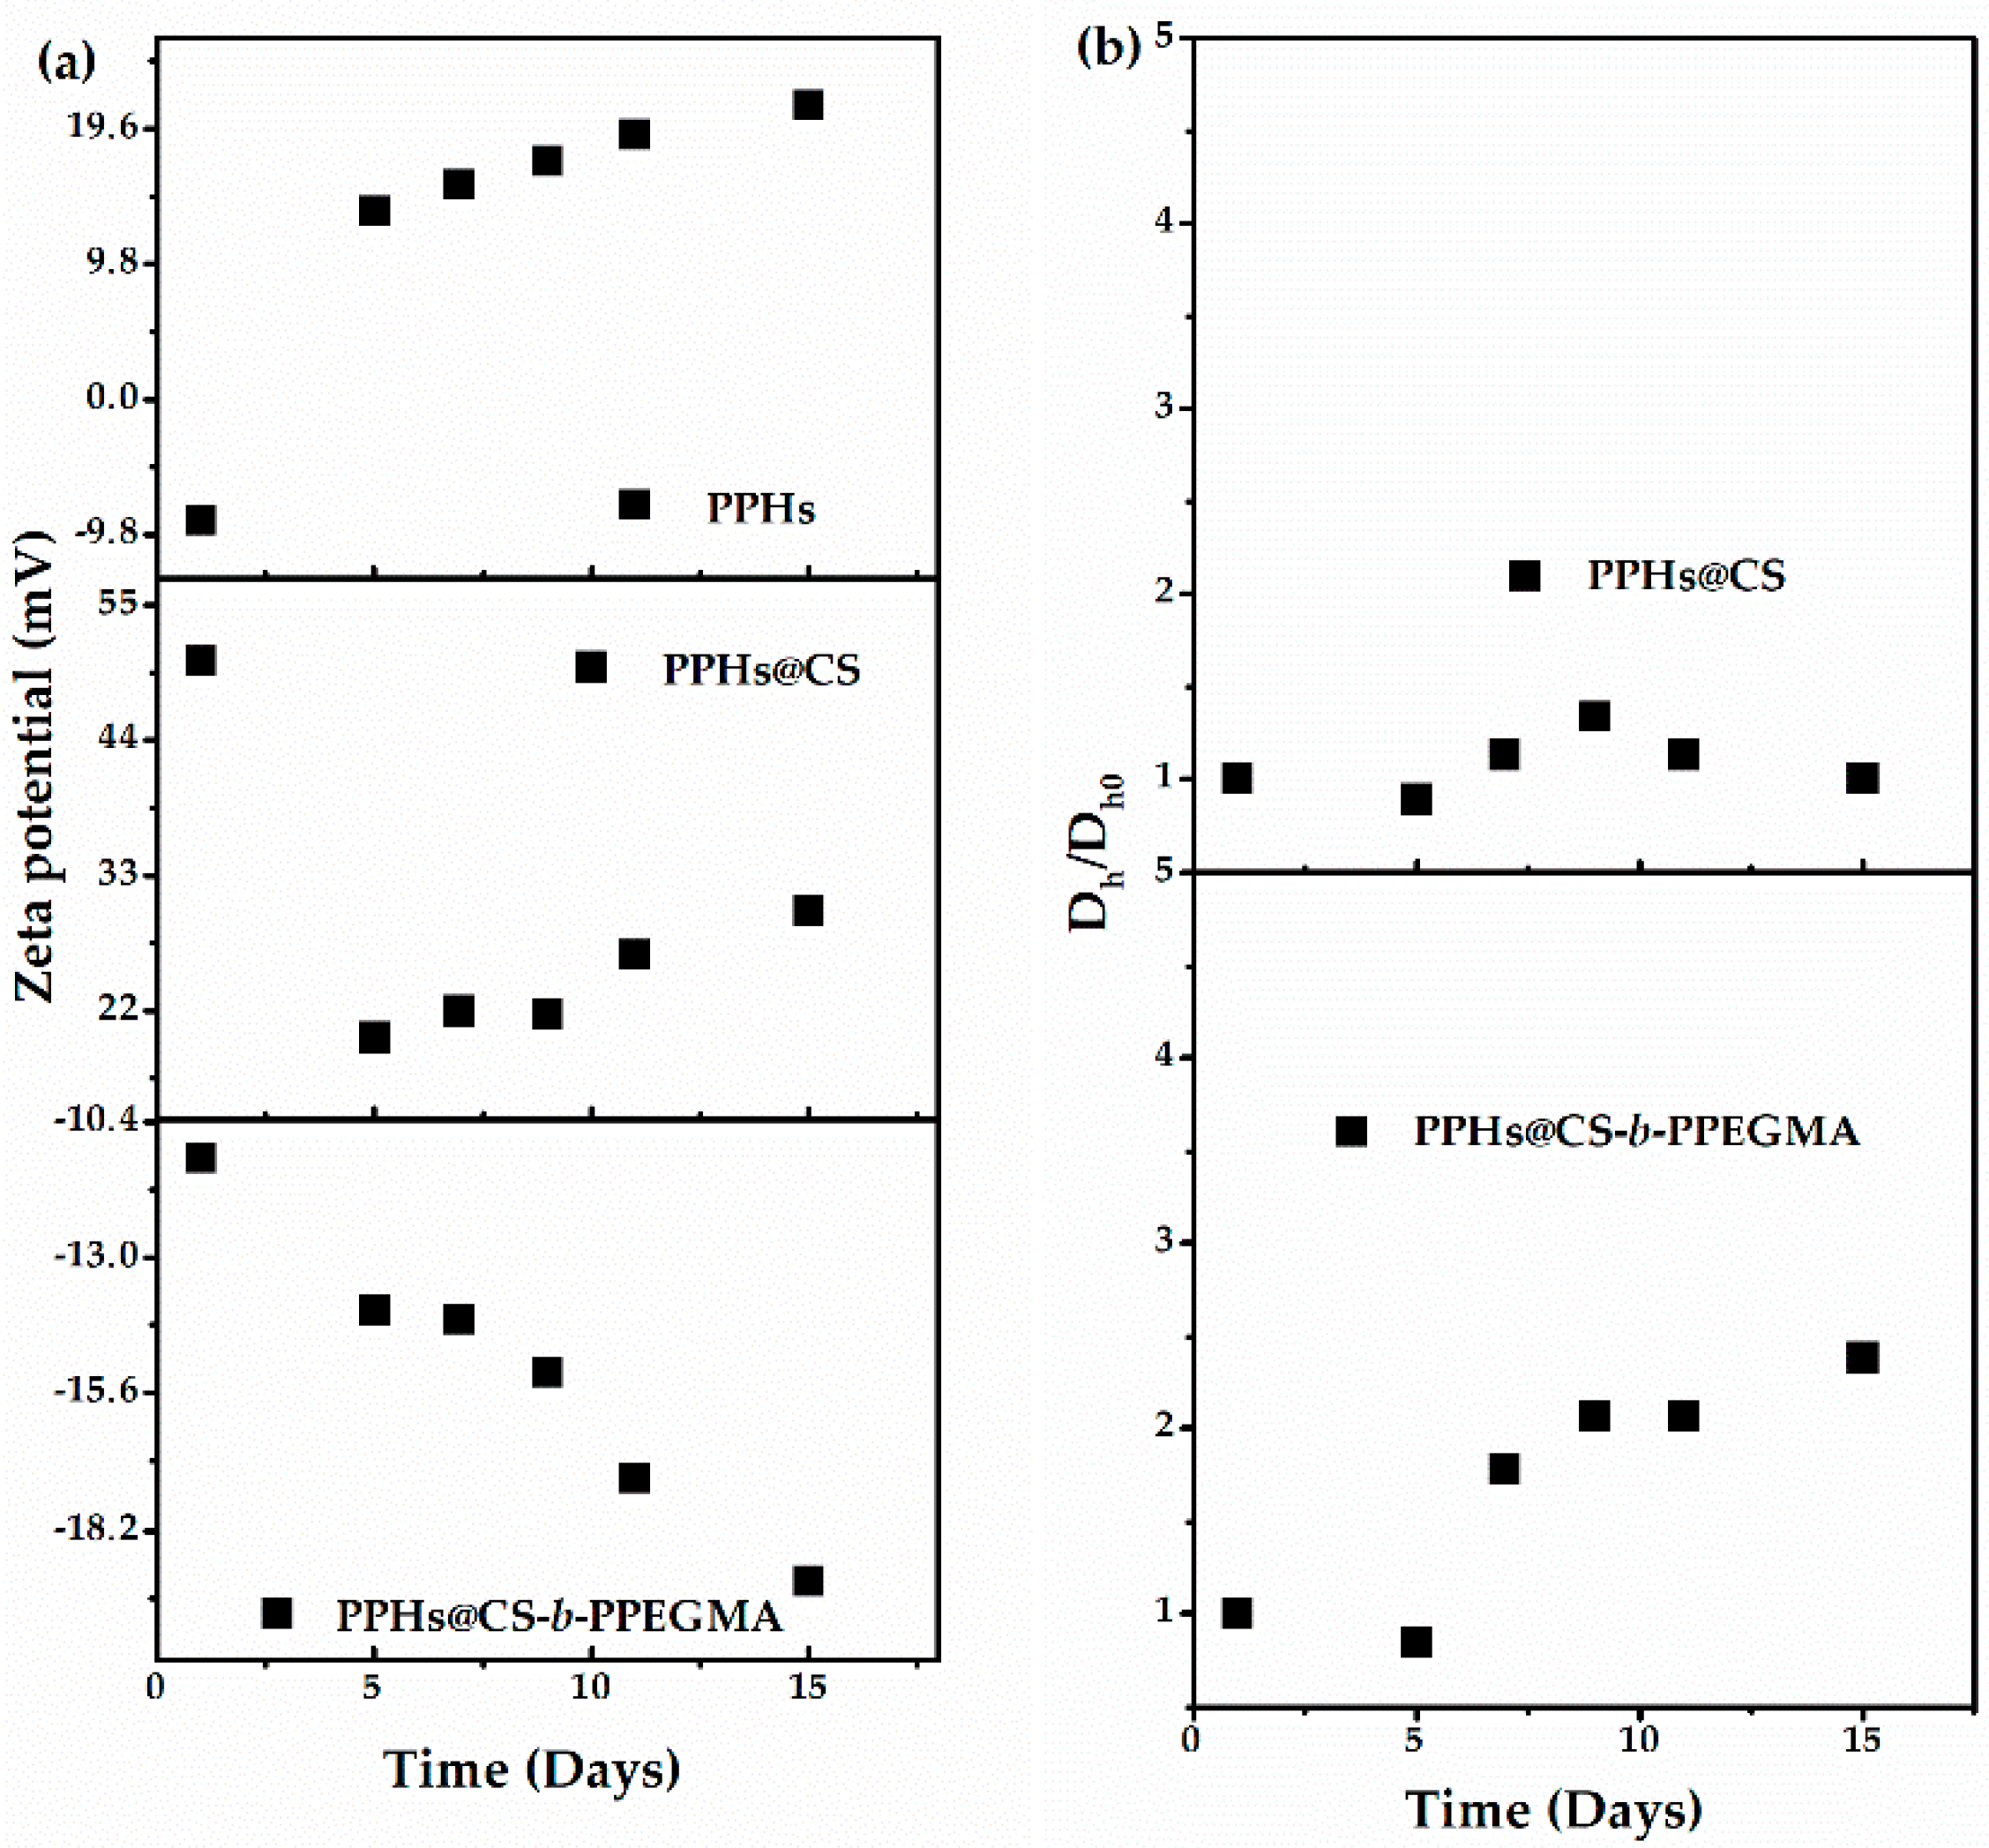
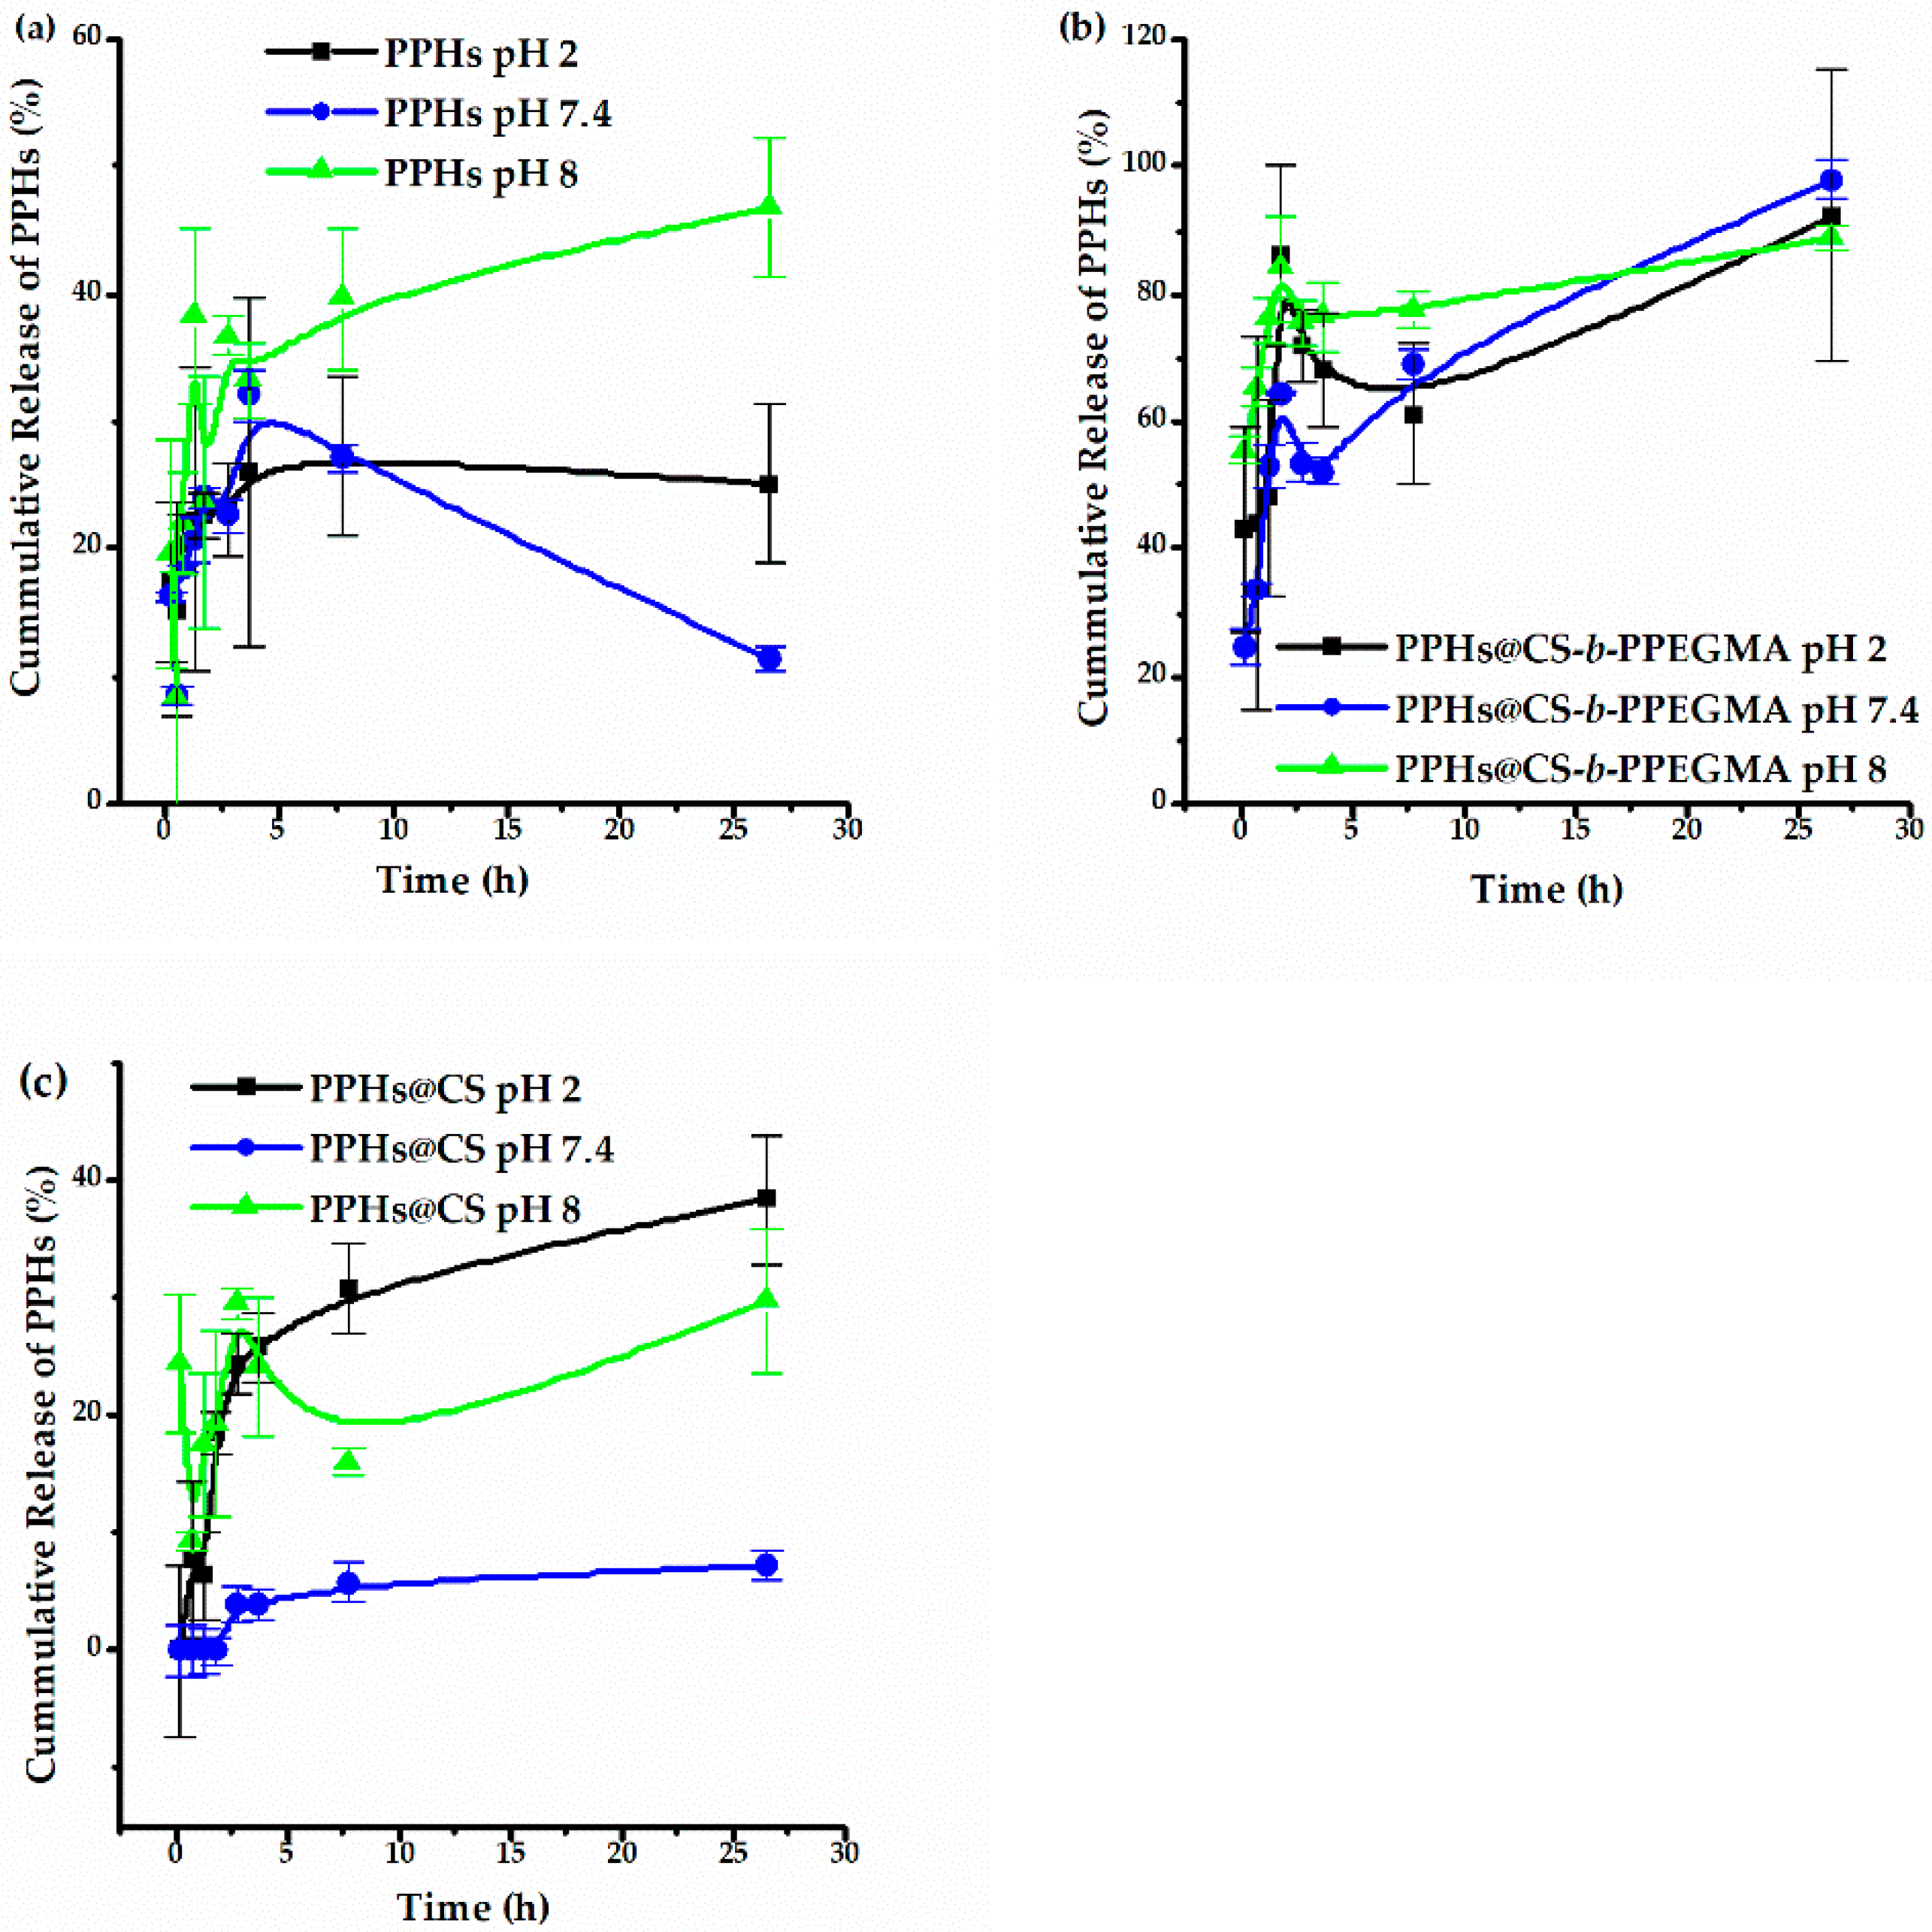
3.4. Release of Phenolic Compounds

The release profiles were performed by simulating pH conditions in the gastrointestinal tract using phosphate buffers with pH 7.4, 2, and 8 (Figure 10); each simulation was incubated for 24 h. Subsequently, a continuous release was also performed (pH 2, 6.8, 7.4 and 8); in the same way, the surface charge of both systems was determined at the different pH to study their behavior. In Figure 10a, it can be seen that the phenolic compounds show a higher percentage of release at pH 8, while at pH 7.4 a drop in their concentration is observed after 24 h of release; furthermore, the maximum release percentage of these compounds was 45%. It is relevant to specify that the rest of the PPHs precipitate as they are not completely soluble in an aqueous medium. According to the release profiles recorded from the two different matrixes, it can be seen that the CS-b-PPEGMA blocks provide a more controlled release of these compounds, releasing more than 80% of the PPHs after 24 h. On the other hand, CS only releases a maximum of around 40% of the guest compounds, and this is mainly due to the solubility of CS in the different pH values [63], observing that at pH 2, CS is completely soluble and releases a higher percentage of the phenolic compounds.
The release in all cases started quickly at the beginning and then a slower release of nutraceuticals compounds over time was recorded; this could result from a fraction of the molecules just being adsorbed onto the matrixes’ surface, triggering an initial burst release [64].
In Figure 11, the continuous release profiles of the PPHs loaded in CS and CS-b-PPEGMA are shown—the systems presented different behavior when continuous release was performed, changing the pH and simulating the gastrointestinal tract passage as compared to individual pH values. It is observed that the maximum release for the CS-b-PPEGMA matrix was less than 20%, and in the case of CS a maximum of 8% was released; this shows a gap where more than 80% of these compounds are protected within the different matrixes [65]. The difference between the release of the different matrixes is mainly due to their solubility in the aqueous medium, as well as the solubility/stability of the phenolic compounds released in the medium; these tend to precipitate when they are in an aqueous medium. Nevertheless, there is still a possibility that the enzymes present in in-vivo systems can degrade these matrixes and release a higher percentage of these compounds [13].

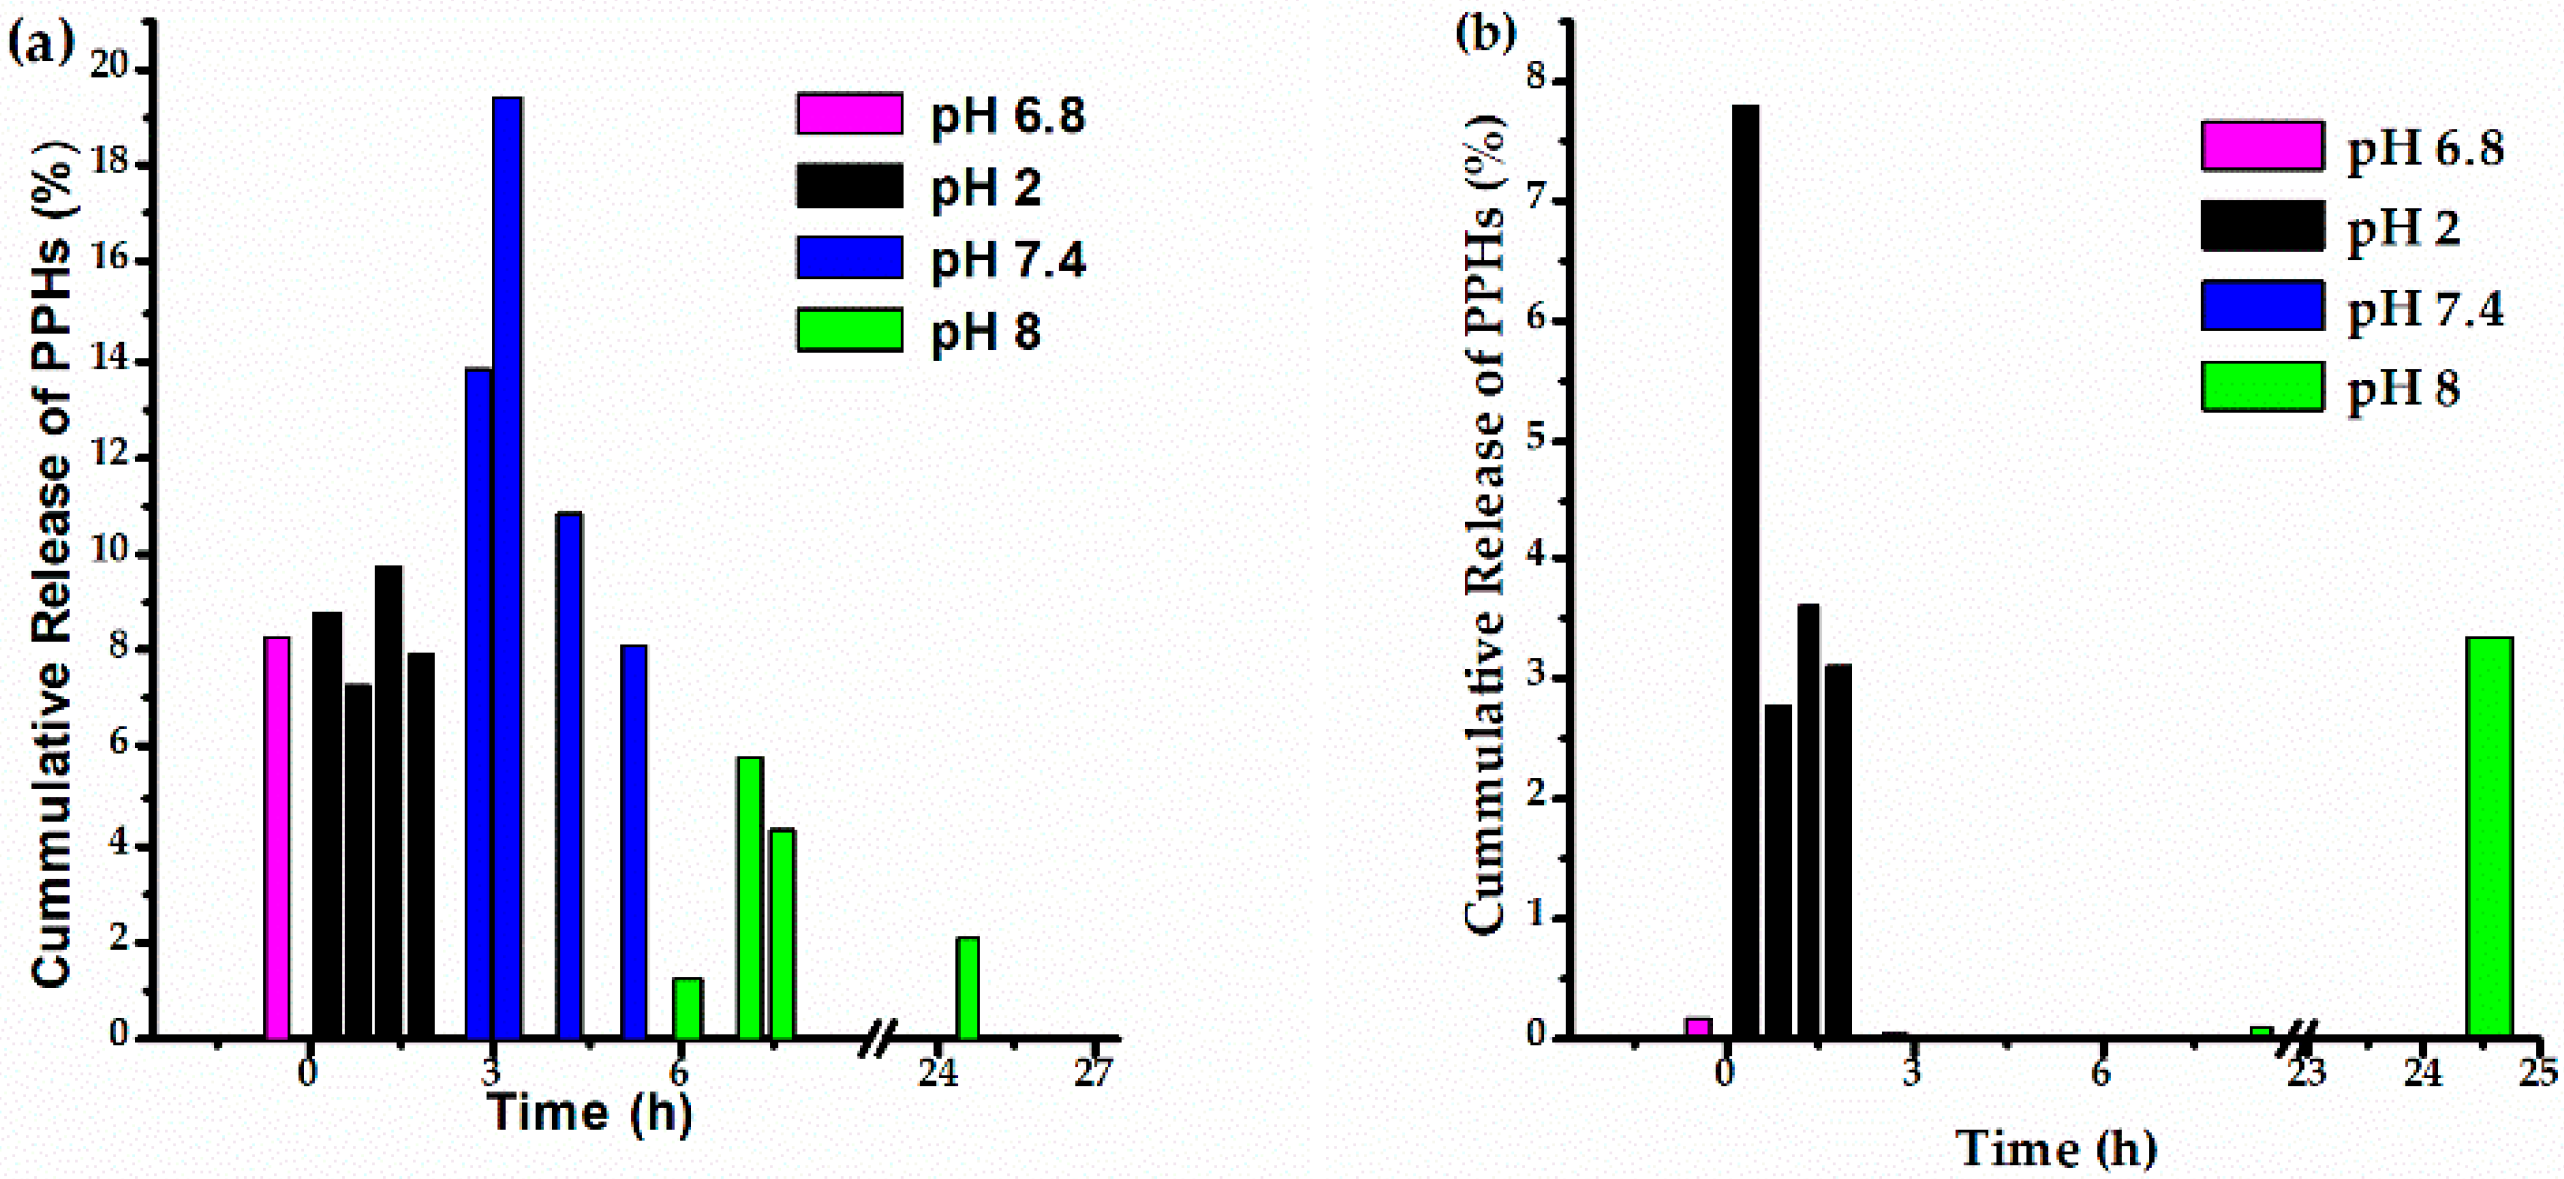
3.5. In-Vitro Gastrointestinal Digestion

Encapsulation has been used both to enhance the bioaccessibility of phenolic compounds and to protect them from degradation [12]. In this sense, the properties of the charged and unloaded phenolic compounds were determined in both systems after the gastric and intestinal phase by the total reducing capacity and TEAC assays to evaluate if the compounds maintained their antioxidant properties.
Table 4 shows a summary of the results obtained, and it can be observed that both the total reducing capacity and the antioxidant capacity of the PPHs are diminished in the SGF phase. This may be mainly due to the ionization of the phenolic compounds present, which causes a decrease in their activity towards the free radical target; in the intestinal phase, a decrease is seen mainly by the ABTS assay, which may have been because a large proportion of the released phenolic compounds could have been degraded or ionized in the gastric phase [9]. During in-vitro gastrointestinal digestion, encapsulated polyphenols can be partially released from the matrix; in this case, the matrix material can be affected by the pH changes during each digestive stage, CS matrix is most affected by this change in pH since it changes its solubility as it passes through the GI tract. At low pH, it is completely soluble, while at neutral-basic pH it is the opposite. The released polyphenols from the CS matrix are exposed to the different pH in the simulated gastrointestinal solutions, undergoing deprotonation of their chemical structures and partial hydrolysis, which has also been reported. Deprotonated polyphenols can affect the way they interact with the targeted free radicals in each antioxidant assay. The rate at which polyphenols are affected by the gastrointestinal environment is dependent on many factors, and one of the most reported is the matrix in which they are contained. In this work, we used the TEAC assay, which is based on the transfer method and depends on the reducing capacity of the evaluated substance [66,67].
In this approach, the encapsulated phenolic compounds have a higher activity than when they are not protected by one of the different matrixes [68]. In the same way, little difference can be observed between both matrix systems, and this may be mainly due to the effect of the surface charge that each system presents, causing the final TCR to be higher in the CS-b-PPEGMA matrix, having a negative partial charge because the amines are not protonated, and a higher concentration of these compounds remains inside; nonetheless, CS has a positive surface charge due to the number of amines that can be protonated, showing lower activity. The opposite is seen in the results obtained by TEAC, but in this case, it could be because the CS has a greater amount of compounds within the matrix; namely, there is a greater PPHs fraction compared to the block copolymers [52].
Moreover, it has been reported that CS-based polymers improve the disturbance in glucose metabolism in diabetic mice, such as reducing blood glucose, reversing insulin resistance, enhancement of the colonic epithelial integrity, and a modulatory effect on the gut microbiota. In addition, CS-based polymers loaded with phenolic compounds have been proposed as promising nanochemopreventive agents against cancer. Also, CS has been reported as a permeability enhancer, which must be addressed to evaluate if phenolic-loaded CS can increase the cell permeability of phenolics. Thus, CS and CS-based polymers loaded with phenolic compounds can result in multiple beneficial effects in the development of functional foods [11,41,69,70].

4. Conclusions

From the characterization, it can be concluded that the synthesis of block copolymers based on CS and PEGMA was successfully accomplished. The phenolic compounds were efficiently encapsulated with the CS and CS-b-PPEGMA matrixes, which was verified by determining the surface charge (zeta potential) of the colloidal systems before and after the loading. This change is derived from the type of interaction taking place between the -OH groups of the phenolic compounds and the –NH2 onto the CS backbone in the different aqueous medium. PEGMA2000 led to the development of formulations having smaller particle size; however, CS plays a key role improving the matrix–guest compounds interactions and colloidal stability. The CS-b-PPEGMA matrix allowed a higher percentage of release, which can be attributed to the improved solubility of these platforms, as compared with single CS, and during cumulative release experiments only a maximum of 20% of active compounds were released from this platform; namely, 80% of the guest substances remained trapped in the polymeric matrix after the gastric and intestinal phases, indicating that the CS-b-PPEGMA may offer greater protection for the active compounds in the gastric phase. This could be related to the negative surface charge of this matrix undergoing delayed protonation, and an inverse effect was exhibited by CS. Thus, the results demonstrated that the encapsulation of nutraceuticals can improve their stability, solubility, and activity, and the CS-b-PPEGMA matrix can help improve the controlled release of compounds present in Mexican oregano (Lippia graveolens).

Author Contributions

Conceptualization, J.B.H. and A.L.-C.; Investigation, M.G.-C.; Resources, J.B.H. and A.L.-C.; Supervision, J.B.H. and A.L.-C.; Writing—original draft, M.G.-C.; Writing—review & editing, J.B.H., A.L.-C., E.P.G.-G., L.A.P.-C. and M.A.A.-E. All authors have read and agreed to the published version of the manuscript.

Funding

The APC was funded by CIAD, Mexico.

Institutional Review Board Statement

Not applicable.

Informed Consent Statement

Not applicable.

Data Availability Statement

The data that support the findings of this study are available from the corresponding author upon reasonable request.

Acknowledgments

We thank MC. L. Contreras (UPLC-MS measurements, CIAD-Culiacán) and V. Miranda (NMR measurements, ITT NMR facilities funded by CONACYT Grant: INFR-2011-3-173395). E.P.G.-G. thanks CONACYT for the Catedras Project #397.

Conflicts of Interest

The authors declare no conflict of interest.

References

  1. Peanparkdee, M.; Iwamoto, S. Encapsulation for Improving In Vitro Gastrointestinal Digestion of Plant Polyphenols and Their Applications in Food Products. Food Rev. Int. 2020, 38, 335–353. [Google Scholar] [CrossRef]
  2. Leyva-Lopez, N.; Gutierrez-Grijalva, E.P.; Vazquez-Olivo, G.; Heredia, J.B. Essential Oils of Oregano: Biological Activity beyond Their Antimicrobial Properties. Molecules 2017, 22, 989. [Google Scholar] [CrossRef] [PubMed]
  3. Herrera-Rodriguez, S.E.; Lopez-Rivera, R.J.; Garcia-Marquez, E.; Estarron-Espinosa, M.; Espinosa-Andrews, H. Mexican oregano (Lippia graveolens) essential oil-in-water emulsions: Impact of emulsifier type on the antifungal activity of Candida albicans. Food Sci. Biotechnol. 2019, 28, 441–448. [Google Scholar] [CrossRef] [PubMed]
  4. Subramanian, A.P.; Jaganathan, S.K.; Manikandan, A.; Pandiaraj, K.N.; Gomathi, N.; Supriyanto, E. Recent trends in nano-based drug delivery systems for efficient delivery of phytochemicals in chemotherapy. RSC Adv. 2016, 6, 48294–48314. [Google Scholar] [CrossRef]
  5. Gutiérrez-Grijalva, E.P.; Picos-Salas, M.A.; Leyva-López, N.; Criollo-Mendoza, M.S.; Vazquez-Olivo, G.; Heredia, J.B. Flavonoids and Phenolic Acids from Oregano: Occurrence, Biological Activity and Health Benefits. Plants 2018, 7, 2. [Google Scholar] [CrossRef] [PubMed]
  6. Gutiérrez-Grijalva, E.P.; Antunes-Ricardo, M.; Acosta-Estrada, B.A.; Gutiérrez-Uribe, J.A.; Basilio Heredia, J. Cellular antioxidant activity and in vitro inhibition of α-glucosidase, α-amylase and pancreatic lipase of oregano polyphenols under simulated gastrointestinal digestion. Food Res. Int. 2019, 116, 676–686. [Google Scholar] [CrossRef] [PubMed]
  7. Gayoso, L.; Roxo, M.; Cavero, R.Y.; Calvo, M.I.; Ansorena, D.; Astiasarán, I.; Wink, M. Bioaccessibility and biological activity of Melissa officinalis, Lavandula latifolia and Origanum vulgare extracts: Influence of an in vitro gastrointestinal digestion. J. Funct. Foods 2018, 44, 146–154. [Google Scholar] [CrossRef]
  8. Sęczyk, Ł.; Król, B.; Kołodziej, B. In vitro bioaccessibility and activity of Greek oregano (Origanum vulgare L. ssp. hirtum (link) Ietswaart) compounds as affected by nitrogen fertilization. J. Sci. Food Agric. 2020, 100, 2410–2417. [Google Scholar] [CrossRef]
  9. Gutierrez-Grijalva, E.P.; Angulo-Escalante, M.A.; Leon-Felix, J.; Heredia, J.B. Effect of In Vitro Digestion on the Total Antioxidant Capacity and Phenolic Content of 3 Species of Oregano (Hedeoma patens, Lippia graveolens, Lippia palmeri). J. Food Sci. 2017, 82, 2832–2839. [Google Scholar] [CrossRef]
  10. de Torre, M.P.; Vizmanos, J.L.; Cavero, R.Y.; Calvo, M.I. Improvement of antioxidant activity of oregano (Origanum vulgare L.) with an oral pharmaceutical form. Biomed. Pharmacother. 2020, 129, 110424. [Google Scholar] [CrossRef]
  11. Martau, G.A.; Mihai, M.; Vodnar, D.C. The Use of Chitosan, Alginate, and Pectin in the Biomedical and Food Sector-Biocompatibility, Bioadhesiveness, and Biodegradability. Polymers 2019, 11, 1837. [Google Scholar] [CrossRef] [PubMed]
  12. Grgic, J.; Selo, G.; Planinic, M.; Tisma, M.; Bucic-Kojic, A. Role of the Encapsulation in Bioavailability of Phenolic Compounds. Antioxidants 2020, 9, 923. [Google Scholar] [CrossRef] [PubMed]
  13. Li, S.; Zhang, H.; Chen, K.; Jin, M.; Vu, S.H.; Jung, S.; He, N.; Zheng, Z.; Lee, M.S. Application of chitosan/alginate nanoparticle in oral drug delivery systems: Prospects and challenges. Drug Deliv. 2022, 29, 1142–1149. [Google Scholar] [CrossRef] [PubMed]
  14. Rezagholizade-Shirvan, A.; Najafi, M.F.; Behmadi, H.; Masrournia, M. Design and Synthesis of Novel Curcumin/Chitosan-PVA-Alginate Nanocomposite to Improve Chemico-Biological and Pharmaceutical Curcumin Properties. SSRN 2022, 24, JDDST-D-22-00009. [Google Scholar] [CrossRef]
  15. Sheorain, J.; Mehra, M.; Thakur, R.; Grewal, S.; Kumari, S. In vitro anti-inflammatory and antioxidant potential of thymol loaded bipolymeric (tragacanth gum/chitosan) nanocarrier. Int. J. Biol. Macromol. 2019, 125, 1069–1074. [Google Scholar] [CrossRef]
  16. Niaz, T.; Imran, M.; Mackie, A. Improving carvacrol bioaccessibility using core-shell carrier-systems under simulated gastrointestinal digestion. Food Chem. 2021, 353, 129505. [Google Scholar] [CrossRef]
  17. Bautista-Hernandez, I.; Aguilar, C.N.; Martinez-Avila, G.C.G.; Torres-Leon, C.; Ilina, A.; Flores-Gallegos, A.C.; Kumar Verma, D.; Chavez-Gonzalez, M.L. Mexican Oregano (Lippia graveolens Kunth) as Source of Bioactive Compounds: A Review. Molecules 2021, 26, 5156. [Google Scholar] [CrossRef] [PubMed]
  18. Carrasco-Sandoval, J.; Aranda-Bustos, M.; Henríquez-Aedo, K.; López-Rubio, A.; Fabra, M.J. Bioaccessibility of different types of phenolic compounds co-encapsulated in alginate/chitosan-coated zein nanoparticles. LWT 2021, 149, 112024. [Google Scholar] [CrossRef]
  19. Panda, P.K.; Yang, J.M.; Chang, Y.H. Preparation and characterization of ferulic acid-modified water soluble chitosan and poly (gamma-glutamic acid) polyelectrolyte films through layer-by-layer assembly towards protein adsorption. Int. J. Biol. Macromol. 2021, 171, 457–464. [Google Scholar] [CrossRef]
  20. Panda, P.K.; Yang, J.M.; Chang, Y.H.; Su, W.W. Modification of different molecular weights of chitosan by p-Coumaric acid: Preparation, characterization and effect of molecular weight on its water solubility and antioxidant property. Int. J. Biol. Macromol. 2019, 136, 661–667. [Google Scholar] [CrossRef]
  21. Silva, N.C.D.; Barros-Alexandrino, T.T.; Assis, O.B.G.; Martelli-Tosi, M. Extraction of phenolic compounds from acerola by-products using chitosan solution, encapsulation and application in extending the shelf-life of guava. Food Chem. 2021, 354, 129553. [Google Scholar] [CrossRef] [PubMed]
  22. Hasan, K.M.F.; Wang, H.; Mahmud, S.; Jahid, M.A.; Islam, M.; Jin, W.; Genyang, C. Colorful and antibacterial nylon fabric via in-situ biosynthesis of chitosan mediated nanosilver. J. Mater. Res. Technol. 2020, 9, 16135–16145. [Google Scholar] [CrossRef]
  23. Thomas, A.; Müller, S.S.; Frey, H. Beyond Poly(ethylene glycol): Linear Polyglycerol as a Multifunctional Polyether for Biomedical and Pharmaceutical Applications. Biomacromolecules 2014, 15, 1935–1954. [Google Scholar] [CrossRef] [PubMed]
  24. Jun, H.W.; West, J.L. Endothelialization of microporous YIGSR/PEG-modified polyurethaneurea. Tissue Eng. 2005, 11, 8. [Google Scholar] [CrossRef]
  25. Yu, H.; VandeVord, P.J.; Mao, L.; Matthew, H.; Wooley, P.H.; Yang, S.-Y. Improved tissue-engineered bone regeneration by endothelial cell mediated vascularization. Biomaterials 2009, 30, 508–517. [Google Scholar] [CrossRef]
  26. Chiu, Y.-C.; Kocagöz, S.; Larson, J.C.; Brey, E.M. Evaluation of Physical and Mechanical Properties of Porous Poly (Ethylene Glycol)-co-(L-Lactic Acid) Hydrogels during Degradation. PLoS ONE 2013, 8, e60728. [Google Scholar] [CrossRef]
  27. Martwong, E.; Tran, Y. Lower Critical Solution Temperature Phase Transition of Poly(PEGMA) Hydrogel Thin Films. Langmuir 2021, 37, 8585–8593. [Google Scholar] [CrossRef]
  28. Zarei, B.; Tabrizi, M.H.; Rahmati, A. PEGylated Lecithin-Chitosan Nanoparticle-Encapsulated Alphα-Terpineol for In Vitro Anticancer Effects. AAPS PharmSciTech 2022, 23, 94. [Google Scholar] [CrossRef] [PubMed]
  29. Cai, T.; Marquez, M.; Hu, Z. Monodisperse Thermoresponsive Microgels of Poly(ethylene glycol) Analogue-Based Biopolymers. Langmuir 2007, 23, 8663–8666. [Google Scholar] [CrossRef]
  30. Matthes, R.; Frey, H. Polyethers Based on Short-Chain Alkyl Glycidyl Ethers: Thermoresponsive and Highly Biocompatible Materials. Biomacromolecules 2022, 23, 2219–2235. [Google Scholar] [CrossRef]
  31. Swain, T.; Hillis, W.E. The phenolic constituents of Prunus domestica. I.—The quantitative analysis of phenolic constituents. J. Sci. Food Agric. 1959, 10, 63–68. [Google Scholar] [CrossRef]
  32. Ghasemi, K.; Ghasemi, Y.; Ebrahimzadeh, M.A.; Ebrahimzadeh, M.A. Antioxidant activity, phenol and flavonoid contents of 13 citrus species peels and tissues. Pak. J. Pharm Sci. 2009, 22, 277–281. [Google Scholar] [PubMed]
  33. Karadag, A.; Ozcelik, B.; Saner, S. Review of Methods to Determine Antioxidant Capacities. Food Anal. Methods 2009, 2, 41–60. [Google Scholar] [CrossRef]
  34. Thaipong, K.; Boonprakob, U.; Crosby, K.; Cisneros-Zevallos, L.; Hawkins Byrne, D. Comparison of ABTS, DPPH, FRAP, and ORAC assays for estimating antioxidant activity from guava fruit extracts. J. Food Compos. Anal. 2006, 19, 669–675. [Google Scholar] [CrossRef]
  35. Ganji, F.; Abdekhodaie, M.J. Synthesis and characterization of a new thermosensitive chitosan–PEG diblock copolymer. Carbohydr. Polym. 2008, 74, 435–441. [Google Scholar] [CrossRef]
  36. Fang, Z.; Bhandari, B. Encapsulation of polyfenols-a review. Trends Food Sci. Technol. 2010, 21, 13. [Google Scholar] [CrossRef]
  37. Picos-Corrales, L.A.; Garcia-Carrasco, M.; Licea-Claverie, A.; Chavez-Santoscoy, R.A.; Serna-Saldívar, S.O. NIPAAm-containing amphiphilic block copolymers with tailored LCST: Aggregation behavior, cytotoxicity and evaluation as carriers of indomethacin, tetracycline and doxorubicin. J. Macromol. Sci. 2019, 56, 759–772. [Google Scholar] [CrossRef]
  38. Brodkorb, A.; Egger, L.; Alminger, M.; Alvito, P.; Assunção, R.; Ballance, S.; Bohn, T.; Bourlieu-Lacanal, C.; Boutrou, R.; Carrière, F.; et al. INFOGEST static in vitro simulation of gastrointestinal food digestion. Nat. Protocols 2019, 14, 991–1014. [Google Scholar] [CrossRef] [PubMed]
  39. Cortes-Chitala, M.D.C.; Flores-Martinez, H.; Orozco-Avila, I.; Leon-Campos, C.; Suarez-Jacobo, A.; Estarron-Espinosa, M.; Lopez-Muraira, I. Identification and Quantification of Phenolic Compounds from Mexican Oregano (Lippia graveolens HBK) Hydroethanolic Extracts and Evaluation of Its Antioxidant Capacity. Molecules 2021, 26, 702. [Google Scholar] [CrossRef]
  40. Lin, L.Z.; Mukhopadhyay, S.; Robbins, R.J.; Harnly, J.M. Identification and quantification of flavonoids of Mexican oregano (Lippia graveolens) by LC-DAD-ESI/MS analysis. J. Food Compost Anal. 2007, 20, 361–369. [Google Scholar] [CrossRef] [Green Version]
  41. Paul, S.; Hmar, E.B.L.; Zothantluanga, J.H.; Sharma, H.K. Essential oils: A review on their salient biological activities and major delivery strategies. Sci. Vis. 2020, 20, 54–71. [Google Scholar] [CrossRef]
  42. Hermosillo-Ochoa, E.; Picos-Corrales, L.A.; Licea-Claverie, A. Eco-friendly flocculants from chitosan grafted with PNVCL and PAAc: Hybrid materials with enhanced removal properties for water remediation. Sep. Purif. Technol. 2021, 258, 118052. [Google Scholar] [CrossRef]
  43. Sabnis, S.; Block, L.H. Chitosan as an enabling excipient for drug delivery systems I. Molecular modifications. Int. J. Biol. Macromol. 2000, 27, 6. [Google Scholar] [CrossRef]
  44. Kou, S.G.; Peters, L.; Mucalo, M. Chitosan: A review of molecular structure, bioactivities and interactions with the human body and micro-organisms. Carbohydr. Polym. 2022, 282, 119132. [Google Scholar] [CrossRef] [PubMed]
  45. Nair, R.S.; Morris, A.; Billa, N.; Leong, C.O. An Evaluation of Curcumin-Encapsulated Chitosan Nanoparticles for Transdermal Delivery. AAPS PharmSciTech 2019, 20, 69. [Google Scholar] [CrossRef] [PubMed]
  46. El-Sherbiny, I.M.; Smyth, H.D. Smart Magnetically Responsive Hydrogel Nanoparticles Prepared by a Novel Aerosol-Assisted Method for Biomedical and Drug Delivery Applications. J. Nanomater 2011, 2011, 910539. [Google Scholar] [CrossRef]
  47. Paberit, R.; Rilby, E.; Göhl, J.; Swenson, J.; Refaa, Z.; Johansson, P.; Jansson, H. Cycling Stability of Poly(ethylene glycol) of Six Molecular Weights: Influence of Thermal Conditions for Energy Applications. ACS Appl. Energy Mater. 2020, 3, 10578–10589. [Google Scholar] [CrossRef]
  48. Chuc-Gamboa, M.G.; Vargas-Coronado, R.F.; Cervantes-Uc, J.M.; Cauich-Rodriguez, J.V.; Escobar-Garcia, D.M.; Pozos-Guillen, A.; San Roman Del Barrio, J. The Effect of PEGDE Concentration and Temperature on Physicochemical and Biological Properties of Chitosan. Polymers 2019, 11, 1830. [Google Scholar] [CrossRef]
  49. Hassani Najafabadi, A.; Abdouss, M.; Faghihi, S. Synthesis and evaluation of PEG-O-chitosan nanoparticles for delivery of poor water soluble drugs: Ibuprofen. Mater. Sci. Eng. C Mater. Biol. Appl. 2014, 41, 91–99. [Google Scholar] [CrossRef]
  50. Li, R.; Wu, Y.; Bai, Z.; Guo, J.; Chen, X. Effect of molecular weight of polyethylene glycol on crystallization behaviors, thermal properties and tensile performance of polylactic acid stereocomplexes. RSC Adv. 2020, 10, 42120–42127. [Google Scholar] [CrossRef]
  51. Kamel, K.M.; Khalil, I.A.; Rateb, M.E.; Elgendy, H.; Elhawary, S. Chitosan-Coated Cinnamon/Oregano-Loaded Solid Lipid Nanoparticles to Augment 5-Fluorouracil Cytotoxicity for Colorectal Cancer: Extract Standardization, Nanoparticle Optimization, and Cytotoxicity Evaluation. J. Agric. Food Chem. 2017, 65, 7966–7981. [Google Scholar] [CrossRef] [PubMed]
  52. Espinosa-Sandoval, L.; Ochoa-Martinez, C.; Ayala-Aponte, A.; Pastrana, L.; Goncalves, C.; Cerqueira, M.A. Polysaccharide-Based Multilayer Nano-Emulsions Loaded with Oregano Oil: Production, Characterization, and In Vitro Digestion Assessment. Nanomaterials 2021, 11, 878. [Google Scholar] [CrossRef]
  53. The Metabolomics Innovation Center. Quercetin. Available online: https://foodb.ca/compounds/FDB011904 (accessed on 15 June 2022).
  54. The Metabolomics Innovation Center. Pinocembrin. Available online: https://foodb.ca/compounds/FDB002758 (accessed on 15 June 2022).
  55. The Metabolomics Innovation Center. Naringin. Available online: https://foodb.ca/compounds/FDB011866 (accessed on 15 June 2022).
  56. The Metabolomics Innovation Center. Cirsimaritin. Available online: https://foodb.ca/compounds/FDB001537 (accessed on 15 June 2022).
  57. The Metabolomics Innovation Center. Luteolin. Available online: https://foodb.ca/compounds/FDB013255 (accessed on 15 June 2022).
  58. The Metabolomics Innovation Center. Naringenin. Available online: https://hmdb.ca/metabolites/HMDB0002670 (accessed on 15 June 2022).
  59. Wang, Q.Z.; Chen, X.G.; Liu, N.; Wang, S.X.; Liu, C.S.; Meng, X.H.; Liu, C.G. Protonation constants of chitosan with different molecular weight and degree of deacetylation. Carbohydr. Polym. 2006, 65, 194–201. [Google Scholar] [CrossRef]
  60. Mazancová, P.; Némethová, V.; Treľová, D.; Kleščíková, L.; Lacík, I.; Rázga, F. Dissociation of chitosan/tripolyphosphate complexes into separate components upon pH elevation. Carbohydr. Polym. 2018, 192, 104–110. [Google Scholar] [CrossRef] [PubMed]
  61. Ardean, C.; Davidescu, C.M.; Nemeş, N.S.; Negrea, A.; Ciopec, M.; Duteanu, N.; Negrea, P.; Duda-Seiman, D.; Musta, V. Factors Influencing the Antibacterial Activity of Chitosan and Chitosan Modified by Functionalization. Int. J. Mol. Sci. 2021, 22, 7449. [Google Scholar] [CrossRef] [PubMed]
  62. Hussain, K.; Ali, I.; Ullah, S.; Imran, M.; Parveen, S.; Kanwal, T.; Shah, S.A.; Saifullah, S.; Shah, M.R. Enhanced Antibacterial Potential of Naringin Loaded β Cyclodextrin Nanoparticles. J. Clust. Sci. 2021, 33, 339–348. [Google Scholar] [CrossRef]
  63. Hamdi, M.; Nasri, R.; Li, S.; Nasri, M. Design of blue crab chitosan responsive nanoparticles as controlled-release nanocarrier: Physicochemical features, thermal stability and in vitro pH-dependent delivery properties. Int. J. Biol. Macromol. 2020, 145, 1140–1154. [Google Scholar] [CrossRef]
  64. Hosseini, S.F.; Zandi, M.; Rezaei, M.; Farahmandghavi, F. Two-step method for encapsulation of oregano essential oil in chitosan nanoparticles: Preparation, characterization and in vitro release study. Carbohydr. Polym. 2013, 95, 50–56. [Google Scholar] [CrossRef]
  65. Maqsoudlou, A.; Assadpour, E.; Mohebodini, H.; Jafari, S.M. The influence of nanodelivery systems on the antioxidant activity of natural bioactive compounds. Crit. Rev. Food Sci. Nutr. 2022, 62, 24. [Google Scholar] [CrossRef]
  66. Bermúdez-Soto, M.J.; Tomás-Barberán, F.A.; García-Conesa, M.T. Stability of polyphenols in chokeberry (Aronia melanocarpa) subjected to in vitro gastric and pancreatic digestion. Food Chem. 2007, 102, 865–874. [Google Scholar] [CrossRef]
  67. Wootton-Beard, P.C.; Moran, A.; Ryan, L. Stability of the total antioxidant capacity and total polyphenol content of 23 commercially available vegetable juices before and after in vitro digestion measured by FRAP, DPPH, ABTS and Folin–Ciocalteu methods. Food Res. Int. 2011, 44, 217–224. [Google Scholar] [CrossRef]
  68. Chew, S.-C.; Tan, C.-P.; Long, K.; Nyam, K.-L. In-vitro evaluation of kenaf seed oil in chitosan coated-high methoxyl pectin-alginate microcapsules. Ind. Crops Prod. 2015, 76, 230–236. [Google Scholar] [CrossRef]
  69. Zheng, J.; Yuan, X.; Cheng, G.; Jiao, S.; Feng, C.; Zhao, X.; Yin, H.; Du, Y.; Liu, H. Chitosan oligosaccharides improve the disturbance in glucose metabolism and reverse the dysbiosis of gut microbiota in diabetic mice. Carbohydr. Polym. 2018, 190, 77–86. [Google Scholar] [CrossRef] [PubMed]
  70. Terada, A.; Hara, H.; Sato, D.; Higashi, T.; Nakayama, S.; Tsuji, K.; Sakamoto, K.; Ishioka, E.; Maezaki, Y.; Tsugita, T.; et al. Effect of Dietary Chitosan on Faecal Microbiota and Faecal Metabolites of Humans. Microb. Ecol. Health Dis. 1995, 8, 15–21. [Google Scholar] [CrossRef] [Green Version]
Figure 1. Schematic representation for free phenolic compounds extraction.
Polymers 14 03609 g001
Figure 2. Chemical structures of some compounds contained in the phenolic extract characterized by UPLC-MS: (a) cosmoside, (b) luteolin, (c) eriodyctiol, (d) cirsimaritin, (e) naringenin, (f) naringin, (g) pinocembrin.
Polymers 14 03609 g002
Figure 3. 1H-NMR spectrum of chitosan in D2O/DCl at 30 °C.
Polymers 14 03609 g003
Figure 4. 1H-NMR spectrum of chitosan-b-poly(PEGMA2000) in D2O/DCl at 30 °C.
Polymers 14 03609 g004
Figure 5. DSC thermograms of CS and CS-b-PPEGMA.
Polymers 14 03609 g005
Figure 6. Thermograms of CS and CS-b-PPEGMA: (a) TG-thermogram and (b) DTG-thermogram.
Polymers 14 03609 g006
Figure 7. Scheme of the possible interaction between CS and the polyphenolic compounds.
Polymers 14 03609 g007
Figure 8. Stability study of systems loaded with phenolic compounds from L. graveolens zeta potential (a) and particle size (b).
Polymers 14 03609 g008
Figure 9. Thermal stability of loaded and unloaded PPHs: (a) TG-thermogram and (b) DTG-thermogram of Polyphenolics Compounds (PPHs), PPHs loaded in CS (CS@PPHs), and PPHs loaded in CS-b-PPEGMA (CS-b-PPEGMA@PPHs).
Polymers 14 03609 g009
Figure 10. Release profiles of (a) PPHs, (b) PPHs@CS-b-PPEGMA, and (c) PPHs@CS. Values represent the mean ± standard deviation (n = 3).
Polymers 14 03609 g010
Figure 11. Cumulative release profiles of PPHs from CS-b-PPEGMA (a) and CS (b). Note: the cumulative release is only within a pH value; after every pH change, a new cumulative release is calculated.
Polymers 14 03609 g011
Table 1. Nutraceutical results of the ethanolic extract of oregano (L. graveolens).
TRC *
(mg GAE g−1 Dried Oregano Leaf)
TFC **
(mg QE g−1 Dried Oregano Leaf)
DPPH ***ORAC ***ABTS ***
(µmol TE g−1 Dried Oregano Leaf)
50 ± 5.50.59 ± 0.019339 ± 26.562639 ± 12.7476 ± 1.27
* Total Reducing Capacity (TRC), ** Total Flavonoids Content (TFC) *** DPPH and ABTS are scavenging capacity, and ORAC is antioxidant capacity. Values represent the mean ± standard deviation (n = 3).
Table 2. Flavonoids from the ethanolic extract of L. graveolens characterized by UPLC-MS.
CompoundCompound TypeMolecular Mass [M-H]-
Luteolin-glucosideFlavone447.1
CosmosideFlavone431.1
NaringinFlavanone579.17
QuercetinFlavonol301.04
KaempferolFlavonol285.04
EriodictyolFlavone287.06
NaringeninFlavanone271.06
PinocembrinFlavanone255.07
TaxifolinFlavanonol305.05
CirsimaritinFlavone313.07
Table 3. Loading Efficiency (LE) and Loading Content (LC) of PPHs in polymer matrixes; zeta potential (ζ) and particle sizes of loaded (@PPHs) and unloaded (Matrix) polymer matrixes. Values represent the mean ± standard deviation (n = 3).
PolymerLE
(%)
LC
(%)
ζ (mV)Dh (nm)
Mixture@PPHsMatrix@PPHsMatrix
CS90–996510.2 ± 4.3250.4 ± 3.2755.4 ± 5.071106 ± 87955 ± 75
CS-b-PPEGMA50–60997.91 ± 4.37−15.5 ± 4.57−9.07 ± 4.86458 ± 0.01190 ± 17
PPHs −8.79 ± 4.29----
Table 4. Results of the total reducing capacity (TRC) and Trolox equivalent antioxidant capacity (TEAC) of phenolic compounds loaded in chitosan (PPHs@CS), phenolic compounds loaded in CS-block-poly(PEGMA) (PPHs@CS-b-PPEGMA), and non-encapsulated phenolics (PPHs) after gastric and intestinal in-vitro digestion.
TRC *
(mg QE g−1 Dried Oregano)
TEAC **
(µmol TE g−1 Dried Oregano)
SGFSIFSGSSIF
PPHs@CS81.19 ± 4.18 b111.70 ± 9.90 a163.12 ± 79.11 b446.56 ± 9.01 a
PPHs@CS-b-PEGMA89.03 ± 2.39 b135.50 ± 3.15 a79.15 ± 23.15 b415.79 ± 7.07 a
PPHs16.68 ± 1.41 b50.54 ± 2.90 a104.19 ± 0.22 a100.82 ± 7.99 a
* Total Reducing Capacity (TRC), ** Trolox equivalent antioxidant capacity (TEAC) is a scavenging capacity. Values represent the mean ± standard deviation (n = 3). a, b means are significantly (α > 0.05) different according to the Tukey test.
Publisher’s Note: MDPI stays neutral with regard to jurisdictional claims in published maps and institutional affiliations.

