In Vitro Hyperthermia Evaluation of Electrospun Polymer Composite Fibers Loaded with Reduced Graphene Oxide

 ,
,
Abstract
: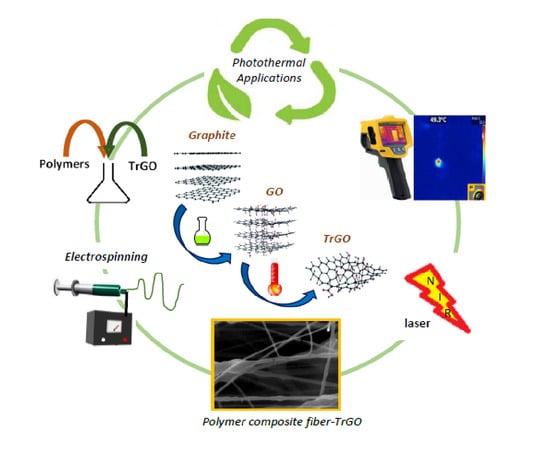
1. Introduction
2. Materials and Methods
2.1. Material and Equipment
2.2. Synthesis of Graphene Oxide and Thermally Reduced Graphene Oxide
2.3. Preparation of Electrospun Fiber Meshes by Electrospinning
2.4. Hyperthermia Evaluation
3. Results and Discussion
3.1. Characterization of Thermally Reduced Graphene Oxide
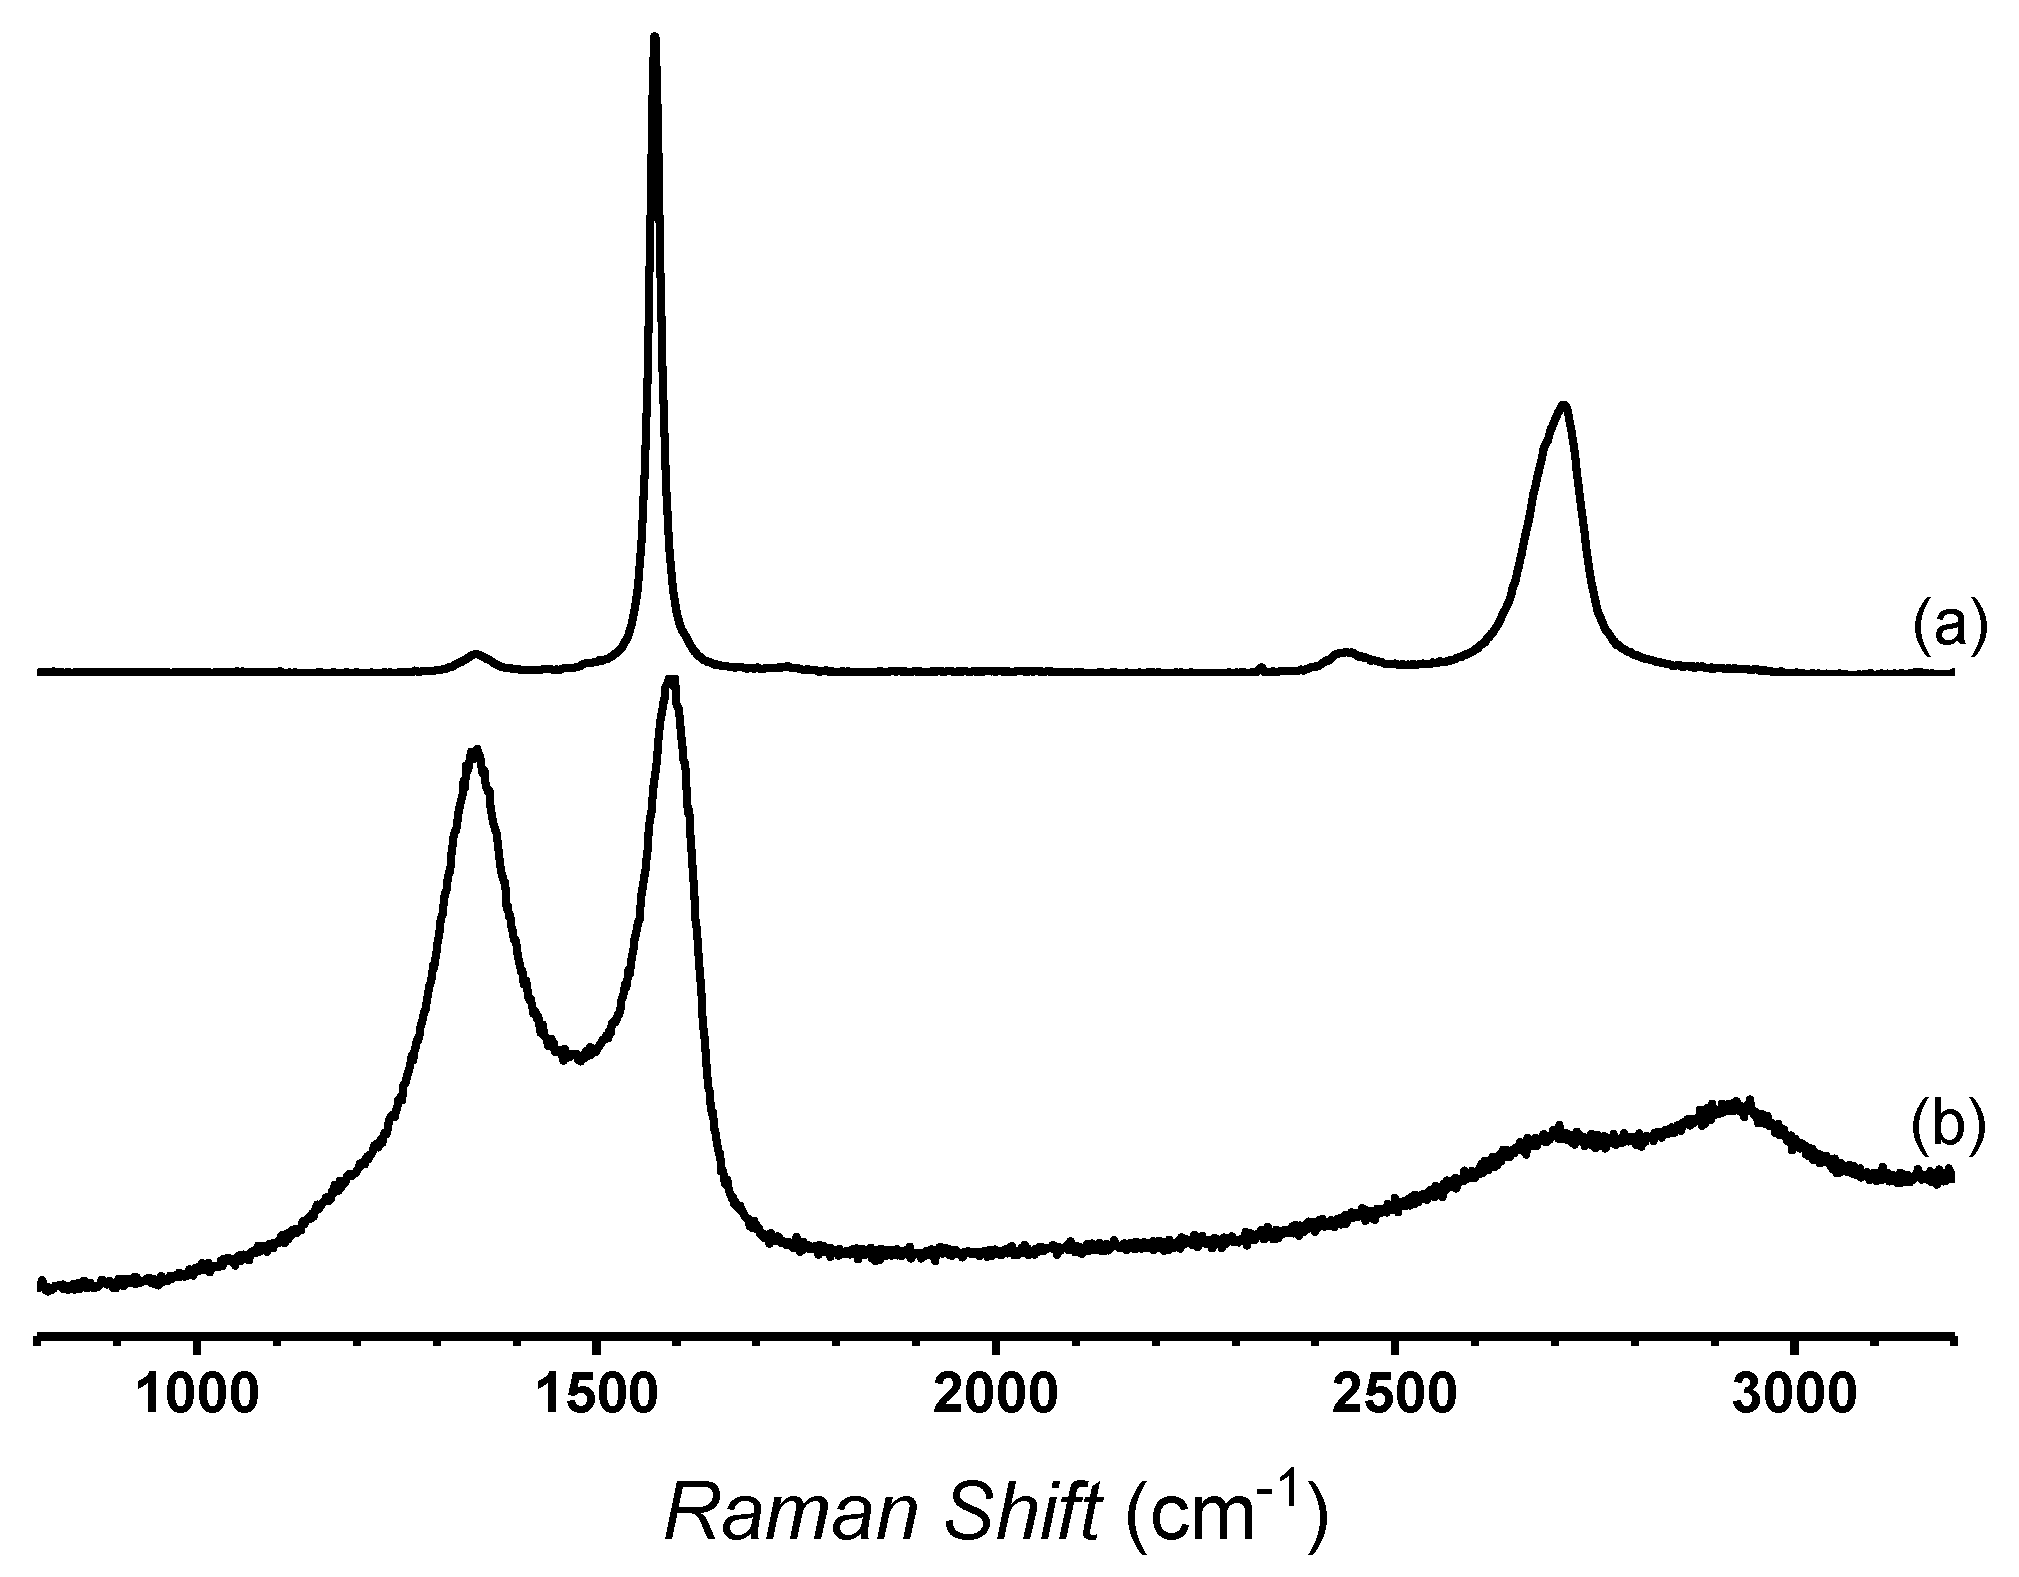
3.1.1. Raman Spectroscopy
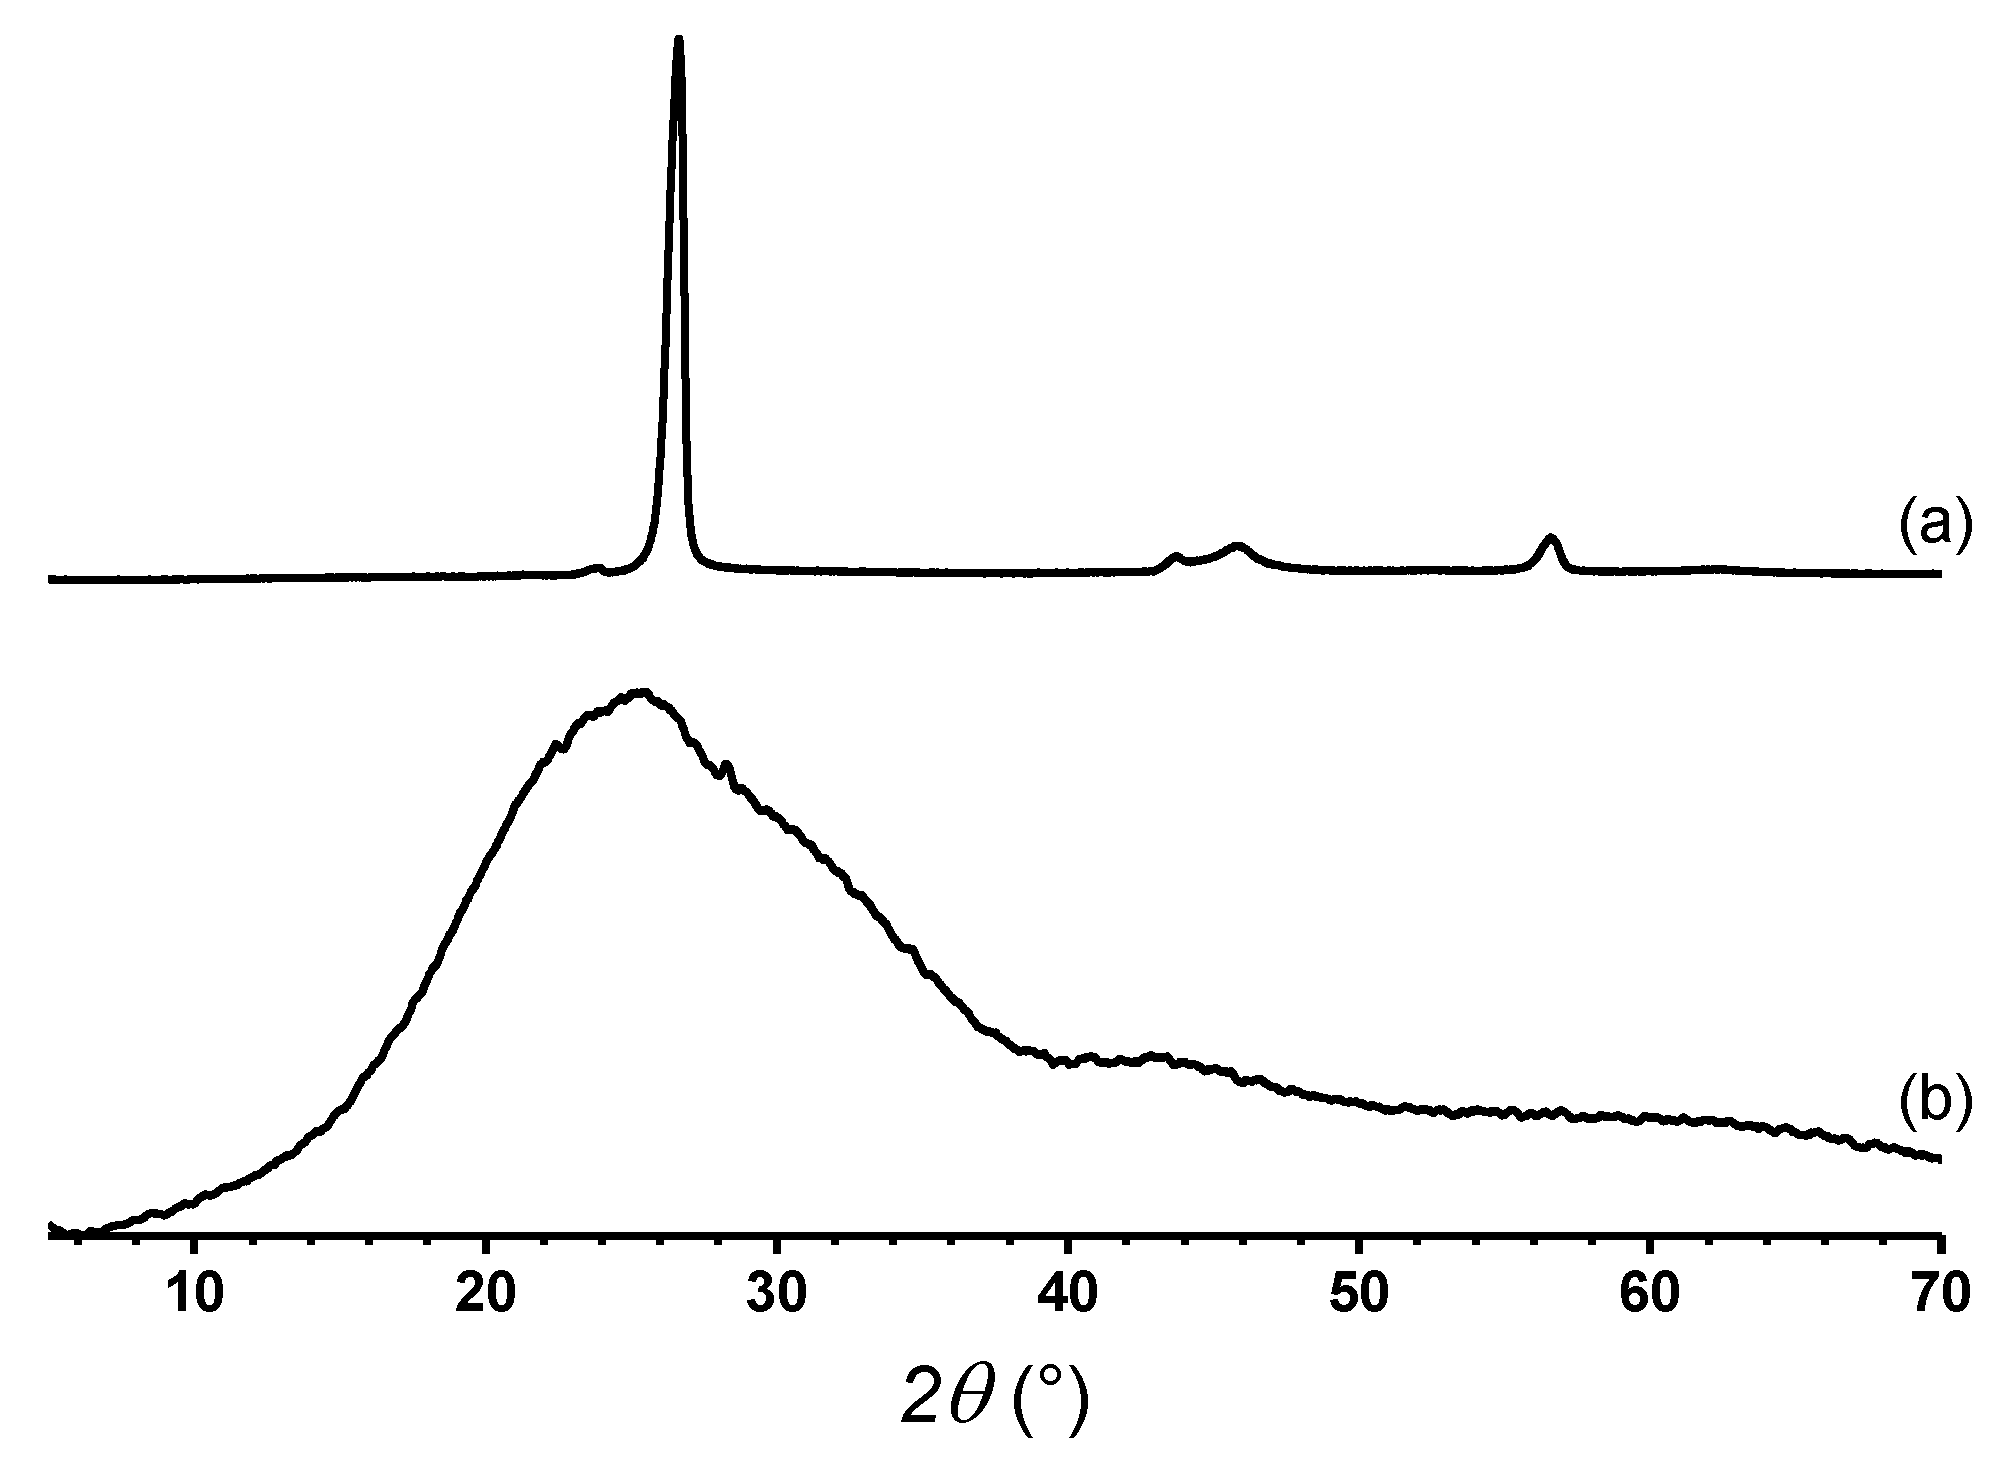
3.1.2. X-ray Diffraction
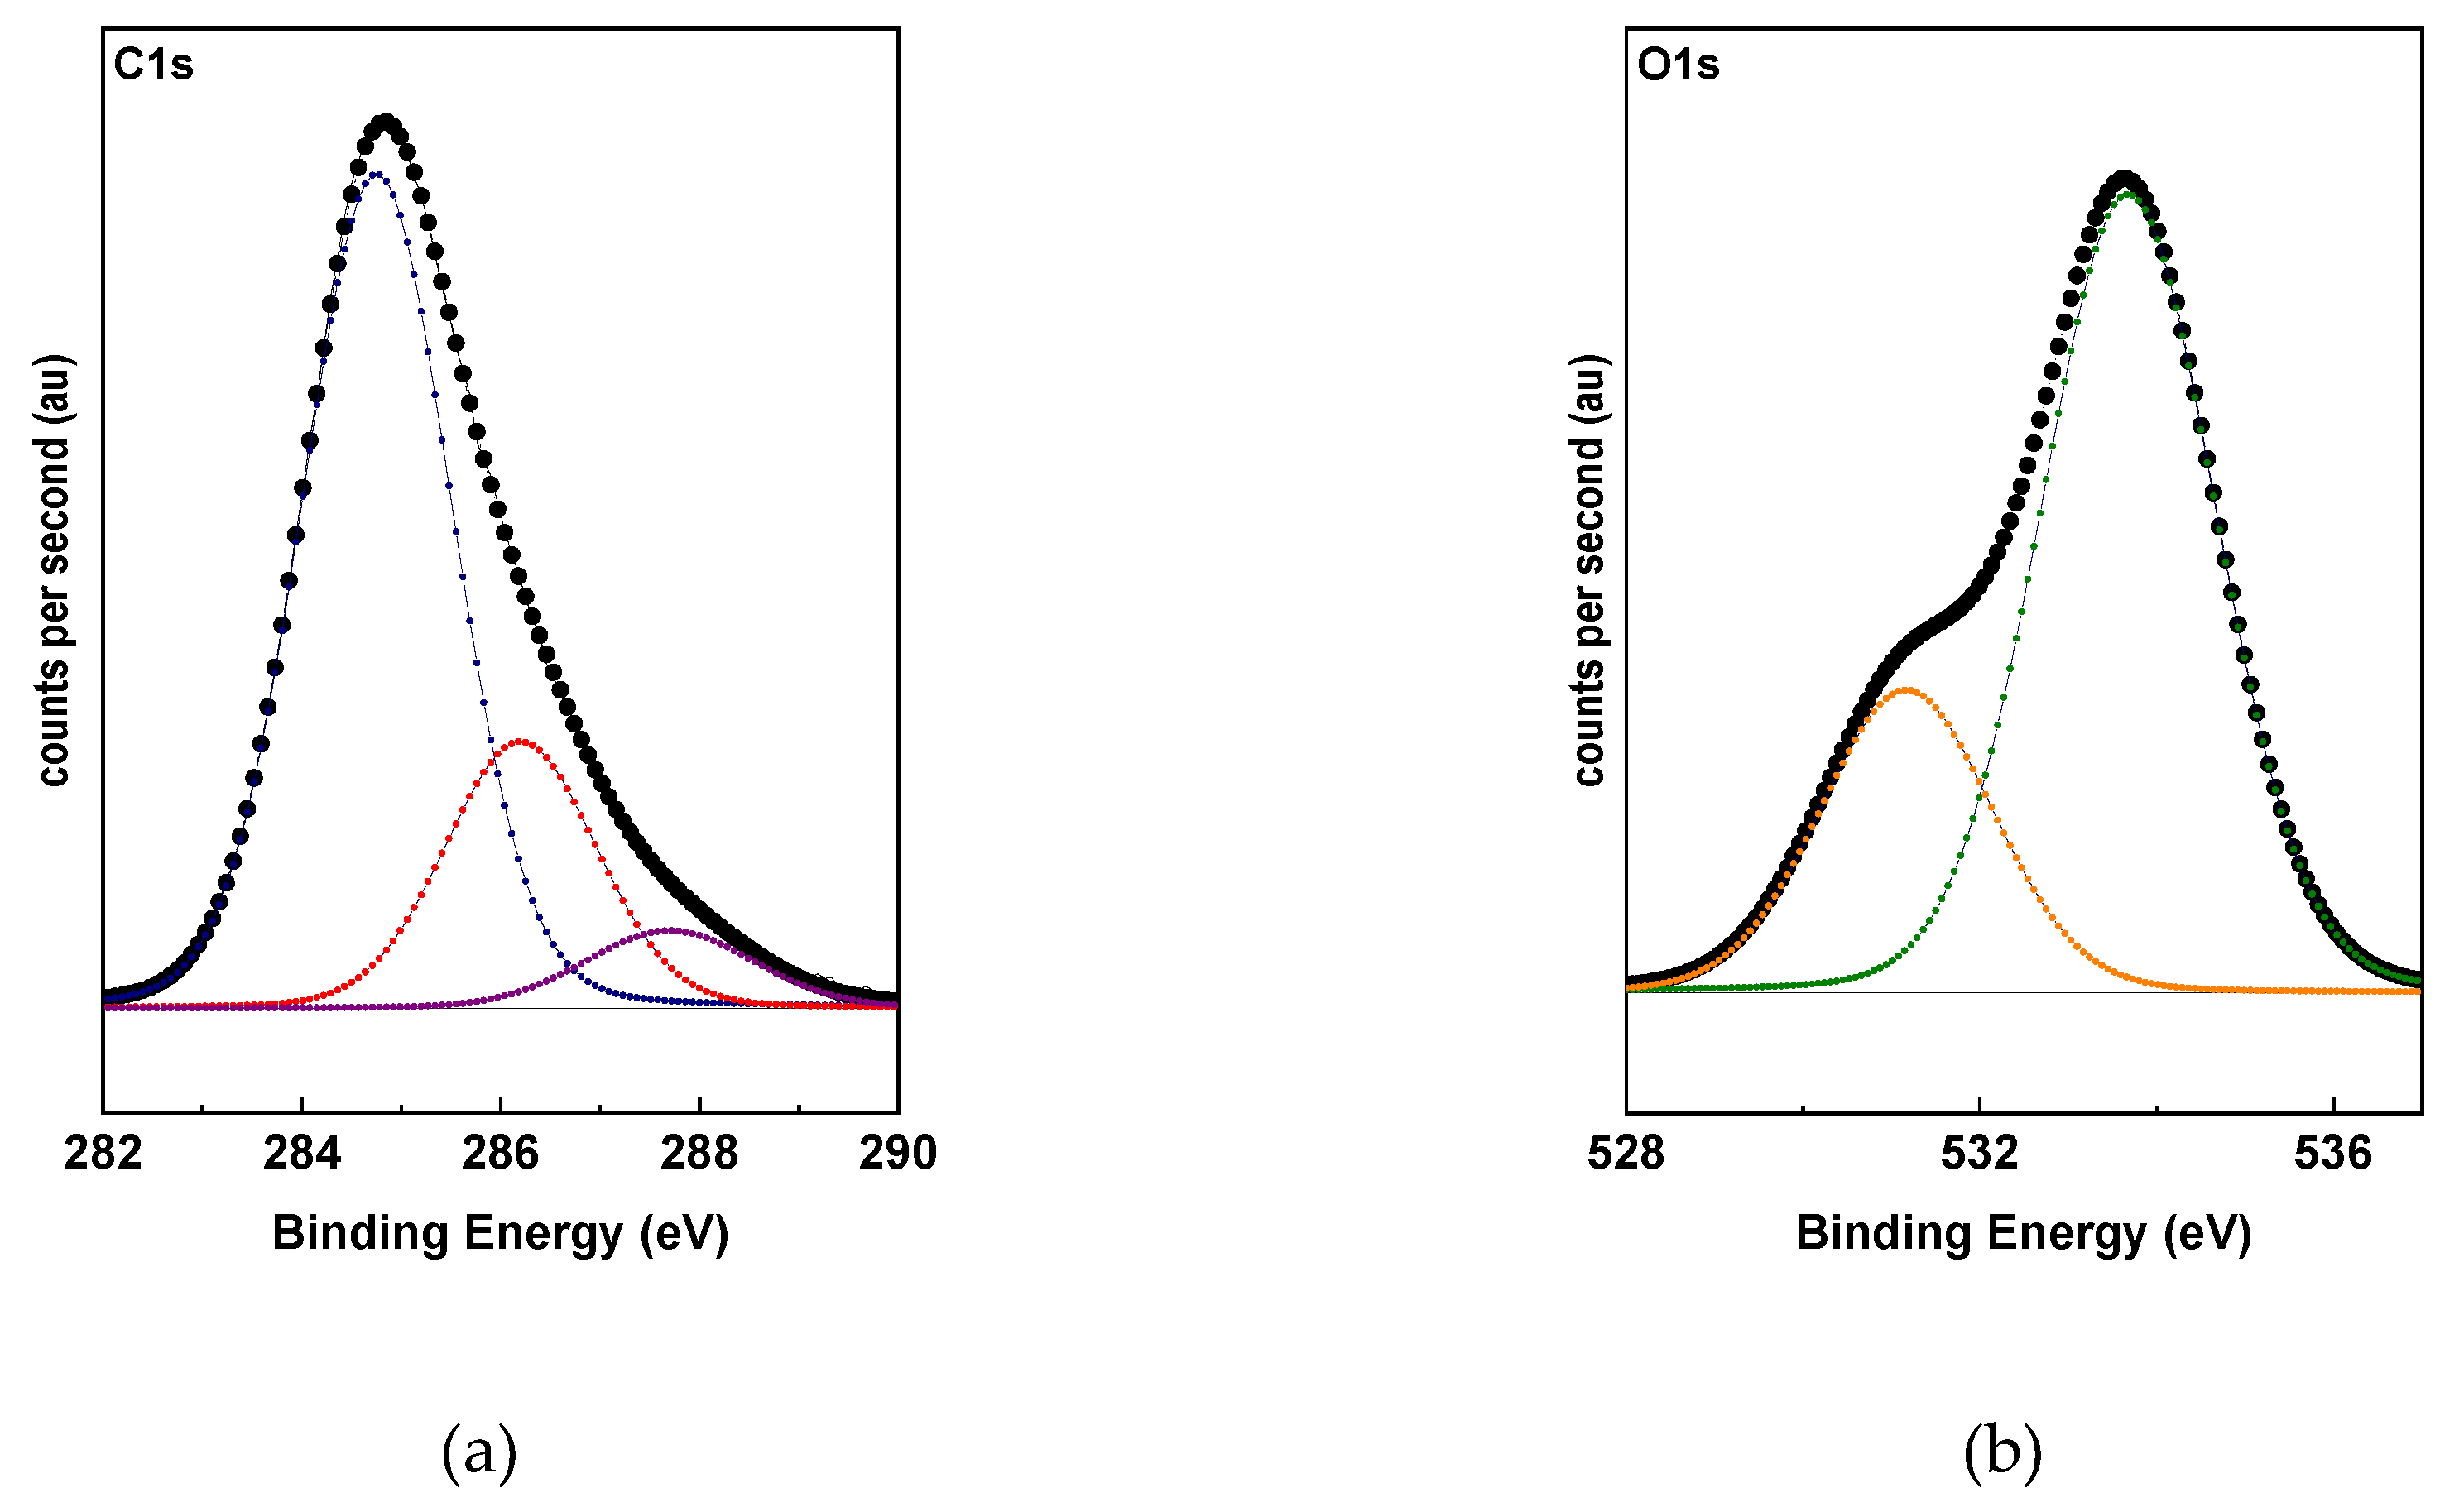
3.1.3. X-ray Photoelectron Spectroscopy
3.2. Characterization of Electrospun Meshes
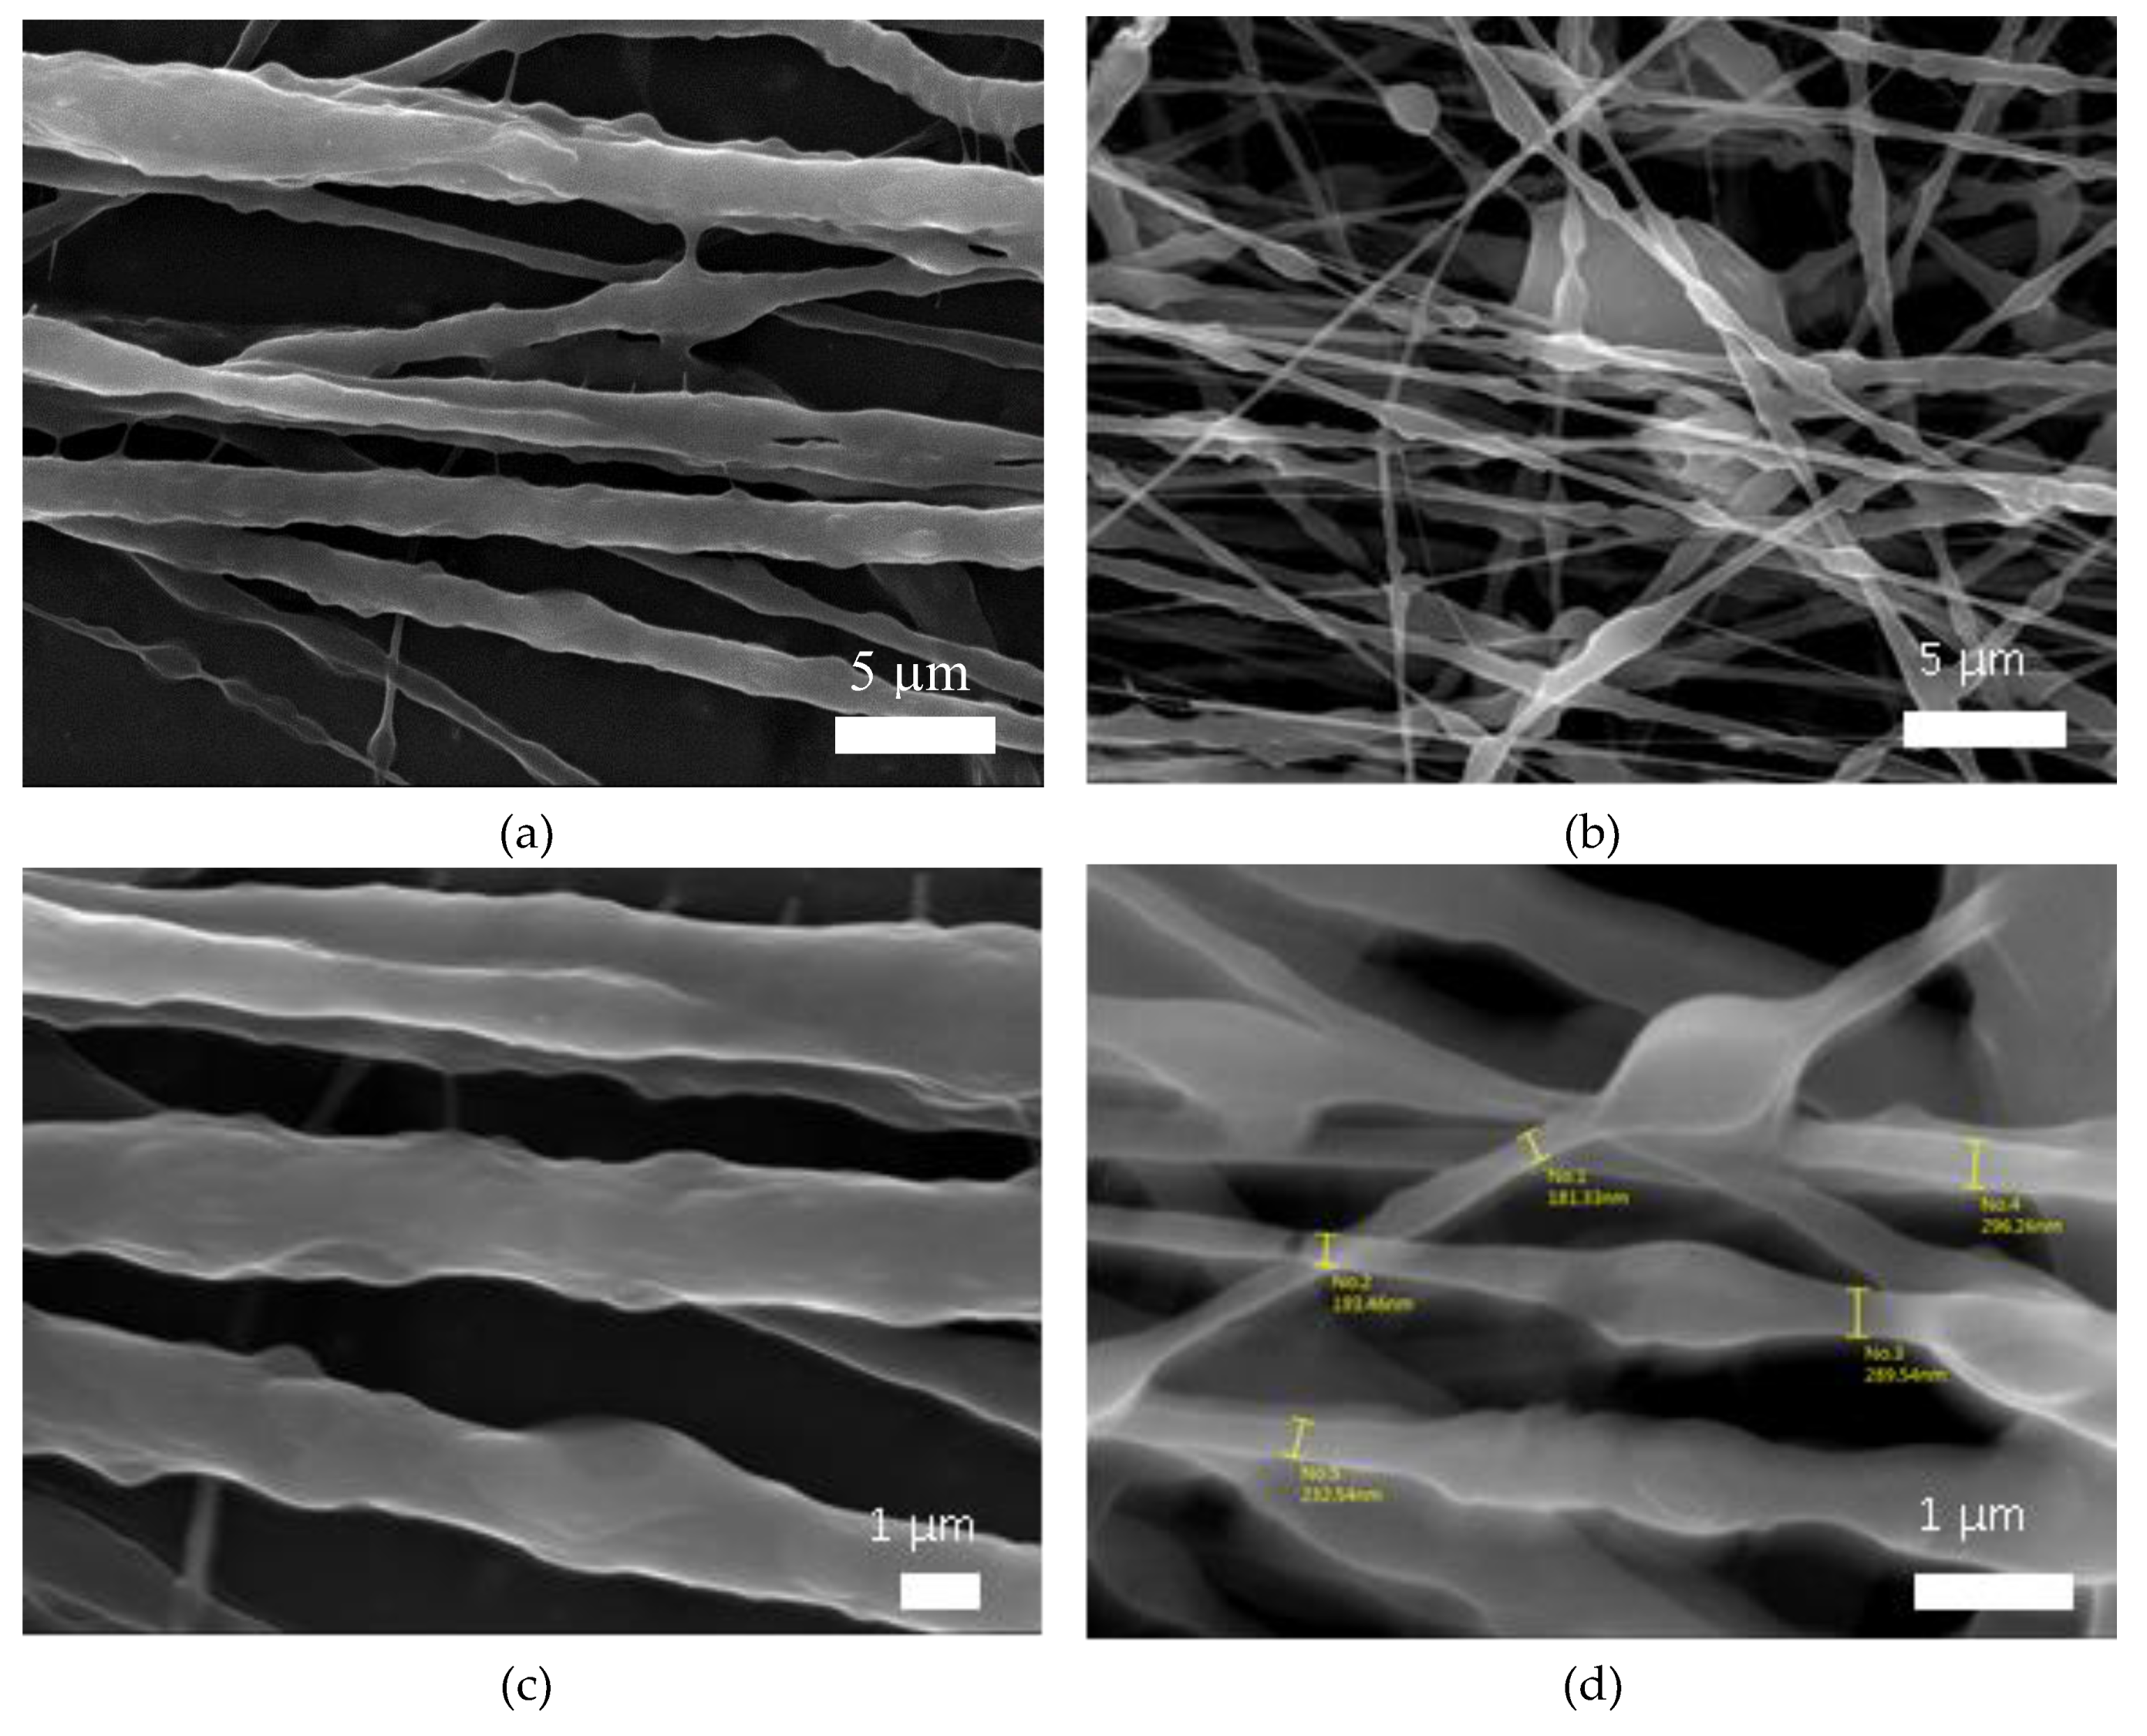
3.2.1. Scanning Electron Microscopy
3.2.2. Elemental Analysis Using Scanning Electron Microscopy
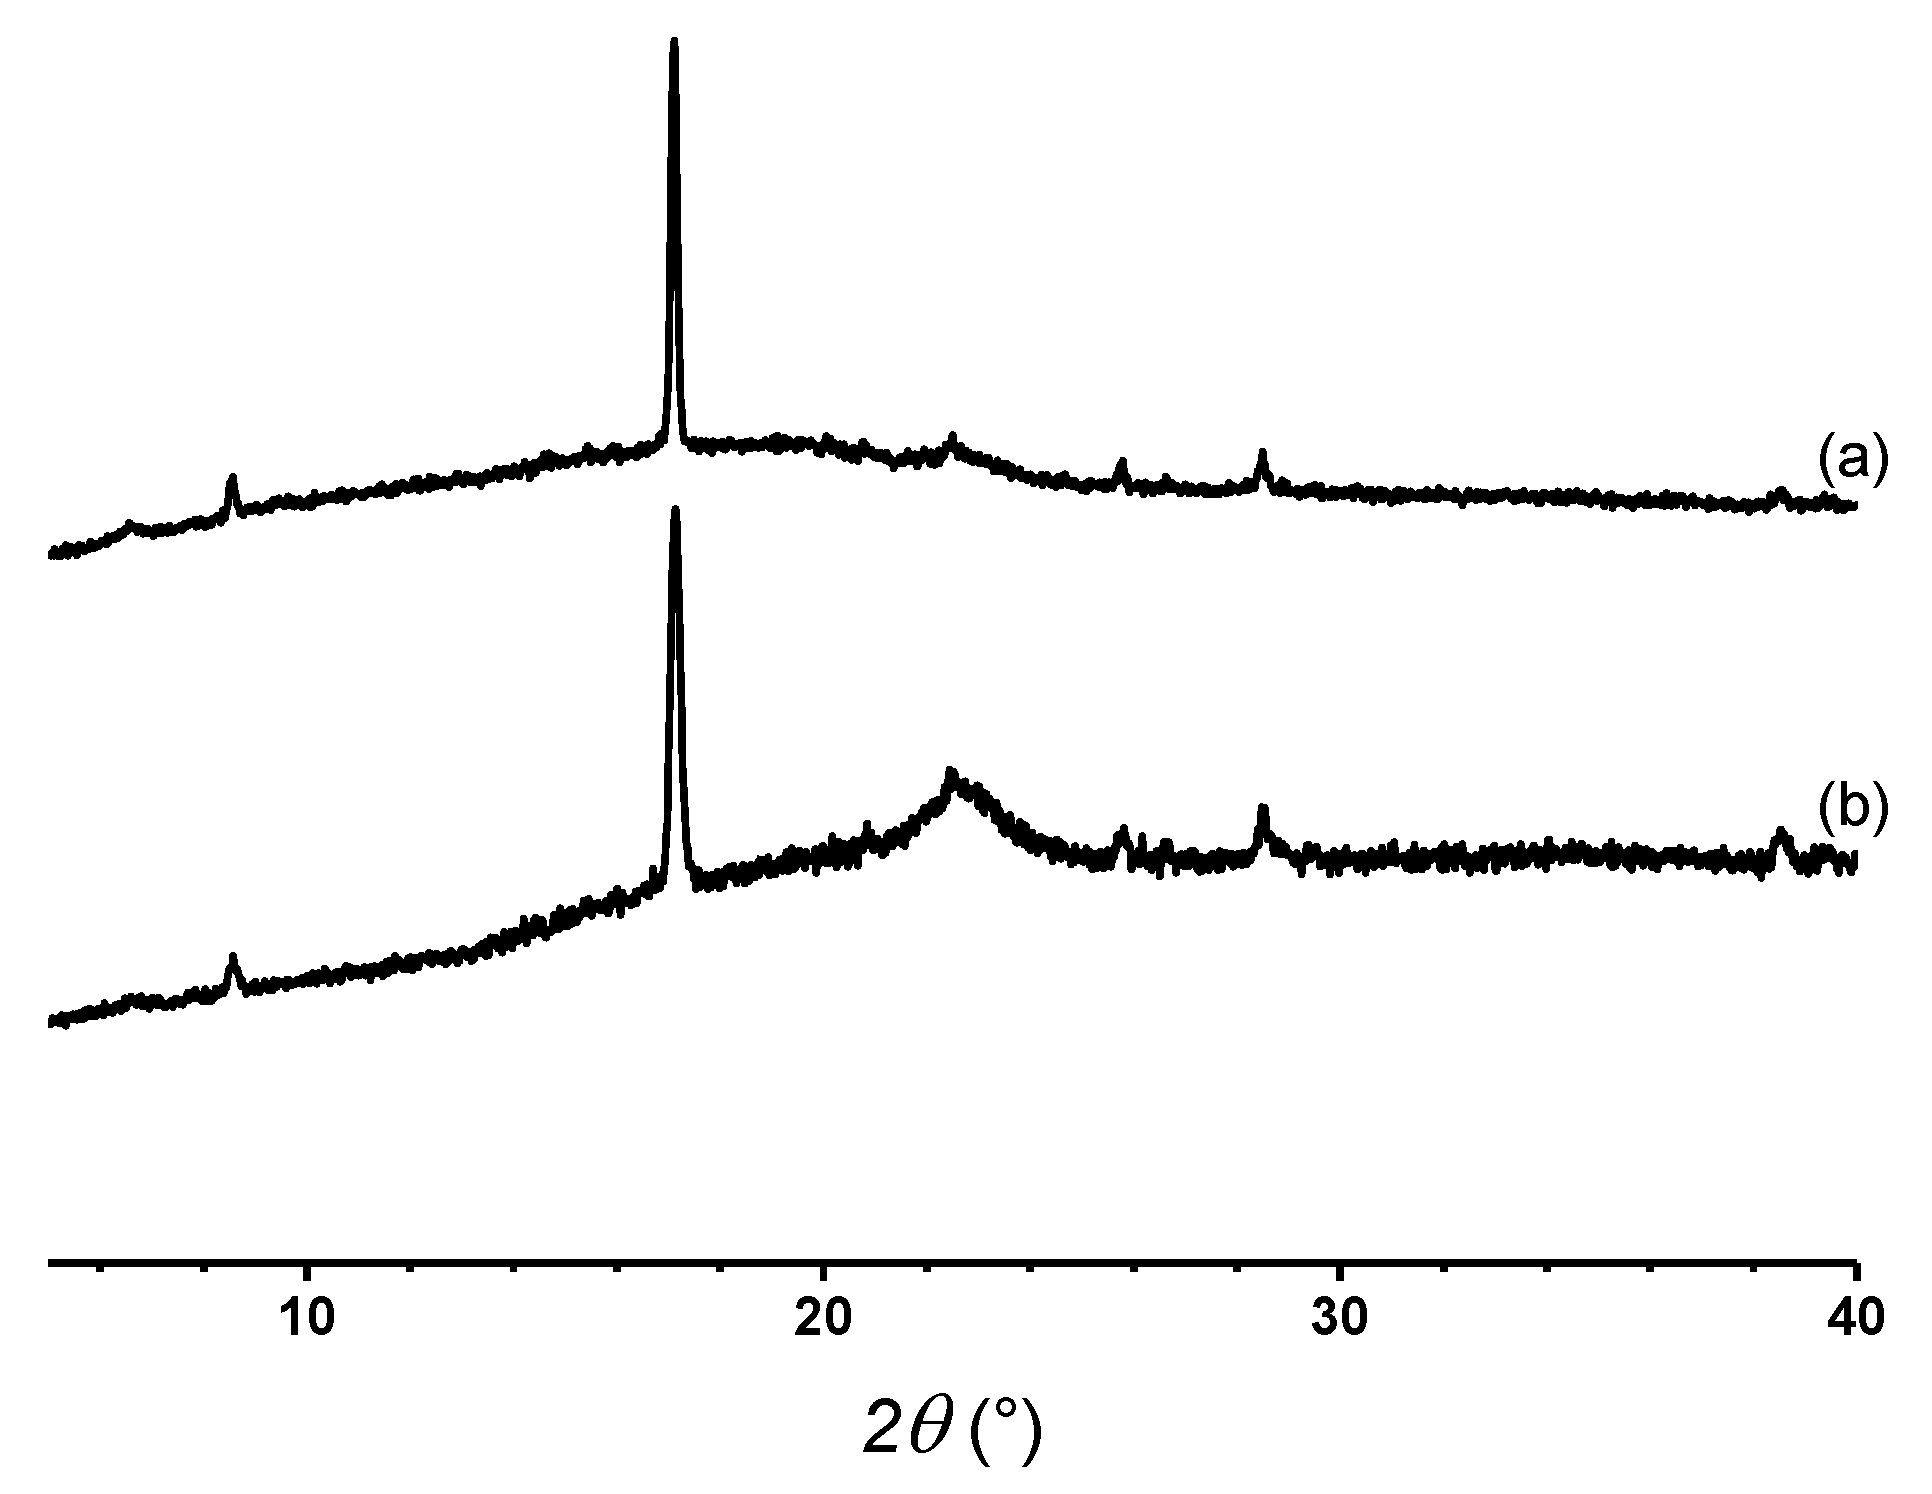
3.2.3. X-Ray Diffraction Analysis of Fibers
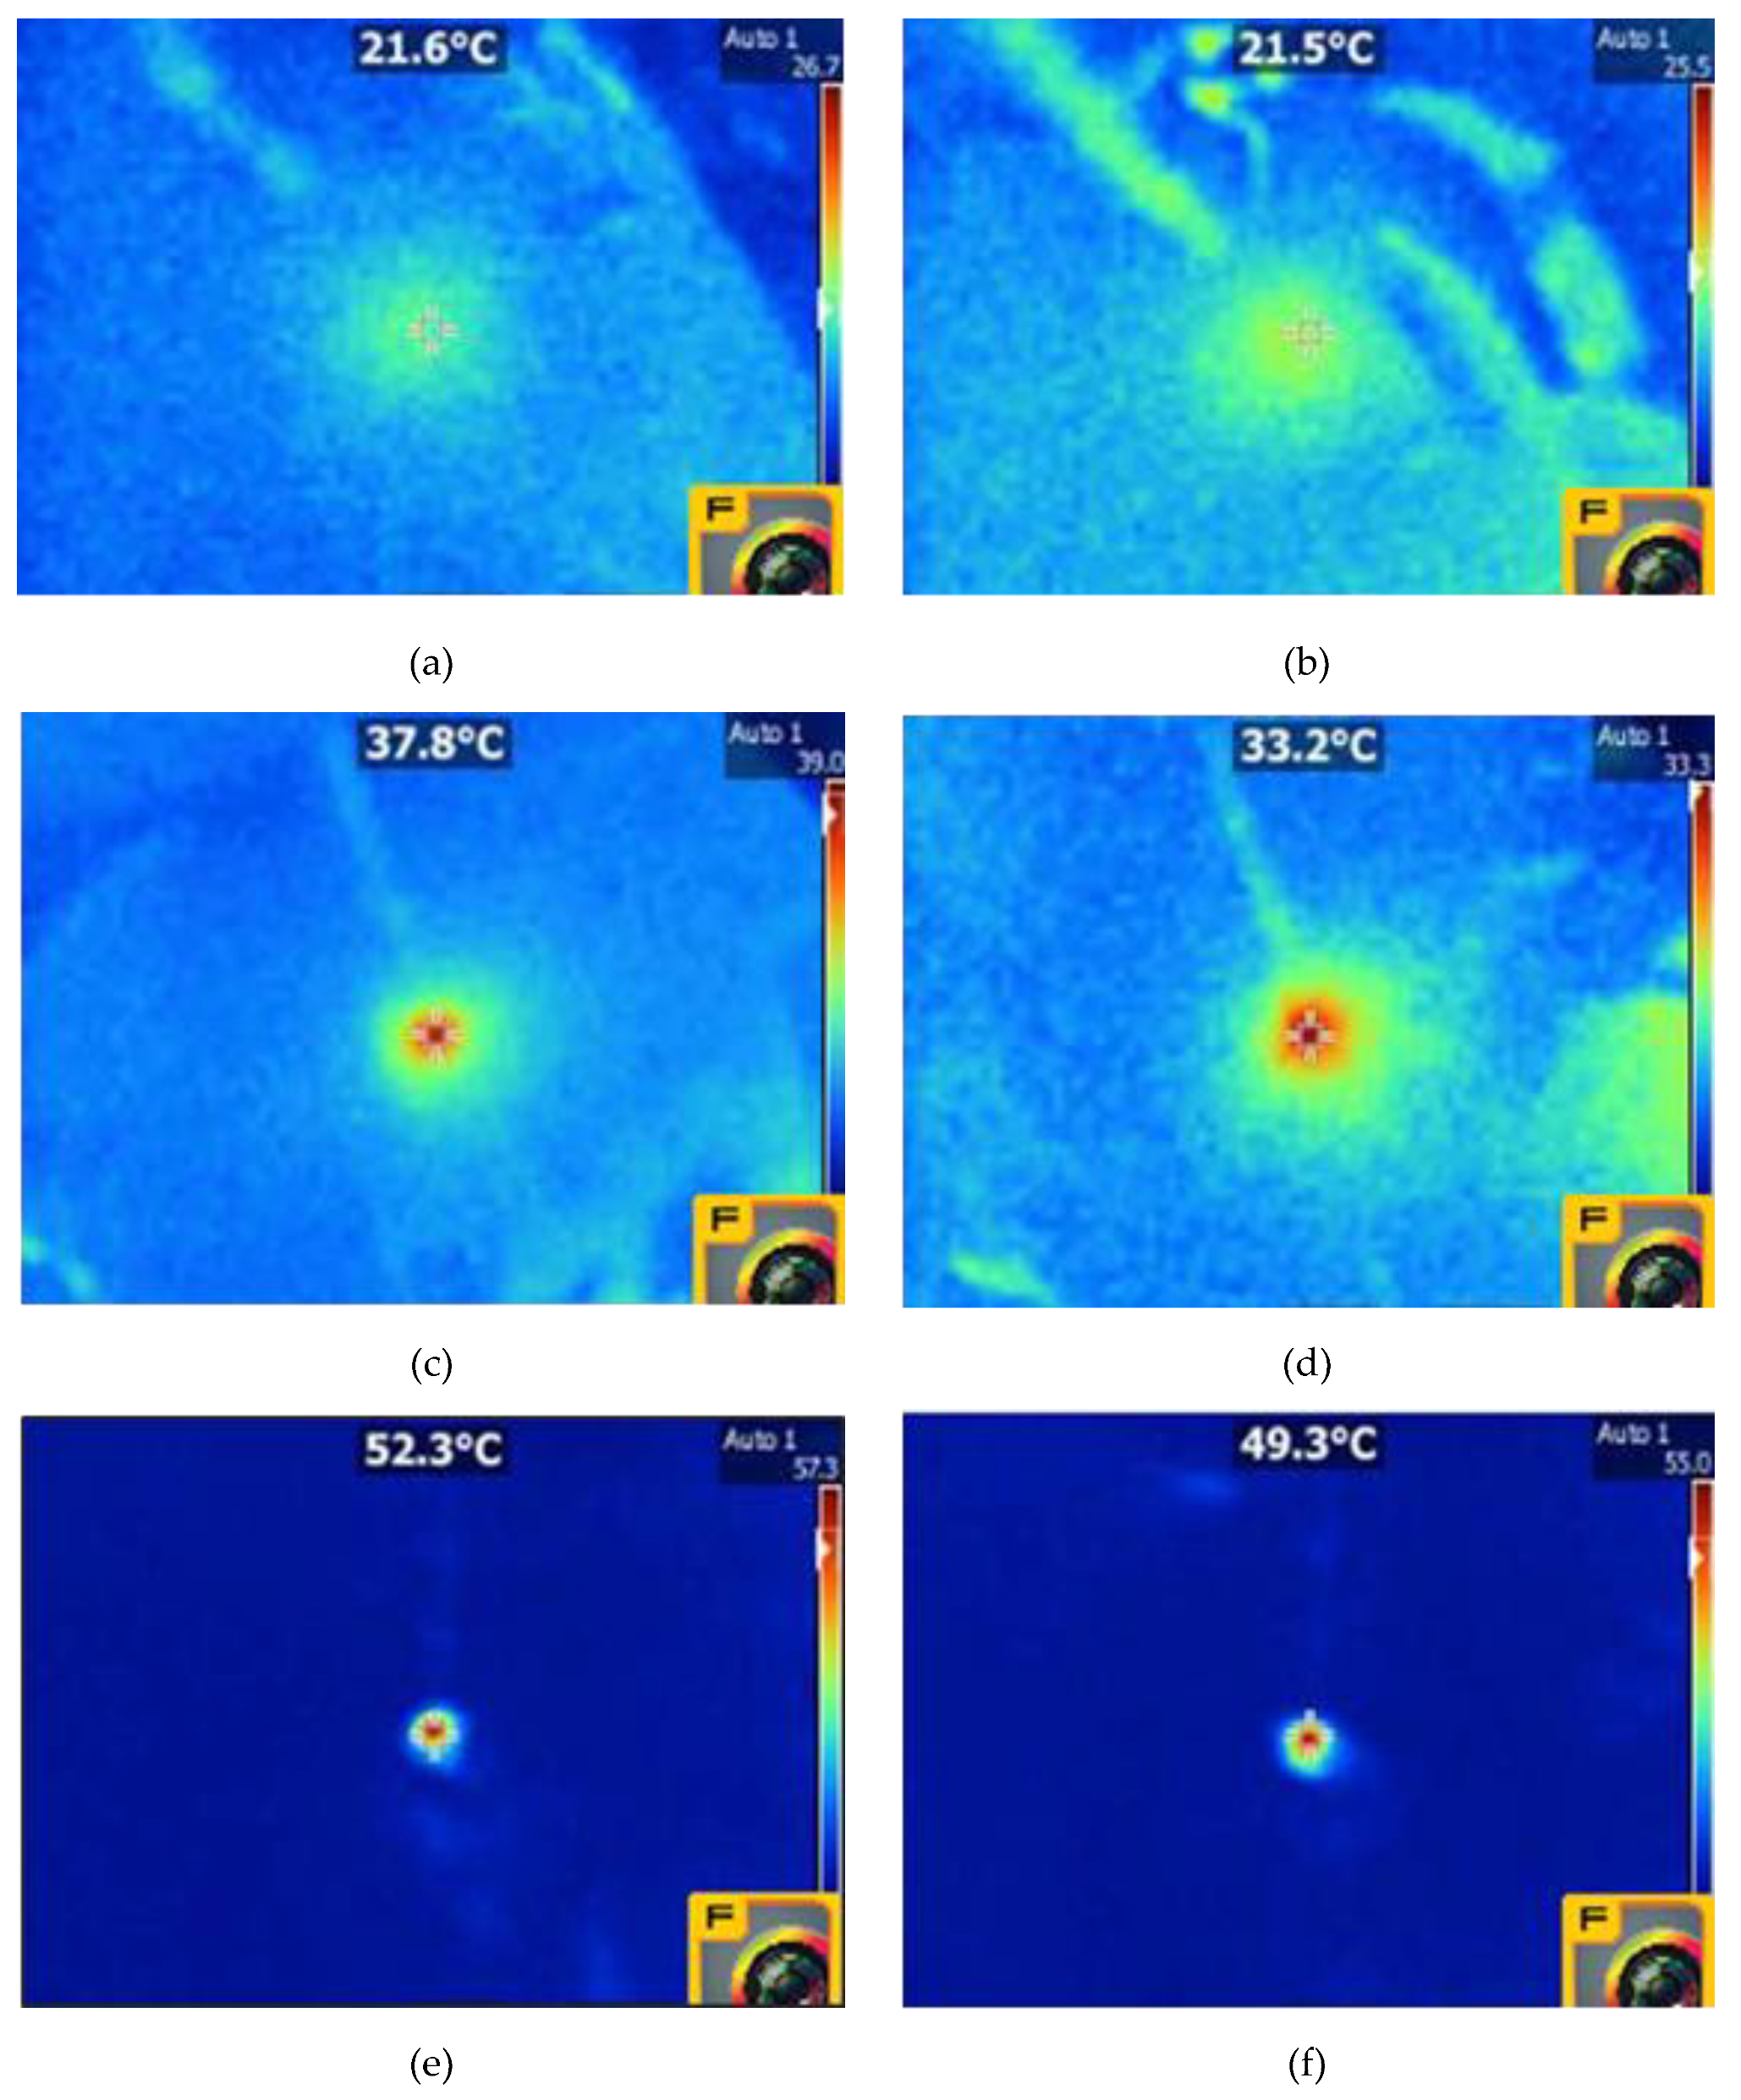
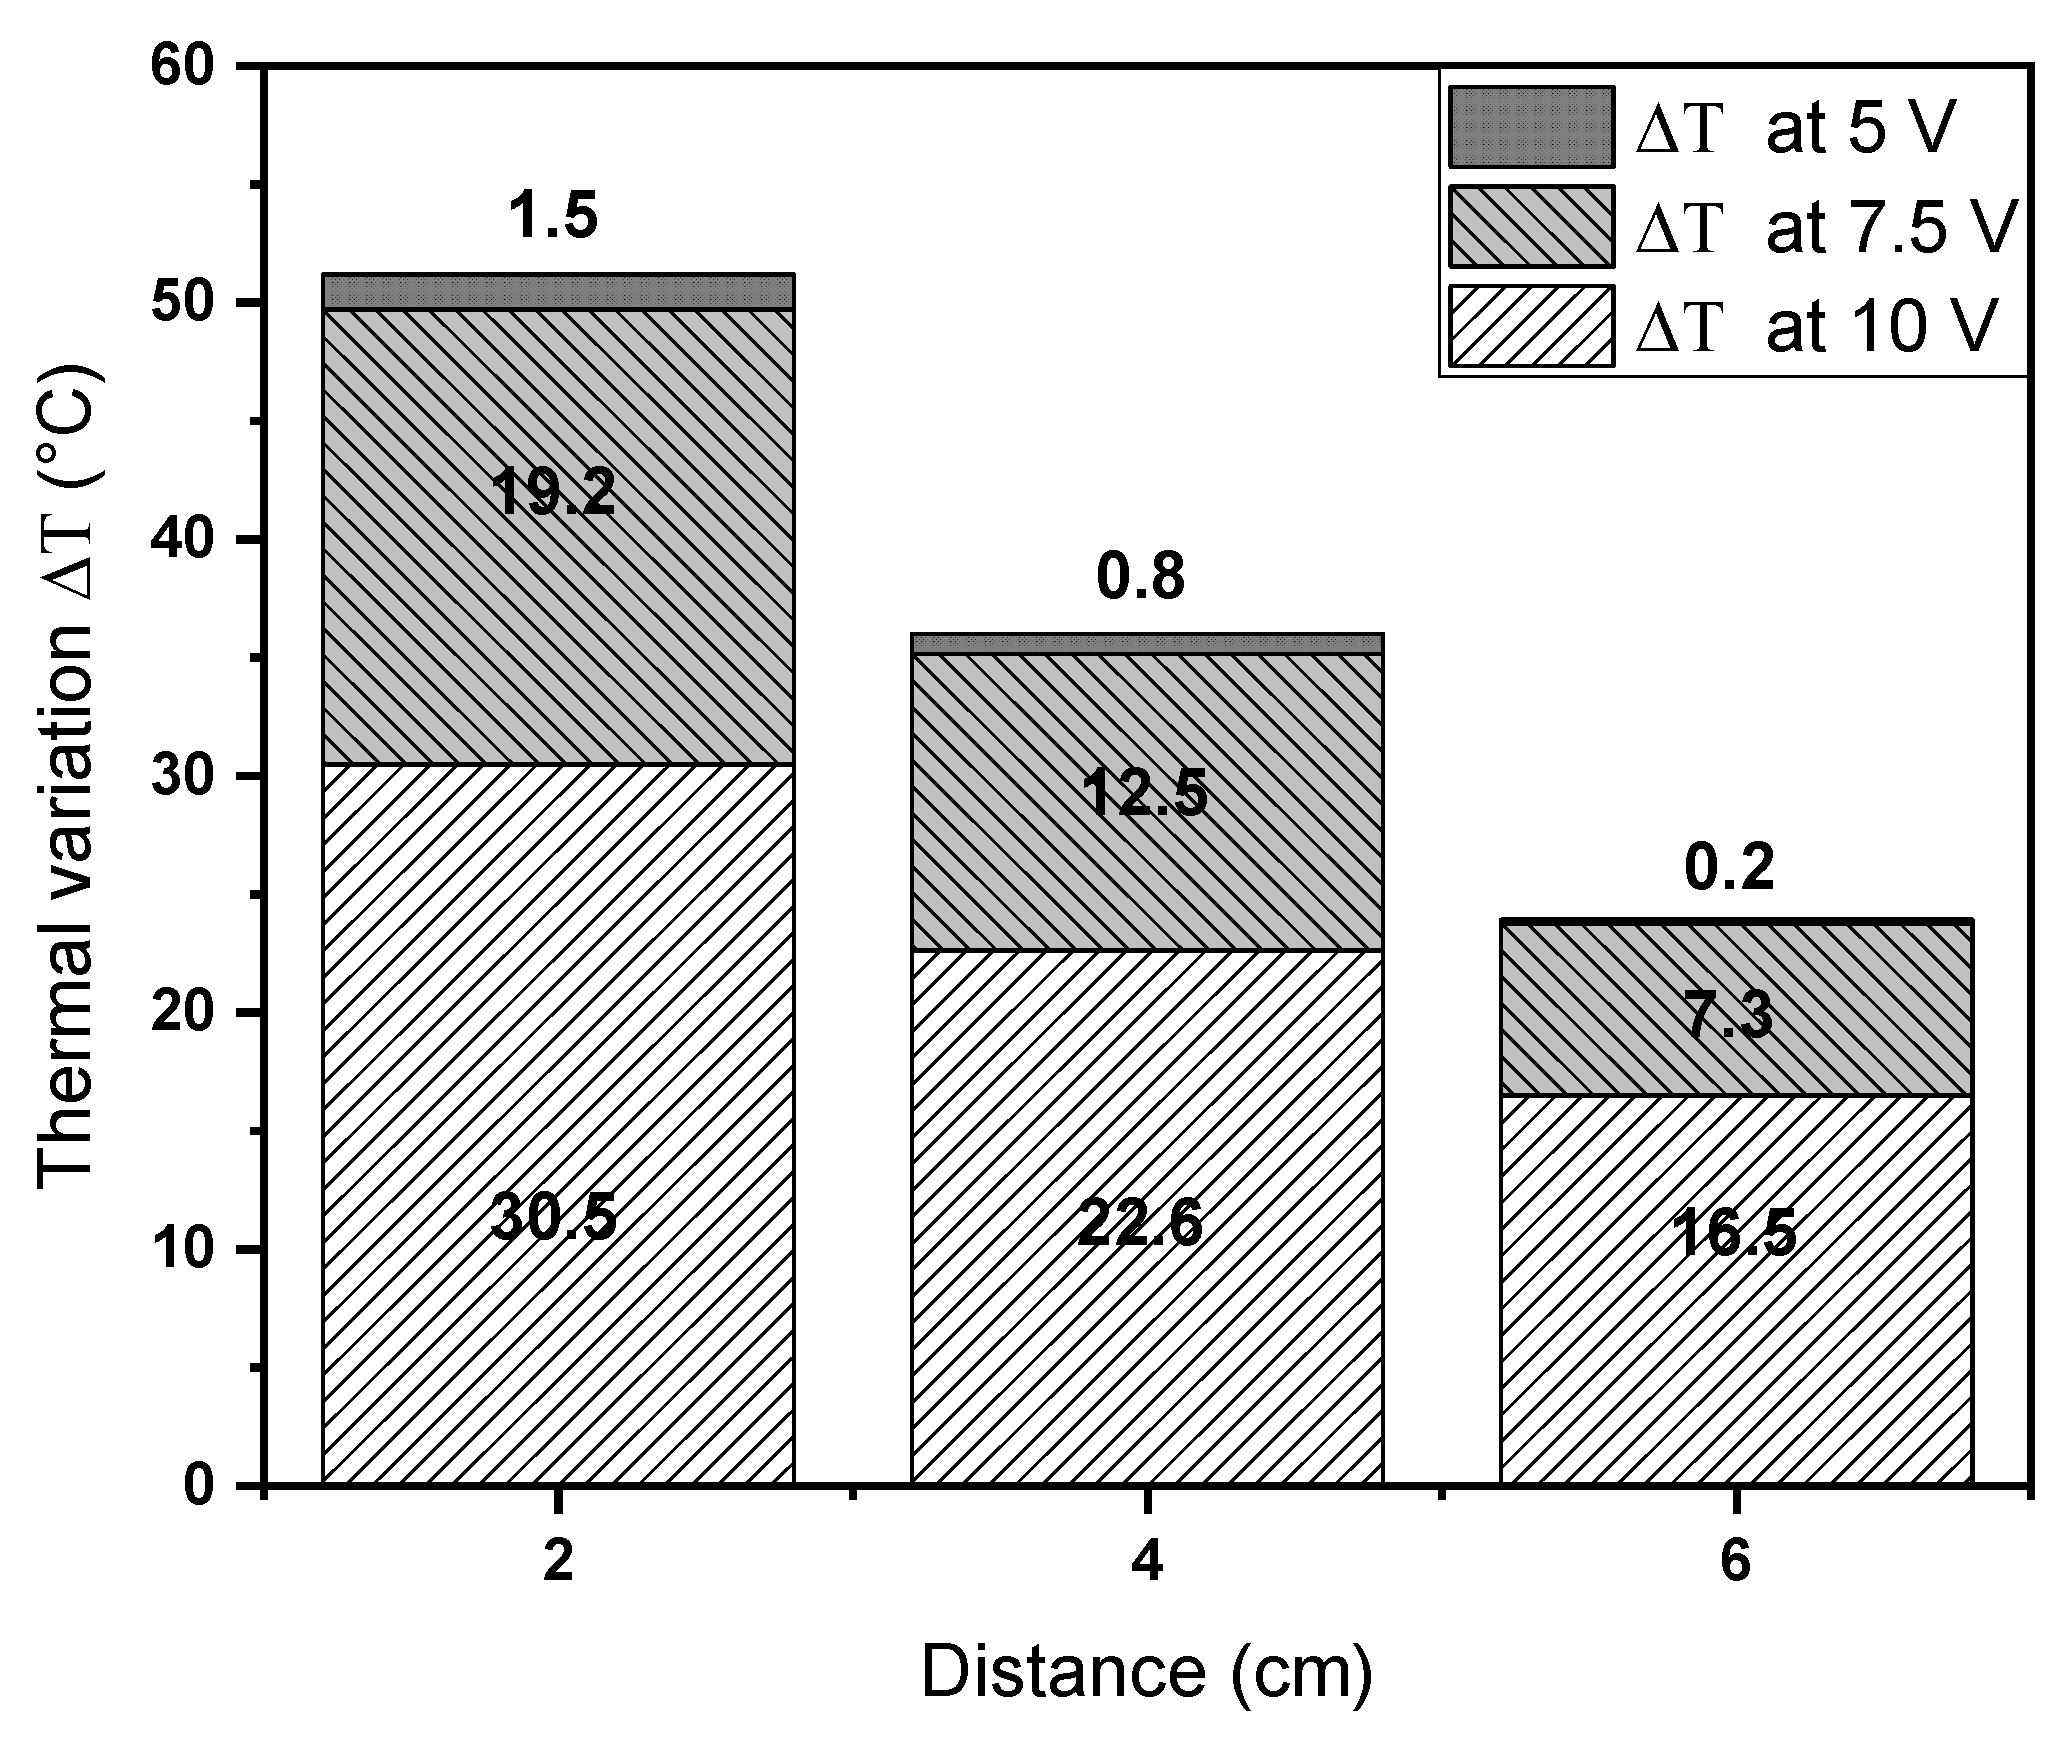
3.2.4. Hyperthermia Evaluation of the Electrospun Meshes
4. Conclusions
Author Contributions
Funding
Conflicts of Interest
References
- Katsnelson, M.I. Graphene: Carbon in two dimensions. Mater. Today 2007, 10, 20–27. [Google Scholar] [CrossRef]
- Novoselov, K.S.; Geim, A.K.; Morozov, S.V.; Jiang, D.; Zhang, Y.; Dubonos, S.V.; Grigorieva, I.V.; Firsov, A.A. Electric Field Effect in Atomically Thin Carbon Films. Science 2004, 306, 666–669. [Google Scholar] [CrossRef] [PubMed] [Green Version]
- Shang, L.; Qi, Y.; Lu, H.; Pei, H.; Li, Y.; Qu, L.; Wu, Z.; Zhang, W. Chapter 7– Graphene and Graphene Oxide for Tissue Engineering and Regeneration. In Micro and Nano Technologies; Cui, W., Zhao, X., Eds.; Elsevier: Amsterdam, The Netherlands, 2019; pp. 165–185. ISBN 978-0-12-815341-3. [Google Scholar]
- Chen, H.-Y.; Ghosh, S.; Ponnusamy, V.K.; Chattopadhyay, S. Graphene oxide as broadband hyperthermic agent and chemo-photothermal dissolution of kidney-stone mimicking calcium oxalate crystals. J. Photochem. Photobiol. A Chem. 2020, 405, 112917. [Google Scholar] [CrossRef]
- Lim, J.H.; Kim, D.E.; Kim, E.-J.; Ahrberg, C.D.; Chung, B.G. Functional graphene oxide-based nanosheets for photothermal therapy. Macromol. Res. 2018, 26, 557–565. [Google Scholar] [CrossRef]
- Skandalakis, G.P.; Rivera, D.R.; Rizea, C.D.; Bouras, A.; Jesu Raj, J.G.; Bozec, D.; Hadjipanayis, C.G. Hyperthermia treatment advances for brain tumors. Int. J. Hyperth. 2020, 37, 3–19. [Google Scholar] [CrossRef] [PubMed]
- Podolska, M.J.; Barras, A.; Alexiou, C.; Frey, B.; Gaipl, U.; Boukherroub, R.; Szunerits, S.; Janko, C.; Muñoz, L.E. Graphene oxide nanosheets for localized hyperthermia—Physicochemical characterization, biocompatibility, and induction of tumor cell death. Cells 2020, 9, 776. [Google Scholar] [CrossRef] [PubMed] [Green Version]
- Li, Z.; Chen, Y.; Yang, Y.; Yu, Y.; Zhang, Y.; Zhu, D.; Yu, X.; Ouyang, X.; Xie, Z.; Zhao, Y.; et al. Recent advances in nanomaterials-based chemo-photothermal combination therapy for imporving cancer treatment. Front. Bioeng. Biotechnol. 2019, 7, 293. [Google Scholar] [CrossRef] [PubMed]
- Vazquez-Moreno, J.M.; Yuste-Sanchez, V.; Sanchez-Hidalgo, R.; Verdejo, R.; Lopez-Manchado, M.A.; Fernández-García, L.; Blanco, C.; Menéndez, R. Customizing thermally-reduced graphene oxides for electrically conductive or mechanical reinforced epoxy nanocomposites. Eur. Polym. J. 2017. [Google Scholar] [CrossRef]
- Oliveira, A.E.F.; Braga, G.B.; Tarley, C.R.T.; Pereira, A.C. Thermally reduced graphene oxide: Synthesis, studies and characterization. J. Mater. Sci. 2018, 53, 12005–12015. [Google Scholar] [CrossRef]
- Yang, K.; Wan, J.; Zhang, S.; Tian, B.; Zhang, Y.; Liu, Z. The influence of surface chemistry and size of nanoscale graphene oxide on photothermal therapy of cancer using ultra-low laser power. Biomaterials 2012, 33, 2206–2214. [Google Scholar] [CrossRef]
- Nomura, S.; Morimoto, Y.; Tsujimoto, H.; Arake, M.; Harada, M.; Saitoh, D.; Hara, I.; Ozeki, E.; Satoh, A.; Takayama, E.; et al. Highly reliable, targeted photothermal cancer therapy combined with thermal dosimetry using a near-infrared absorbent. Sci. Rep. 2020, 10, 9765. [Google Scholar] [CrossRef] [PubMed]
- Liu, T.-M.; Conde, J.; Lipiński, T.; Bednarkiewicz, A.; Huang, C.-C. Smart NIR linear and nonlinear optical nanomaterials for cancer theranostics: Prospects in photomedicine. Prog. Mater. Sci. 2017, 88, 89–135. [Google Scholar] [CrossRef]
- Elbadawi, A.A.; Alsabah, Y.A.; Abuelhassan, H.H. Chapter 7—Physical and Electrical Properties of Gum Arabic. In Gum Arabic; Mariod, A.A., Ed.; Academic Press: London, UK, 2018; pp. 75–91. ISBN 978-0-12-812002-6. [Google Scholar]
- Cornish, K. Similarities and differences in rubber biochemistry among plant species. Phytochemistry 2001, 57, 1123–1134. [Google Scholar] [CrossRef]
- Mallakpour, S.; Shamsaddinimotlagh, S. Employment of ultrasonic waves for the preparation of PVA/TiO2-BSA nanocomposites: Mechanical, thermal, and optical properties. J. Appl. Polym. Sci. 2018, 135, 46558. [Google Scholar] [CrossRef]
- Teo, W.E.; Ramakrishna, S. A review on electrospinning design and nanofibre assemblies. Nanotechnology 2006, 17, R89–R106. [Google Scholar] [CrossRef]
- Kumbar, S.; Laurencin, C.; Deng, M. (Eds.) Natural and Synthetic Biomedical Polymers; Elsevier: Oxford, UK, 2014; p. 420. ISBN 978-0-12-396983-5. [Google Scholar]
- Xie, J.; Li, X.; Xia, Y. Putting electrospun nanofibers to work for biomedical research. Macromol. Rapid Commun. 2008, 29, 11775–11792. [Google Scholar] [CrossRef] [Green Version]
- Chen, Z.; Chen, Z.; Zhang, A.; HU, J.; Wang, X.; Yang, Z. Electrospun nanofibers for cancer diagnosis and therapy. Biomater. Sci. 2016, 4, 922–932. [Google Scholar] [CrossRef]
- Raghavendra, G.M.; Varaprasad, K.; Jayaramudu, T. Chapter 2—Biomaterials: Design, Development and Biomedical Applications. In Nanotechnology Applications for Tissue Engineering; Thomas, S., Grohens, Y., Ninan, N., Eds.; William Andrew Publishing: Oxford, UK, 2015; pp. 21–44. ISBN 978-0-323-32889-0. [Google Scholar]
- Mauro, N.; Scialabba, C.; Pitarresi, G.; Giammona, G. Enhanced adhesion and in situ photothermal ablation of cancer cells in surface-functionalized electrospun microfiber scaffold with graphene oxide. Int. J. Pharm. 2017, 526, 167–177. [Google Scholar] [CrossRef]
- Cai, Y.; Si, W.; Hunag, W.; Chen, P.; Shao, J.; Dong, X. Organic dye based nanoparticles for cancer phototheranostics. Small 2018, 14, 1704247. [Google Scholar] [CrossRef]
- Fu, Y.; Li, X.; Ren, Z.; Mao, C.; Han, G. Multifunctional electrospun nanofibers for enhancing localized cancer treatment. Small 2018, 14, 1801183. [Google Scholar] [CrossRef]
- Chen, S.; Boda, S.K.; Batra, S.K.; Li, X.; Xie, J. Emerging roles of electrospun nanofibers in cancer research. Adv. Healthc. Mater. 2018, 7, 1701024. [Google Scholar] [CrossRef]
- Yang, S.; Lei, P.; Shan, Y.; Zhang, D. Preparation and characterization of antibacterial electrospun chitosan/poly (vinyl alcohol)/graphene oxide composite nanofibrous membrane. Appl. Surf. Sci. 2018, 435, 832–840. [Google Scholar] [CrossRef]
- Zhao, J.; Zhu, Y.; Ye, C.; Chen, Y.; Wang, S.; Zou, D.; Li, Z. Photothermal trasnforming agent and chemotherapeutic co-loaded electrospun nanofibers for tumor treatment. Int. J. Nanomed. 2019, 14, 3893–3909. [Google Scholar] [CrossRef] [PubMed] [Green Version]
- Puech, P.; Kandara, M.; Paredes, G.; Moulin, L.; Weiss-Hortala, E.; Kundu, A.; Ratel-Ramond, N.; Plewa, J.-M.; Pellenq, R.; Monthioux, M. Analyzing the Raman spectra of graphenic carbon materials from Kerogens to nanotubes: What type of information can be extracted from defect bands? C—J. Carbon Res. 2019, 5, 69. [Google Scholar] [CrossRef] [Green Version]
- Wu, J.-B.; Lin, M.-L.; Cong, X.; Liu, H.-N.; Tan, P.-H. Raman spectroscopy of graphene-based materials and its applications in related devices. Chem. Soc. Rev. 2018, 47, 1822–1873. [Google Scholar] [CrossRef] [Green Version]
- Ferrari, A.C.; Basko, D.M. Raman spectroscopy as a versatile tool for studying the properties of graphene. Nat. Nanotechnol. 2013, 8, 235–246. [Google Scholar] [CrossRef] [Green Version]
- Botas, C.; Álvarez, P.; Blanco, P.; Granda, M.; Blanco, C.; Santamaría, R.; Romasanta, L.J.; Verdejo, R.; López-Manchado, M.A.; Menéndez, R. Graphene materials with different structures prepared from the same graphite by the Hummers and Brodie methods. Carbon N. Y. 2013, 65, 156–164. [Google Scholar] [CrossRef] [Green Version]
- Fan, Y.; Guo, C.; Zhu, Z.; Xu, W.; Wu, F.; Yuan, X.; Qin, S. Monolayer-graphene-based broadband and wide-angle perfect absorption structures in the near infrared. Sci. Rep. 2018, 8, 13709. [Google Scholar] [CrossRef]
- Iwashita, N.; Park, C.R.; Fujimoto, H.; Shiraishi, M.; Inagaki, M. Specification for a standard procedure of X-ray diffraction measurements on carbon materials. Carbon N. Y. 2004, 42, 701–714. [Google Scholar] [CrossRef]
- Stobinski, L.; Lesiak, B.; Malolepszy, A.; Mazurkiewicz, M.; Mierzwa, B.; Zemek, J.; Jiricek, P.; Bieloshapka, I. Graphene oxide and reduced graphene oxide studied by the XRD, TEM and electron spectroscopy methods. J. Electron Spectros. Relat. Phenom. 2014, 195, 145–154. [Google Scholar] [CrossRef]
- Bianco, A.; Cheng, H.-M.; Enoki, T.; Gogotsi, Y.; Hurt, R.H.; Koratkar, N.; Kyotani, T.; Monthioux, M.; Park, C.R.; Tascon, J.M.D.; et al. All in the graphene family—A recommended nomenclature for two-dimensional carbon materials. Carbon N. Y. 2013, 65, 1–6. [Google Scholar] [CrossRef]
- Liu, G.; Wang, L.; Wang, B.; Gao, T.; Wang, D. A reduced graphene oxide modified metallic cobalt composite with superior electrochemical performance for supercapacitors. RSC Adv. 2015, 5, 63553–63560. [Google Scholar] [CrossRef]
- Chen, L.; Li, W.; Liu, Y.; Leng, J. Nanocomposites of epoxy-based shape memory polymer and thermally reduced graphite oxide: Mechanical, thermal and shape memory characterizations. Compos. Part B Eng. 2016, 91, 75–82. [Google Scholar] [CrossRef]
- Maeda, H.; Kawai, T.; Sekii, S. Intra- and intermolecular hydrogen bonds in polyvinyl alcohol solutions. J. Polym. Sci. 1959, 35, 288–292. [Google Scholar] [CrossRef]


| Sample | Signal | Binding Energy (eV) | Assignments | Area (%) | O/C Ratio |
|---|---|---|---|---|---|
| TrGO | C 1s | 284.8 | C = C sp2 C-C sp3 | 70 | 0.053 |
| 286.2 | C*-O-C*/C*-O-H | 23 | |||
| 287.5 | -C* = O | 7 | |||
| O 1s | 531.3 | -C = O* | 27 | ||
| 533.7 | C-O*-C/C-O*-H | 73 |
| Electric Potential (V) | Distance (cm) | Average Temperature (°C) a | Standard Deviation a | Average Temperature (°C) b | Standard Deviation b |
|---|---|---|---|---|---|
| 5 | 2 | 19.2 | 0.57 | 19 | 0.55 |
| 4 | 19.2 | 0.31 | 19 | 0.26 | |
| 6 | 18.6 | 0.25 | 18.5 | 0.32 | |
| 7.5 | 2 | 19.8 | 0.25 | 19.8 | 0.38 |
| 4 | 19.4 | 0.21 | 19.2 | 0.21 | |
| 6 | 18.9 | 0.44 | 18.9 | 0.44 | |
| 10 | 2 | 21.2 | 0.4 | 20.9 | 0.57 |
| 4 | 20.3 | 0.12 | 19.9 | 0.32 | |
| 6 | 19.7 | 0.45 | 19.4 | 0.21 |
| Electric Potential (V) | Distance (cm) | Average Temperature (°C) a | Standard Deviation a | Average Temperature (°C) b | Standard Deviation b |
|---|---|---|---|---|---|
| 5 | 2 | 20.7 | 0.36 | 20.5 | 0.26 |
| 4 | 19.5 | 0.46 | 19.3 | 0.21 | |
| 6 | 18.6 | 0.31 | 18.7 | 0.35 | |
| 7.5 | 2 | 34.3 | 0.46 | 30.7 | 0.3 |
| 4 | 29.2 | 0.56 | 26 | 0.21 | |
| 6 | 23.3 | 0.26 | 22.6 | 0.15 | |
| 10 | 2 | 37.3 | 0.47 | 33.1 | 0.1 |
| 4 | 33 | 0.7 | 29.5 | 0.35 | |
| 6 | 28.7 | 0.75 | 25 | 0.32 |
| Electric Potential (V) | Distance (cm) | Average Temperature (°C) a | Standard Deviation a | Average Temperature (°C) b | Standard Deviation b |
|---|---|---|---|---|---|
| 5 | 2 | 20.7 | 0.65 | 20.7 | 0.4 |
| 4 | 19.9 | 0.45 | 18.4 | 0.26 | |
| 6 | 18.9 | 0.31 | 18.4 | 0.25 | |
| 7.5 | 2 | 39 | 0.15 | 37.9 | 0.31 |
| 4 | 31.7 | 0.45 | 31.8 | 0.31 | |
| 6 | 26.3 | 0.5 | 25.8 | 0.15 | |
| 10 | 2 | 51.3 | 0.71 | 48.6 | 0.32 |
| 4 | 42.6 | 0.42 | 41.7 | 0.45 | |
| 6 | 36.2 | 0.32 | 34.4 | 0.45 |
| Electric Potential (V) | Distance (cm) | Average Temperature (°C) a | Average Temperature (°C) b | ΔT (°C) |
|---|---|---|---|---|
| 5 | 2 | 20.7 | 19.2 | 1.5 |
| 4 | 20.1 | 19.2 | 0.9 | |
| 6 | 18.7 | 18.6 | 0.1 | |
| 7.5 | 2 | 39.0 | 19.8 | 19.2 |
| 4 | 32.0 | 19.4 | 12.6 | |
| 6 | 26.2 | 18.9 | 7.3 | |
| 10 | 2 | 51.7 | 21.2 | 30.5 |
| 4 | 43.0 | 20.3 | 22.7 | |
| 6 | 36.2 | 19.7 | 16.5 |
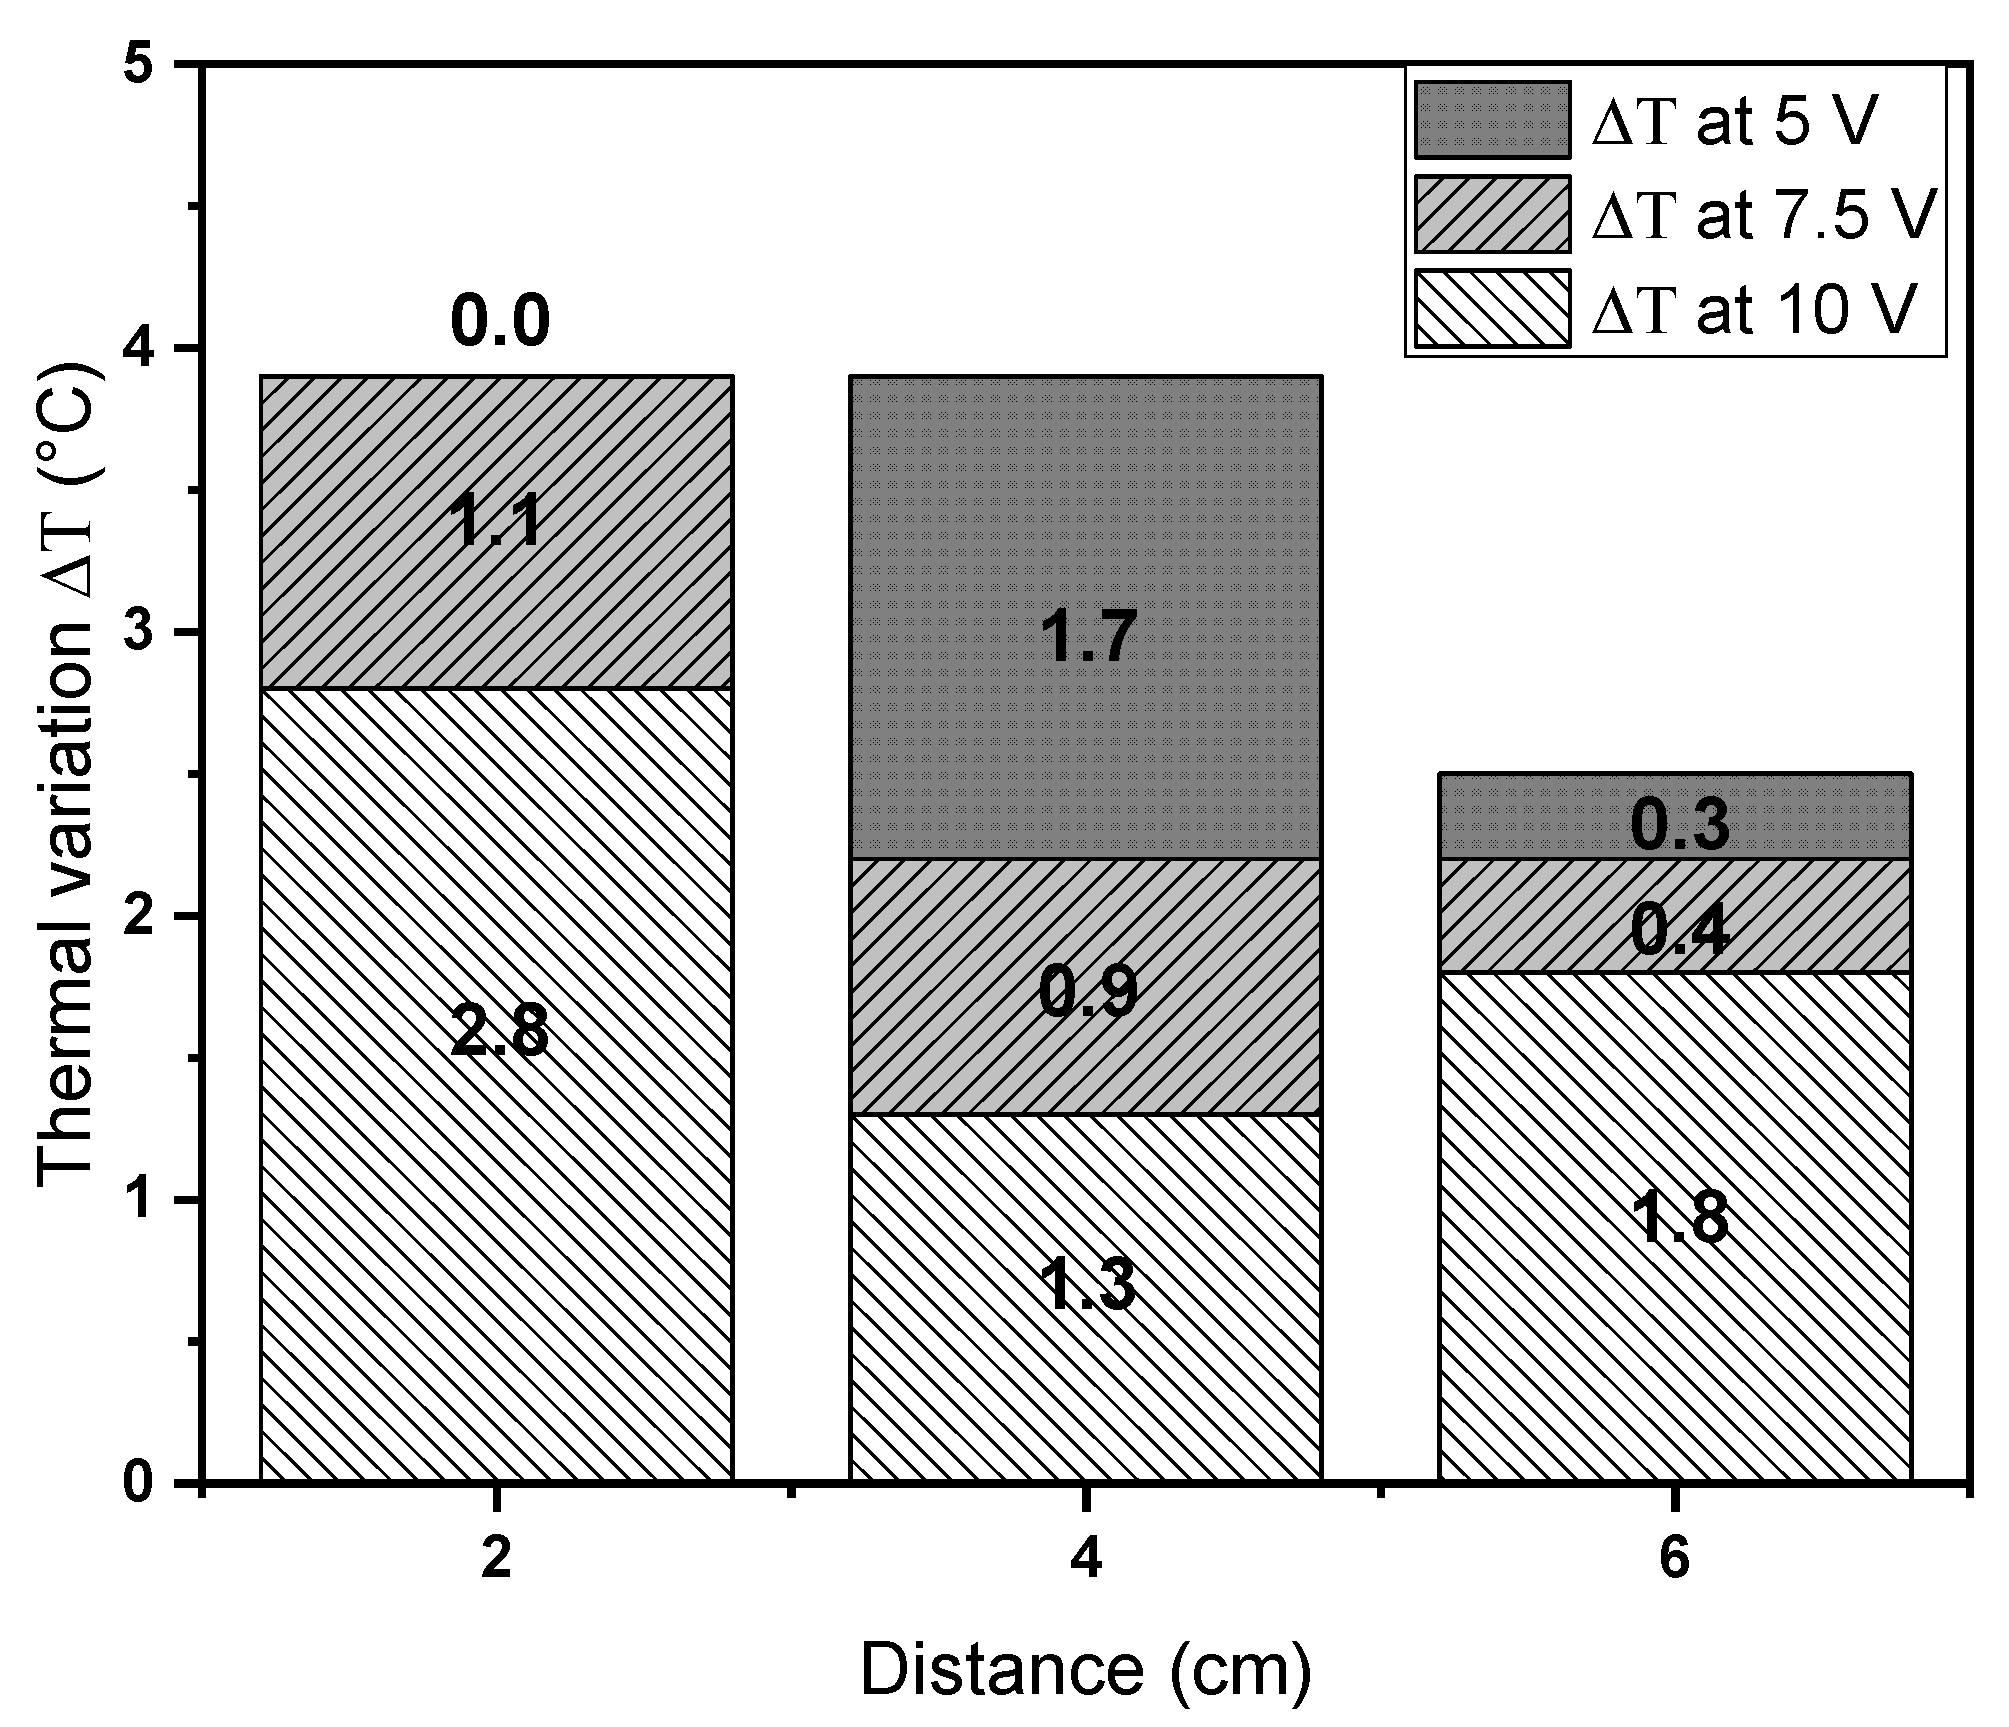
| Electric Potential (V) | Distance (cm) | Average Temperature (°C) a | Average Temperature (°C) b | ΔT (°C) |
|---|---|---|---|---|
| 5 | 2 | 20.7 | 20.7 | 0 |
| 4 | 20.1 | 18.4 | 1.7 | |
| 6 | 18.7 | 18.4 | 0.3 | |
| 7.5 | 2 | 39.0 | 37.9 | 1.1 |
| 4 | 32.0 | 31.1 | 0.9 | |
| 6 | 26.2 | 25.8 | 0.4 | |
| 10 | 2 | 51.7 | 48.9 | 2.8 |
| 4 | 43.0 | 41.7 | 1.3 | |
| 6 | 36.2 | 34.4 | 1.8 |
Publisher’s Note: MDPI stays neutral with regard to jurisdictional claims in published maps and institutional affiliations. |
© 2020 by the authors. Licensee MDPI, Basel, Switzerland. This article is an open access article distributed under the terms and conditions of the Creative Commons Attribution (CC BY) license (http://creativecommons.org/licenses/by/4.0/).
Share and Cite
Zárate, I.A.; Aguilar-Bolados, H.; Yazdani-Pedram, M.; Pizarro, G.d.C.; Neira-Carrillo, A. In Vitro Hyperthermia Evaluation of Electrospun Polymer Composite Fibers Loaded with Reduced Graphene Oxide. Polymers 2020, 12, 2663. https://doi.org/10.3390/polym12112663
Zárate IA, Aguilar-Bolados H, Yazdani-Pedram M, Pizarro GdC, Neira-Carrillo A. In Vitro Hyperthermia Evaluation of Electrospun Polymer Composite Fibers Loaded with Reduced Graphene Oxide. Polymers. 2020; 12(11):2663. https://doi.org/10.3390/polym12112663
Chicago/Turabian StyleZárate, Ignacio A., Héctor Aguilar-Bolados, Mehrdad Yazdani-Pedram, Guadalupe del C. Pizarro, and Andrónico Neira-Carrillo. 2020. "In Vitro Hyperthermia Evaluation of Electrospun Polymer Composite Fibers Loaded with Reduced Graphene Oxide" Polymers 12, no. 11: 2663. https://doi.org/10.3390/polym12112663