Article

Physico-Chemical Characterization, DFT Modeling and Biological Activities of a New Zn (II) Complex Containing Melamine as a Template

1
Laboratory of Materials Science and Environment, Faculty of Sciences of Sfax, University of Sfax, Sfax 3000, Tunisia
2
Laboratory Physico Chemistry of the Solid State, Department of Chemistry, Faculty of Sciences, University of Sfax, BP 1171, Sfax 3000, Tunisia
3
Laboratory of Applied Physics, Faculty of Sciences, University of Sfax, Sfax 3000, Tunisia
4
Laboratory of Biochemistry and Enzymatic Engineering of Lipases, National School of Engineering of Sfax (ENIS), University of Sfax, Sfax 3000, Tunisia
5
Chemistry Department, College of Science, IMSIU (Imam Mohammad Ibn Saud Islamic University), P.O. Box 5701, Riyadh 11432, Saudi Arabia
6
Research Laboratory of Catalysis and Materials for Environment and Processes, University of Gabes, Gabes 6029, Tunisia
7
Department of Chemistry Biology and Biotechnologies, University of Perugia, Via Elce di Sotto 8, 06123 Perugia, Italy
*
Authors to whom correspondence should be addressed.
Crystals 2023, 13(5), 746; https://doi.org/10.3390/cryst13050746
Submission received: 11 March 2023 / Revised: 12 April 2023 / Accepted: 20 April 2023 / Published: 29 April 2023
(This article belongs to the Topic Advanced Structural Crystals)

Abstract

:
Single crystals of a new organic–inorganic hybrid compound (C3H7N6)2[ZnCl4]·H2O was synthesized and characterized by X-ray diffraction at room temperature, FT-IR and FT-Raman spectroscopies, optical absorption and photoluminescence behavior. The title compound belongs to the triclinic space group P 1 ¯ , and in the crystal structure, the inorganic layers are built from tetrachloridozincate anions [ZnCl4]2− and free water molecules, linked together by O–H···Cl hydrogen bonds and halogen···halogen interactions. In addition, Hirshfeld surfaces and 2D fingerprint plots estimate the weak intermolecular interactions accountable for the generation of crystal packing. The optimized geometry, vibrational frequencies and various thermodynamic parameters of the title compound calculated using density functional theory (DFT) methods are in agreement with the experimental values. The theoretical calculations were performed using the DFT method at WB97XD/Lanl2dz basis set levels and we discussed topological analysis of atoms in molecules (AIM) at the BCP point. A detailed interpretation of the IR and Raman spectra were reported. Additionally, the simulated spectrum satisfactorily coincided with the experimental UV-Visible spectrum. A wide band gap exceeding 4 eV of the synthesized compound was recorded. The photoluminescence (PL) was characterized through two bands successively at 453 and 477 nm. Ultimately, antimicrobial activity and enzymatic inhibition assays of the complex were also investigated through microbial strains, agar diffusion method, minimum inhibitory concentration (MIC) determination, lipase and phospholipase A2 inhibition.

1. Introduction

The combination of matrices of organic and inorganic molecules gives rise to bi-functional materials by mixing the chemical properties of both types of components [1,2,3,4]. The properties of these materials do not result simply from the alliance of the individual contributions of their components, but also from the strong synergy created by the hybrid materials. Designed hybrid materials possess exceptional physical properties, such as optical properties for applications in the fields of optoelectronics, mechanical and energy [1,2,3,4]. The synthesis of hybrid materials offers an innovative route to design a variety of astonishing materials with industrial applications [5,6,7,8,9,10,11,12,13,14]. Recently, huge structures of metal-organic materials have been reported [15], displaying various architectures with; one-dimensional (1-D) [16], two-dimensional (2-D) [3,17], and three-dimensional (3-D) [18] connections between inorganic and organic species. Among the known metal-organic materials, zinc (II)-based complexes are highly demanded in many fields, on the one hand for their diversity of physical and chemical properties and on the other hand for their non-toxicity [19,20]. Furthermore, zinc is of particular importance among the transition metals in the structural organization of hybrid materials. The zinc complexes exhibit a wide range of coordination numbers and geometries (tetrahedral [21], pyramidal with square base [22] and octahedral [23]) in view of the closed shell and relatively large coordination distances of Zn(II). Such hybrid materials can easily self-assemble into highly ordered nano-objects with unique functions for potential applications through weak intermolecular interactions, such as hydrogen bonding, van der Waals force, π–π stacking, and electrostatic interactions. Moreover, these non-covalent interactions correspond to some of the most powerful forces to organize structural units in both natural and artificial systems, and they present outstanding effects on the optical properties. The effective synthesis and characterization of a novel complex based on zinc (II), are described in the current work. Because of its particular interest in this field, the novel salt of (C3H7N6)2[ZnCl4]·H2O has been characterized in numerous ways after careful investigation of what occurs in the crystal and confirmed by DFT calculations.

2. Experimental Analysis

2.1. Synthesis of (C3H7N6)2[ZnCl4]·H2O

The starting materials used during the present work for the preparation of the new hybrid compound are as follows: 1,3,5-triazine-2,4,6-triamine C3H6N6 (melamine) (0.37 g; 2.93 mmol); zinc chloride (ZnCl2) (0.199 g; 1.46 mmol) and hydrochloric acid (HCl) (38%; 5 mL). Using the slow evaporation method, this compound was prepared at room temperature. The above products were dissolved separately in HCl, and then mixed together with specific proportions with magnetic stirring until complete dissolution of the solutes. This final product was left to crystallize slowly. A few days after; the material crystallized by forming a transparent salt of a prismatic shape with parallelogram bases; these crystals were washed with ether, carefully filtered and left for a day to dry, after which they were collected and used for various physical and chemical analyses (Figure 1).

2.2. Crystal Data and Structural Determination

The X-ray intensity data from a transparent parallelepiped single crystal of dimensions 0.47 × 0.31 × 0.21   mm 3 were collected at 296   K using a Bruker Kappa CCD AppexII diffractometer (MoKα radiation, λ = 0.71073   Å , Bruker AXS Inc., Madison, WI, USA (2008)). The collection made it possible to record 8662 reflections in an angular range from 2.7 ° to 22.4 ° corresponding to the Miller index intervals h k l   h : 9 9   ;   k : 11 11   ;   l : 17 17 . The structure was solved in the triclinic system with space group P 1 ¯ . Using Olex2 [24], the structure was solved with the olex2.solve [25] structure solution program using Charge Flipping and refined with the ShelXL [26]. An absorption correction by multi-scan was applied, T m i n = 0.476 and T m a x = 0.653 . The reliabilities factors recorded after several refinement cycles corresponding to R = 0.031 and w R = 0.066 proved to be satisfactory. The positions of the zinc and chlorine atoms were determined by the Patterson method, while those of the carbon, nitrogen and oxygen atoms were obtained following the calculation of several cycles of the Fourier-difference. The hydrogen atoms were attached to the carbon, nitrogen and oxygen atoms using constraints for the distances N–H, C–H and O–H. The structural graphics of the asymmetric unit were created with the ORTEP [27], MERCURY [28] and DIAMOND programs [29]. Table 1 elaborates the crystallographic results and the recording conditions of the crystalline structure.

2.3. Powder X-ray Diffraction

The X-ray powder diffractogram was carried out using a Siemens D5000 diffractometer with radiation (CuKα1 radiation, λ = 1.5406   Å ). The chart recording was established in the 4 40 ° angular range at 2 θ , with a measurement step of 0.02 ° and a counting time of 30   s / step . The Rietveld method of the Fullprof program was invested to refine this diagram. The cell parameter of the compound was determined by the program DICVOL06 [30].

2.4. Hirshfeld Surface Analysis

The Hirshfeld surfaces [31,32] and associated 2D fingerprints were calculated using Crystal Explorer (Version 3.0), which accepts a structure input file in the form of the Crystallographic Information File (publCIF) [33]. They allow for illustrating, graphically, the relative positioning of neighboring atoms belonging to interacting molecules together [34,35]. Their normalized contact distances d n o r m , based on d e (distance from the point to the outermost kernel external to the surface), di (distance to the nearest inner core from the surface) and the rays’ VDW (van der Waals) of the atom, are provided by the following equation:
d n o r m = d i r i V D W r i V D W + d e r e V D W r e V D W  
where, r i V D W and r e V D W stand for the van der Waals radii of the appropriate atoms internal and external to the surface, respectively [36]. When d n o r m was mapped onto the Hirshfeld surface, close intermolecular interactions were characterized by three identical color domains, ranging from blue to red to white. Red regions correspond to closer contacts and negative d n o r m values. Blue regions represent longer contacts and positive d n o r m values. White regions identify the distance of contacts which refers exactly to the van der Waals separation with a d n o r m value of zero [37]. The combination of de and di in the form of a 2D fingerprint plot provides a summary of the intermolecular contacts in the crystal [38]. At each point of the surface of Hirshfeld, a value of d i and d e is associated. A color gradient, from blue (a few points) to green to red (many points), is associated with the density of points occupying a specific region of the graph.

2.5. Spectroscopic Characterizations

The infrared absorption spectra were recorded using a Perkin-Elmer Spectrum FT-IR type apparatus in the spectral range 400 4000   cm 1 . The analysis rests upon preparing two pellets: one using approximately 5 % of the sample and 95 % of potassium bromide (KBr), and the other using 100 % of KBr dried at 383   K .
The Raman spectra were obtained using a LABRam HR800 (HORIBA Jobin Yvon, HORIBA, Ltd., Kyoto, Japan) spectrometer (triple monochromator).
An optical absorption spectrum of the direct transmission measurements were deduced by spin-coated films performed using a conventional UV–Visible spectrophotometer (HITACHI, U-3300).

2.6. Computational Details

The molecular geometry and vibrational wave numbers of the title molecule were calculated through adopting the Density Functional Theory (DFT) method using the Gaussian 09 program [39]. The geometry optimizations and frequency variations of (C3H7N6)2[ZnCl4]·H2O were represented using the WB97XD/Lanl2dz basic set. All subsequent calculations were carried out based on the optimized structure. Frequency analysis of the optimized geometry at the same level of theory proved that the structure is a true local minimum having no imaginary frequency. An empirical scaling factor of 0.961 was used to offset the systematic error caused by basis set incompleteness, neglect of electron correlation and vibrational anharmonicity. In order to make the comparison easier between the experimental and theoretical results, we have used the program Gauss View [40] which allows to obtain visual presentations and to control the results. The calculated absorption spectrum was simulated using the GAUSSUM version 2.2 software package selecting the GAUSSIAN spread model [41]. To better understand the interactions between the different entities that form the compound, we performed topological analyses using Aim 2000 [42] and the Multiwfn program [43], which is a method based on the minimization of the density of non-covalent interaction (NCI-RDG) calculations [44] to better detect the interactions in the crystal.

2.7. Antimicrobial Activity

2.7.1. Microbial Strains

The antibacterial activity of (C3H7N6)2[ZnCl4]·H2O was evaluated against six strains of bacteria: three Gram-negative (Salmonella typhi, Escherichia coli and Enterococcus feacalis) and three Gram-positive (Listeriamonocytogenes, Staphylococcus aureus and Micrococcus luteus bacteria.

2.7.2. Agar Diffusion Method

To determine the efficacy of the compound (C3H7N6)2[ZnCl4]·H2O as an antimicrobial, we used the method of D. Vanden Berghe [45]. For this, we used 106 colony forming units (CFU)/mL of microorganism cells, by diffusion, with the source of these cells being the bacteria tested on LB medium. Next, 3 mg/mL of (C3H7N6)2[ZnCl4]·H2O were dissolved in DMSO, then 20 µL of this mixture were removed and added to the drilled wells in the agarose layer. Lastly, after confirming that the material had spread, it was placed in an airtight container and kept hygroscopic for 3 h at 4 °C, after which the mixture was incubated at 37 °C for 24 h. The antimicrobial activity of the bacteria tested was measured by the diameter of the apparent zone of growth inhibition and compared with a positive control (ampicillin) and a negative control (DMSO) dissolved in Petri dishes. We ran three tests and averaged the results.

2.7.3. Minimum Inhibitory Concentration (MIC) Determination

We used the Gram (+) and Gram (−) bacterial strain to study the antibacterial activity of (C3H7N6)2[ZnCl4]·H2O. For this purpose, we used the minimum values of concentration (MIC), a weak concentration known as the microwell method described by M. Melo et al. [46]. This method does not allow the complete growth of microorganisms, and is based on the use of 3-(4,5-dimethylthiazol-2-yl)-2,5-diphenyltetrazolium bromide (MTT). We used a weak concentration series of (C3H7N6)2[ZnCl4]·H2O with a value ranging from 16 mg/mL to 0.125 mg/mL, prepared in a 96-well plate. We prepared and adjusted the suspensions to 106 CFU/mL for each bacterium. Thus, each well of the microplate contained 20 µL of inoculum and 100 µL of LB growth medium, as well as 80 µL of weakly concentrated samples. DMSO was used as a negative control. The plates were incubated at 37 °C for a full day, (24 h), and then 25 μL of MTT (0.5 mg/mL sterile water) were added to each well. After 30 min, the color of the medium did not change to purple, indicating that the bacteria became biologically inactive. To ensure the validity of the results, we performed all experiments in duplicate.

2.8. Enzymatic Inhibition Assays

2.8.1. Lipase Inhibition

The purpose of the lipase inhibition assay is to test the direct interaction between the lipase and the inhibitor in water and without substrate [47]. For this reason, we used the pre-incubation method of lipase inactivation. The type of lipase used was VII from Candida rugosa (EC 3.1.1.3) obtained from SIGMA (St. Louis, Missouri, USA). The dosage of lipase activity was measured by titrimetry at a temperature of 37 °C at a controlled pH measured with a pH-Stat (Metrohm, Switzerland); the pH must be 7.2 in the presence of an emulsion olive oil. A lipase unit corresponds to 1 µmol of fatty acid released per minute. We took 50 µL of lipase, so that it could be preincubated at room temperature for 1 h at different concentrations of (C3H7N6)2[ZnCl4]·H2O dissolved in DMSO. Then, 50 µL aliquots of the reaction sample were used to assess residual lipase activity as indicated above. For each measurement, we used a control carried out in the absence of (C3H7N6)2[ZnCl4]·H2O, but with the same volume of DMSO. The volumetric concentration DMSO used was of low concentration, less than 10%, and has no effect on the enzymatic activity.

2.8.2. Phospholipase A2 Inhibition

The phospholipase used was the secreted phospholipase A2 (PLA2) from Scorpio maurus venom glands [48]. Phospholipase activity was measured titrimetrically at pH 8.5 and 50 °C with a pH-Stat (Metrohm, Switzerland) using phosphatidylcholine emulsion. One phospholipase unit corresponds to 1 µmol of fatty acid released per minute. An amount of 20 µL of PLA2 was pre-incubated at room temperature for 1 h with different concentrations of the dissolved (C3H7N6)2[ZnCl4]·H2O. To study and evaluate the residual phospholipase activity, we removed 20 μL aliquots of the reaction sample, as indicated above. We always referred to a control sample produced from the same volume of DMSO and without (C3H7N6)2[ZnCl4]·H2O. The phospholipase inhibition (% inhibition) was determined relative to the initial activity measured in the absence of inhibitor.

3. Results and Discussion

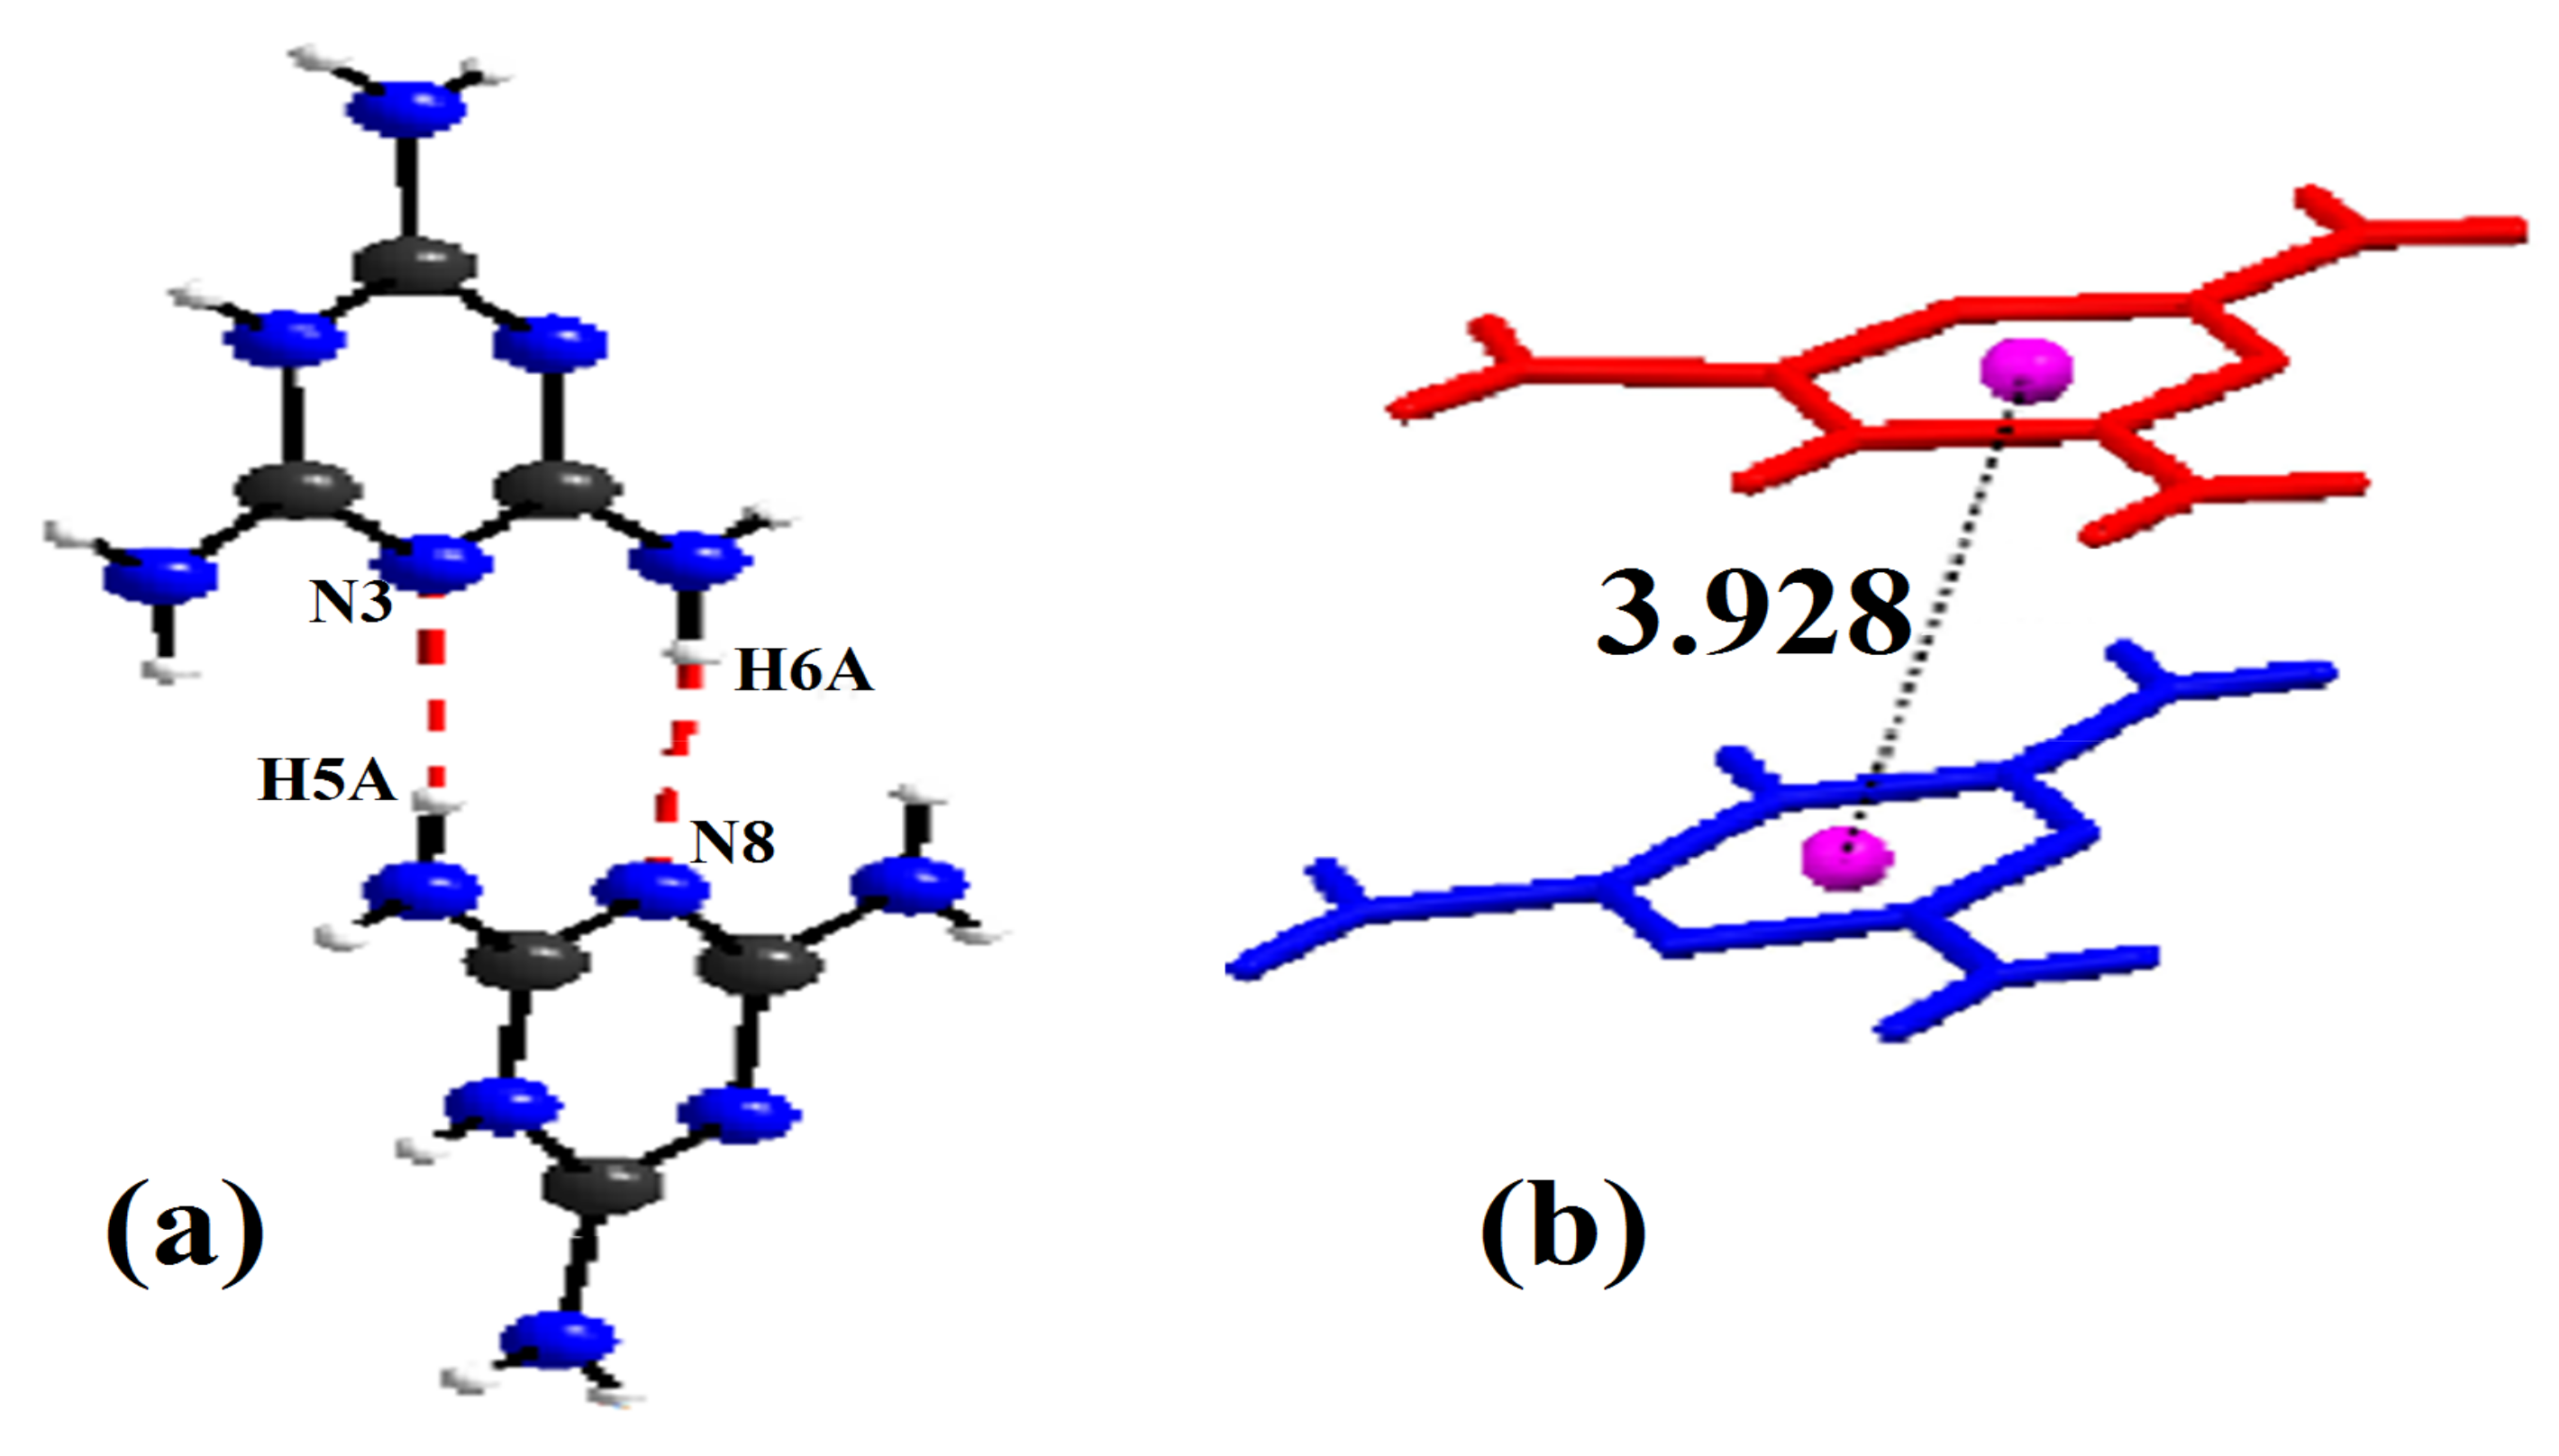
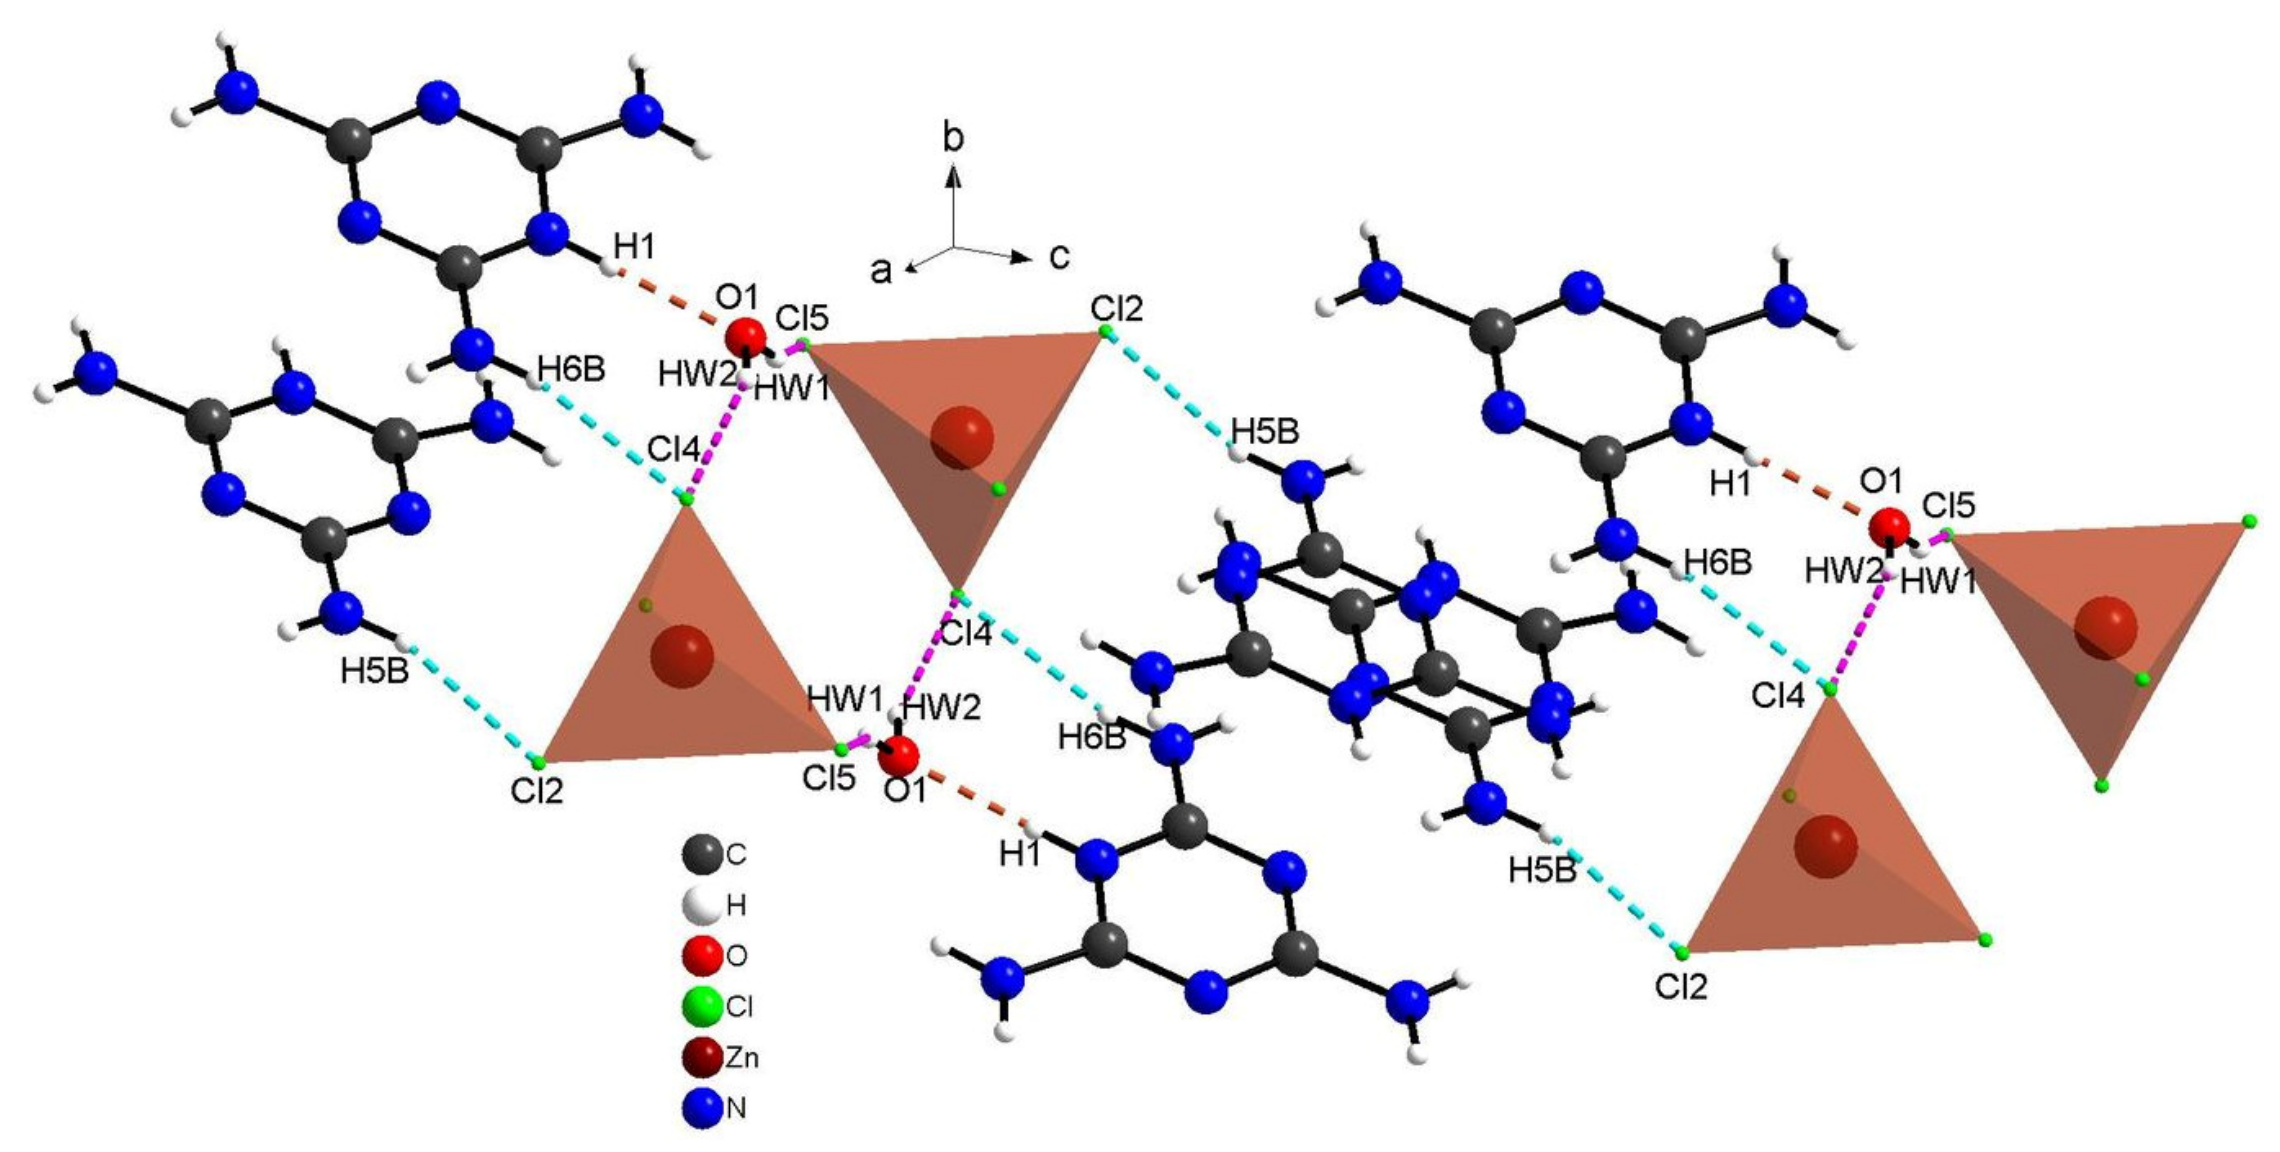
3.1. Crystal Structure

The (C3H7N6)2[ZnCl4]·H2O compound crystallizes in the triclinic crystal system, adopting the centro-symmetric space group Pī, a (Å) = 7.9571 (7), b (Å) = 9.5933 (9), c (Å) = 14.7622 (15) and α (°) = 98.766 (3), β (°) = 105.404 (3), γ (°) = 105.6650 (3). The asymmetric unit of this compound is composed of two independent monoprotonated cationic entities (C3H7N6)+, one tetrahedron [ZnCl4]2− anion and an isolated water molecule (Figure 2). The crystal structure consists of alternate layers of [ZnCl4]2−·H2O and (C3H7N6)+ cations (Figure 3).
The former comprises networks of isolated tetrahedrons [ZnCl4]2− separated by Zn–Zn distances of the order of 11.55   Å . In the tetrachloridozincate anions, the experimental values of Zn–Cl lengths are of the order of 2.266 1   Å , which proved to be close to the theoretical measurements ( 2.327 1   Å ) (Figure 4).
The average experimental value angles for the Cl–Zn–Cl are of the order of 109.43 ° , which are close to the value 109.28 ° of a regular tetrahedron [49]. The average calculated value of these angles is of the order 109.00 (0.30) (Table S1). Referring to literature results, all of these data indicate relatively little distortion from a regular tetrahedral environment around the Zn2+ [49]. The slightest deviation from the tetrahedron around Zn(II) can be accounted for in terms of the involvement of the chlorine ions in the hydrogen bonding. We used the following Equations (2) and (3) [4,50,51,52] to measure the average distortion values for quaternary [ZnCl4]2−:
ID Cl Zn = i n 1 d i d m n 1 × d m
ID Cl Zn Cl = i n 2 a i a m n 2 × a m
where, d is the Zn Cl distance, a is the Cl–Zn–Cl angle, the index i indicates individual values, the index m expresses the average value for the tetrahedron, n 1 = 4 and n 2 = 6 . The values of the distortion indices are ID Zn Cl = 0.0075 and ID Cl Zn Cl = 0.015 . These low values of the distortion indices demonstrated that the coordination geometry of the Zn atom is a slightly distorted tetrahedron [49]. To ensure charge balance for the title compound, the organic species need to be singly protonated. However, spectroscopic studies on solutions and X-ray diffraction work on crystals, such as melamine, triazine and derivatives, yielded the firm conclusion that the triazine nitrogen is preferentially protonated over the amino group nitrogen because it is the most basic component [53]. The organic part of the compound, (C3H7N6)2[ZnCl4]·H2O, is formed by two asymmetric independent molecules of melamine, which are respectively noted as: H-mel(1) {N1, N3, N13} and H-mel(2) {N2, N7, N8}. The protonation of each molecule of melamine in one of its three triazine nitrogen atoms entails the widening of C4-N1-C15 and C12-N7-C11 angles in the triazine ring to 121.9   4 ° and 120.1   4 ° , respectively, compared to remaining C–N–C angles, which are constructed from unprotected cyclic nitrogen atoms [54]. The comparison of bond lengths and angles obtained experimentally from XRD data and theoretically through DFT calculations is depicted in Table S2. The values obtained experimentally from the bond lengths and the angles proved to be in good agreement with those calculated theoretically. In the crystal, H-mel(1) and H-mel(2) molecules are connected by hydrogen bonds N–H···N between the hydrogen, H5A and H6A, and the non-binding, free pair of nitrogen N3 and N8, respectively, resulting in chains running along the b-axis direction (Figure 5a). π-Stacking interactions are also found between the aromatic rings of adjacent molecules. Centroid to centroid distance is 3.928   Å . These contacts may be considered as the π π interactions involving both asymmetric independent molecules of (H-mel). The cations interact via offset face-to-face, π π stacking interactions leading to chains along the crystallographic c axis (Figure 5b). In this compound, water molecules play a key role in the formation of hydrogen bonds of O–Hw···Cl and N–H···O types, acting simultaneously as donors and acceptors of the bond. Indeed, we infer that the water molecule gives rise to two hydrogen bonds and accepts another one.
The cohesion between the organic cations and the chlorine anions is ensured through N–H···Cl bonds and by the water molecules via strong N–H⋅⋅⋅O and O–Hw⋅⋅⋅Cl hydrogen bonds, generating three-dimensional networks, as portrayed in Figure 6. The geometric characteristics of these hydrogen bridge bonds are shown in Table 2. Within the latter, the distance O···Cl is between 3.292   5 Å and 3.296   4   Å , while angle O–Hw...Cl varies between 154 ° and 158 ° . Basically, the distance, N···O is equal to 2.712   6   Å while the angle N–H···O is equal to 173 ° . In order to explore the role of the water molecules in the structure and to quantify the various intermolecular interactions, Hirshfeld surface and their associated fingerprint plots were measured using Crystal Explorer.

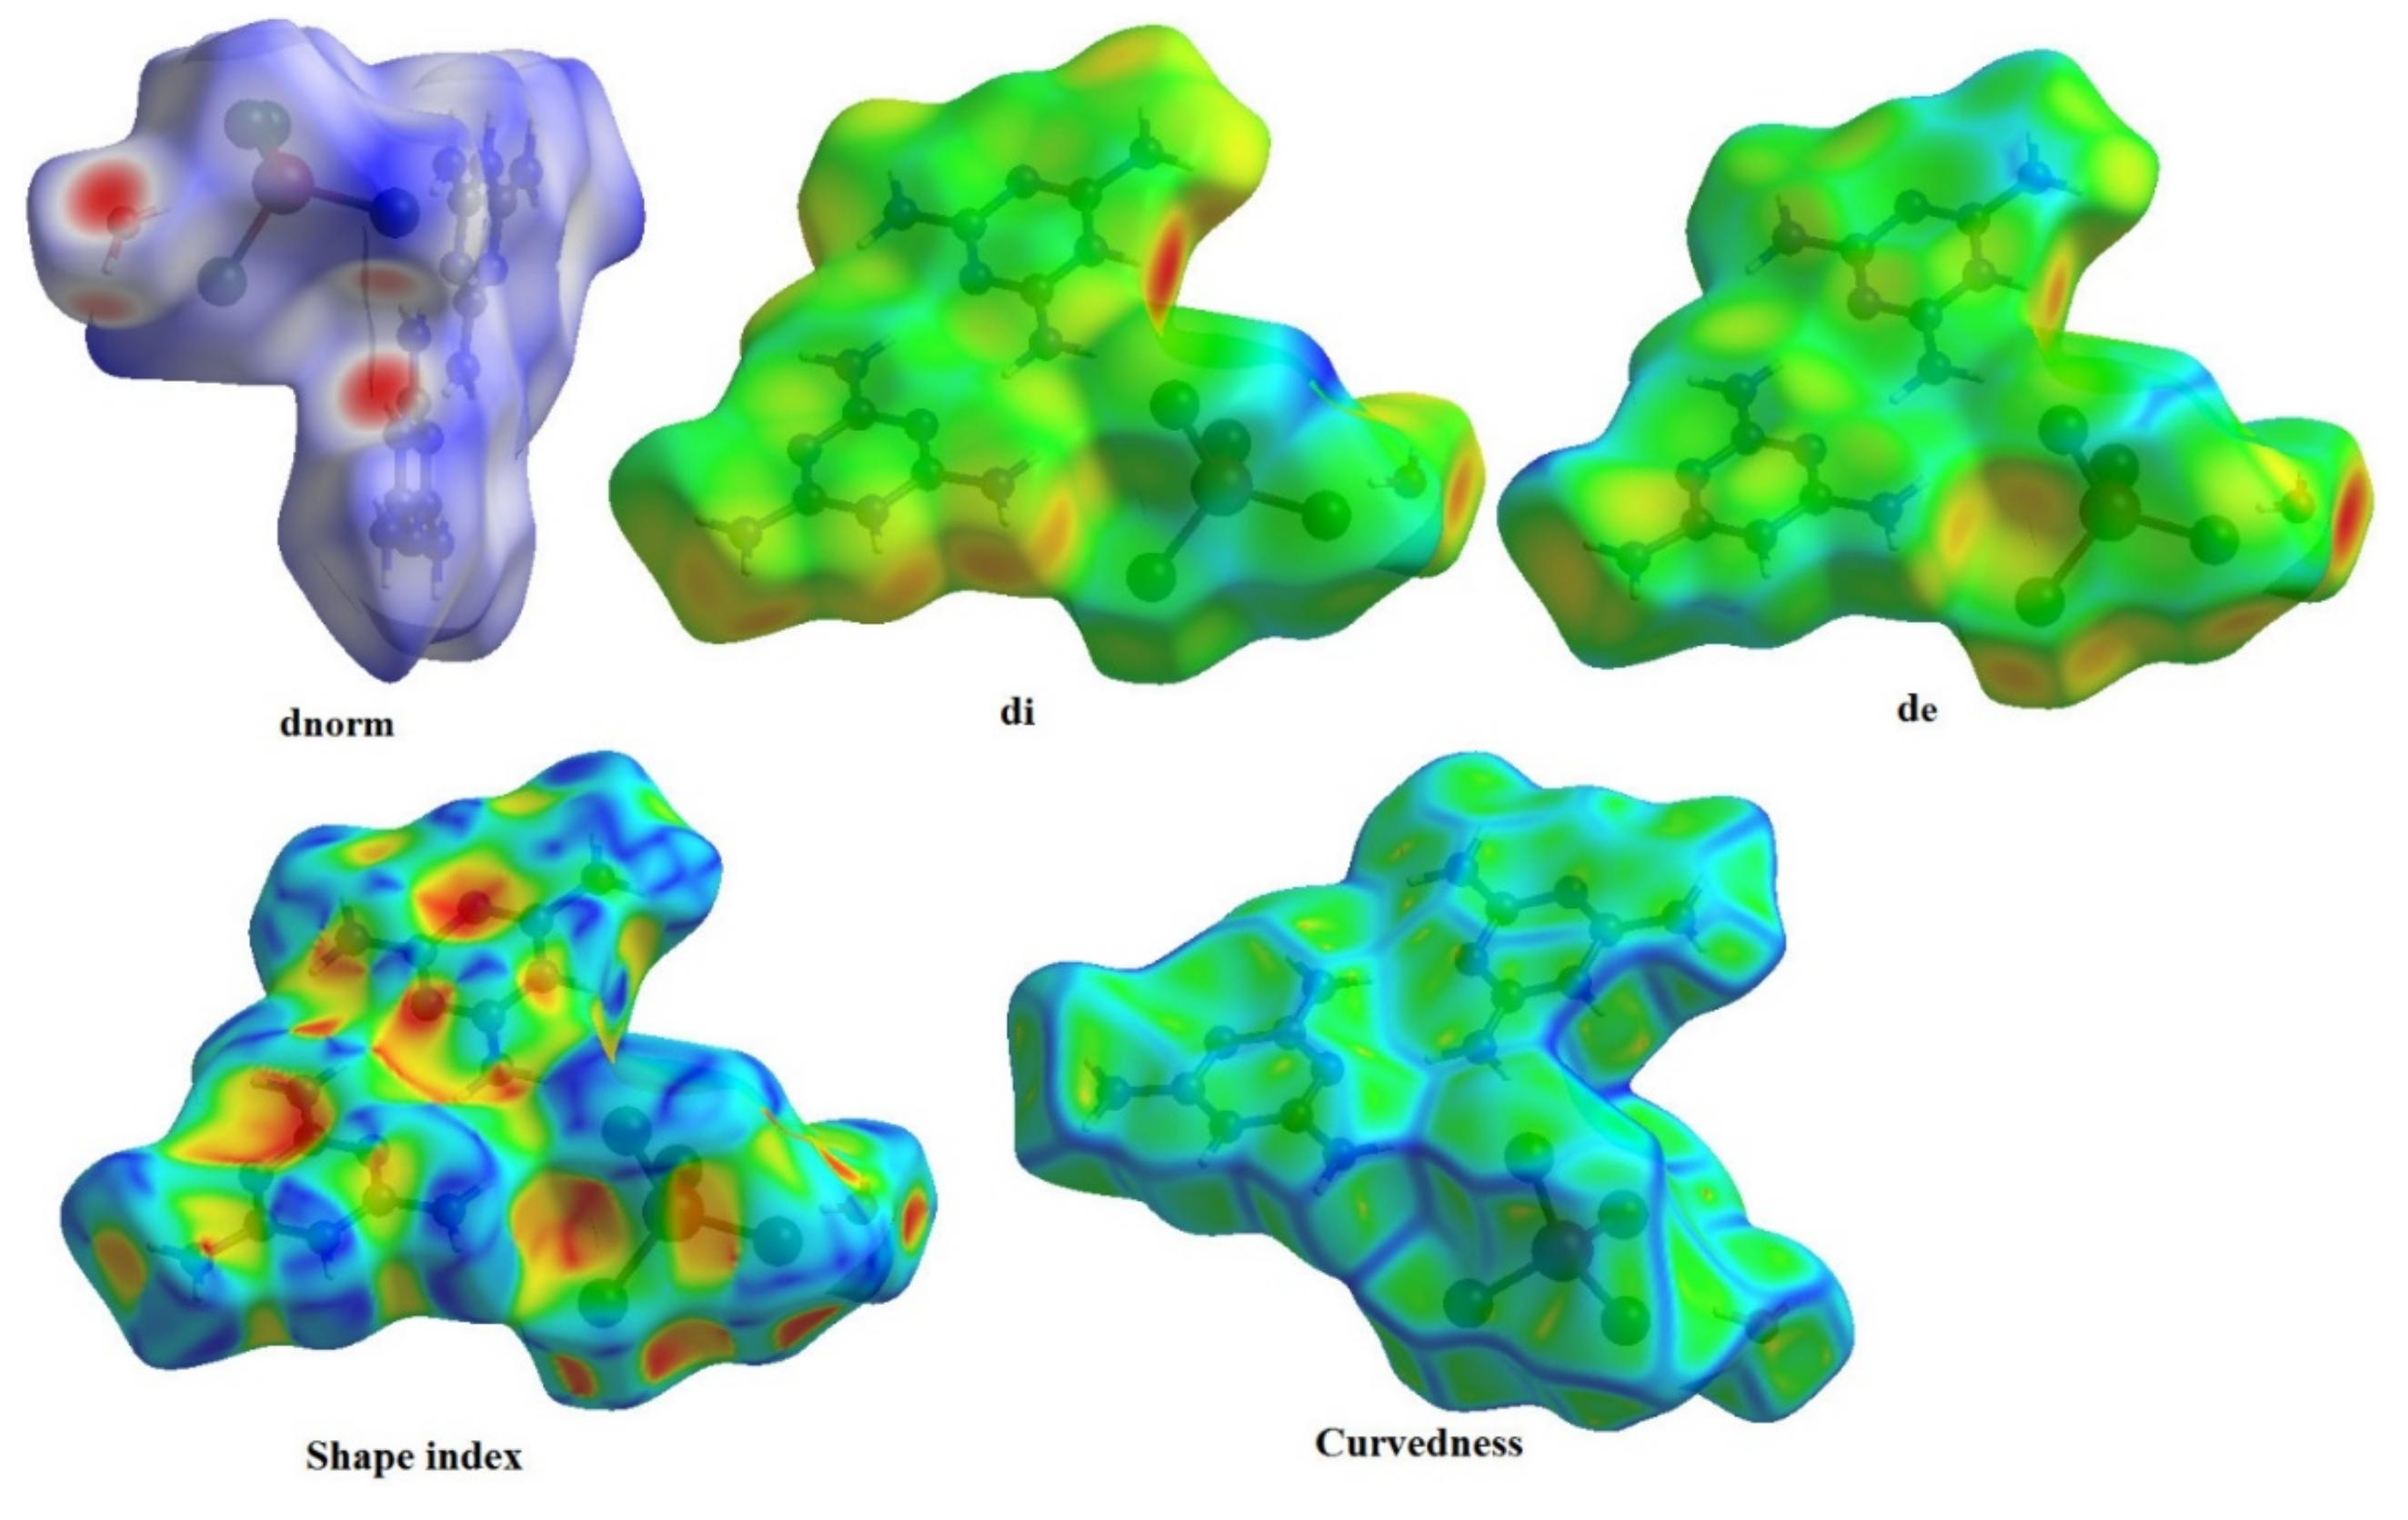
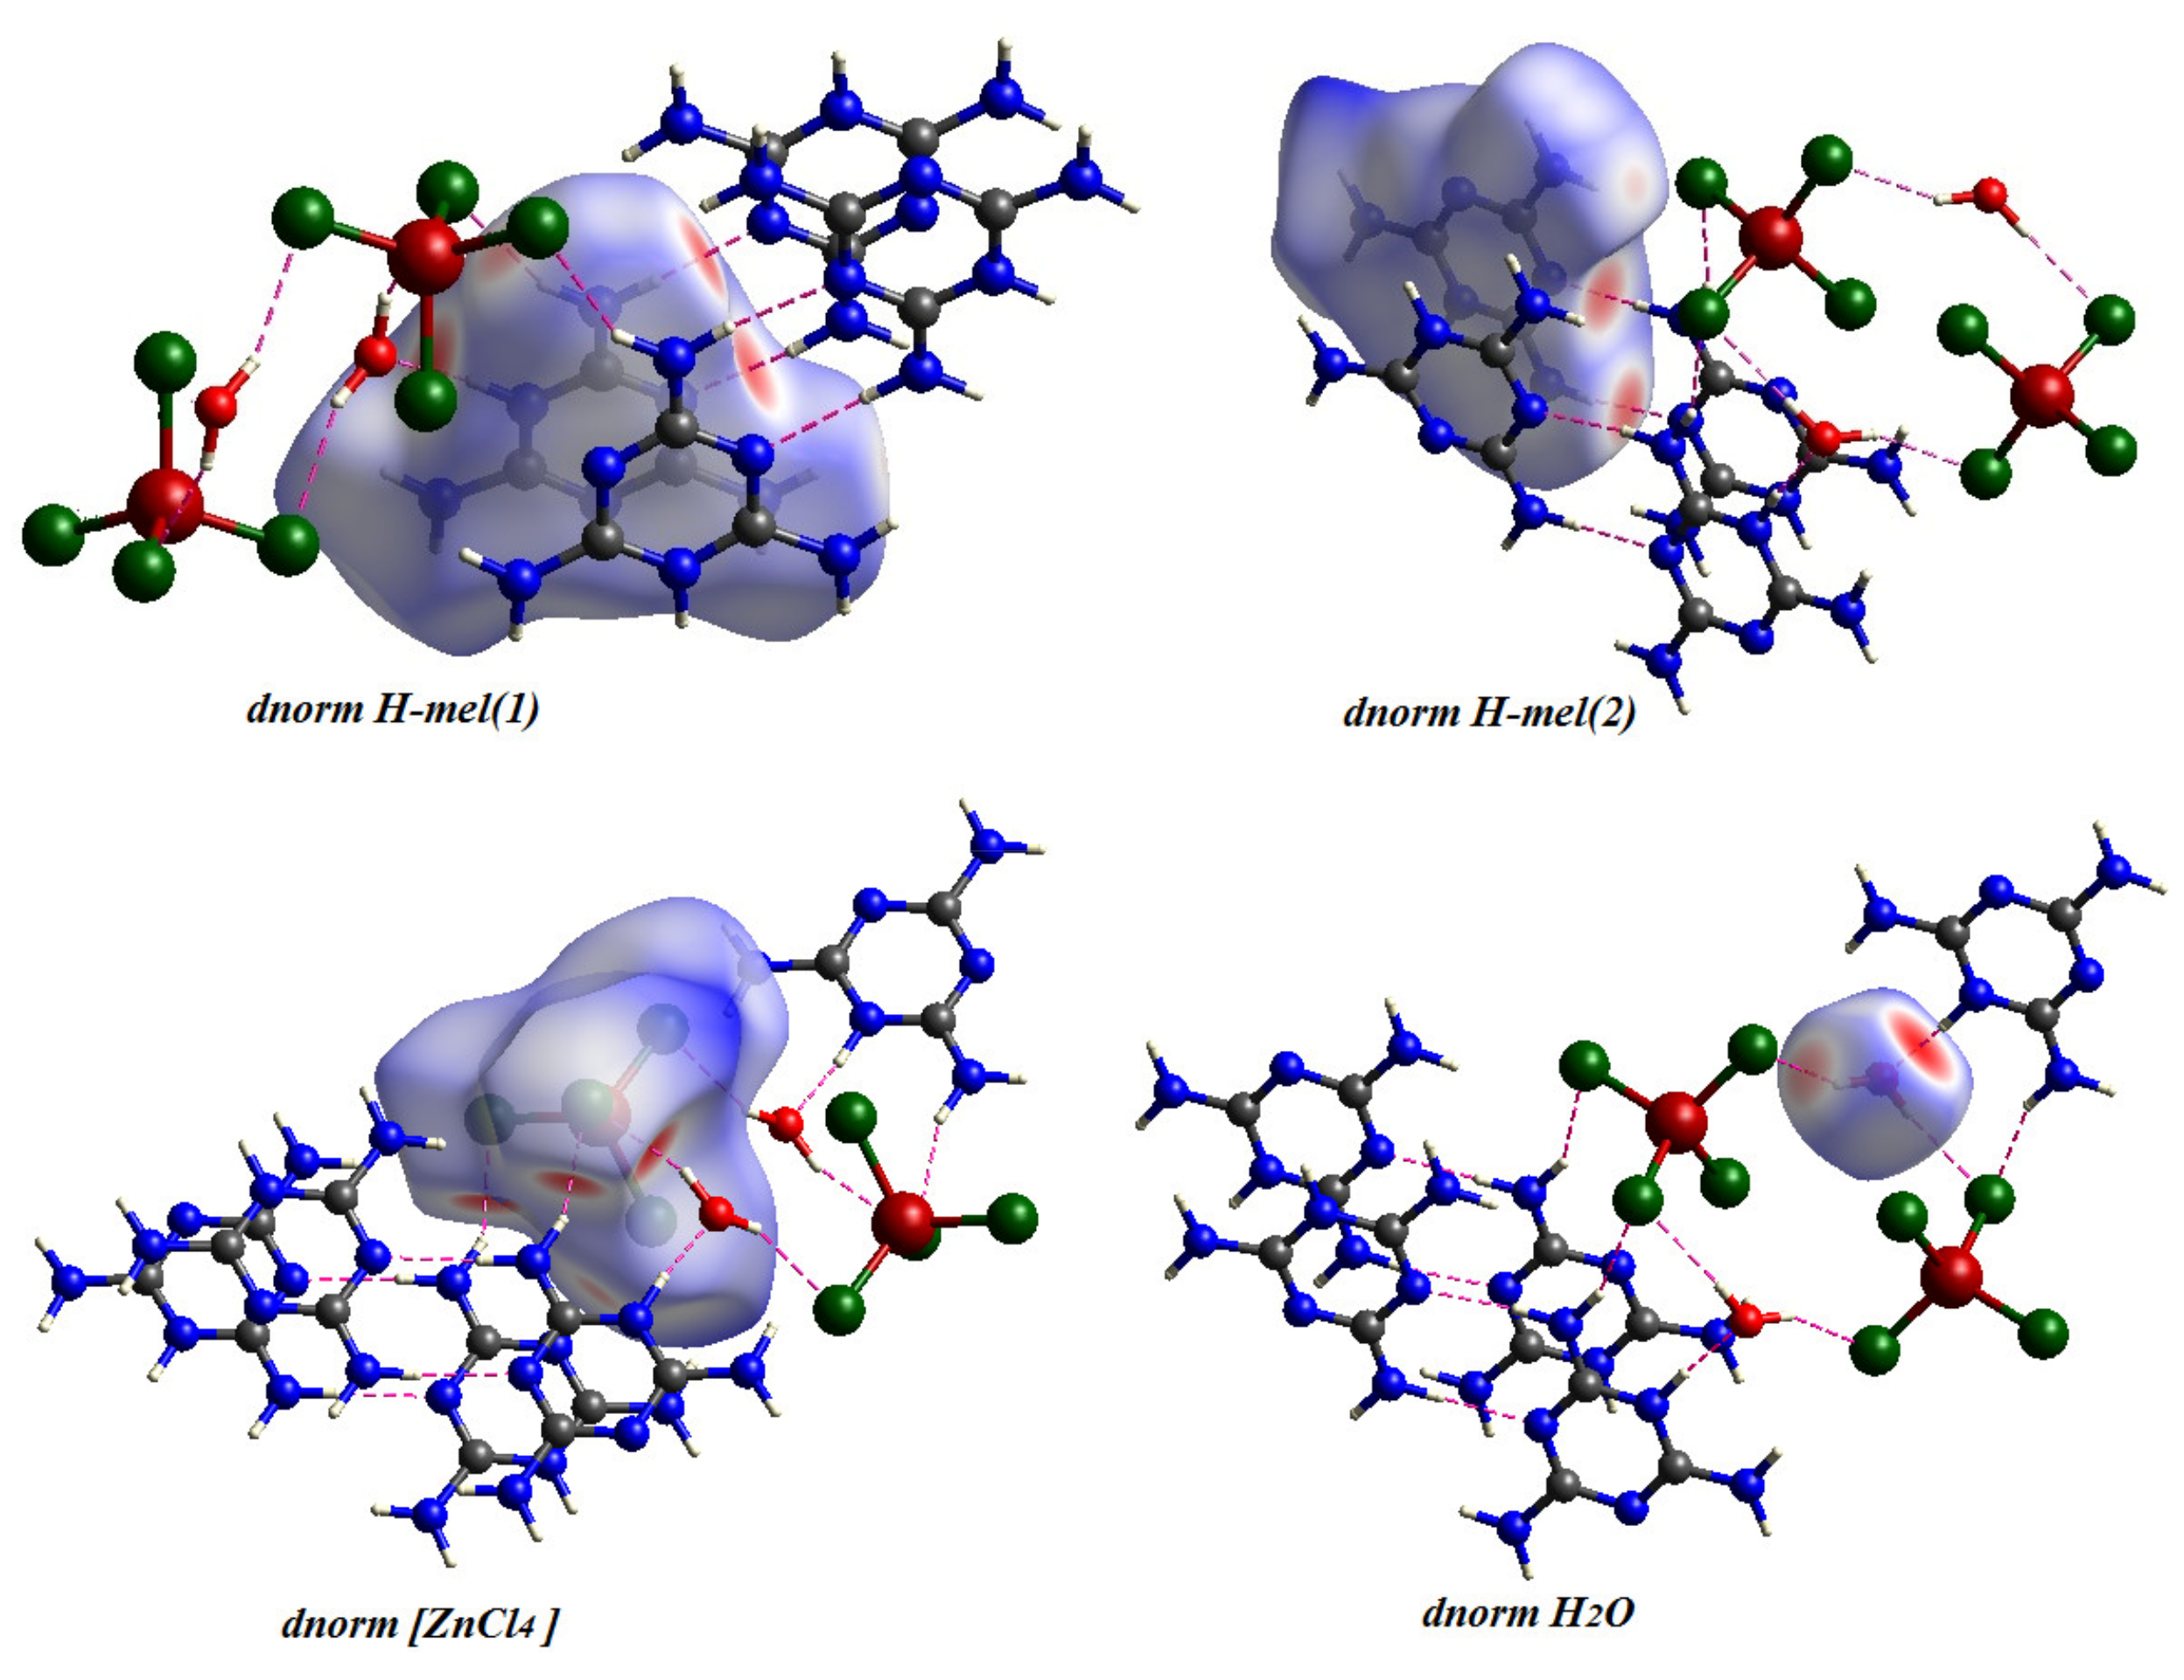
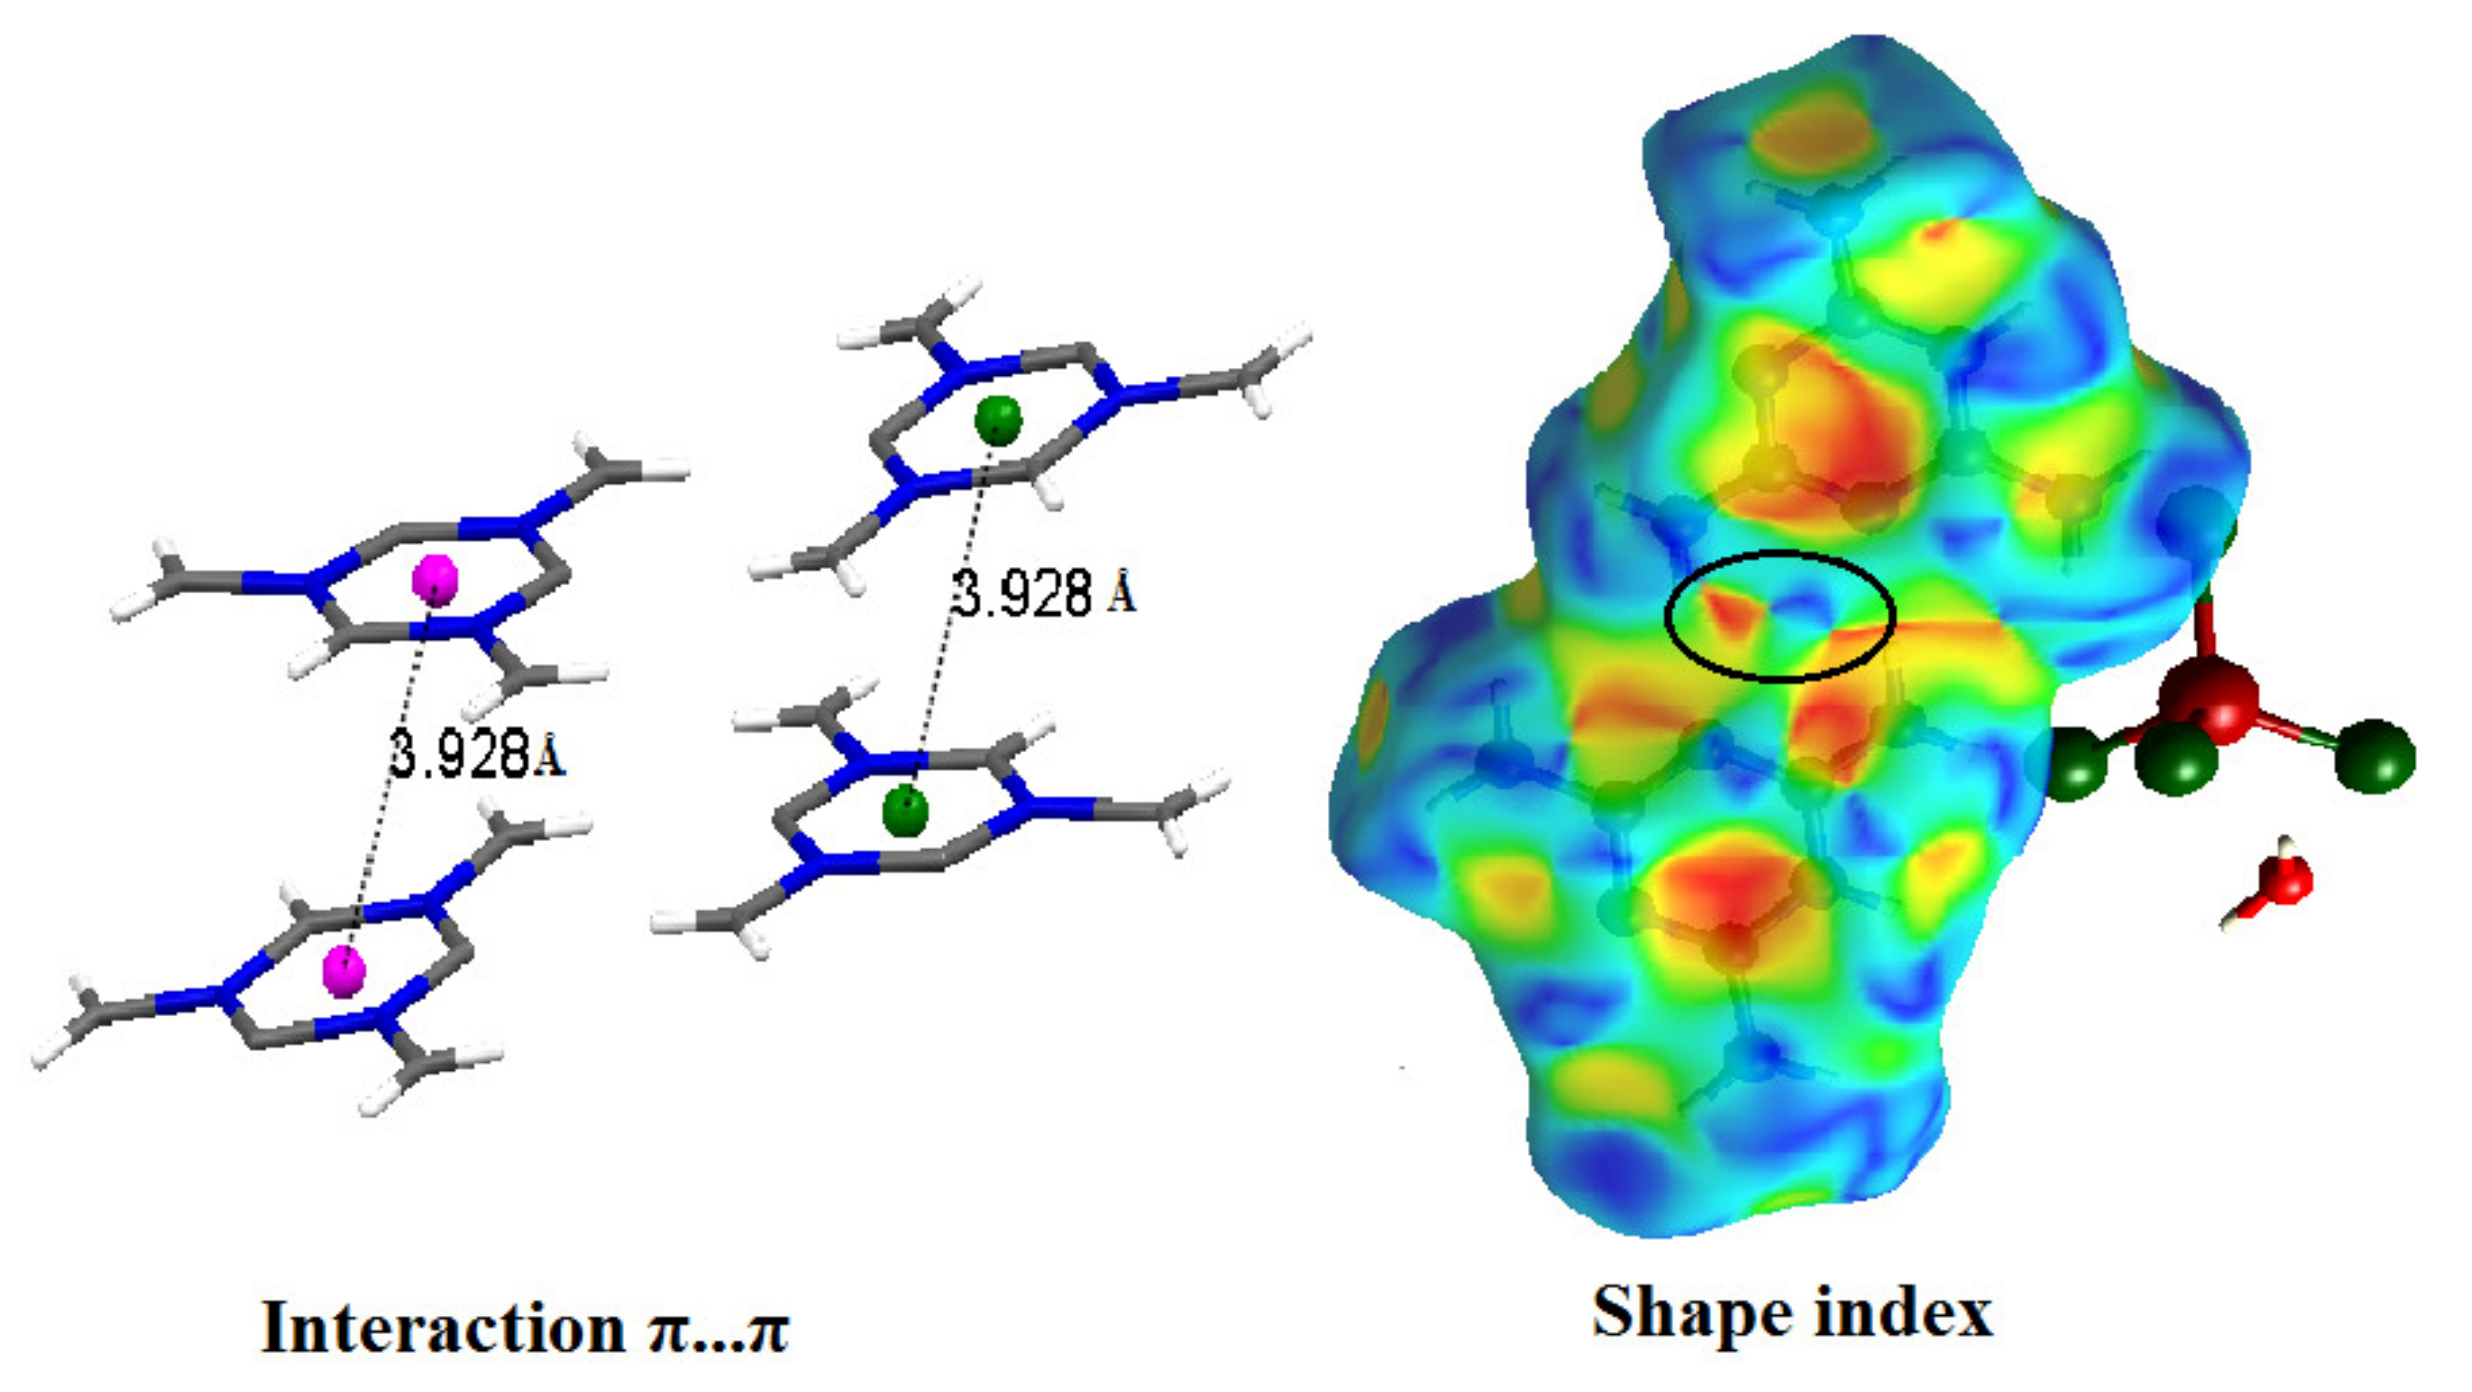
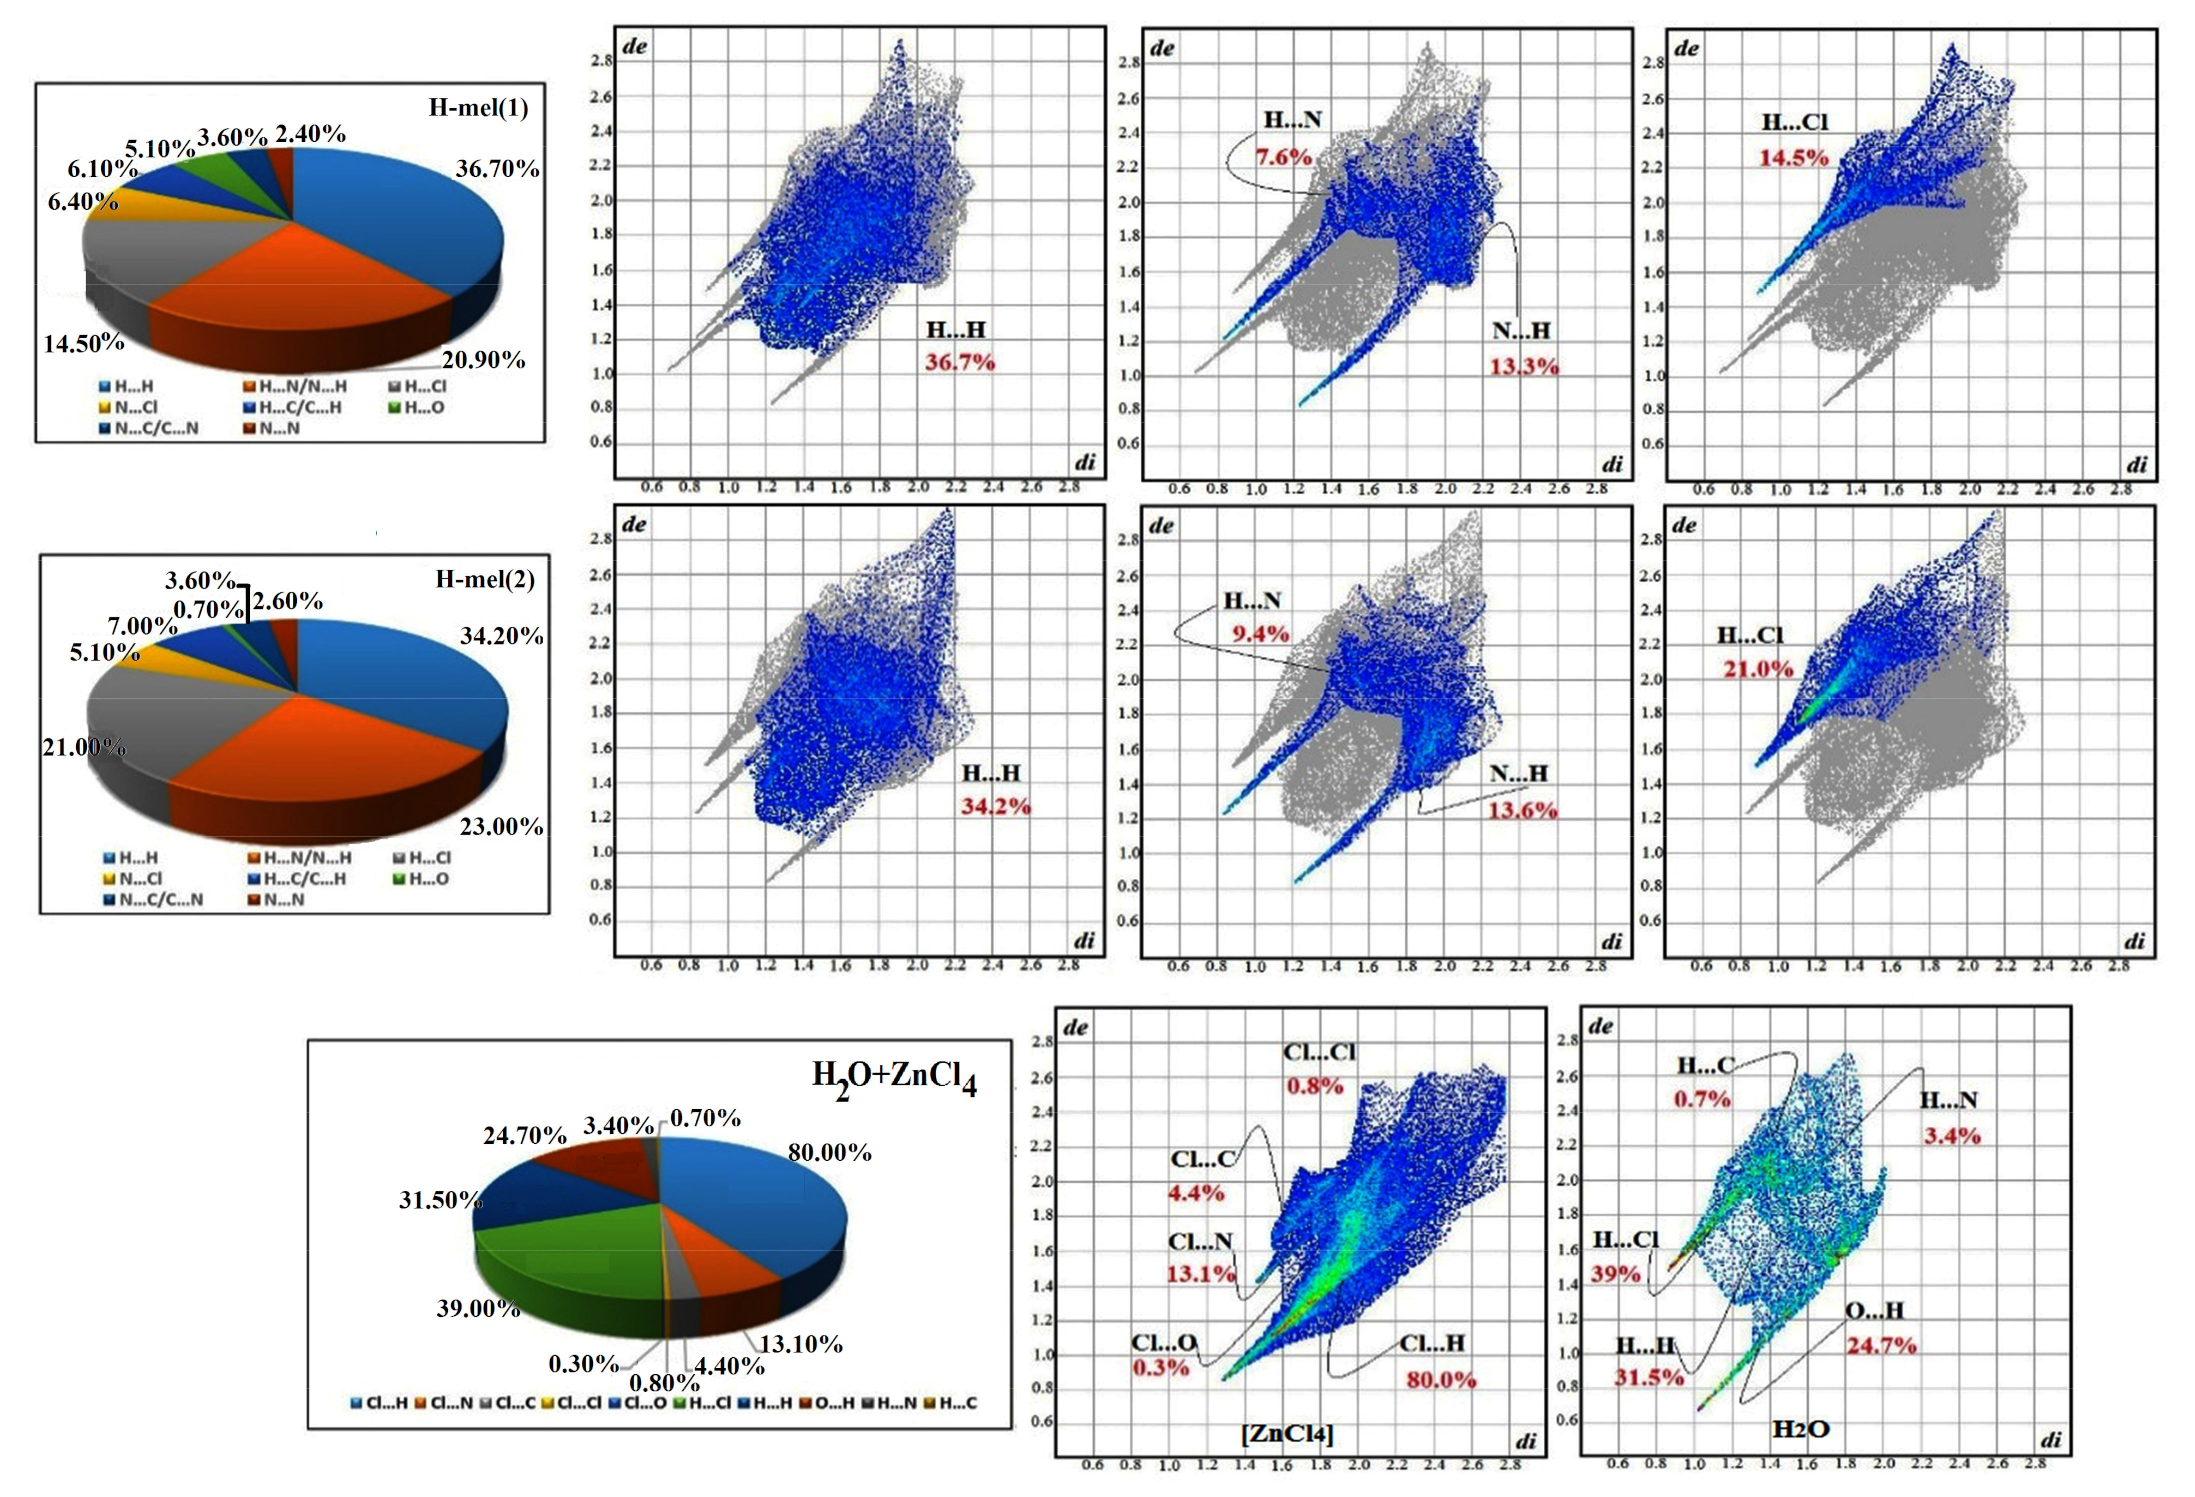
3.2. Hirshfeld Surface Analysis

The Hirshfeld surfaces of complexes are highlighted in Figure 7 with a range of d n o r m from 0.699   Å to 1.748   Å , the d i ranging from 0.677   Å to 3.267   Å , the d e range is from 0.678   Å to 3.004   Å , the range of shape index is from 1.000   Å to 1.000   Å and the curvedness range is from 4.000   Å to 0.400   Å . The Hirshfeld surfaces d n o r m ,   d e ,   d i are depicted as transparent to allow visualization of the molecular fraction around which they were calculated. The intermolecular interaction planes of two organic molecules are different. The main N–H···N, N–H···O, N–H···Cl and O–H···Cl interactions formed by both anionic entities and water molecules with [ZnCl4]2− tetrahedron are marked by red areas, in normal surfaces, while the remaining regions are white or blue according to their distance from atoms in adjacent molecules (Figure 8).
Additionally, this study corroborates the presence of π π interactions between organic molecules, which is indicated by red and blue triangles appearing at the center of the Hirshfeld surface (shape index) (Figure 9).
The 2D fingerprint diagrams of the complex provide additional information on intermolecular interactions, as revealed in Figure 10. We infer the dominance of H···H interactions, with high percentages of the order of 36.70% and 34.2% of the total surface area of Hirshfeld, for H-mel(1) and H-mel(2), respectively. Two other contacts N···H/H···N and H···Cl/Cl···H yield significant percentages, for H-mel(1) and H-mel(2), 20.90 % and 23.0 % and 14.5 % and 21.0 % , respectively. The relative contributions for the remaining different contacts do not exceed 7%. The percentages of all interactions are summarized in Figure 10. The fingerprint plots of [ZnCl4]2− reveal that the highest rate, 80.0 % , is attributed to Cl···H contacts. These interactions imply hydrogen bonds formed within organic molecules and H2O. The other contacts Cl···N, Cl···C, Cl···Cl and Cl···O participate in 13.1 % ,   4.4 % ;   0.8 % and 0.3 % of the total surface of [ZnCl4]2−, respectively. In addition, the fingerprints of the water molecule provide: H···Cl 39.0 % , H···H 31.5 % , O···H 24.7 % , H···N 3.4 % and H···C 0.7 % . These interactions are suggestive of the important role of H2O molecules in structural stability.
The results of this research work are in good accordance with that of the X-ray study and allow determining the percentage of contribution of each in terms of the stability of their building.

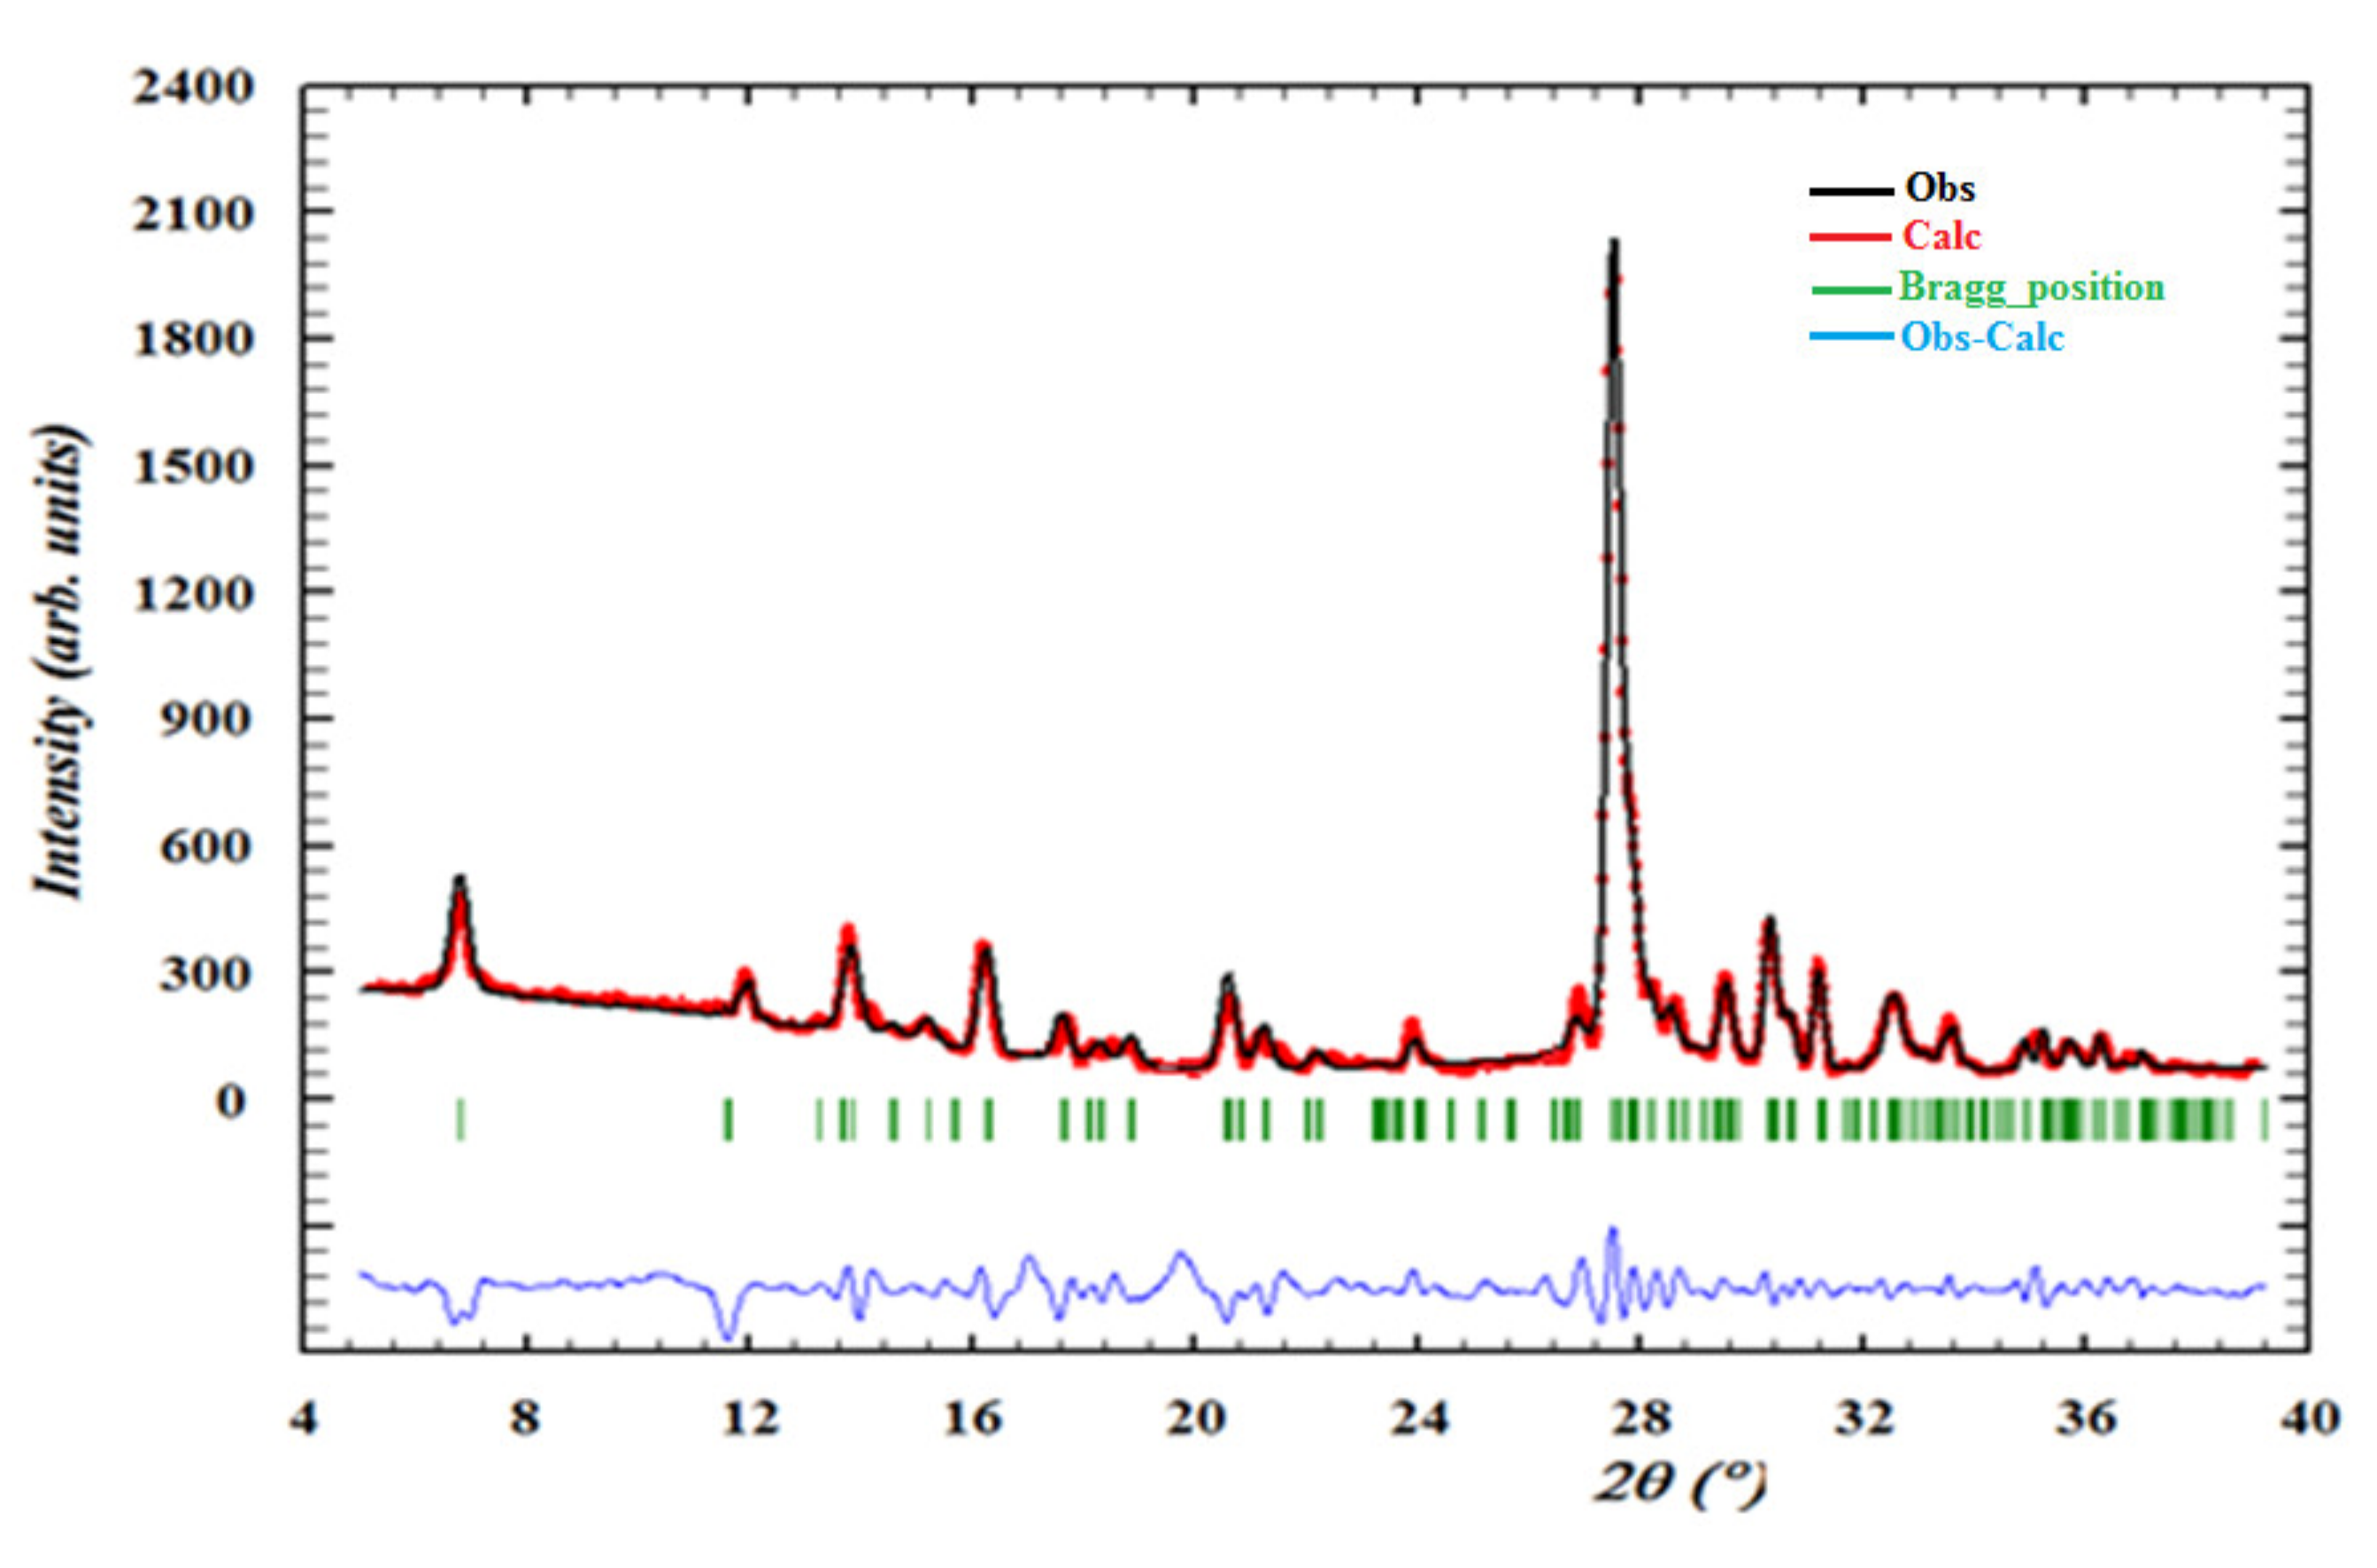
3.3. X-ray Powder Analysis

Figure 11 presents the X-ray powder diffraction data of the title compound. The superposition of these diffractograms are in good agreement, which confirms the purity and the homogeneity of the synthesized material. This result provides a good impetus for exploring the properties of this compound using different techniques.

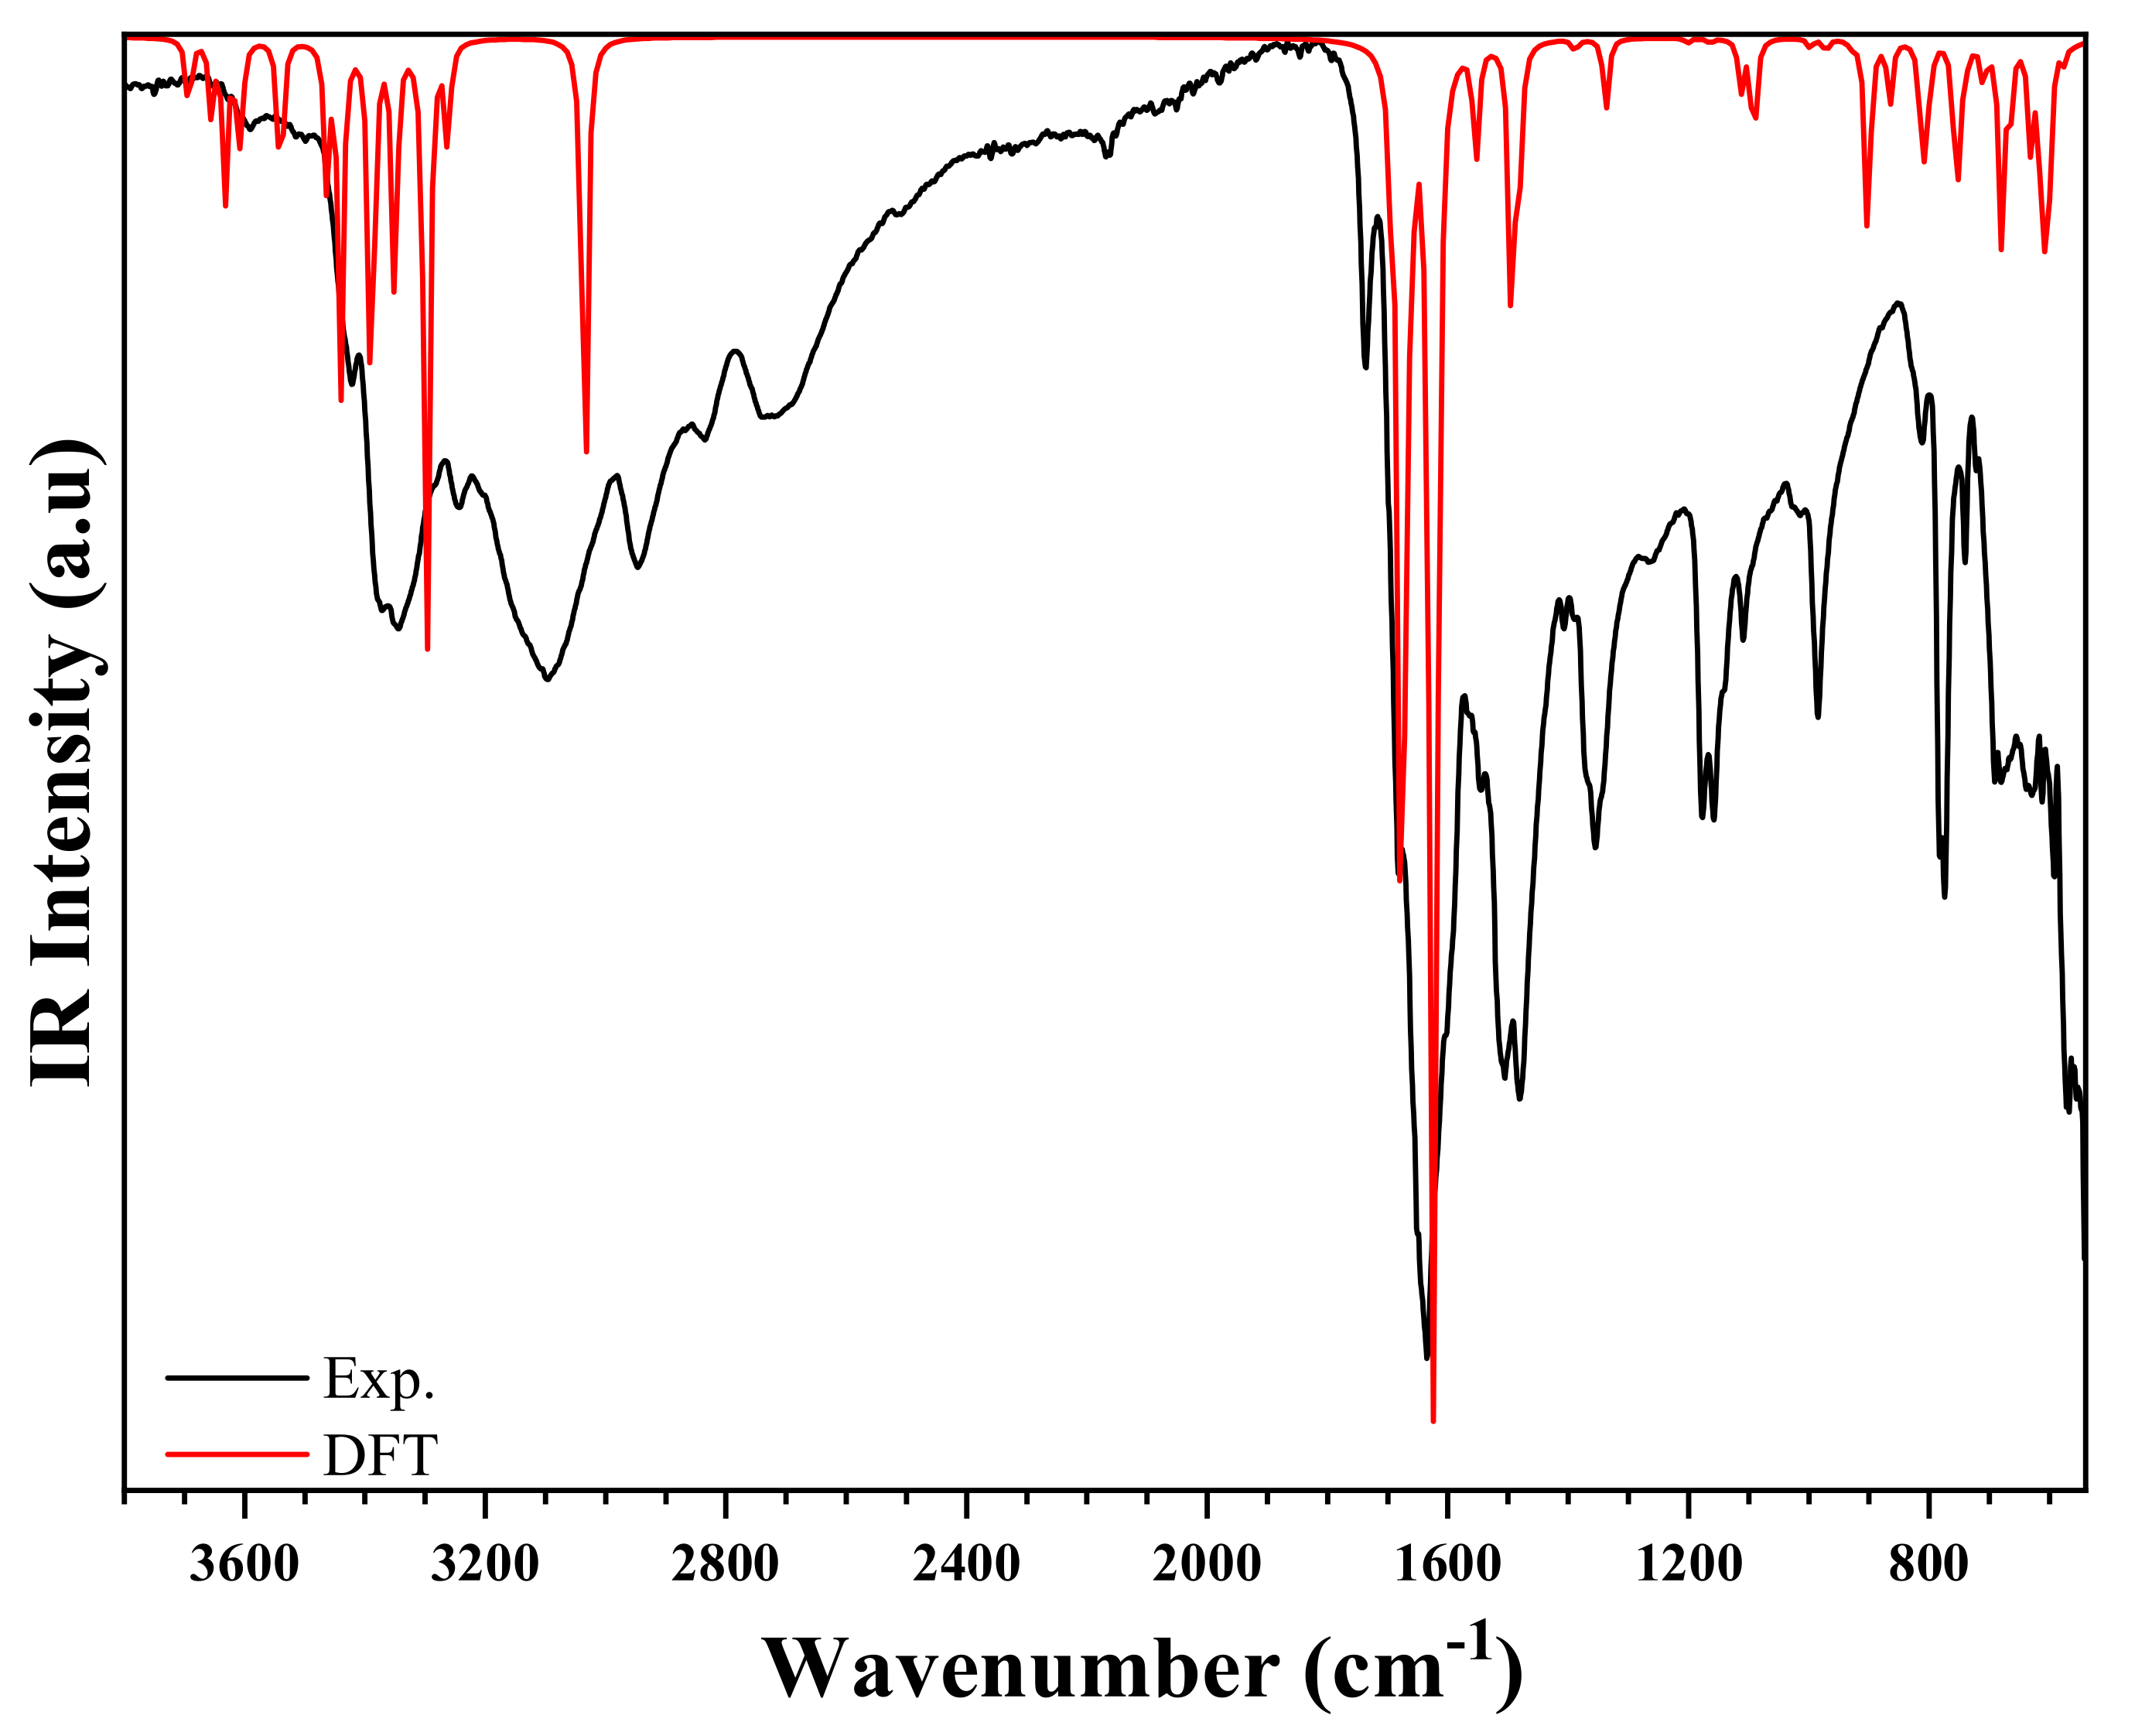
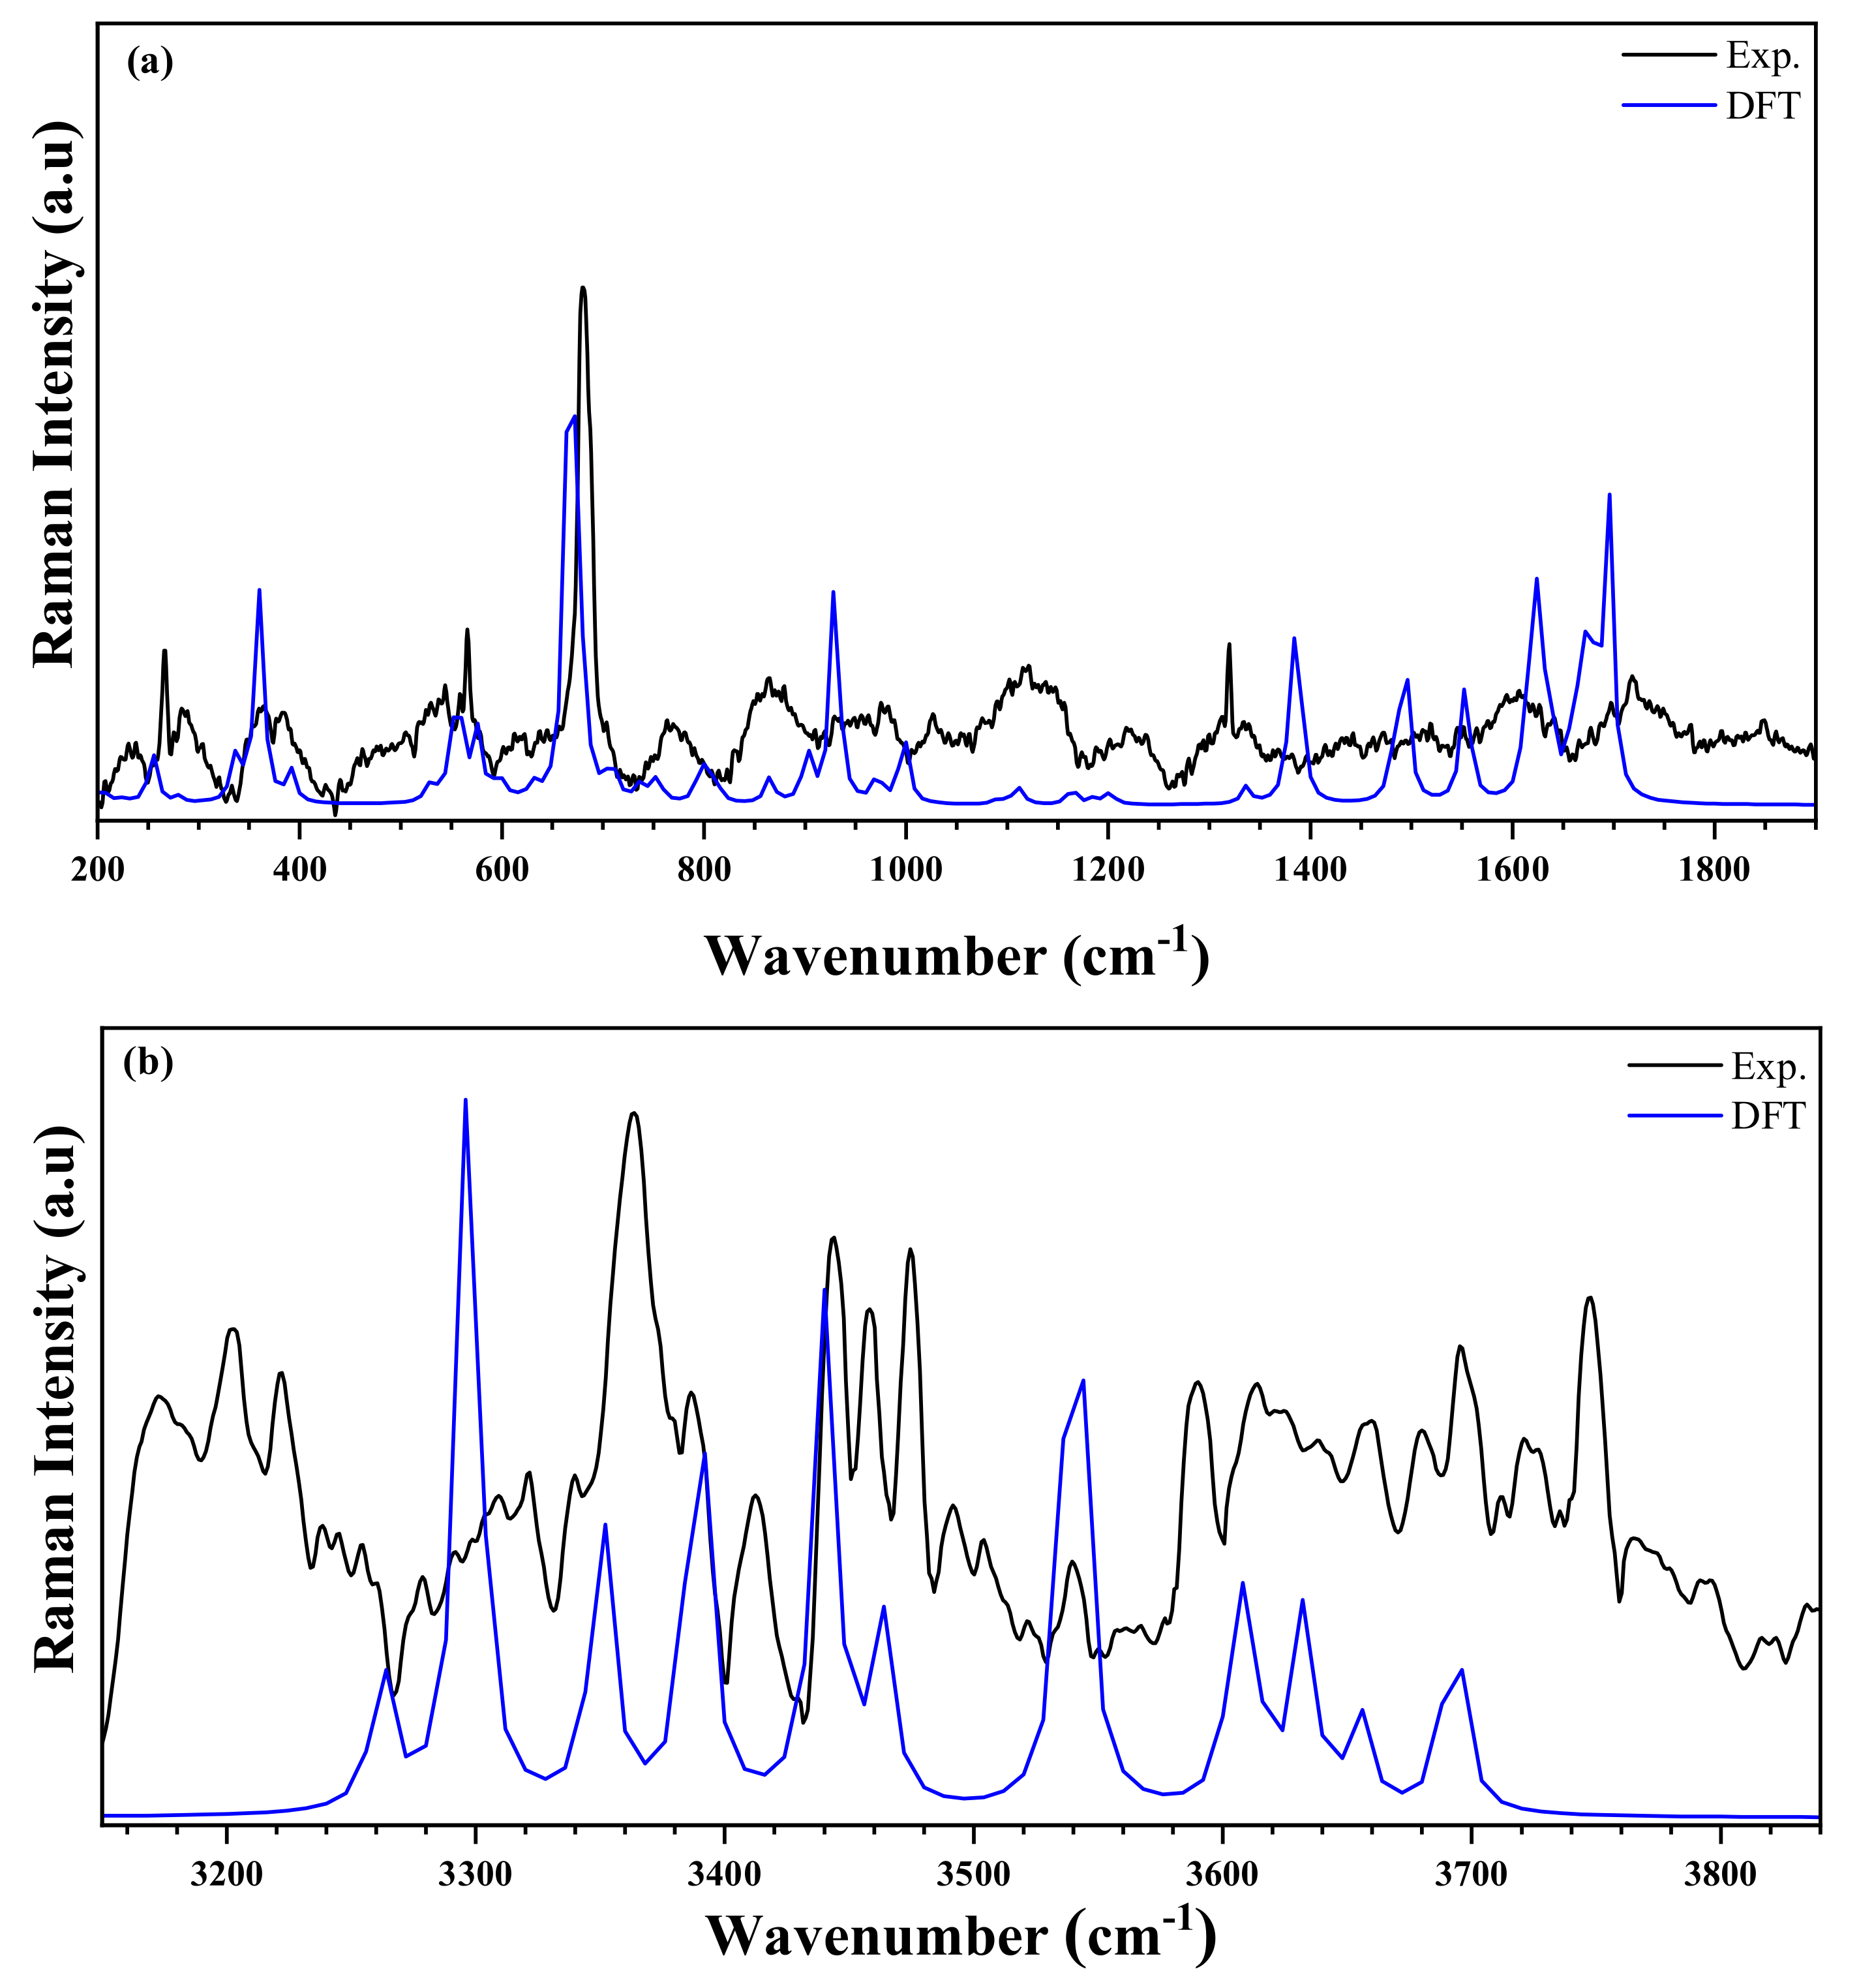
3.4. The FT-IR and Raman Spectroscopy
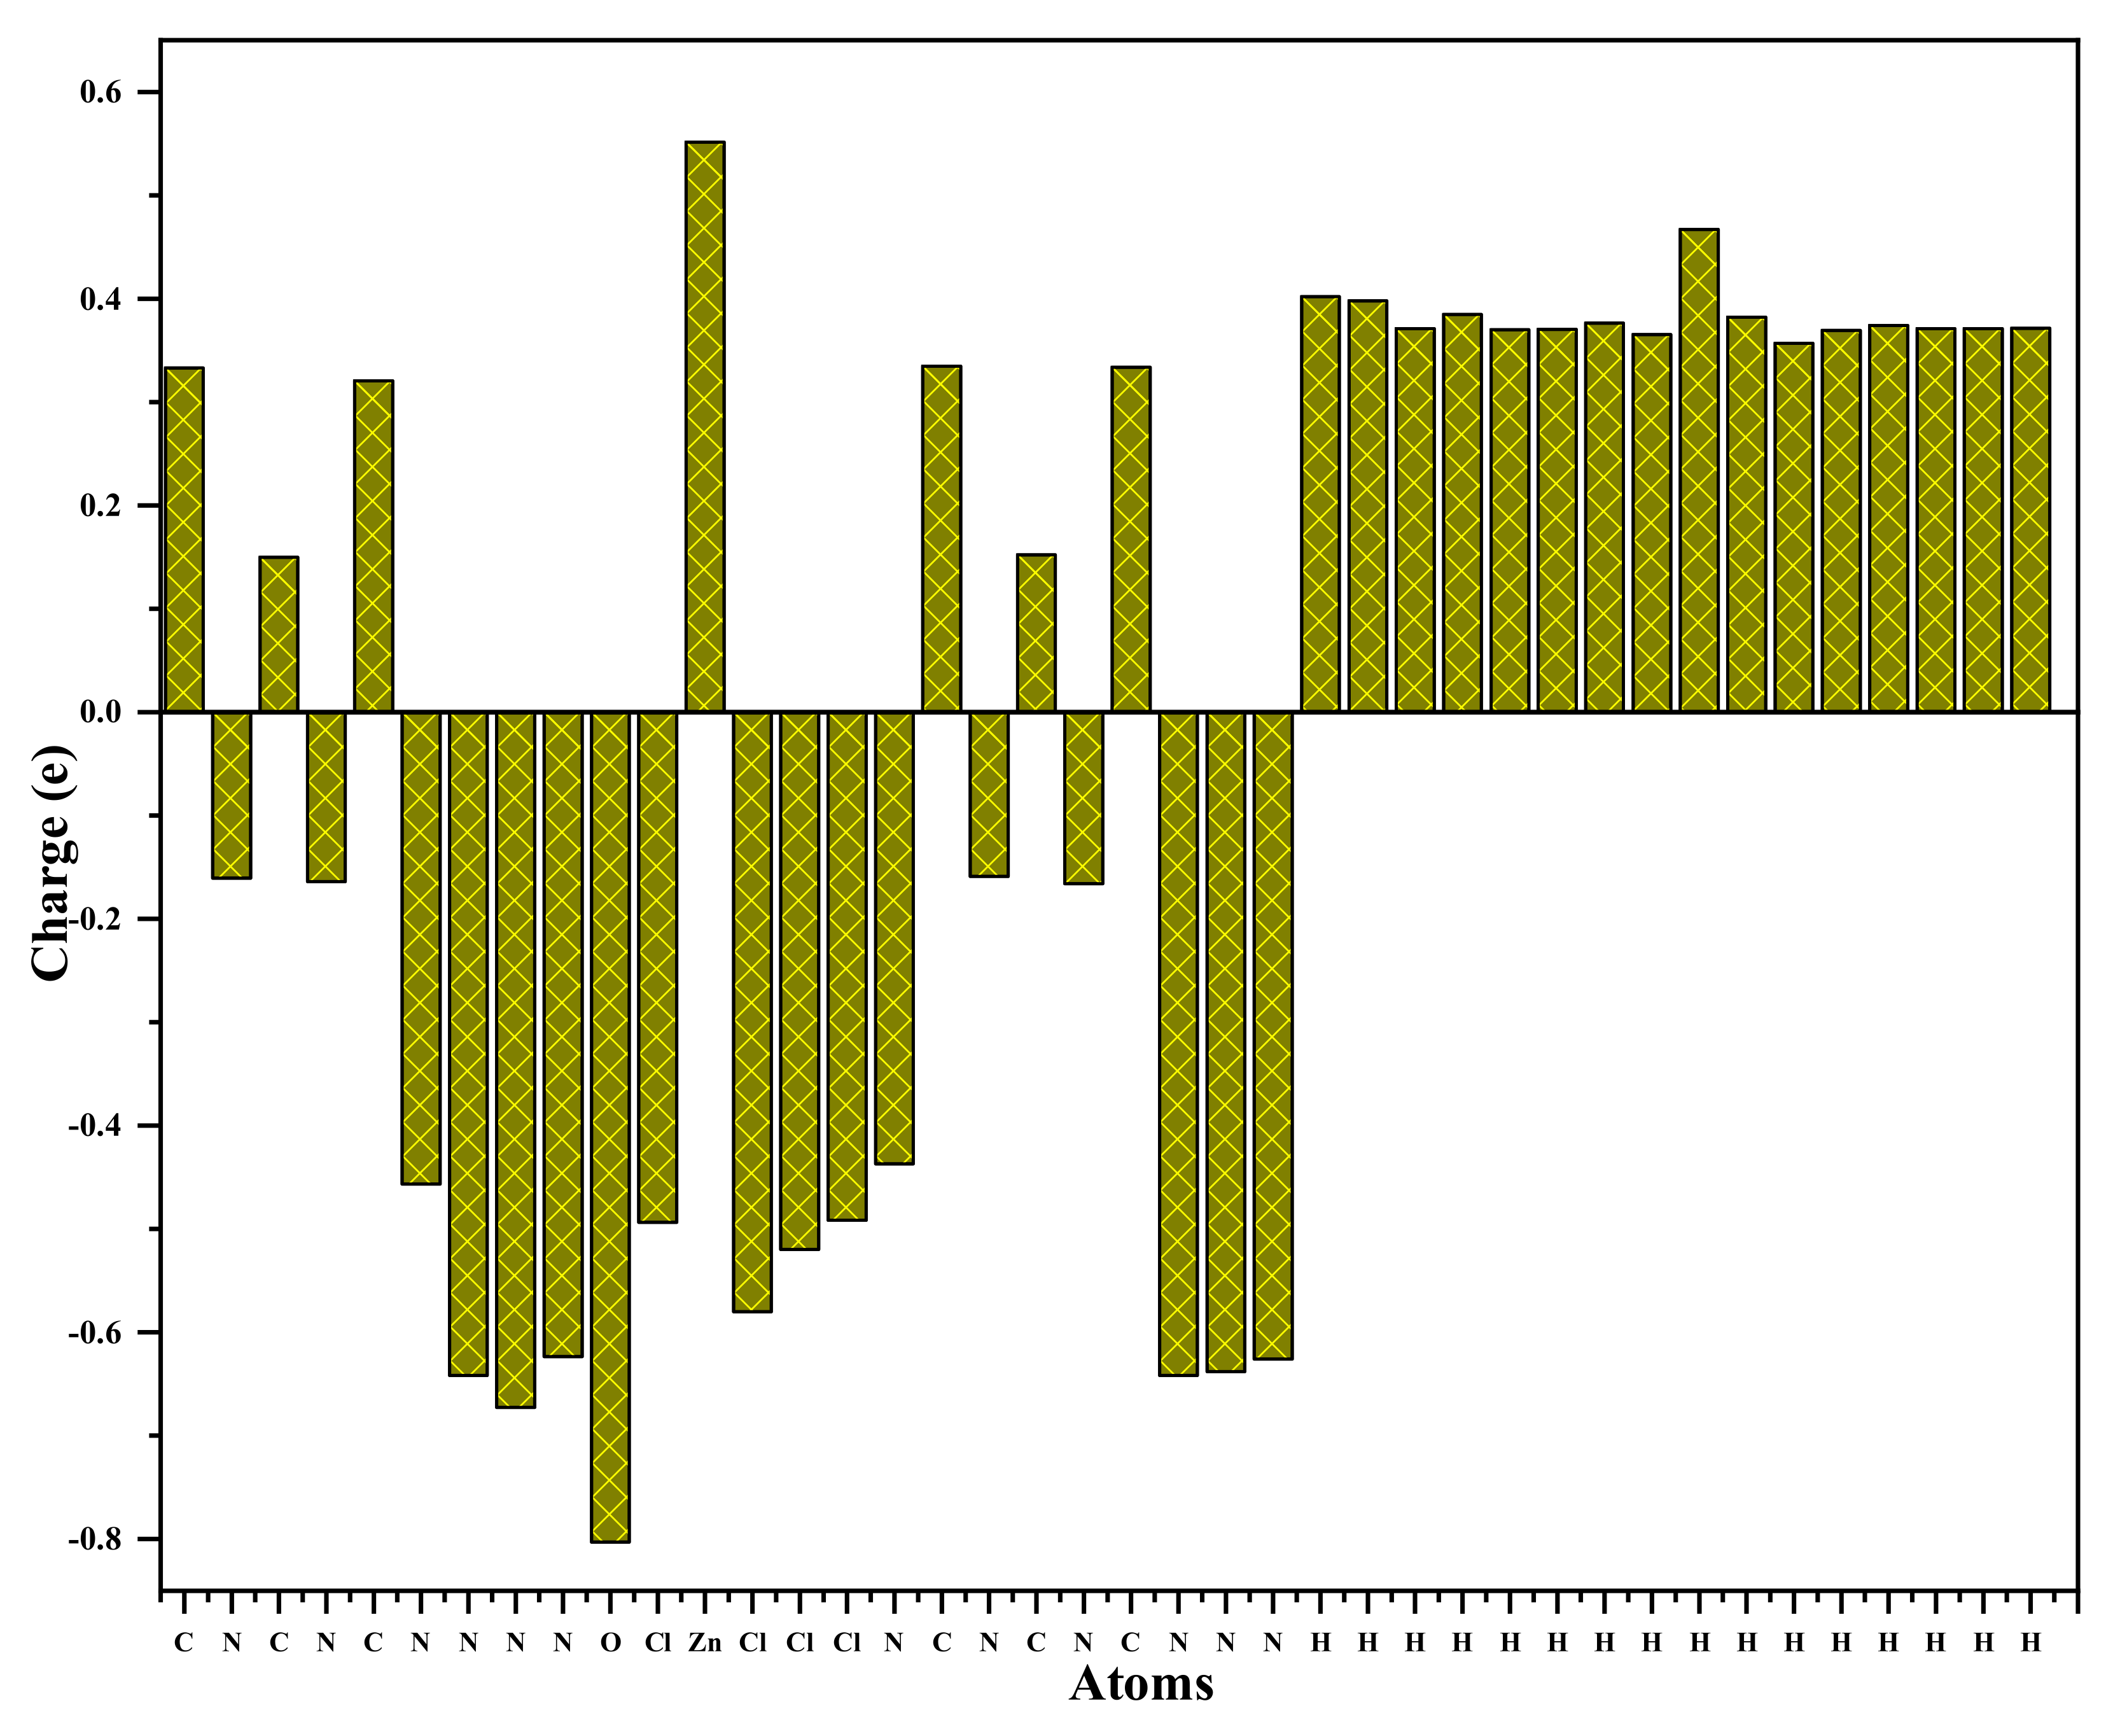
The IR (experimental and simulated), and the Raman (experimental and simulated) spectra of the title compound are exhibited in Figure 12 and Figure 13, respectively. The most significant bands are set forward in Table S3 referring to previous works reported in literature on similar compounds [55,56,57]. The experimental frequencies of the bands are compared to those obtained by the DFT calculation [58].
The IR spectrum is characterized by the presence of the different bands of organic groups, whereas the Raman spectrum 200 3950   cm 1 is characterized by the presence of vibration peaks of the anion [ZnCl4]2−. At high frequencies, the experimental FT-IR spectrum presents two peaks centered at 3778   cm 1 and 3499   cm 1 , corresponding to the asymmetrical and symmetrical vibration of O–H stretching. This vibration appears in the theoretical Raman spectrum at 3696   cm 1 and 3491   cm 1 , respectively [59]. The weak NH2 stretching asymmetric and symmetric elongation vibrations are observed at 3689   cm 1 in FTIR spectrum, and at 3696   cm 1 [59]. These modes appeared in simulated spectra in the range 3608   cm 1 . Furthermore, the N–H stretches are noticed in the experimental IR spectrum in the form of elongation vibration in the range 3372 3245   cm 1 . This mode appeared in Raman spectrum in the range 3387 3175   cm 1 [57,60]. Besides, at medium frequencies, the NH2 group exhibits a strain vibration in the range 1728 1677   cm 1 and 1723 1717   cm 1 in FTIR, and in Raman spectra, respectively [61]. These bands are observed in the theoretical spectra in the range of 1697   cm 1 . The other different peaks are detailed in Table S3. In the frequency range below 590   cm 1 , the experimental Raman spectrum showed the asymmetric and symmetric Zn–Cl stretching modes at 563   cm 1 and 465   cm 1 , respectively. Moreover, the same group has two asymmetric and symmetrical strain vibrations located at 363   cm 1 and 237   cm 1 , respectively. DFT calculations expressed these positions as 574   cm 1   ,   387   cm 1   ,   358   cm 1   ,   and   251   cm 1 , respectively. It is worth noting that there is a very reasonable agreement between the experimental and theoretical results [62,63].

3.5. Atomic Charge

The Mulliken charge distribution of the title compound is graphically represented in Figure 14. The distribution of the charges of this complex reveals that the zinc and the carbon atoms are positive. The nitrogen, oxygen, and chlorine atoms are negatively charged, while all the carbon and hydrogen atoms have a positive charge. The zinc atom, which has a positive charge amounting to 0.551, is surrounded by four negatively charged chlorine atoms (−0.494, −0.492, −0.520, −0.580). The nitrogen and oxygen atoms have negative charges (O (−0.802), N (−0.641, −0.672,−0.623, −0.625, −0.638, −0.641,−0.456,−0.437, −0.116, −0.159, −0.163, −0.165). In particular, the hydrogen atoms bonded to H2O molecules (hydrogen bonded to oxygen: Hw (0.398, 0.402) have a higher positive atomic charge. This is assigned to the presence of an electronegative oxygen atom. The negative charges that characterize the nitrogen, the oxygen and the chlorine atoms (Cl1, Cl2, Cl3 and Cl4) are consistent with their donor nature [64,65].

3.6. Natural Population Analysis (NPA)

The precise prediction of the distribution of electrons in various subshells of atomic orbitals, as well as the exploration of the electrostatic potential (electrophilic/nucleophilic nature) of the compound under study, are obtained by the analysis of the natural population. The total atomic charge values are provided in Table 3. As expected, the most negative charges were mainly on the N, O and Cl atoms. All hydrogen atoms were positively charged and all carbon atoms were charged positively. The positively charged carbon atom is due to bonding to an electronegative nitrogen atom. It has been found that the most electronegative charge is collected on the oxygen atom of the water molecule (electrophilic center). It can be seen in Table 3 that the other electrophilic regions are located on the chlorine atoms. While the most electropositive charge has accumulated on the zinc atom (Figure 15). The most positively and negatively charged atoms show intense portions of the structure’s electrophilic and nucleophilic sites and where hydrogen bonding interactions occur. Accordingly, the title compound can be considered to have a high electrophilic nature.

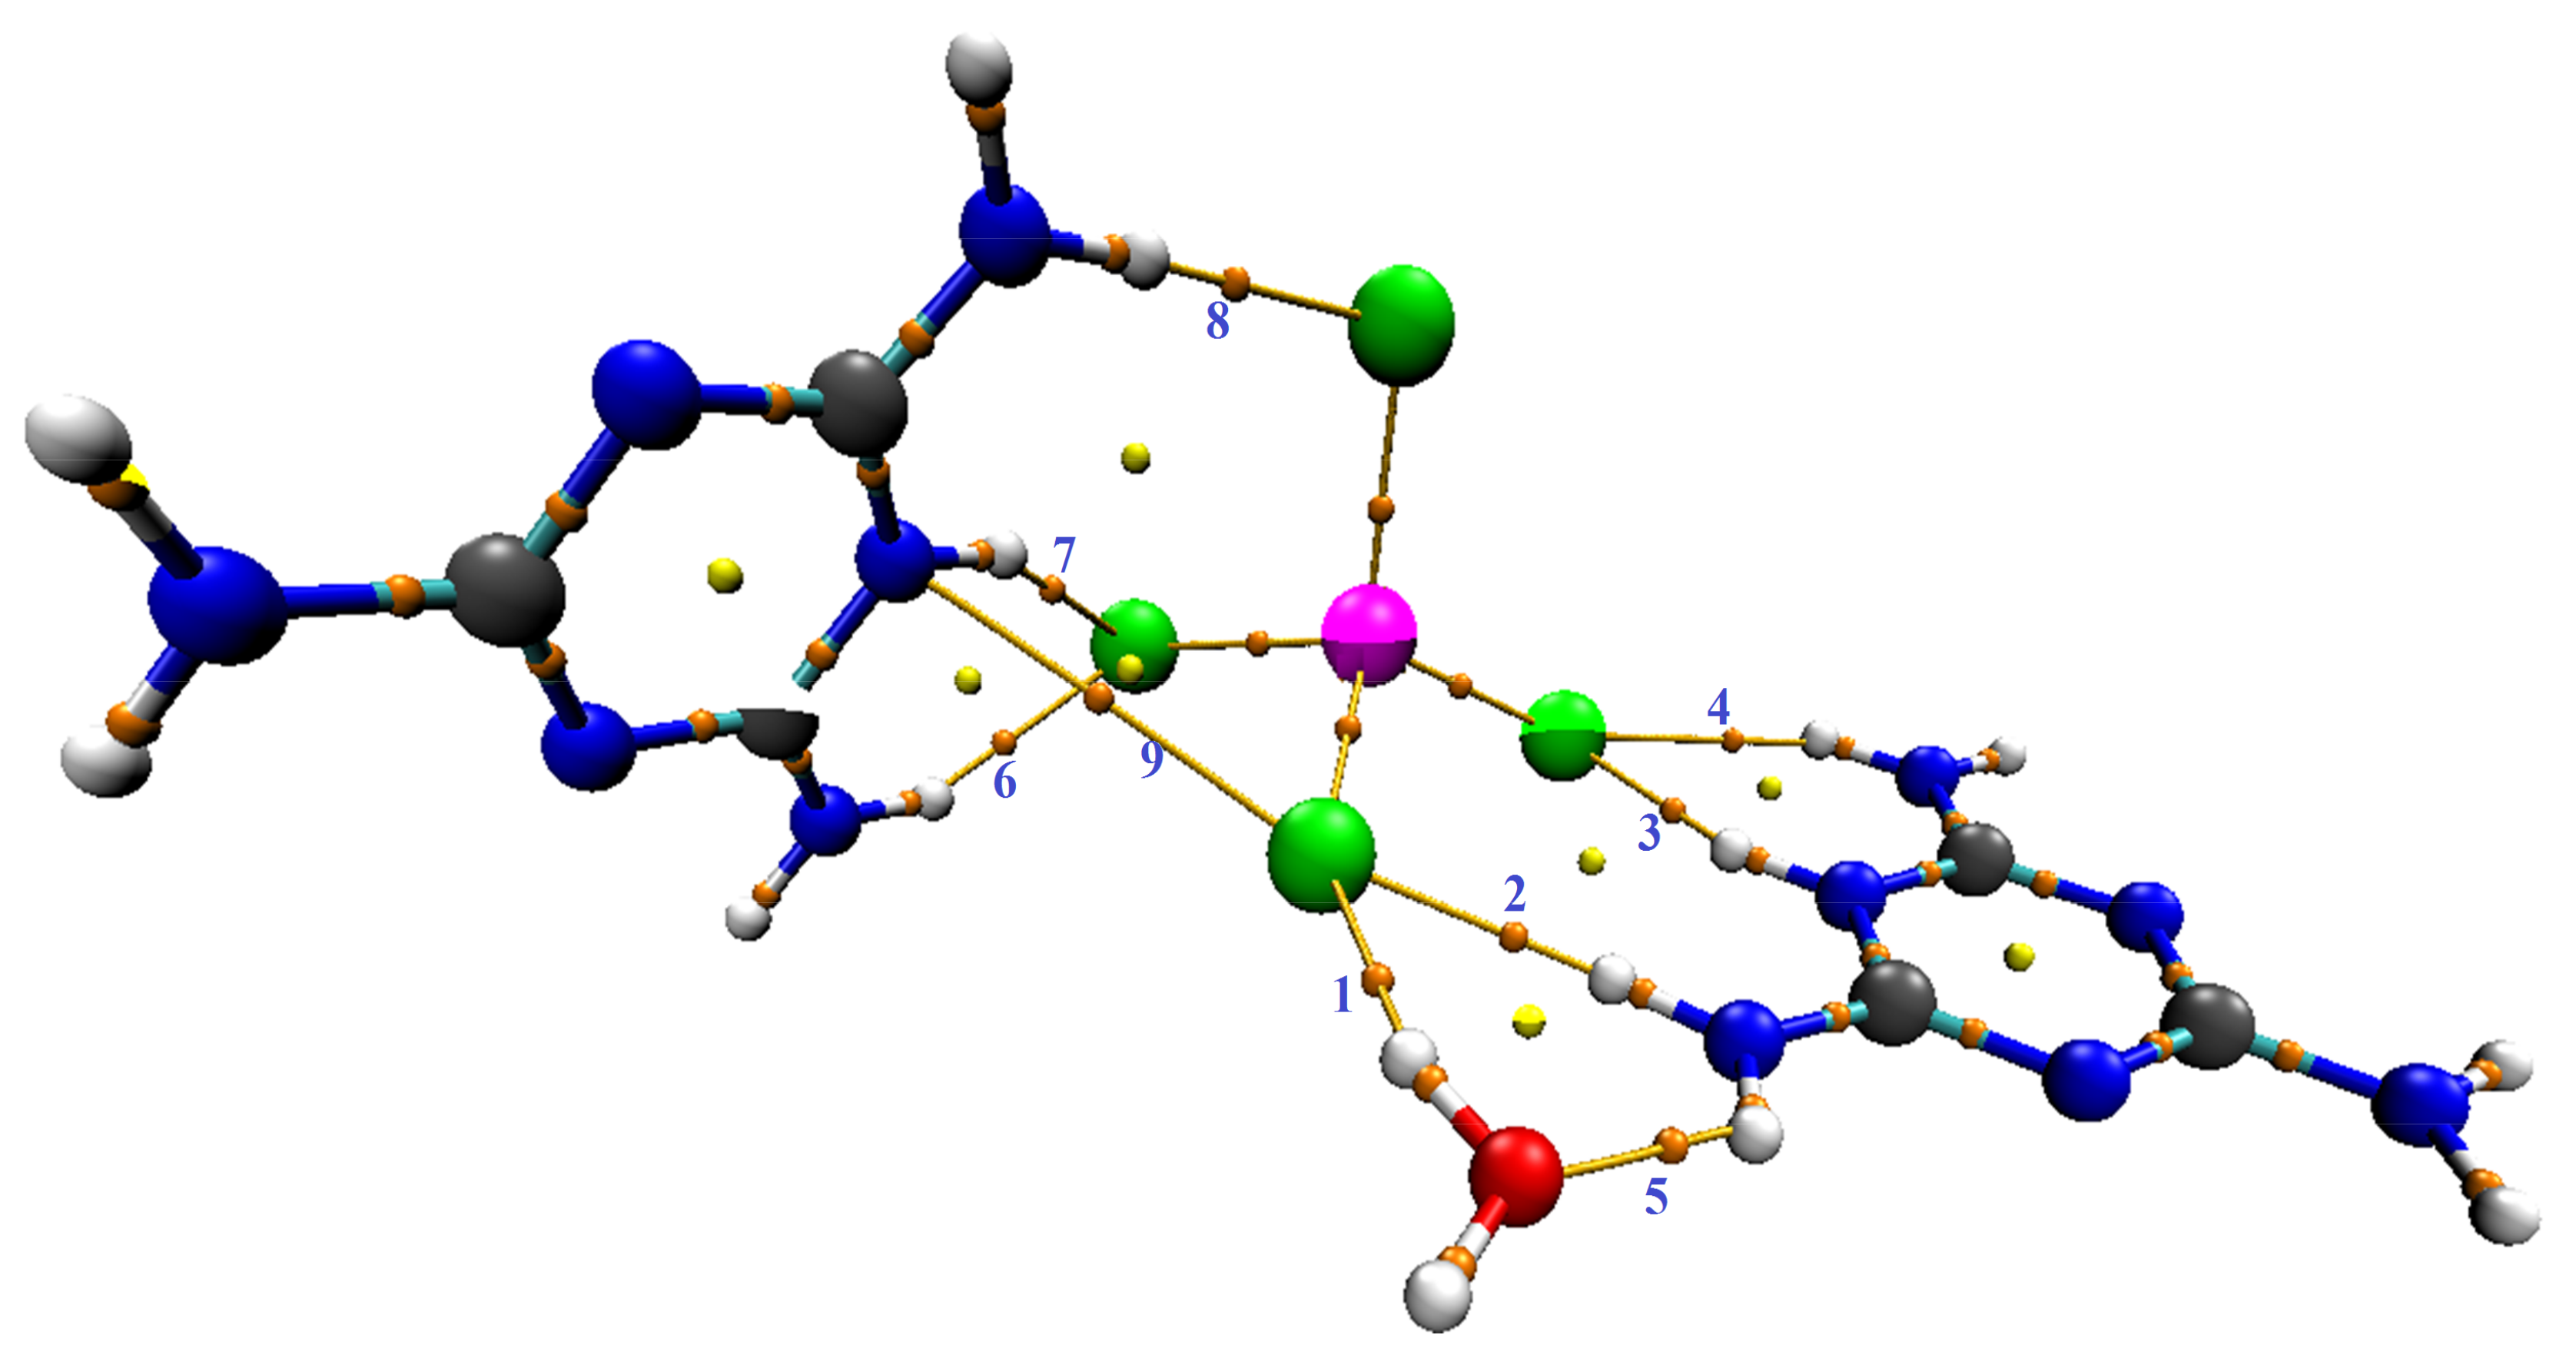
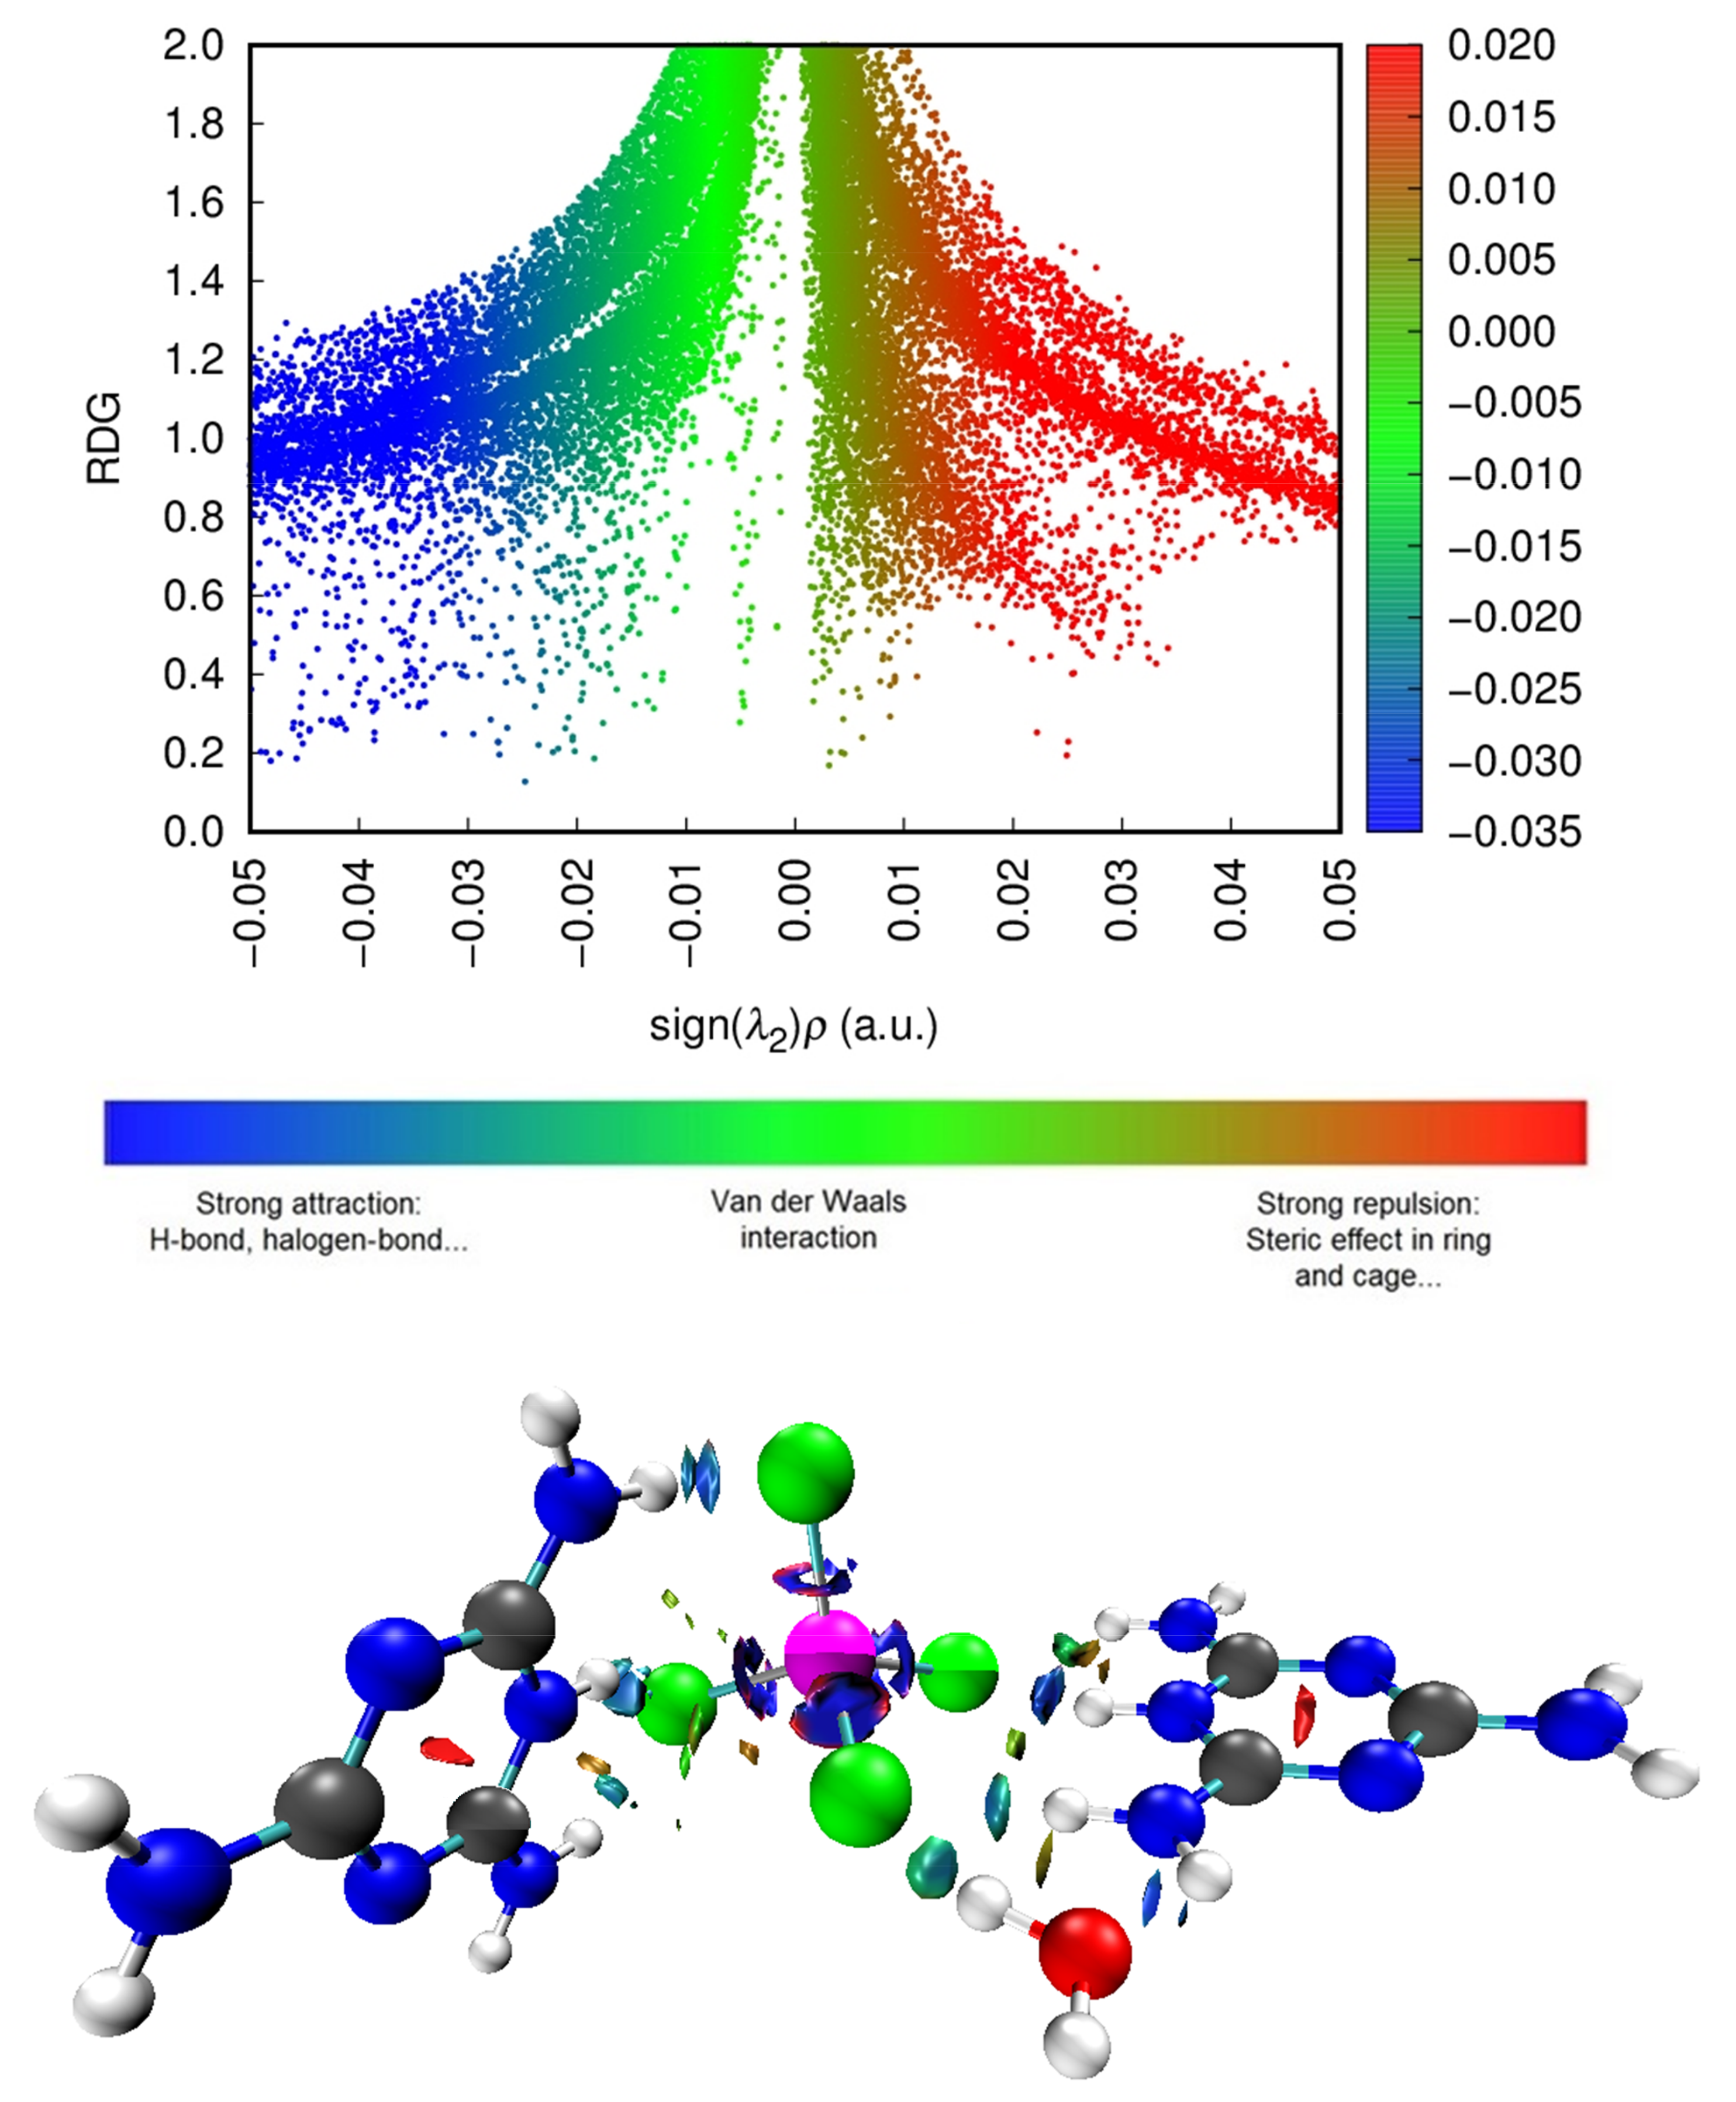
3.7. Topological Analysis

Our goal is the in-depth study of this new compound, the most important of which knows the interactive nature between atoms. To find out these interactions, we used topological analyses, which are mainly based on finding the Critical Bond Point (BCP). The existence of a “bond pathway” (or BCP) between two atoms is based primarily on the existence of a covalent or non-covalent bond resulting from the interactions between the two atoms involved [66]. Figure 16 shows the AIM presentation of (C3H7N6)2[ZnCl4]·H2O generated with Mutiwfn and VMD softwares. Table 3 includes topological parameters where: ρ(r) (density of all electrons), ∇2ρ(r) (Laplacian of electron density), E(r) (energy density), G(r) (Lagrangian kinetic energy densities), V(r) (potential energy densities) and ESP (from nuclear charges).
Table 4 and Figure 16 show that there are nine bond critical points (BCPs) in this compound: eight BCPs characterize X–H···Y (X = N or O and Y = O or Cl) hydrogen bonds (six of which are N–H···Cl hydrogen bonds, one-of-a-kind O–H···Cl and another one-of-a-kind N–H···O). The Table 3 also shows the presence of an N···Cl interaction. The electron density value of BCP (as per Table 4) indicates the intermolecular interaction strength, according to the literature [67,68,69,70]. We can evaluate the strength of the interactions according to the values classified in the table for the sign of the total energy density and the sign of the Laplacian of electron density. As Table 4 shows, the majority are low bond E(r), i.e., out of nine bonds there are five where E(r) < 0 and four where E(r) > 0, while all bonds have positive Laplacian of electron density (∇2ρ(r) > 0 and E(r) > 0); this means that the interactions are more stable and the interaction is partially covalent in nature (8) [69]. To further understand the nature of the interactions, we used the calculation of the ratio (-V(r)/G(r)). According to the values listed in Table 4, the values are categorized into two groups: first for ratio >1 attributed to interactions N–H···Cl and O–H···Cl, and second for ratio <1 attributed to only one N–H···Cl and one N–H···O, and to the interaction which is of the type N···Cl. We found that the values of ESP are high, which proves that the interactions of hydrogen bonds between molecules are very strong, and we can confirm that our sample is well stabilized by hydrogen bonds. We studied the electronic densities, which are represented in the topology described above, and now present the low-density gradient (RDG) that would depict for us the strength of the interactions (H-bond, van der Waals interactions, sterile effect...). It also shows interactions that did not appear in the AIM analysis. In addition, by using the scatter diagram and the three-dimensional 3-D isosurfaces of (C3H7N6)2[ZnCl4]·H2O in Figure 17, we can study the NCI-RDG analysis that is the subject of our interest in this section [44,71]. The different colors showed in the RDG isosurface of Figure 17 indicate the type of interactions. The blue colors are for the h-bond. The strong attraction of this bond has a decrease of the electronic density ρ(r) while the repulsion part has an increase of ρ(r). The green color represents the van der Waals interaction for this type of bonds. The electronic density is null, and the red color is for the steric effect.
To classify the interactions with the color scale from −0.035 to 0.02, three colors were used: red, green and blue in the surface diagram. The red color symbolizes the destabilizing interactions of the crystal, the blue regions are the stabilizing regions, and the green color indicates the weak interactions; finally, regions with mixed colors represent mixed interactions. Using the values of the isosurfaces from −0.05 to 0.05 a.u, the scatter diagram colors were determined and distributed all along the abscissa axis of the sign (λ2)ρ. The appearance of red spots indicates sterile repulsion effects that are mainly found in the center of aromatic cores of organic molecules, blue and green spots indicating the presence of the stabilizing interactions of the studied compound provided by the H-bond, halogen and van Der Waals interactions, respectively.

3.8. Linear and Nonlinear Optical Properties

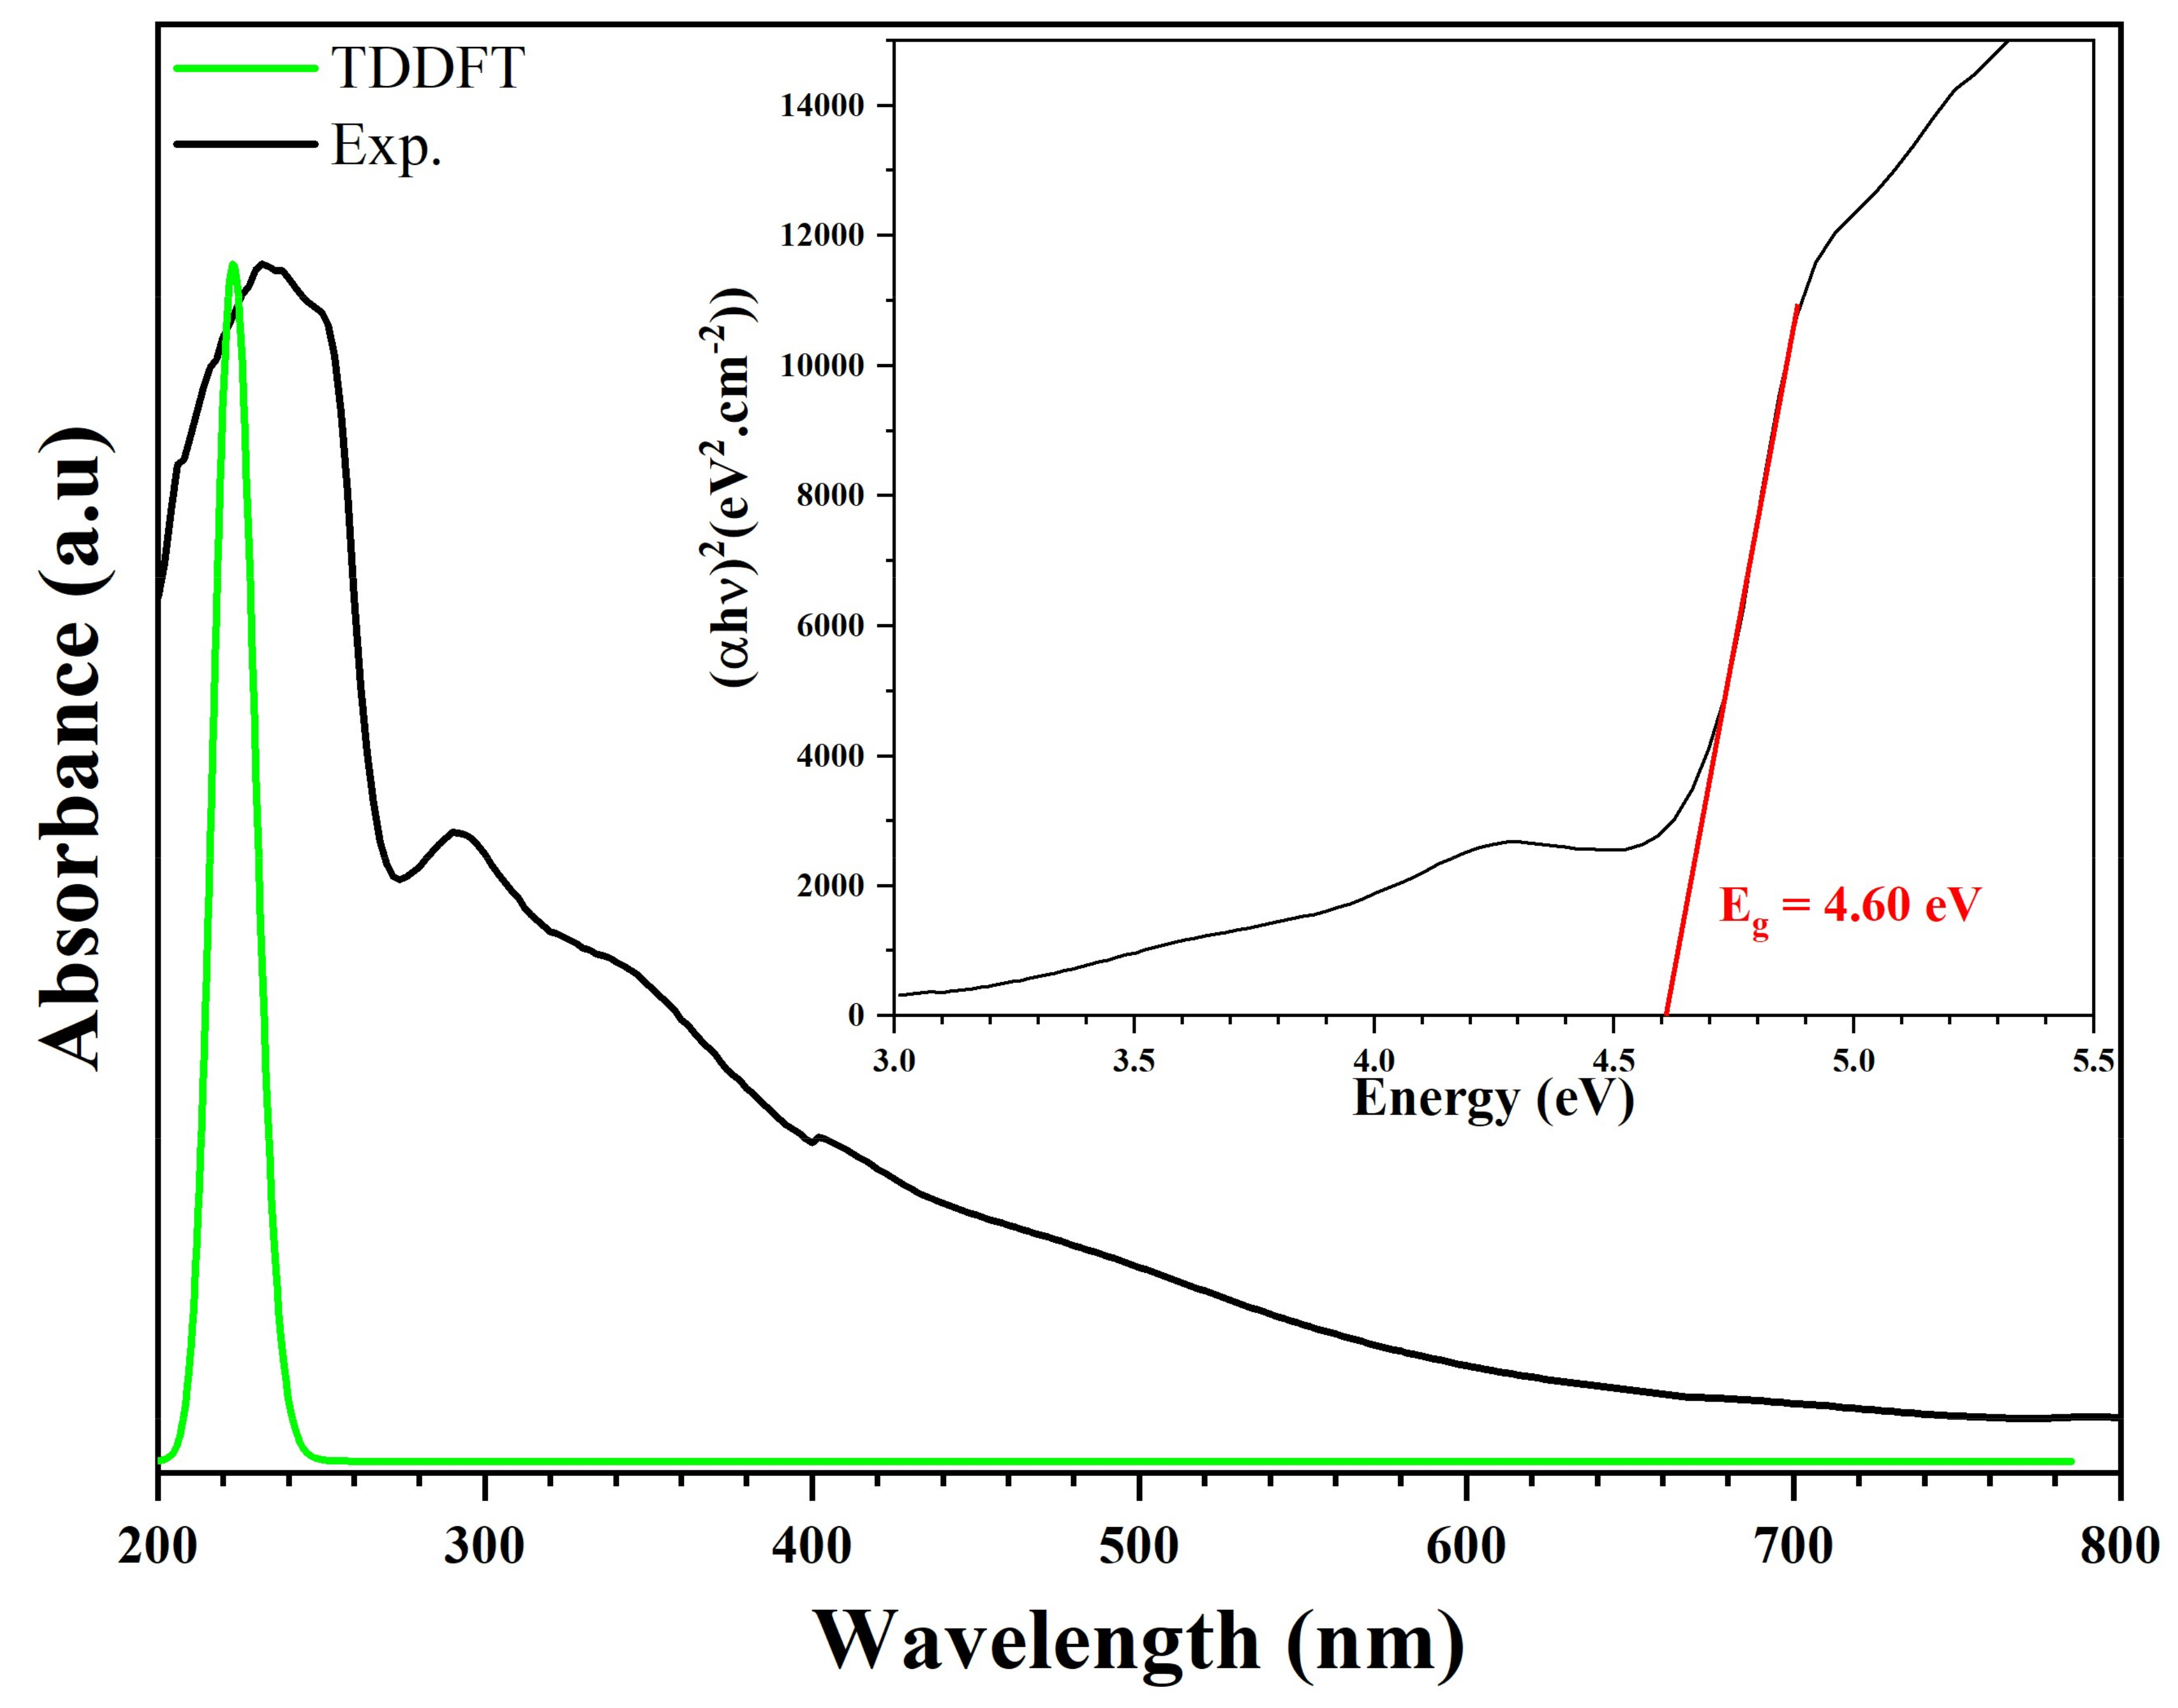
3.8.1. UV-Visible Absorption Spectrum

We recorded the experimental and theoretical optical absorption spectrum of (C3H7N6)2[ZnCl4]·H2O. This measurement ranged from 200 nm to 800 nm, as shown in Figure 18. This compound exhibits good optical transparency throughout the visible area. This low absorption, which extends over the entire visible region, is a good characteristic of this synthetic compound for NLO applications. Thus, this compound can be used in the fabrication of NLO devices. The experimental UV representation shows intense banding at λ1 (Exp.) = 233 nm (5.32 eV) attributed to the π–π* transition of (C3H7N6)+. This peak is superimposable to the theoretical representation on the UV-vis spectrum, near λ1 (Theo) = 223 nm (5.56 eV). An average experimental peak, caused by the charge transfer from the anion to the cation, appeared at λ2 (Exp.) = 291 nm (4.26 eV). We find a good agreement between the observed and calculated spectra [59,72,73]. We calculated the optical band gap (Eg) from the transmission spectrum and the optical absorption coefficient (α(cm−1)). The optical absorption coefficient was calculated from the absorbance using the following equation [59]:
α = 2.303 A t
where t   is   the   sample   thickness   and   A   expresses   the   absorbance . The value of the optical band gap E g is related to the absorption coefficient using the equation [74]:
α h ν = C h ν E g n
where C is a constant, is the incident photon energy, Eg is the gap energy of the optical band gap and n is a factor determined by the nature of the electronic transitions during the absorption process. The graphical representation of α h ν 2 as a function of h ν   e V is utilized in the same Figure 18. Using the interception of the linear part with the energy axis α h ν 2 = 0 , we determined the value of the optical band gap of the order of 4.60 eV; this result is close to the gap energy of hybrid compounds based on ZnCl4 research published by Karuppasamy et al., (4.1 eV), El Mrabet et al. (4.9 eV), and Kassou et al. (4.46 eV), respectively [75,76,77].

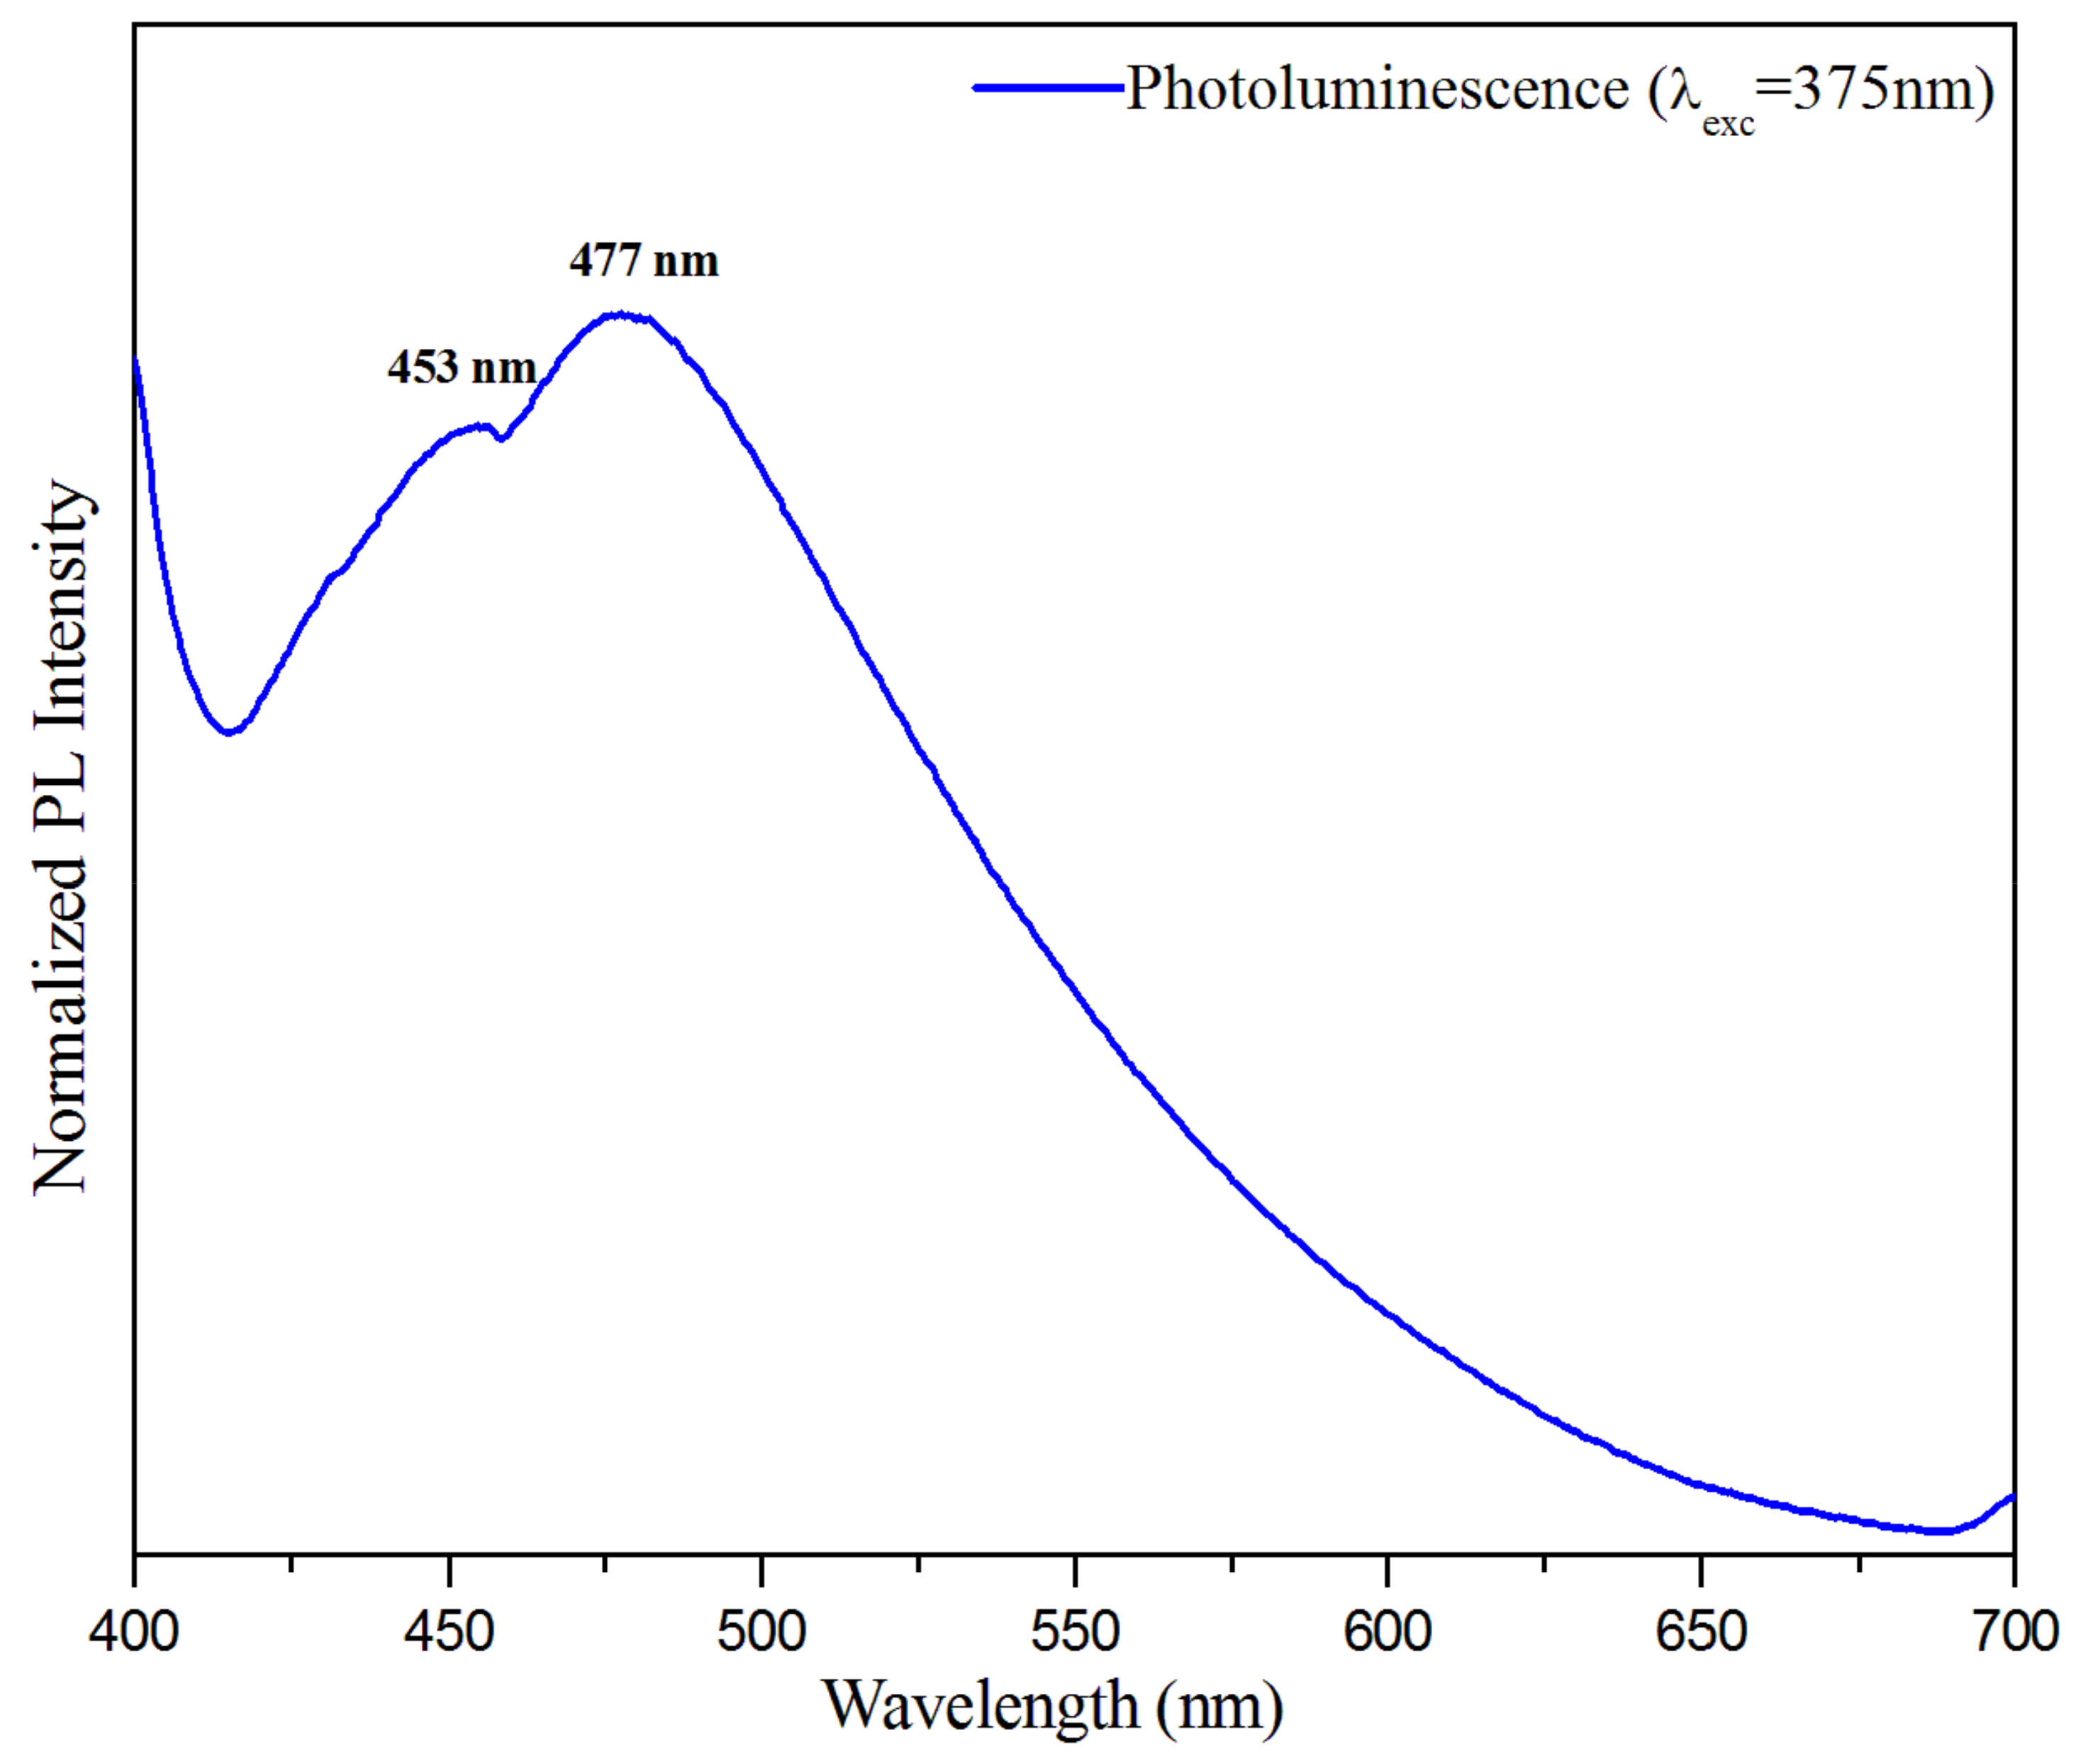
3.8.2. Photoluminescence Behavior

The solid-state photoluminescence was recorded to investigate the optical properties from any form of matter after the absorption of photons. The photoluminescence (PL) spectrum of the title compound was measured at room temperature, with an excitation wavelength of 375   nm . As can be inferred from Figure 19, the spectrum of the compound (C3H7N6)2[ZnCl4]·H2O is characterized by both band emissions around 453   nm and 477   nm . These emissions are almost within the luminescence range observed for other materials containing melamine and [ZnCl4] anion, in separate compounds [78,79,80,81]. In this context, the title compound can be said to consist of two luminescent entities: the inorganic ion [ZnCl4]2− displays emission in the visible region around 453   nm , and the organic cation (C3H7N6)+ displays emission at broad band with a maximum at 477   nm . This result was examined for hybrid compounds based on ZnCl4 published by Samet et al. and Zhang et al., respectively [79,82]. According to the PL spectrum of this compound, a simple shift of the intensity value is comparable to those found in the literature, due to the stacking of the aromatic rings of the cation (H-mel) and their interaction with the anion [ZnCl4]2−.

3.8.3. Nonlinear Optical Parameters

To study the nonlinear optical of our complex, we calculated electric dipole moment, isotropic polarizability, and the second hyperpolarizability. To calculate the non-centralization of the charge and to express the nonlinear optical effects of (C3H7N6)2[ZnCl4]·H2O, we used the second-order hyperpolarizability calculation and its components, such as total dipole moment, average linear polarization and the second molecular hyperpolarizability, and for this purpose we used the following equations:
μ t o t = μ x 2 + μ y 2 + μ z 2
α t o t = α x x + α y y + α z z 3
γ = 1 5 γ x x x x + γ y y y y + γ z z z z + 2 γ x x y y + γ x x z z + γ y y z z
The values of polarizability αtot, second polarizability γ , were calculated using a Gaussian 09 program using the base WB97XD/Lanl2dz, reported in atomic units (𝑎.𝑢.), these calculated values are converted to electrostatic units (𝑒𝑠𝑢): αtot: 1 au = 0.1482 × 10⁻²⁴ esu, γ :   1   a u = 0.50367 × 10 39   esu . These results are collated in Table S4, which shows that the calculated dipole moment is 9.1013 D (Debye). The highest value of the component dipole moment is for μy, and it is equal to −9.0788 D. As for the μx and μz directions, its value is equal to 0.3840 D and −0.5113 D, respectively.
The calculated polarizability α t o t , is equal to 22.4722 × 10 24   esu . The calculated polarizability α i j has non-zero values and was dominated by the diagonal components. The second hyperpolarizability value γ of our compound is equal to 24308 × 10 36   esu . The second hyperpolarizability is dominated by the diagonal components of γ x x x x . Domination of particular components indicates a substantial delocalization of charges in these directions. In other directions, the particular components are practically low. The non-zero γ value is probably due to the charge transfer between the organic cation and the ZnCl4 anion which facilitates the delocalization of the electronic charge density. Based on the above facts, it could be proposed that this material can be better placed for nonlinear optical applications.

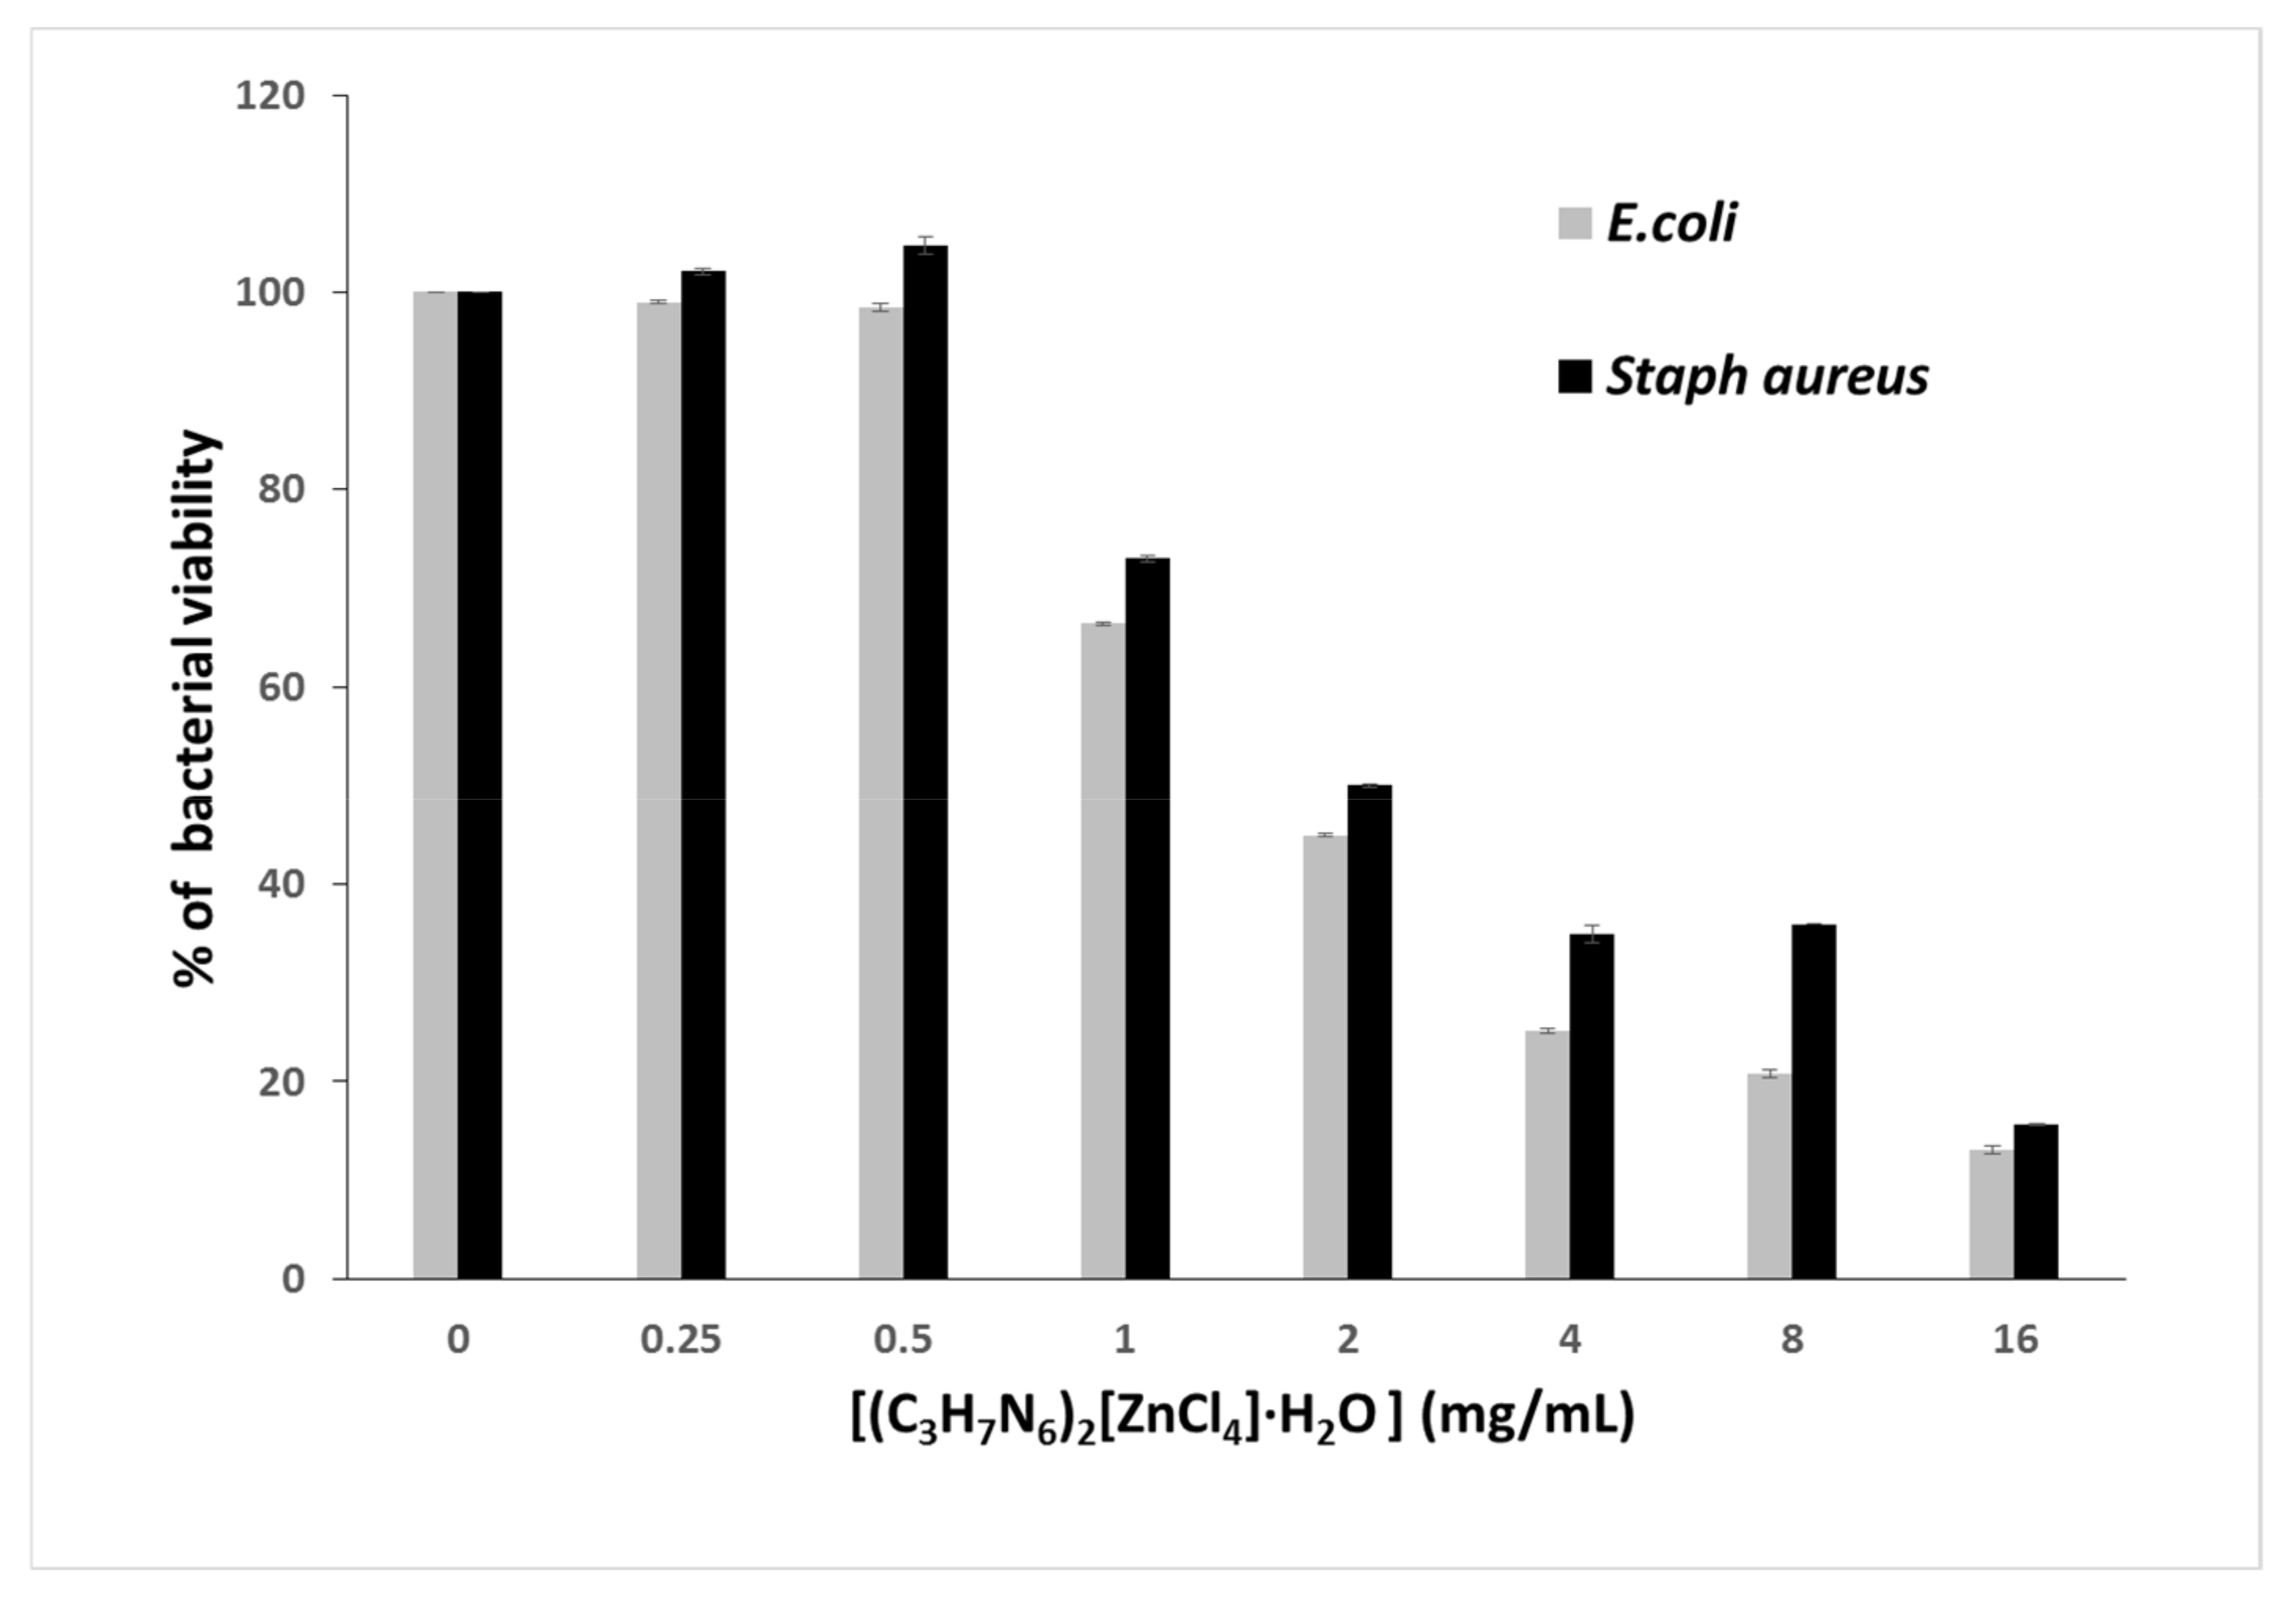
3.9. Antimicrobial Activity

Despite the progress in human medicine, infectious diseases caused by bacteria are still a major threat to public health. The continuous evolution of microbial pathogens towards antibiotic-resistance requires the development of new and effective antimicrobial compounds. Research on new antimicrobial substances must therefore be continued and all possible strategies should be explored. In this line, the antibacterial activity of (C3H7N6)2[ZnCl4]·H2O was evaluated against Gram(+) (Listeria monocytogenes, Micrococcus luteus, Staphylococcus aureus) and Gram (−) (Escherichia coli, Enterococcus faecalis, Salmonella typhi) bacteria. Using the agar diffusion method, antibacterial activity was determined by measuring the diameter of the clear zone of growth inhibition and the determination of MIC values (mg/mL). As shown in Table 5, (C3H7N6)2[ZnCl4]·H2O showed an efficient antibacterial activity against Gram-positive and Gram-negative strains. The inhibition zones and MIC values of microbial strains were in the range of 6–20 mm using 1 and 3 mg/mL of (C3H7N6)2[ZnCl4]·H2O, respectively.
In order to accurately specify the MIC, the microwell dilution method revealed an increase in antibacterial activity, which increases with increasing concentration of (C3H7N6)2[ZnCl4]·H2O with an MIC of 2.8 mg/mL (Figure 20).
This inhibitory effect can be explained by the (C3H7N6)2[ZnCl4]·H2Odisruption of bacterial membrane that causes metabolic dysfunction and finally leads to bacterial death. Indeed, the integrity of the bacterial plasmic membrane is responsible for osmoregulation, respiration, biosynthesis and reticulation of peptidoglycan, as well as lipid biosynthesis [83].

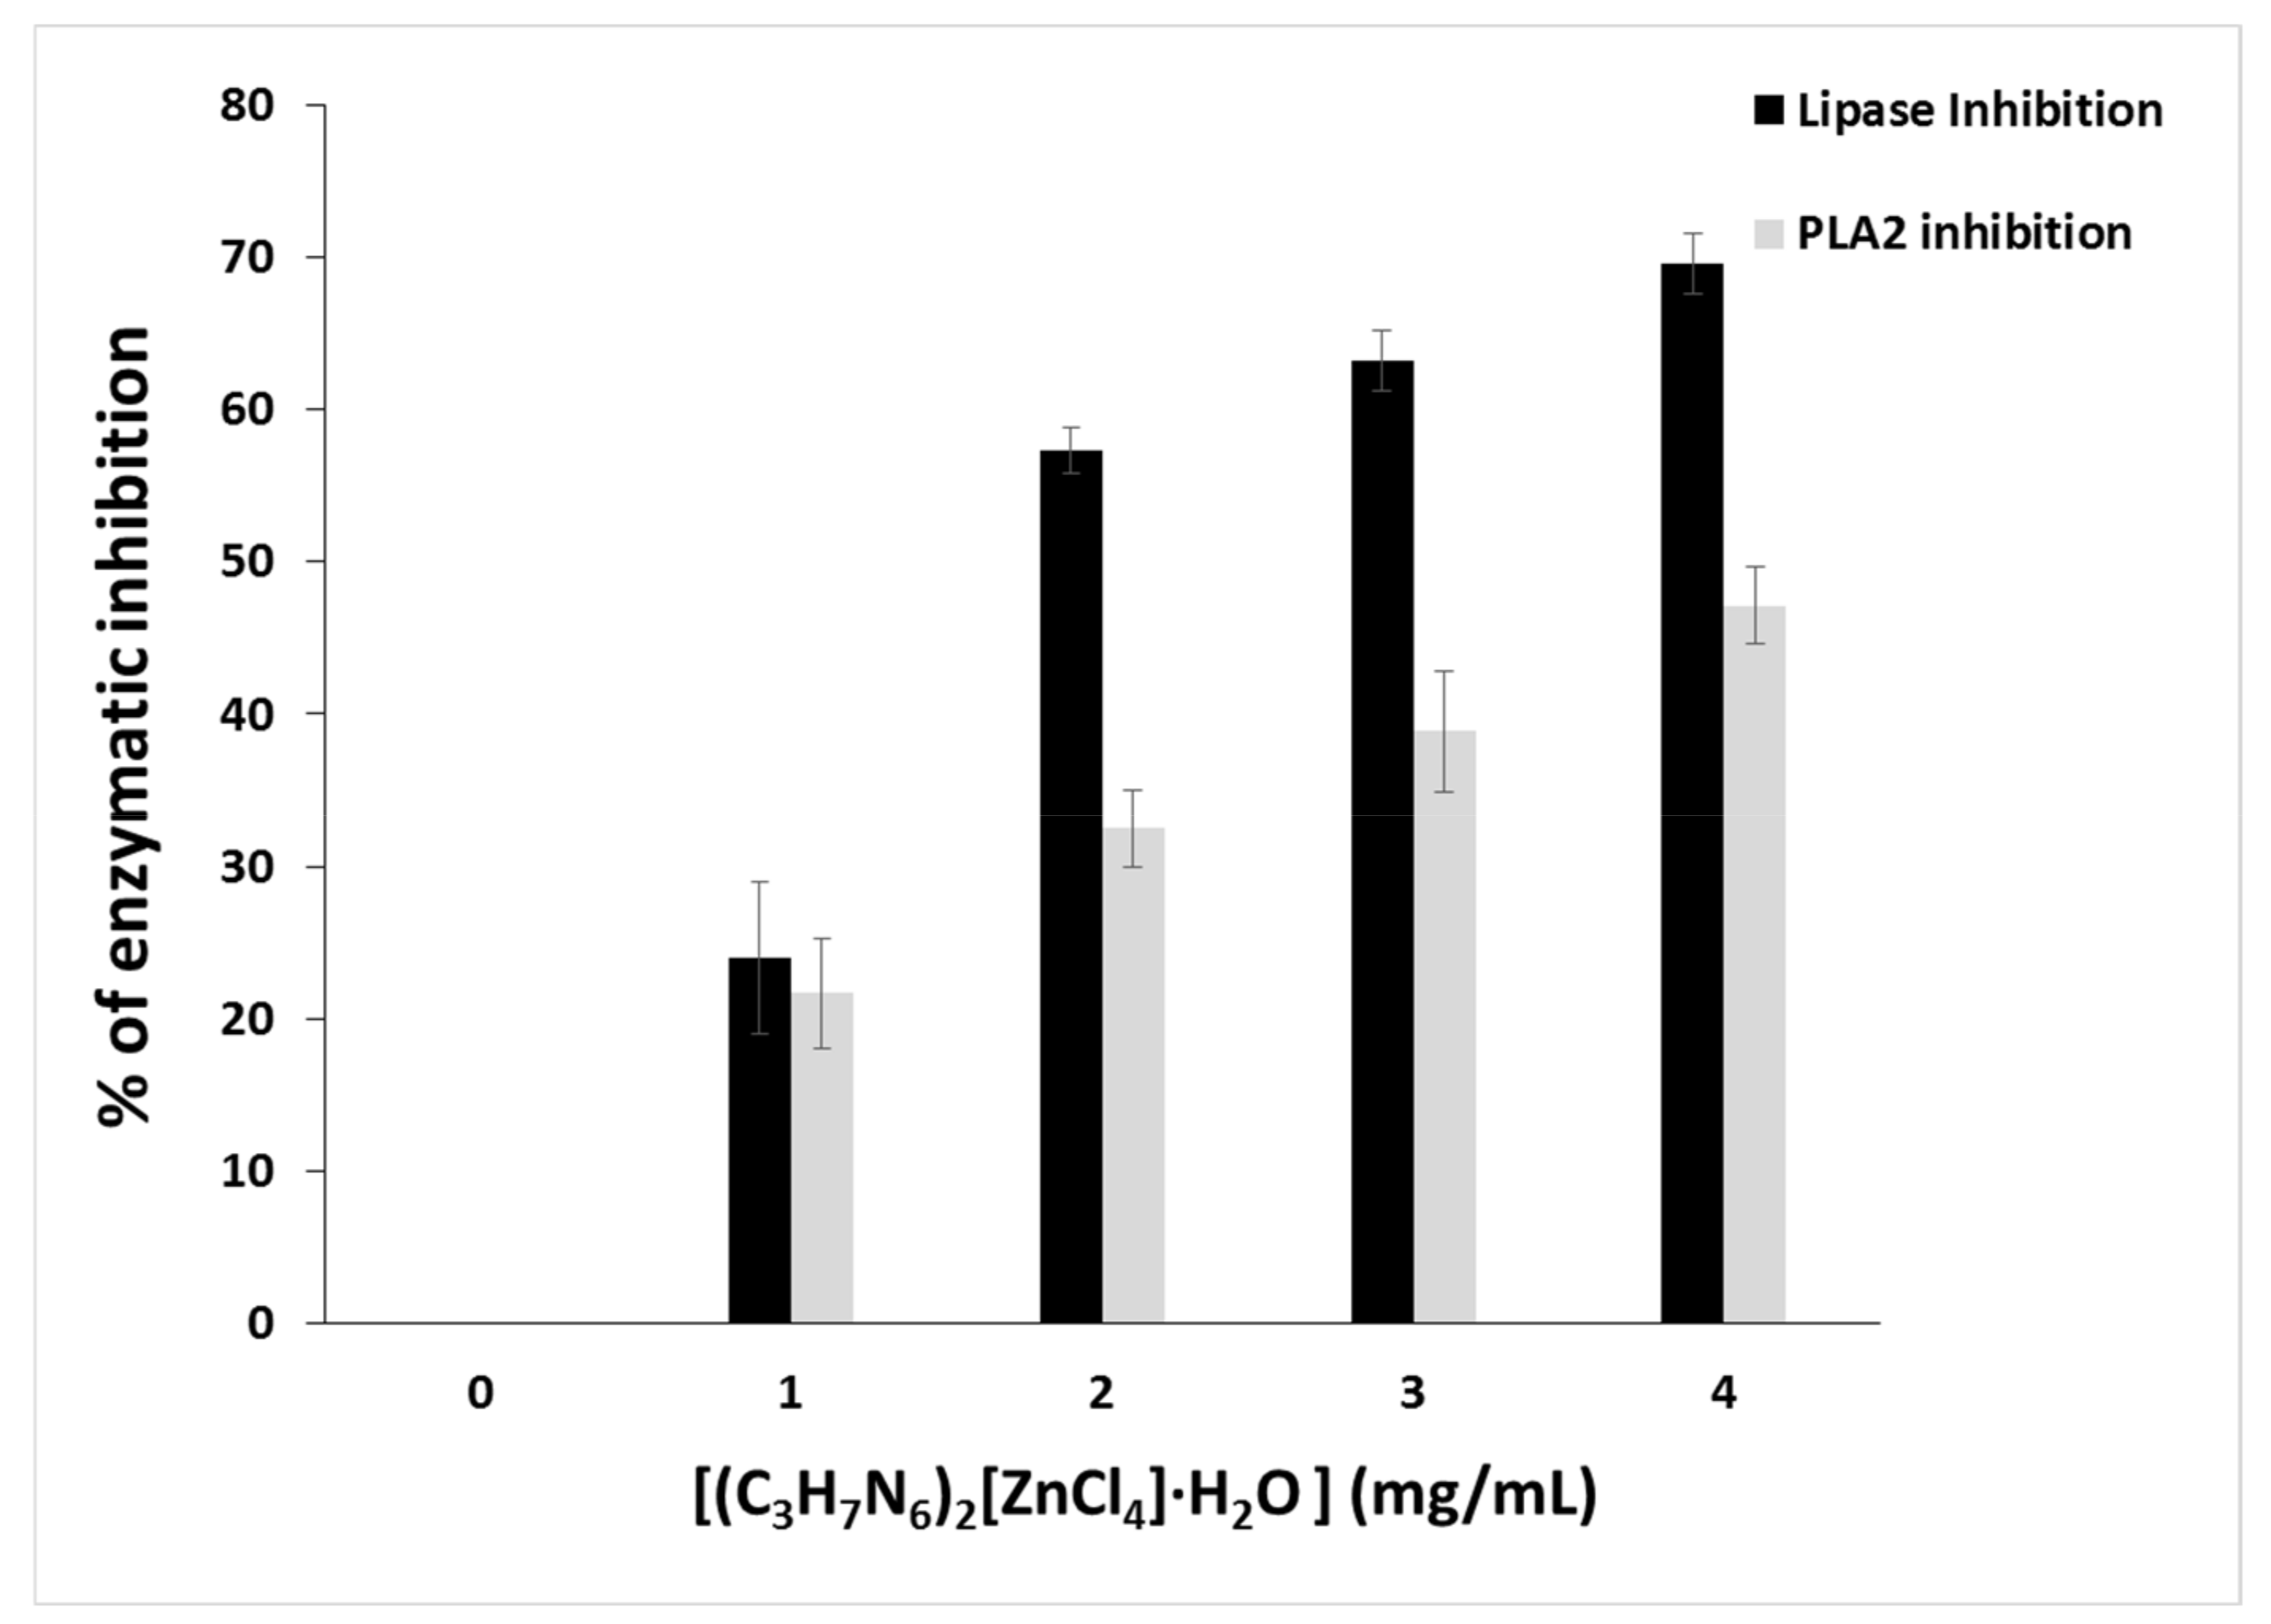
3.10. Lipase and Phospholipase A2 Inhibition

Glycerol ester hydrolases (E.C.3.1.1.) acting on acylglycerols release fatty acids and glycerol [84]. Microbial extracellular lipases are important virulence factors. According to this aspect, research has focused mainly on human pathogenic bacteria [85]. As a result, research on novel lipase inhibitors for the treatment of these diseases has generated a high level of interest. Therefore, we evaluated the inhibitory effect of (C3H7N6)2[ZnCl4]·H2O toward lipase using Candida rugosa lipase as a model of microbial lipase. Candida rugosa Lipase was inhibited in a dose-dependent manner with (C3H7N6)2[ZnCl4]·H2O increased concentrations. Figure 21 showed that at 1.8 mg/mL, (C3H7N6)2[ZnCl4]·H2O revealed 50% inhibition of lipase activity, while at 4 mg the inhibition effect reached 70%. This inhibition is due to the covalent or non-covalent interaction between (C3H7N6)2[ZnCl4]·H2O with the amino acids of the active site of the lipase [86]. Phospholipases A2 (PLA2) catalyzes the hydrolysis of the ester function at the sn-2 position of glycerophospholipids, to produce free fatty acids and lysophospholipids. They are widely distributed in pancreatic juices and many tissues, as well as in the venom produced by many animals [35]. These enzymes exhibit a wide spectrum of pharmacological activities, such as myotoxicity, neurotoxicity and especially inflammatory. The PLA2 activation in inflammatory diseases has raised the interest for pharmacologically active substances that can inhibit PLA2 activity [87]. In particular, the occurrence of different types of PLA2 has drawn attention to the importance of finding selective and specific inhibitors of the different PLA2. Therefore, the inhibitory activity of (C3H7N6)2[ZnCl4]·H2O on an inflammatory PLA2 type purified from scorpion venom was evaluated. Upon increasing the amount of (C3H7N6)2[ZnCl4]·H2O (from 1 mg to 4 mg/mL), a dose-dependent effect was observed. At 4 mg/mL, 50% of PLA2 inhibition was reached, including (C3H7N6)2[ZnCl4]·H2O contribution to the reduction of the inflammatory response by targeting PLA2 pathway signaling. In review, such biological activities testing in similar compounds reveal that complexes possess higher activity compared to parent ligand due to the presence of metals [88,89].

4. Conclusions

Crystals of a hybrid material bis (1.3.5-triazine-2.4.6-triamine) tetrachlorozincate (II) monohydrate were grown by the slow solvent technique evaporation solution growth at ambient temperature. The atomic arrangement can be described as an alternation of organic/inorganic layers. The crystal packing of the title compound is stabilized by rich hydrogen bonds of N–H···Cl and O–H···Cl hydrogen bonds between the [C3H7N6]+ cations, the water molecule and the [ZnCl4]2−anions. In addition, the Hirshfeld surface analysis and finger print plots were examined to understand the occurrence of molecular interactions within the complex. The structural and vibrational spectra calculated by WB97XD/Lanl2dz level of theory were in good agreement with the experimental data. On the basis of agreement between experimental and theoretical results, assignments of all observed bands were examined and proposed in this investigation. MEP plots revealed that electrophilic attack is around oxygen, nitrogen and chlorine atoms, whereas nucleophilic attack is around hydrogen and carbon atoms. According to the NPA result, our study compound has the electrophilic/nucleophilic nature. However, nonlinear optical parameters of the examined compound were investigated by the determination of the electric dipole moment, the polarizability and the second hyperpolarizability γ using the DFT method. A test measurement of the photoluminescence property of our synthesized compound exhibited blue-light emission at room temperature. This work presents an example of research on organic and inorganic components in zinc (II) hybrid halide compound for new nonlinear optical applications and pharmacological activities (especially inflammatory).

Supplementary Materials

The following supporting information can be downloaded at: https://www.mdpi.com/article/10.3390/cryst13050746/s1, Table S1. Observed and calculated bond lengths (Å) and angles (°) of [ZnCl4]2− tetrahedron. Table S2. Observed and calculated bond length (Å) and bond angles (°) of the compound (C3H7N6)2[ZnCl4]·H2O. Table S3. Wavenumbers (cm−1) and assignments, of the observed and calculated bands, in the Infrared (FT-IR) and Raman spectra of the title compound. Table S4. Electric dipole moment, the polarizability, and second hyperpolarizability for (C3H7N6)2[ZnCl4]·H2O. Crystalline data from this new zinc-based hybrid material were deposited at the Cambridge Crystallographic Data Center as Supplementary Publications (CCDC-1836470). Data can be obtained for free at http://www.ccdc.cam.ac.uk/conts/retrieving.html or from Cambridge Crystallographic Data Center, 12 Union Road, Cambridge CB2 1EZ, United Kingdom; Fax: +44-1223-336-033; Email: [email protected].

Author Contributions

Writing—original draft, T.S. and B.H.; conceptualization, N.M., M.L. and B.H.; data curation A.B.A., N.K. and A.G.; investigation A.B.A., L.K. and N.B.H.; visualization, A.H., F.C. and B.H.; project administration, A.G., L.K., N.B.H., F.C. and H.N.; supervision, F.C. and H.N. All authors have read and agreed to the published version of the manuscript.

Funding

Deanship of Scientific Research at Imam Mohammad Ibn Saud Islamic University.

Data Availability Statement

Publicly available datasets were analyzed in this study.

Acknowledgments

The authors extend their appreciation to the Deanship of Scientific Research at Imam Mohammad Ibn Saud Islamic University (IMSIU) for funding and supporting this work through Research Partnership Program no RP-21-09-70.

Conflicts of Interest

The authors declare no conflict of interest.

References

  1. Msalmi, R.; Elleuch, S.; Hamdi, B.; Abd El-Fattah, W.; Ben Hamadi, N.; Naïli, H. Organically tuned white-light emission from two zero-dimensional Cd-based hybrids. RSC Adv. 2022, 12, 10431–10442. [Google Scholar] [CrossRef] [PubMed]
  2. Msalmi, R.; Elleuch, S.; Hamdi, B.; Zouari, R.; Naïli, H. Synthesis, DFT calculations, intermolecular interactions and third order nonlinear optical properties of new organoammoniumtetrabromocadmate (II): (C5H6N2Cl)2[CdBr4]·H2O. J. Mol. Struct. 2020, 1222, 128–853. [Google Scholar] [CrossRef]
  3. Msalmi, R.; Elleuch, S.; Hamdi, B.; Radicchi, E.; Tozri, A.; Naïli, H.; Berber, M.R. Tunable broad-band white-light emission in two-dimensional (110)-oriented lead bromide perovskite (C3H8N6)[PbBr4]: Optical, electronic and luminescence properties. New J. Chem. 2021, 45, 20850–20859. [Google Scholar] [CrossRef]
  4. Ben Hmida, W.; Jellali, A.; Abid, H.; Hamdi, B.; Naïli, H.; Zouari, R. Synthesis, crystal structure, vibrational studies, optical properties and DFT calculation of a new luminescentmaterial based Cu (II). J. Mol. Struct. 2019, 1184, 604–614. [Google Scholar] [CrossRef]
  5. Hfidhi, N.; Kammoun, O.; Bataille, T.; Naïli, H. Structure Evolution and Thermal Decomposition of Supramolecular and Lamellar Hybrid Sulfates Templated by 4-Aminopyridinium. J. Inorg. Organomet. Polym. Mater. 2021, 31, 4165–4176. [Google Scholar] [CrossRef]
  6. Tlili, H.; Walha, S.; Elleuch, S.; Ali, B.F.; Awad, H.M.; Myllyperkiö, P.; Konu, J.; Naïli, H. Electronic studies, biological activities and nonlinear optical properties of a new non-centrosymmetric piperazinediiumtetrabromidozincate(II). J. Iran. Chem. Soc. 2022, 19, 763–774. [Google Scholar] [CrossRef]
  7. Hassan, D.B.; Naïli, H.; Rekik, W. Spectroscopic, Structural and Thermal Properties of Three New Metal Nitrates Templated by DABCO: (C6H14N2)[MII(H2O)6](NO3)4 with MII: Mn, Ni and Zn. J. Inorg. Organomet. Polym. Mater. 2020, 30, 2480–2488. [Google Scholar] [CrossRef]
  8. Moghdad, I.; Mbarek, A.; Costantino, F.; Nazzareni, S.; Naïli, H. Hybrid MII-organic-diphosphate hydrates (MII = Mn, Ni and Zn): Structural characterization, hirshfeld surface analysis and antitumoral activity. J. Mol. Struct. 2020, 1202, 127326. [Google Scholar] [CrossRef]
  9. Abid Derbel, M.; François, M.; Naïli, H.; Rekik, W. Phase transition from disordered high-temperature to twinned low-temperature structure of tris(ethylenediamine)zinc(II) selenate. Mon.-Chem. Mon. 2019, 150, 1793–1800. [Google Scholar] [CrossRef]
  10. Jlassi, R.; Khalladi, A.; Naïli, H.; Rüffer, T.; Lang, H.; Rekik, W. Synthesis, crystal structure and catalytic properties in the diastereoselective nitroaldol (Henry) reaction of new zinc(II) and cadmium(II) compounds. Polyhedron 2019, 158, 71–75. [Google Scholar] [CrossRef]
  11. Maatar Ben Salah, A.; Belghith Fendri, L.; Bataille, T.; Herrera, R.P.; Naïli, H. Synthesis, structural determination and antimicrobial evaluation of two novel CoII and ZnII halogenometallates as efficient catalysts for the acetalization reaction of aldehydes. Chem. Cent. J. 2018, 12, 24. [Google Scholar] [CrossRef]
  12. Saïd, S.; Naïli, H.; Bataille, T.; Herrera, R.P. Crystallisation, thermal analysis and acetal protection activity of new layered Zn(II) hybrid polymorphs. CrystEngComm 2016, 18, 5365–5374. [Google Scholar] [CrossRef]
  13. Dgachi, S.; Ben Salah, A.M.; Turnbull, M.M.; Bataille, T.; Naïli, H. Investigations on (C6H9N2)2[MIIBr4] halogenometallate complexes with MII = Co, Cu and Zn: Crystal structure, thermal behavior and magnetic properties. J. Alloys Compd. 2017, 726, 315. [Google Scholar] [CrossRef]
  14. Mhadhbi, N.; Dgachi, S.; Belgacem, S.; Ben Ahmed, A.; Henry, N.; Loiseau, T.; Nasr, S.; Badraoui, R.; Naïli, H. Design, theoretical study, druggability, pharmacokinetics and properties evolution of a new organo-bromocadmate compound as prospective anticancer agent. J. Mol. Struct. 2023, 1274, 134439. [Google Scholar] [CrossRef]
  15. Sakka, A.; Jellali, A.; Hamdi, B.; Abdelbaky, M.S.M.; Naïli, H.; Garcia-Granda, S.; Zouari, R. Structure, spectroscopic measurement, thermal studies and optical properties of a new non-centrosymmetric hybrid compound. J. Mol. Struct. 2019, 1198, 126867. [Google Scholar] [CrossRef]
  16. Hamdi, B.; Jellali, A.; Karâa, N.; Ghalla, H. Synthesis, characterization, DFT calculations, electric and dielectric properties of (C6H10(NH3)2) CdCl4 H2O organic-inorganic hybrid compound. J. Mol. Struct. 2019, 1198, 126887. [Google Scholar] [CrossRef]
  17. Karâa, N.; Hamdi, B.; Ben Salah, A.; Zouari, R. Synthesis, infra-red, MAS-NMR characterization, structural study and electrical properties of the new compound [C5H6ClN2]2Cd3Cl8. J. Mol. Struct. 2012, 1013, 168–176. [Google Scholar] [CrossRef]
  18. Xixia, L.; Nengduo, Z.; Baoshan, T.; Mengsha, L.; Yong-Wei, Z.; Zhi Gen, Y.; Hao, G. Highly Stable New Organic–Inorganic Hybrid 3D Perovskite CH3NH3PdI3 and 2D Perovskite(CH3NH3)3Pd2I7: DFT Analysis, Synthesis, Structure, Transition Behavior, and Physical Properties. J. Phys. Chem. Lett. 2018, 19, 5862–5872. [Google Scholar]
  19. Hellmich, H.L.; Frederickson, C.J.; DeWitt, D.S.; Saban, R.; Parsley, M.O.; Stephenson, R.; Velasco, M.; Uchida, T.; Shimamura, M.; Prough, D.S. Protective effects of zinc chelation in traumatic brain injury correlate with upregulation of neuroprotective genes in rat brain. Neurosci. Lett. 2004, 355, 221–225. [Google Scholar] [CrossRef]
  20. Sanchez, C.; Julián, B.; Belleville, P.; Popall, M. Applications of hybrid organic–inorganic nanocomposites. J. Mater. Chem. 2005, 15, 3559–3592. [Google Scholar] [CrossRef]
  21. Chihaoui, N.; Hamdi, B.; Zouari, R. Structural elucidation, theoretical investigation using DFT calculations, thermal and dielectric analyses of new zinc(II) based inorganic–organic hybrid. ChineseChemicalLetters 2017, 28, 642–650. [Google Scholar] [CrossRef]
  22. Grabner, S.; Modec, B. Zn(II) Curcuminate Complexes with 2,2′-bipyridine and Carboxylates. Molecules 2019, 24, 2540. [Google Scholar] [CrossRef] [PubMed]
  23. Sakiyama, H.; Abiko, T.; Ito, M.; Mitsuhashi, R.; Mikuriya, M.; Waki, K. Conformational analysis of an octahedral zinc(II) complex with six dimethylsulfoxide. Polyhedron 2016, 119, 512–516. [Google Scholar] [CrossRef]
  24. Dolomanov, O.V.; Bourhis, L.J.; Gildea, R.J.; Howard, J.A.K.; Puschmann, H. A Complete Structure Solution, Refinement and Analysis Program. J. Appl. Cryst. 2009, 42, 339–341. [Google Scholar] [CrossRef]
  25. Dolomanov, O.V.; Bourhis, L.J.; Gildea, R.J.; Howard, J.A.K.; Puschmann, H. The anatomy of a comprehensive constrained, restrained refinement program for the modern computing environment-Olex2 dissected. Acta Cryst. 2015, A71, 59–75. [Google Scholar]
  26. Sheldrick, G.M. Crystal structure refinement with SHELXL. Acta Cryst. 2015, C71, 3–8. [Google Scholar]
  27. Farrugia, L.J. ORTEP-3 for Windows—A version of ORTEP-III with a Graphical User Interface (GUI). J. Appl. Cryst. 1997, 30, 565. [Google Scholar] [CrossRef]
  28. Macrae, C.F.; Bruno, I.J.; Chisholm, J.A.; Edgington, P.R.; McCabe, P.; Pidcock, E.; Rodriguez-Monge, L.; Taylor, R.; Streek, J.V.; Wood, P.A. Mercury CSD 2.0-new features for the visualization and investigation of crystal structures. J. Appl. Cryst. 2008, 41, 466–470. [Google Scholar] [CrossRef]
  29. Bergerhoff, G.; Berndt, M.; Brandenburg, K. Phase Identification in a Scanning Electron Microscope Using Backscattered Electron Kikuchi Patterns. J. Res. Natl. Inst. Stand. Technol. 1996, 101, 221. [Google Scholar] [CrossRef]
  30. Boultif, A.; Louer, D. Powder pattern indexing with the dichotomy method. J. Appl. Cryst. 2004, 37, 724–731. [Google Scholar] [CrossRef]
  31. Spackman, M.A.; McKinnon, J.J. Fingerprinting intermolecular interactions in molecular crystals. Cryst. Eng. Comm 2002, 4, 378–392. [Google Scholar] [CrossRef]
  32. Wolff, S.K.; Grimwood, D.J.; McKinnon, J.J.; Turner, M.J.; Jayatilaka, D.; Spackman, M.A. CrystalExplorer; Version 3.0; University of Western Australia: Crawley, Australia, 2012. [Google Scholar]
  33. Westrip, S.P. Software for editing, validating and formatting crystallographic information files. J. Appl. Cryst. 2010, 43, 920–925. [Google Scholar] [CrossRef]
  34. Spackman, M.A.; McKinnon, J.J.; Jayatilaka, D. Electrostatic potentials mapped on Hirshfeld surfaces provide direct insight into intermolecular interactions in crystals. Cryst. Eng. Comm 2008, 10, 377–388. [Google Scholar] [CrossRef]
  35. Seth, S.K.; Sarkar, D.; Kar, T. Use of π–π forces to steer the assembly of chromone derivatives into hydrogen bonded supramolecular layers: Crystal structures and Hirshfeld surface analyses. Cryst. Eng. Comm 2011, 13, 4528–4535. [Google Scholar] [CrossRef]
  36. McKinnon, J.J.; Jayatilaka, D.; Spackman, M.A. Towards quantitative analysis of intermolecular interactions with Hirshfeld surfaces. J. Chem. Commun. 2007, 37, 3814–3816. [Google Scholar] [CrossRef]
  37. Pourayoubi, M.; ShoghpourBayraq, S.; Tarahhomi, A.; Necas, M.; Fejfarová, K.; Dusek, M. Hirshfeld surface analysis of new organotin(IV)-phosphoramidecomplexes. J. Organomet. Chem. 2014, 751, 508–518. [Google Scholar] [CrossRef]
  38. McKinnon, J.J.; Spackman, M.A.; Mitchell, A.S. Novel tools for visualizing and exploring intermolecular interactions in molecular crystals. Acta Cryst. 2004, 60, 627–668. [Google Scholar] [CrossRef]
  39. Frisch, M.J.; Trucks, G.W.; Schlegel, H.B.; Scuseria, G.E.; Robb, M.A.; Cheeseman, J.R.; Scalmani, G.; Barone, V.; Petersson, G.; Nakatsuji, A.H.; et al. GAUSSIAN 09; Revision B.01; Gaussian, Inc.: Wallingford, CT, USA, 2009. [Google Scholar]
  40. Dennington, R.; Keith, T.; Millam, J. GaussView; Version 5; Semi-chem Inc.: Shawnee Mission, KS, USA, 2009. [Google Scholar]
  41. O’Boyle, N.M.; Tenderholt, A.L.; Langner, K.M. A library for package-independent computational chemistry algorithms. J. Comput. Chem. 2008, 29, 839–845. [Google Scholar] [CrossRef]
  42. Biegler-Konig, F.; Schonbohm, J.; Bayles, D. AIM2000-A Program to Analyze and Visualize Atoms in Molecules. J. Comput. Chem. 2001, 22, 545–559. [Google Scholar]
  43. Lu, T.; Chen, F. Multiwfn: A multifunctional wavefunction analyzer. J. Comput. Chem. 2011, 33, 580–592. [Google Scholar] [CrossRef]
  44. Johnson, E.R.; Keinan, S.; Mori-Sánchez, P.; Contreras-García, J.; Cohen, A.J.; Yang, W. Revealing Noncovalent Interactions. J. Am. Chem. Soc. 2010, 132, 6498–6506. [Google Scholar] [CrossRef]
  45. Vanden Berghe, D. Screening methods for antibacterial and antiviral agents from higher plants. Methods Plant Biochem. 1991, 6, 47–69. [Google Scholar]
  46. Melo, M.; Feitosa, J.; Freitas, A.; De Paula, R. Isolation and characterization of soluble sulfated polysaccharide from the red seaweed Gracilaria cornea. Carbohydr. Polym. 2002, 49, 491–498. [Google Scholar] [CrossRef]
  47. Lengsfeld, H.; Beaumier-Gallon, G.; Chahinian, H.; De Caro, A.; Verger, R.; Laugier, R.; Carrière, F. Physiology of gastrointestinal lipolysis and therapeutical use of lipases and digestive lipase inhibitors. Lipases Phospholipases Drug Dev. Biochem. Mol. Pharmacol. 2004, 10, 195–229. [Google Scholar]
  48. Krayem, N.; Parsiegla, G.; Gaussier, H.; Louati, H.; Jallouli, R.; Mansuelle, P.; Carrière, F.; Gargouri, Y. Functional characterization and FTIR-based 3D modeling of full length and truncated forms of Scorpio maurus venom phospholipase A2. Biochim. Biophys. Acta (BBA)-Gen. Subj. 2018, 1862, 1247–1261. [Google Scholar] [CrossRef]
  49. Chihaoui, N.; Hamdi, B.; Zouari, R. Structural study, spectroscopic analysis and dielectric proprieties of new hybrid organic-inorganic compound. J. Mol. Struct. 2017, 1147, 48–55. [Google Scholar] [CrossRef]
  50. Baur, H.W. The geometry of polyhedral distortions. Predictive relationships for the phosphate group. Acta Crystallogr. 1974, 30, 1195–1215. [Google Scholar] [CrossRef]
  51. Mesbeh, R.; Hamdi, B.; Zouari, R. Crystal structure, thermal studies, Hirshfeld surface analysis, vibrational and DFT investigation of organic-inorganic hybrid compound [C9H6NOBr2]2CuBr4·2H2O. J. Mol. Struct. 2016, 1125, 217–226. [Google Scholar] [CrossRef]
  52. Jellali, A.; Hamdi, B.; Samet, A.; Zouari, R. Experimental, theoretical, characterization and optical investigation of a new hybrid material (8–HQ)2[FeCl4]·Cl. J. Mol. Struct. 2018, 1171, 305–314. [Google Scholar] [CrossRef]
  53. Mukherjee, S.; Ren, J. Gas-phase acid-base properties of melamine and cyanuric acid. J. Am. Soc. Mass Spectrom. 2010, 21, 1720–1729. [Google Scholar] [CrossRef]
  54. Mesbeh, R.; Hamdi, B.; Zouari, R. Elaboration, structural, spectroscopy, DSC investigations and Hirshfeld surface analysis of a one-dimensional self-assembled organic-inorganic hybrid compound. J. Mol. Struct. 2017, 1128, 205–214. [Google Scholar] [CrossRef]
  55. Mesbeh, R.; Hamdi, B.; Zouari, R. Synthesis, crystal structure, physicochemical characterization, and dielectric properties of a new organic chloride salt, (C3H7N6)Cl•0.5H2O. Ionics 2019, 25, 6147–6160. [Google Scholar] [CrossRef]
  56. Janczak, J. Supramolecular solid-state architecture formed by co-crystallization of melamine and phenylacetic acid. J. Mol. Struct. 2020, 1207, 127833. [Google Scholar] [CrossRef]
  57. Mesbeh, R.; Hamdi, B.; Zouari, R. (H2pdcCuBr2)2∙2(MH+)∙2Br (M = Melamine, H2pdc = Pyridine-2,6-Dicarboxylic Acid): Crystal Structure, Hirshfeld Surface Analysis, Vibrational and Thermal Studies. J. Inorg. Organomet. Polym. Mater. 2016, 26, 744–755. [Google Scholar] [CrossRef]
  58. Paz Fermandez-Liences, M.; Navarro, A.; Lopez-Gonzalez, J.J.; Fernandez-Gomez, M.; Tomkinson, J.; Kearley, G.J. Measurement and ab initio modeling of the inelastic neutron scattering of solid melamine: Evidence of the anisotropy in the external modes spectrum. Chem. Phys. 2001, 266, 1–17. [Google Scholar] [CrossRef]
  59. Arjunan, V.; Kalaivani, M.; Marchewka, M.K.; Mohan, S. Crystal structure, vibrational and DFT simulation studies of melaminium dihydrogen phosphite monohydrate. J. Mol. Struct. 2013, 1045, 160–170. [Google Scholar] [CrossRef]
  60. Tanak, H.; Marchewka, M.K. FT-IR, FT-Raman, and DFT computational studies of melaminium nitrate molecular–ionic crystal. J. Mol. Struct. 2013, 1034, 363–373. [Google Scholar] [CrossRef]
  61. Hamdi, B.; Zouari, R.; Ben Salah, A. Synthesis, crystal structure, hirshfeld surface analyses and physical properties of a new hybrid compound: [C3N6H8]2PbCl5.Cl. Superlattices Microstruct. 2018, 123, 97–110. [Google Scholar] [CrossRef]
  62. Rayes, A.; Mezzadri, F.; Issaoui, N.; Ayed, B.; Calestani, G. Synthesis, physico-chemical studies, non-linear optical properties and DFT calculations of a new non-centrosymmetric compound: (3-ammoniumpyridinium)tetrachloridozincate (II). J. Mol. Struct. 2019, 1184, 524–531. [Google Scholar] [CrossRef]
  63. Karoui, K.; Ben Rhaiem, A.; Guidara, K. Electrical characterization of the [N(CH3)4][N(C2H5)4]ZnCl4 compound. Ionics 2011, 17, 517–525. [Google Scholar] [CrossRef]
  64. Chihaoui, N.; Hamdi, B.; Dammak, T.; Zouari, R. Molecular structure, experimental and theoretical spectroscopic characterization and non-linear optical properties studies of a new non-centrosymmetric hybrid material. J. Mol. Struct. 2016, 1123, 144–152. [Google Scholar] [CrossRef]
  65. Elleuch, N.; BenAhmed, A.; Feki, H.; Abid, Y.; Minot, C. Vibrational spectra, optical properties, NBO and HOMO–LUMO analysis of L-Phenylalanine L-Phenylalaninium Perchlorate: DFT calculations. J. Spectrochim. Acta Part A Mol. Biomol. Spectrosc. 2014, 121, 129–138. [Google Scholar] [CrossRef] [PubMed]
  66. Bader, R.F.W. Bond Paths Are Not Chemical Bonds. J. Phys. Chem. A 2009, 113, 10391–10396. [Google Scholar] [CrossRef] [PubMed]
  67. Rozas, I.; Alkorta, I.; Elguero, J. Behavior of Ylides Containing N, O, and C Atoms as Hydrogen Bond Acceptors. J. Am. Chem. Soc. 2000, 122, 11154–11161. [Google Scholar] [CrossRef]
  68. Noureddine, O.; Issaoui, N.; Gatfaoui, S.; Al-Dossary, O.; Marouani, H. Quantum chemical calculations, spectroscopic properties and molecular docking studies of a novel piperazine derivative. J. King Saud Univ.–Sci. 2021, 33, 101283. [Google Scholar] [CrossRef]
  69. Pandey, K.; Shukla, D.V.; Singh, V.; Narayan, V. Structural, IR spectra NBO, TDDFT, AIM calculation, biological activity 5 and docking property of [1,2,4]-triazolo[3,4-b][1,3,4] thiadiazole. Egypt. J. Basic Appl. Sci. 2018, 5, 280–288. [Google Scholar] [CrossRef]
  70. Ghalla, H.; Issaoui, N.; Bardak, F.; Atac, A. Intermolecular interactions and molecular docking investigations on 4-methoxybenzaldehyde. Comput. Mater. Sci. 2018, 149, 291–300. [Google Scholar] [CrossRef]
  71. Contreras-García, J.; Calatayud, M.; Piquemal, J.P.; Recio, J.M. Ionic interactions: Comparative topological approach. Comput. Theor. Chem. 2012, 998, 193–201. [Google Scholar] [CrossRef]
  72. Samet, A.; Ben Ahmed, A.; Mlayah, A.; Boughzala, H.; Hlil, E.K.; Abid, Y. Optical properties and ab initio study on the hybrid organic–inorganic material [(CH3)2NH2]3[BiI6]. J. Mol. Struct. 2010, 977, 72–77. [Google Scholar] [CrossRef]
  73. Luque, A.; Sertucha, J.; Castillo, O.; Roman, P. Magneto-structural studies and thermal analysis of n-ethylpyridinium (n = 2, 3, 4) tetrabromocuprate(II) complexes. Polyhedron 2002, 21, 19–26. [Google Scholar] [CrossRef]
  74. Zeyada, H.M.; EL-Nahass, M.M.; Samak, S.A. Effect of γ-ray irradiation on structure formation and optical constants of thermally evaporated rhodamine B thin films. J. Non-Cryst. Sol. 2012, 358, 915–920. [Google Scholar] [CrossRef]
  75. Karuppasamy, P.; Joseph Daniel, D.; Kim, H.J.; Senthil Pandian, M.; Ramasamy, P. Studies on semi-organic (C8H11NO)2[ZnCl4] single crystal for Nonlinear Optical (NLO) Applications. J. Cryst. Growth 2020, 535, 125528. [Google Scholar] [CrossRef]
  76. El Mrabet, R.; Kassou, S.; Tahiri, O.; Belaaraj, A.; El-Ammari, L.; Saadi, S. A zero-dimensional hybrid organic-inorganic perovskite ZnCl4 based: Synthesis, crystal structure, UV–vis, and electronic properties. J. Cryst. Growth 2017, 472, 76–83. [Google Scholar] [CrossRef]
  77. Kassou, S.; El-Mrabet, R.; Kaiba, A.; Guionneau, P.; Belaaraj, A. Combined experimental and density functional theory studies of an organic–inorganic hybrid perovskite. Phys. Chem. Chem. Phys. 2016, 18, 9431–9436. [Google Scholar] [CrossRef]
  78. Zhang, X.; Li, L.; Wang, S.; Liu, X.; Yao, Y.; Peng, Y.; Hong, M.; Luo, J. [(N-AEPz)ZnCl4]Cl: A “Green” Metal Halide Showing Highly Efficient Bluish-White-Light Emission. J. Inorg. Chem. 2020, 59, 3527–3531. [Google Scholar] [CrossRef]
  79. Gautier, R.; Paris, M.; Massuyeau, F. Hydrogen Bonding and Broad-Band Emission in Hybrid Zinc Halide Phosphors. J. Inorg. Chem. 2020, 59, 2626–2630. [Google Scholar] [CrossRef]
  80. Kalaiyarasan, G.; Anusuya, K.; Joseph, J. Melamine dependent fluorescence of glutathione protected gold nanoclusters and ratiometric quantification of melamine in commercial cow milk and infant formula. J. Appl. Surf. Sci. 2017, 420, 963–969. [Google Scholar] [CrossRef]
  81. Yu, D.; He, J.; Liu, Z.; Xu, B.; Li, D.; Tian, Y. Phase transformation of melamine at high pressure and temperature. J. Mater. Sci. 2008, 43, 689–695. [Google Scholar] [CrossRef]
  82. Samet, A.; Pilletb, S.; Abid, Y. Sensitizer-free photon up conversion in (HQ)2ZnCl4 and HQCl crystals: Systems involving resonant energy transfer and triplet–triplet annihilation. Phys. Chem. Chem. Phys. 2020, 22, 1575–1582. [Google Scholar] [CrossRef]
  83. Hartmann, M.; Berditsch, M.; Hawecker, J.; Ardakani, M.F.; Gerthsen, D.; Ulrich, A.S. Damage of the bacterial cell envelope by antimicrobial peptides gramicidin S and PGLa as revealed by transmission and scanning electron microscopy. Antimicrob. Agents Chemother. 2010, 54, 3132–3142. [Google Scholar] [CrossRef]
  84. De Morais Junior, W.G.; Kamimura, E.S.; Ribeiro, E.J.; Pessela, B.C.; Cardoso, V.L.; De Resende, M.M. Optimization of the production and characterization of lipase from Candida rugosa and Geotrichumcandidum in soybean molasses by submerged fermentation. Protein Expr. Purif. 2016, 123, 26–34. [Google Scholar] [CrossRef] [PubMed]
  85. Stehr, F.; Kretschmar, M.; Kröger, C.; Hube, B.; Schäfer, W. Microbiallipasesasvirulencefactors. J. Mol. Catal. B Enzym. 2003, 22, 347–355. [Google Scholar] [CrossRef]
  86. Gohlke, H.; Klebe, G. Approaches to the description and prediction of the binding affinity of small-molecule ligands to macromolecular receptors. Angewandte. Chem. Int. Ed. 2002, 41, 2644–2676. [Google Scholar] [CrossRef]
  87. Lindahl, M.; Tagesson, C. Flavonoids as phospholipase A2 inhibitors: Importance of their structure for selective inhibition of group II phospholipase A2. Inflammation 1997, 21, 347–356. [Google Scholar] [CrossRef]
  88. Erer, H.; Yeşilel, Z.; Zafer Yeşilel, O.; Darcan, C.; Büyükgüngör, O. Synthesis, spectroscopic, thermal Studies, antimicrobial activities and crystal structures of Co(II), Ni(II), Cu(II) and Zn(II)-orotate complexes with 2-methylimidazole. Polyhedron 2009, 28, 3087–3093. [Google Scholar] [CrossRef]
  89. Bourwina, M.; Walha, S.; Krayem, N.; Badraoui, R.; Brahmi, F.; Alshammari, W.M.; Mejdi, S.; Turnbull, M.M.; Roisnel, T.; Naïli, H. Organic-Inorganic Manganese (II) Halide Hybrid Combining the Two Isomers Cis/Trans of [MnCl4(H2O)2]: Crystal Structure, Physical Properties, Pharmacokinetics and Biological Evaluation. Inorganics 2023, 11, 76. [Google Scholar] [CrossRef]
Figure 1. Morphology of (C3H7N6)2[ZnCl4]·H2O crystals.
Crystals 13 00746 g001
Figure 2. Asymmetric unit of the title compound: (a) the experimental result, (b) the optimized geometry.
Crystals 13 00746 g002
Figure 3. Crystal structure projection of (C3H7N6)2[ZnCl4]·H2O along the b-axis.
Crystals 13 00746 g003
Figure 4. Structural parameters in the tetrahedron [ZnCl4]2−.
Crystals 13 00746 g004
Figure 5. (a) Sequence of the organic part of (C3H7N6)2[ZnCl4]·H2O compound. (b) Perspective view of the H-mel chains using the capped sticks model in which two types of H-mel ions are highlighted in red and blue, respectively. Centrosymmetric dimers formed by π–π contacts (dotted lines), namely the green and purple spheres represent centroids of the triazine rings.
Crystals 13 00746 g005
Figure 6. Projection of hydrogen bonds between organic cations and chlorine anions (dotted with blue) and between water molecules and organic–inorganic parts of complex (dotted in red and purple).
Crystals 13 00746 g006
Figure 7. Hirshfeld surfaces mapped with d n o r m , d i , d e , shape index and Curvedness of (C3H7N6)2[ZnCl4]·H2O compound.
Crystals 13 00746 g007
Figure 8. Hirshfeld Surface Analysis d n o r m of the different entities of the title compound.
Crystals 13 00746 g008
Figure 9. Shape index of organic grouping [C3H7N6]+ of title compound (the black circle on the blue and red triangles confirming the π···π interaction).
Crystals 13 00746 g009
Figure 10. Schematic illustration fingerprint plots for the different parts of the (C3H7N6)2[ZnCl4]·H2O compound.
Crystals 13 00746 g010
Figure 11. Observed profiles of the powder diffractogram of (C3H7N6)2[ZnCl4]·H2O compound.
Crystals 13 00746 g011
Figure 12. Experimental and theoretical IR spectra of (C3H7N6)2[ZnCl4]·H2O.
Crystals 13 00746 g012
Figure 13. Raman spectra of the title compound measured at room temperature (black line) and simulated (blue line) in the two regions: (a) 200–1900 cm−1 and (b) 3100–3950 cm−1.
Crystals 13 00746 g013
Figure 14. Atomic charge distribution of (C3H7N6)2[ZnCl4]·H2O compound.
Crystals 13 00746 g014
Figure 15. MEP surface of the title compound. The brown color represents the zone with the negative potential of MEP, associated with reactive electrophilic sites, the blue color is adapted to the zone with the positive potential and represents the suitable center of the nucleophilic attacks.
Crystals 13 00746 g015
Figure 16. AIM (C3H7N6)2[ZnCl4]·H2O presentation generated with Mutiwfn and VMD softwares. Index of bond paths are labeled by bleu texts, orange, and yellow spheres correspond to (3,n1), and (3,p1) critical points, respectively.
Crystals 13 00746 g016
Figure 17. Scatter diagram (top) and three-dimensional 3-D isosurfaces of (C3H7N6)2[ZnCl4]·H2O (bottom) of NCI-RDG analyses.
Crystals 13 00746 g017
Figure 18. Experimental and theoretical optical absorption spectra and band gap energy of (C3H7N6)2[ZnCl4]·H2O compound.
Crystals 13 00746 g018
Figure 19. Photoluminescence (PL) spectra of (C3H7N6)2[ZnCl4]·H2O compound.
Crystals 13 00746 g019
Figure 20. Bacterial viability of (C3H7N6)2[ZnCl4]·H2O.
Crystals 13 00746 g020
Figure 21. Lipase and phospholipase A2 inhibition of (C3H7N6)2[ZnCl4]·H2O.
Crystals 13 00746 g021
Table 1. Crystal data and structure refinement parameters of (C3H7N6)2[ZnCl4]·H2O.
Empirical Formula(C3H7N6)2[ZnCl4]·H2O
Formula weight (g∙mol−1)479.50
Temperature (K)296(2)
Crystal systemTriclinic
Space groupP 1   ¯
a (Å)7.9571(7)
b (Å)9.5933(9)
c (Å)14.7622(15)
α (°)98.766(3)
β (°)105.404(3)
γ (°)105.650(3)
V3)1015.19(17)
Z2
λ (Mo Kα) (Å)0.71073
μ (mm−1)1.76
Crystal size (mm3)0.47 × 0.31 × 0.21
Crystal color/shapeColorless/Prism
HKL range−9 ≤ h ≤ 9; −11 ≤ k ≤ 11; −17 ≤ l ≤ 17
θ range for data collection (°)θmin = 2.7 ≤ θ ≤ θma = 22.4
DiffractometerAPEXII, Bruker-AXS
R1 a,wR2 b [I > 2(I)]0.031, 0.066
GooF on F20.96
Transmission factorsTmin = 0.476, Tmax = 0.653
Δρmax (e Å−3)0.63
Δρmin (e Å−3)−0.57
a R1 = ∑│Fo│ − │Fc│/∑│Fo│; b wR2 = [∑w(Fo2 − Fc2)2/∑w(Fo2)2]1/2.
Table 2. Principal interatomic distances (Å) and bond angles (°) of the hydrogen bonding.
D-H···AD-HH···AD···AD-H···A
O1-Hw1···Cl5i0.902.463.292(5)154
N1-H1···O10.861.862.712(6)173
O1-Hw2···Cl41.002.343.296(4)158
N5-H5A···N3ii0.862.233.084(6)173
N5-H5B···Cl20.862.533.303(5)151
N6-H6A···N8ii0.862.203.054(6)173
N6-H6B···Cl40.862.523.338(5)159
Symmetry codes: (i): −x+1, −y+1, −z; (ii): −x+1, −y+1, −z+1
Table 3. Calculated charges by NPA for the title compound.
AtomNPAAtomNPA
C0.72977N−0.80590
C0.69485N−0.80770
C0.72842N−0.79191
C0.73360N−0.66983
C0.69532N−0.67138
C0.73211N−0.80519
N−0.67023O−1.01663
N−0.67482Cl−0.64514
N−0.65984Cl−0.70728
N−0.80095Cl−0.65962
N−0.79798Cl−0.64991
N−0.65225Zn0.92521
Table 4. AIM topological parameters of (C3H7N6)2[ZnCl4]·H2O determined for selected bond critical points by Multiwfn.
BCPsX-H···Yρ(r)2ρ(r)E(r)10−2−V(r)/G(r)ESP
1O-H···Cl0.01910.0548−0.00441.007323.81
2N-H···Cl0.02230.6070−0.04521.032025.30
3N-H···Cl0.03160.0795−0.18761.087525.06
4N-H···Cl0.01440.04540.00080.914322.15
5N-H···O0.02890.12470.18920.935123.65
6N-H···Cl0.02140.06120.00031.000023.06
7N-H···Cl0.02540.6400−0.10521.064725.20
8N-H···Cl0.02750.0704−0.12081.063823.42
9N···Cl0.00520.01560.05960.818126.08
Table 5. Antibacterial activities of (C3H7N6)2[ZnCl4]·H2O.
Bacterial StrainGramInhibition Zone Diameter (mm)MIC (mg/mL)
1 mg/mL3 mg/mL
Escherichia coli_++1.8
Enterococcus feacalis_++
Salmonella typhi_++
Listeria monocytogenes++++++2
Staphylococcus aureus++++++
Micrococcus luteus++++++
MIC (mg/mL), Inhibition diameter zones: +: > 5mm, ++: 5–15 mm, +++: >15 mm, “_”: Gram (_) strain, “+”: Gram (+) strain
Disclaimer/Publisher’s Note: The statements, opinions and data contained in all publications are solely those of the individual author(s) and contributor(s) and not of MDPI and/or the editor(s). MDPI and/or the editor(s) disclaim responsibility for any injury to people or property resulting from any ideas, methods, instructions or products referred to in the content.

