Article

Thermal Expansion and Phase Transformation up to 1200 °C of Metastable Aluminas Produced by Flame Spraying

by
Tilo Zienert
* and
Christos Georgios Aneziris
Institute of Ceramics, Refractories and Composite Materials, TU Bergakademie Freiberg, Agricolastr. 17, 09599 Freiberg, Germany
*
Author to whom correspondence should be addressed.
Crystals 2023, 13(5), 743; https://doi.org/10.3390/cryst13050743
Submission received: 3 April 2023 / Revised: 20 April 2023 / Accepted: 24 April 2023 / Published: 29 April 2023
(This article belongs to the Special Issue Metal Oxides: Crystal Structure, Synthesis and Characterization)

Abstract

:
The transition aluminas δ 1 and the cubic, non-spinel-type η -Al 2 O 3 were detected in addition to α -Al 2 O 3 in flame-sprayed material. Their transitions from room temperature up to 1200 °C were investigated by high-temperature XRD measurements. Structural changes with time and temperature were observed for all transition aluminas ( η -, δ 1 - and θ -Al 2 O 3 ). The phases followed the expected transition sequence of η δ 1 θ α and showed mainly linear, temperature-independent transition rates. Based on the determined thermal expansion of the phases, it is proposed that the metastable transitions are at least partly mechanically induced. In addition, a second-order phase transition from η θ might be indicated around 1050–1075 °C by the determined trends of density.

1. Introduction

The transition aluminas γ , δ and θ are of interest for catalytic applications due to their special surface properties [1] depending on their structural disorder, surface area and their thermodynamic stability [2]. These aluminas are typically derived from the heat treatment of boehmite and form the general transition sequence of γ δ θ α on heating with the final formation of α -Al 2 O 3 at temperatures above 1200 °C [3]. Seeding with α -Al 2 O 3 lowers the activation energy and increases the transition rate of α -Al 2 O 3 formation from the transition aluminas [4]. Plasma- or flame-sprayed alumina coatings and protective layers [3,5,6,7] are another source of transition aluminas that show the same general transformation sequence. Intermediate aluminas are structurally based on a slightly distorted cubic closed-packed sublattice of oxygen ions [8] containing structurally ordered vacancies, stacking faults and antiphase boundaries [8,9,10]. Besides, structural defects and their thermodynamic consequences for the nucleation and growth of ordered domains in the γ matrix, phase transitions and surface properties are also affected by the morphology of the respective crystals [1,11,12,13], leading to, e.g., a direct γ θ transition [1]. Typically, the transition from one intermediate state to the next is not marked by a certain transition temperature but a transition range [14,15], which shows time dependence [16,17] and structural ordering [18,19].
It has been reported that in case of quenched alumina melts, the formed γ -alumina is not of the cubic spinel-type but it forms a cubic η variant, where metallic ions are also present at non-spinel positions [20]. Non-spinel-type γ -Al 2 O 3 is energetically more stable than the spinel-type, as shown by first-principle calculations [21]. The occupation of non-spinel sites in γ -Al 2 O 3 is related to pore size/surface area [22]. At least for the boehmite-derived γ -aluminas, a tetragonal distortion is frequently reported, e.g., [16,23,24].
The structure of δ -Al 2 O 3 was an open question for a long time [9], until its nature was recently revealed with the development of several structural models [25]. In boehmite-based samples, δ -alumina was found to be formed by at least five different structures that were named δ 1 to δ 5 [17,25,26], showing complex intergrown microstructures [27].
Coarse-grained refractory composites based on Nb–Al 2 O 3 or Ta–Al 2 O 3 systems are promising materials for high-temperature applications (1500–1800 °C) with a metallurgical background [28]. Despite their good mechanical and functional (electrical and thermal conductivity) properties [29,30], these compounds are susceptible to oxidation at temperatures above 400 °C [31], which must be prevented by use in oxygen-containing environments. Alumina-based flame-sprayed coatings show very good thermal-shock resistance even at temperature gradients higher than 1000 K [32]. Such coatings are also promising candidates for oxygen protecting layers. On heating, the phase transitions of metastable aluminas could be a source of thermal stresses and corresponding crack initiation in flame-sprayed coatings, which could lead to the formation of pores and spalling effects and could be prevented by a regulated heat treatment. Therefore, the aim of this work was to investigate the thermal expansion of transition aluminas present after flame spraying between room temperature and 1200 °C using high-temperature powder X-ray diffraction measurements. The thermal expansion of α -, η -, δ 1 - and θ -Al 2 O 3 was studied and the possible consequences of inducing phase transitions are discussed.

2. Materials and Methods

2.1. Sample Preparation

Specimens were fabricated via flame spraying on graphite pins ( d = 15 mm ) using a MasterJet flame-spray gun (Saint-Gobain, Avignon, France). The feedstock was commercial alumina (flexicord PURE ALUMINA 99.7, Saint-Gobain, Avignon, France) with a feed rate of 0.3 m/min. The time of spraying was approximately 25 s per pin, the spraying distance was ≈150 mm between the flame spraying gun and the substrate material and the estimated flame temperature was 3080–3160 °C. After cooling, the specimens were removed from the graphite substrate and milled for 60 s at 800 rpm using a vibratory disc mill MSL2 (VEB BHKF, Freiberg, Germany) with steel-made grinding tools.

2.2. Sample Characterisation and Heat Treatment

The material was studied using X-ray powder diffraction (XRD) (Empyrean, Malvern Panalytical GmbH, Kassel, Germany) in combination with Rietveld refinement using HighScore Plus 4.8 (Malvern Panalytical B.V., Almelo, The Netherlands). XRD measurements were taken using Cu-K α 1 radiation between 10 and 140° 2 Θ with a 0.0143° step size and an exposure of 160 s/step in Bragg–Brentano geometry, which resulted in an overall measurement time of roughly 53 min. On the incident side, a divergence slit of 1/8° and an anti-scatter slit of 1/2° were applied, together with 0.04 rad soller slits on the incident and detector sides.
Thermal treatment of the samples was performed in situ using a high-temperature XRD chamber (HTK 1200N, Anton-Paar GmbH, Graz, Austria) with a dense-sintered alumina sample holder, which was used for measurements in the temperature range between room temperature and 1200 °C. For that, the zero-point height and the ω -offset of the sample was determined before the measurement by using a parallel beam setup.
The as-sprayed material was investigated using two approaches. The thermal expansion and phase transitions were studied by heating the material in steps of 25 K up to the highest temperature. After each heating step, the system was rested for 5 min before the XRD measurements started.
In subsequent experiments, the as-sprayed material was held isothermally at 1000 °C and 1100 °C (samples T-1000 and T-1100, respectively) for a time of 30 h to study the structural changes with time at a constant temperature. XRD measurements were taken after each hour and after two hours between 1 and 10 h and 10 and 30 h of heat treatment, respectively. To prevent further structural changes during the measurement at the annealing temperature, the samples were cooled down for XRD measurements to a temperature of 600 °C, at which no substantial reordering was detected and the high-temperature state could be assumed to be quenched. After XRD measurements, the sample was heated again to the respective annealing temperature. The applied heating and cooling rate was always 10 K/min. It should be mentioned that the sample holder was not actively cooled, but the outer walls of the heating chamber were. As a consequence, the achievable cooling rates decrease with a decrease in temperature. However, it was observed that the nominal cooling rate was achieved with only small deviations in the temperature range between 1200 °C and 600 °C.
Next, the thermal expansion of these isothermally heat-treated powders were investigated in the same way as the as-sprayed material before.

2.3. Thermal Expansion Coefficient

The obtained volumes of the elemental cells for the phases α -, η -, δ 1 - and θ -Al 2 O 3 with temperature V ( T ) were used to determine the volumetric thermal expansion coefficient α V as follows. A set of five consecutive datapoints were fitted by V ( T ) = a + b · T + c · T 2 and its derivative was then used to calculate α V for each 3rd point according to
α V = 1 V · V T .
It should be mentioned that for the first two and the last two investiged temperatures, the thermal expansion coefficients were calculated using the derived parameters of the first and last least-square fit of the whole dataset, respectively. Using such an approach to derive α V from the experimental data instead of fitting one equation for all data points results in a scattered α V ( T ) curve but reproduces the observed overall changes in volume with a higher accuracy in comparison to the one-equation method.

3. Results

Typical XRD patterns are presented as an example in Figure 1 and Figure 2 for the as-sprayed material obtained at the temperatures of 1000 °C and 1200 °C, respectively. The obtained reflections were indexed using the structure models of α -Al 2 O 3 (#ICSD-73725 [33]), η -Al 2 O 3 (#ICSD-39104 [20]), δ 1 -Al 2 O 3 [25] and θ -Al 2 O 3 (#ICSD-82504 [34]). No other δ -variants were detected in the analysed diffraction pattern. It should be noted that the structure model for η -Al 2 O 3 was taken in favour of γ -Al 2 O 3 (#ICSD-95302 [35]) as the agreement between the calculated and observed intensities were much better with the cubic η -model. It might be the case that flame- or plasma-sprayed aluminas form the η -variant instead of the defect spinel type.

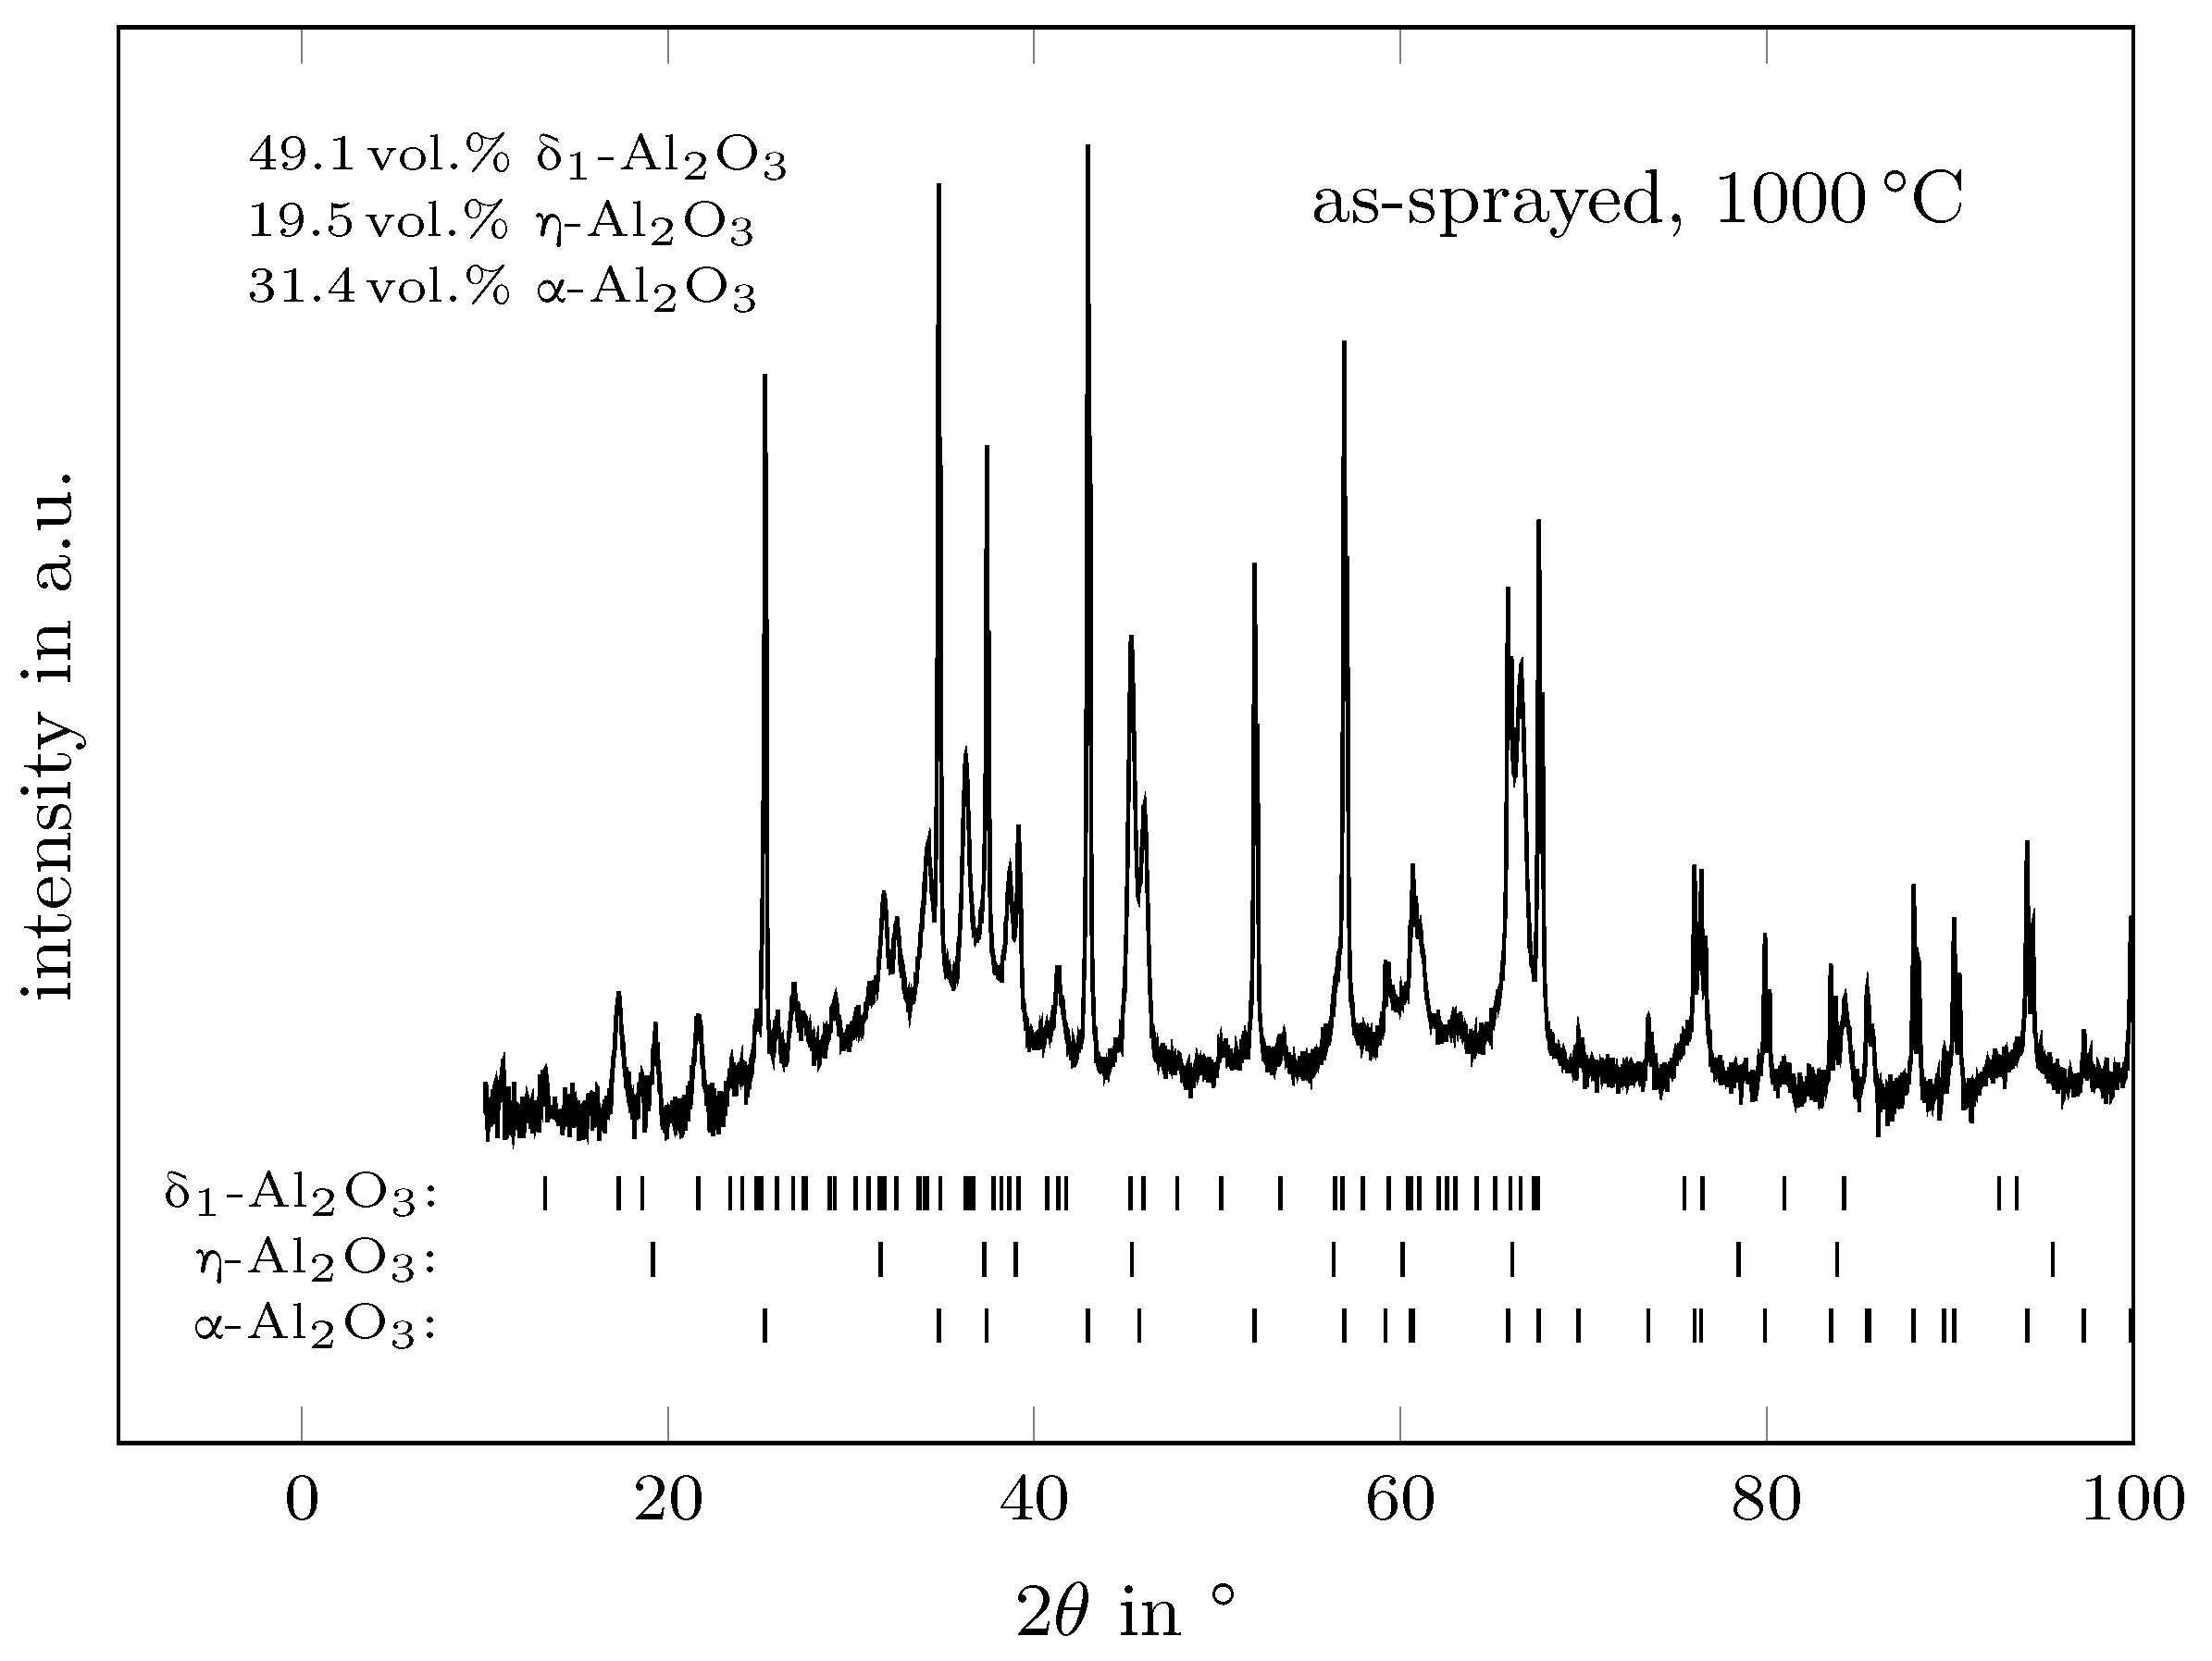
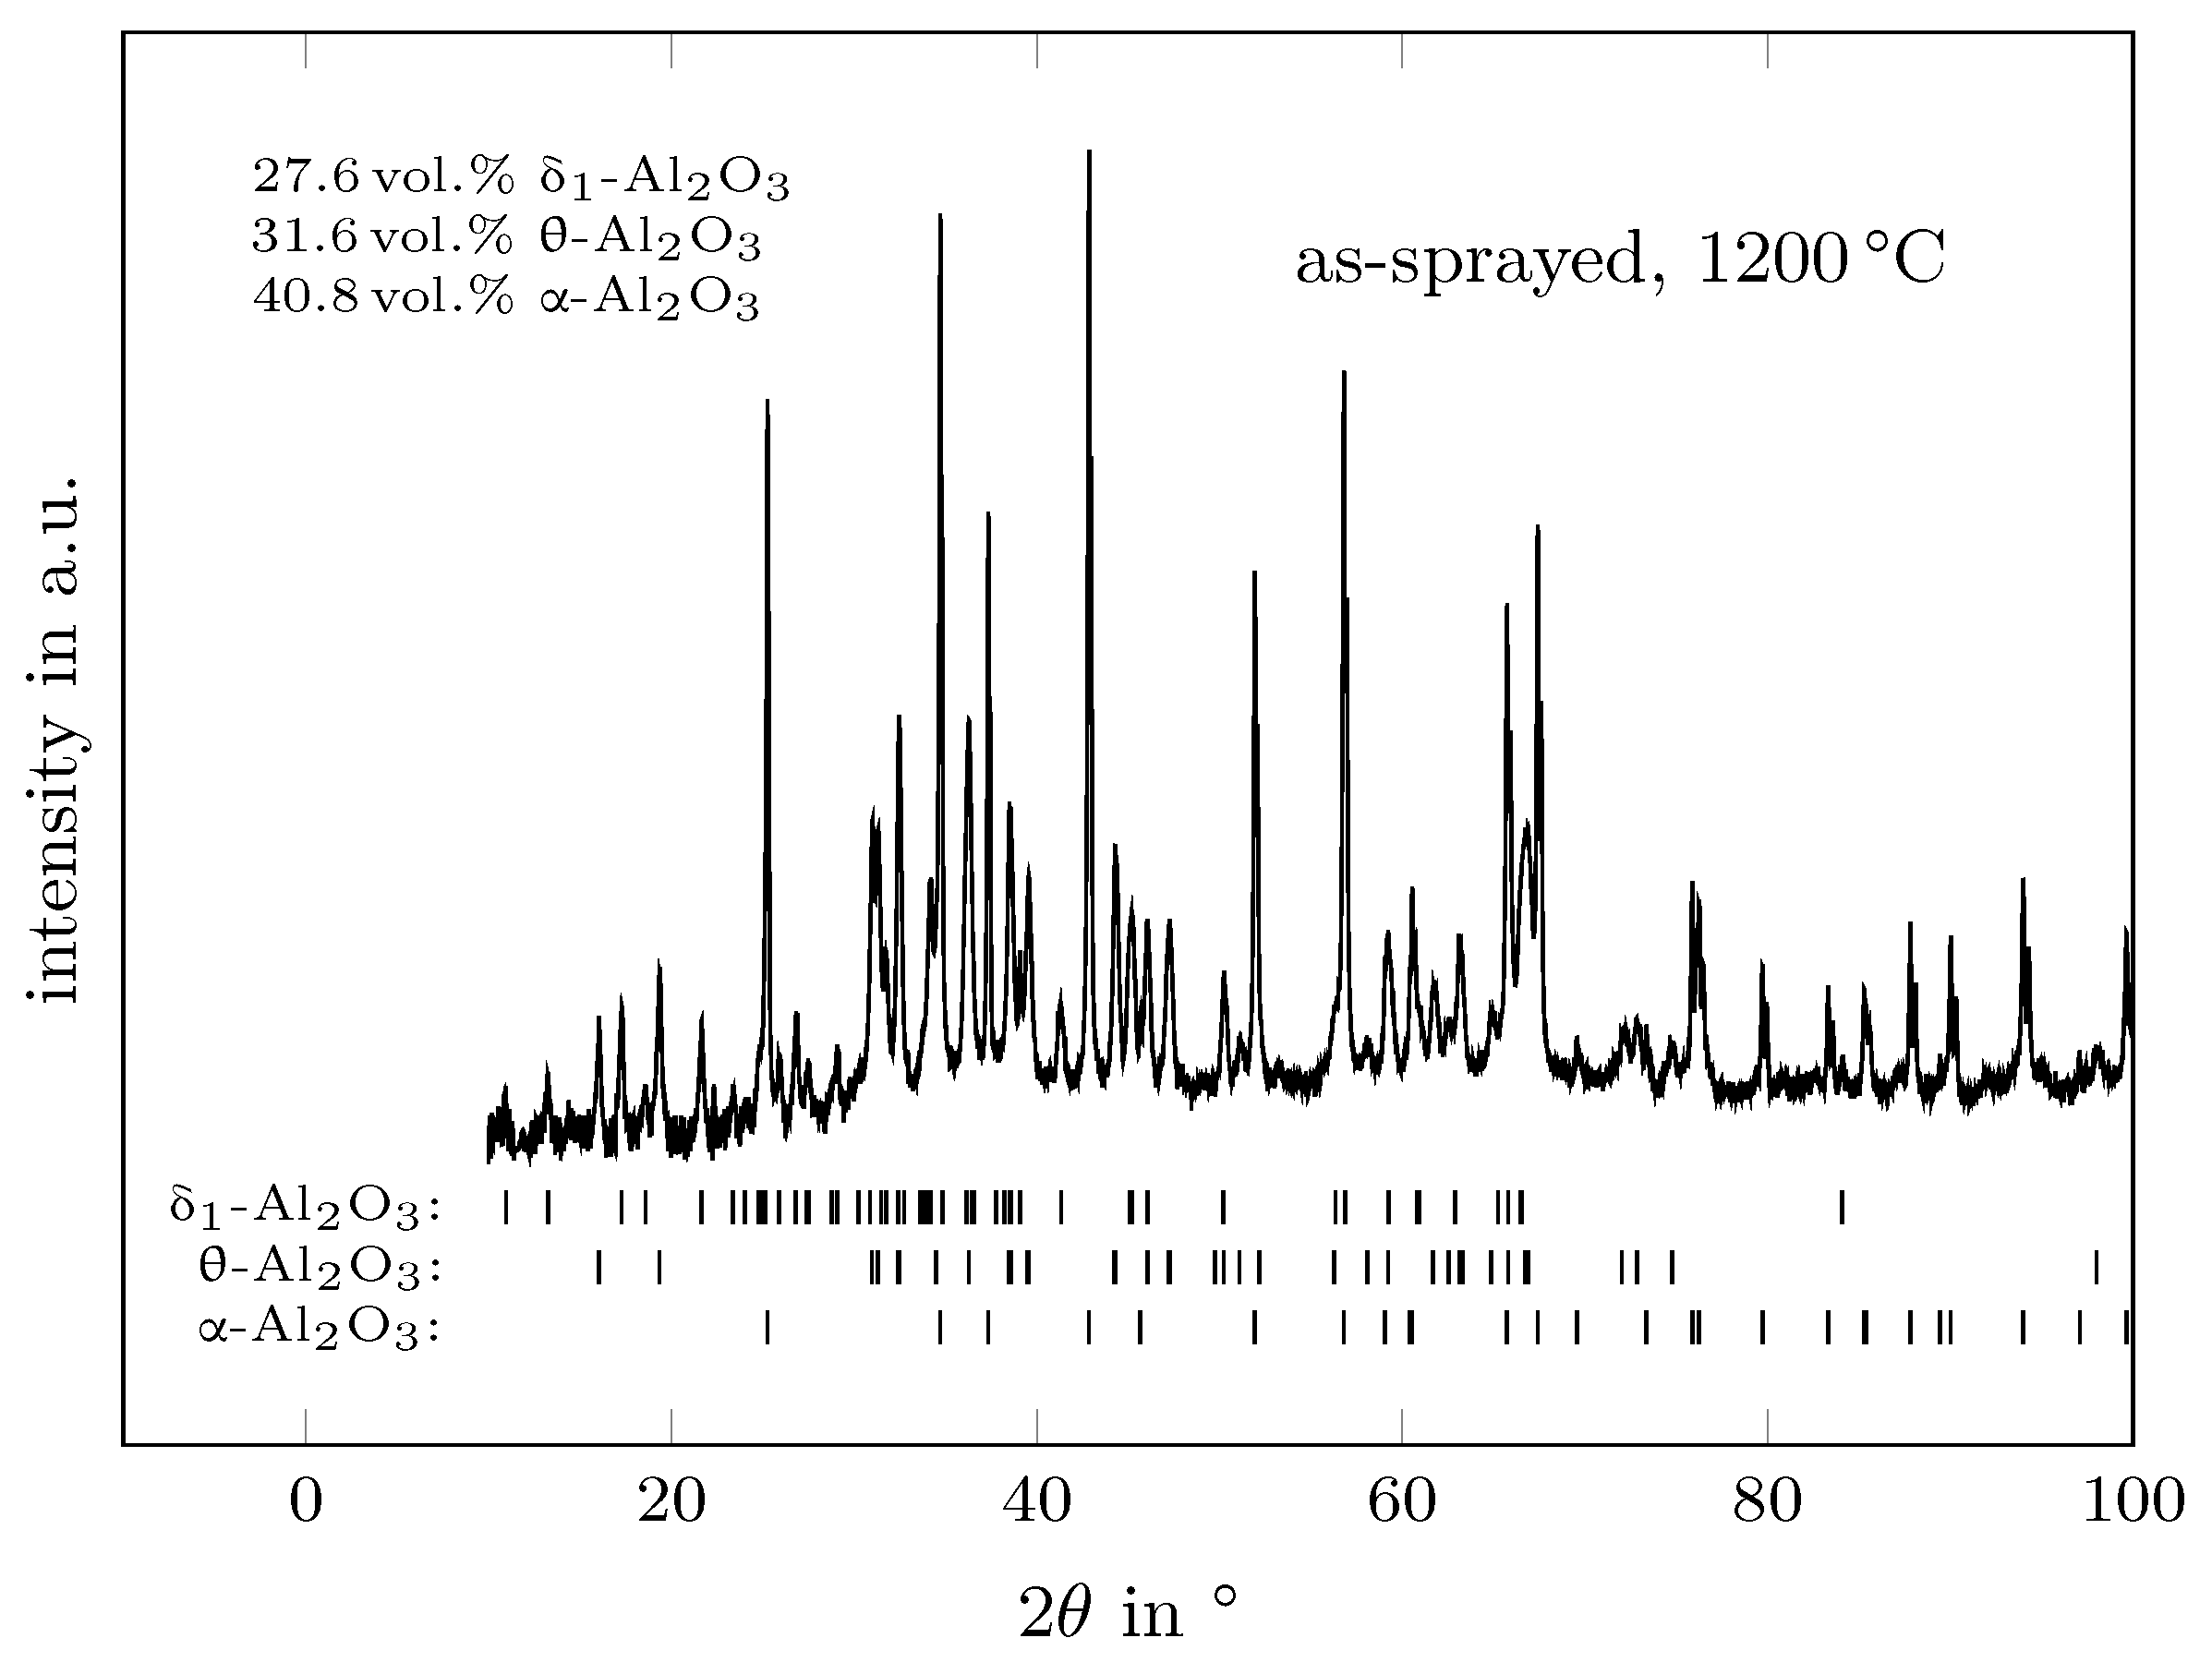
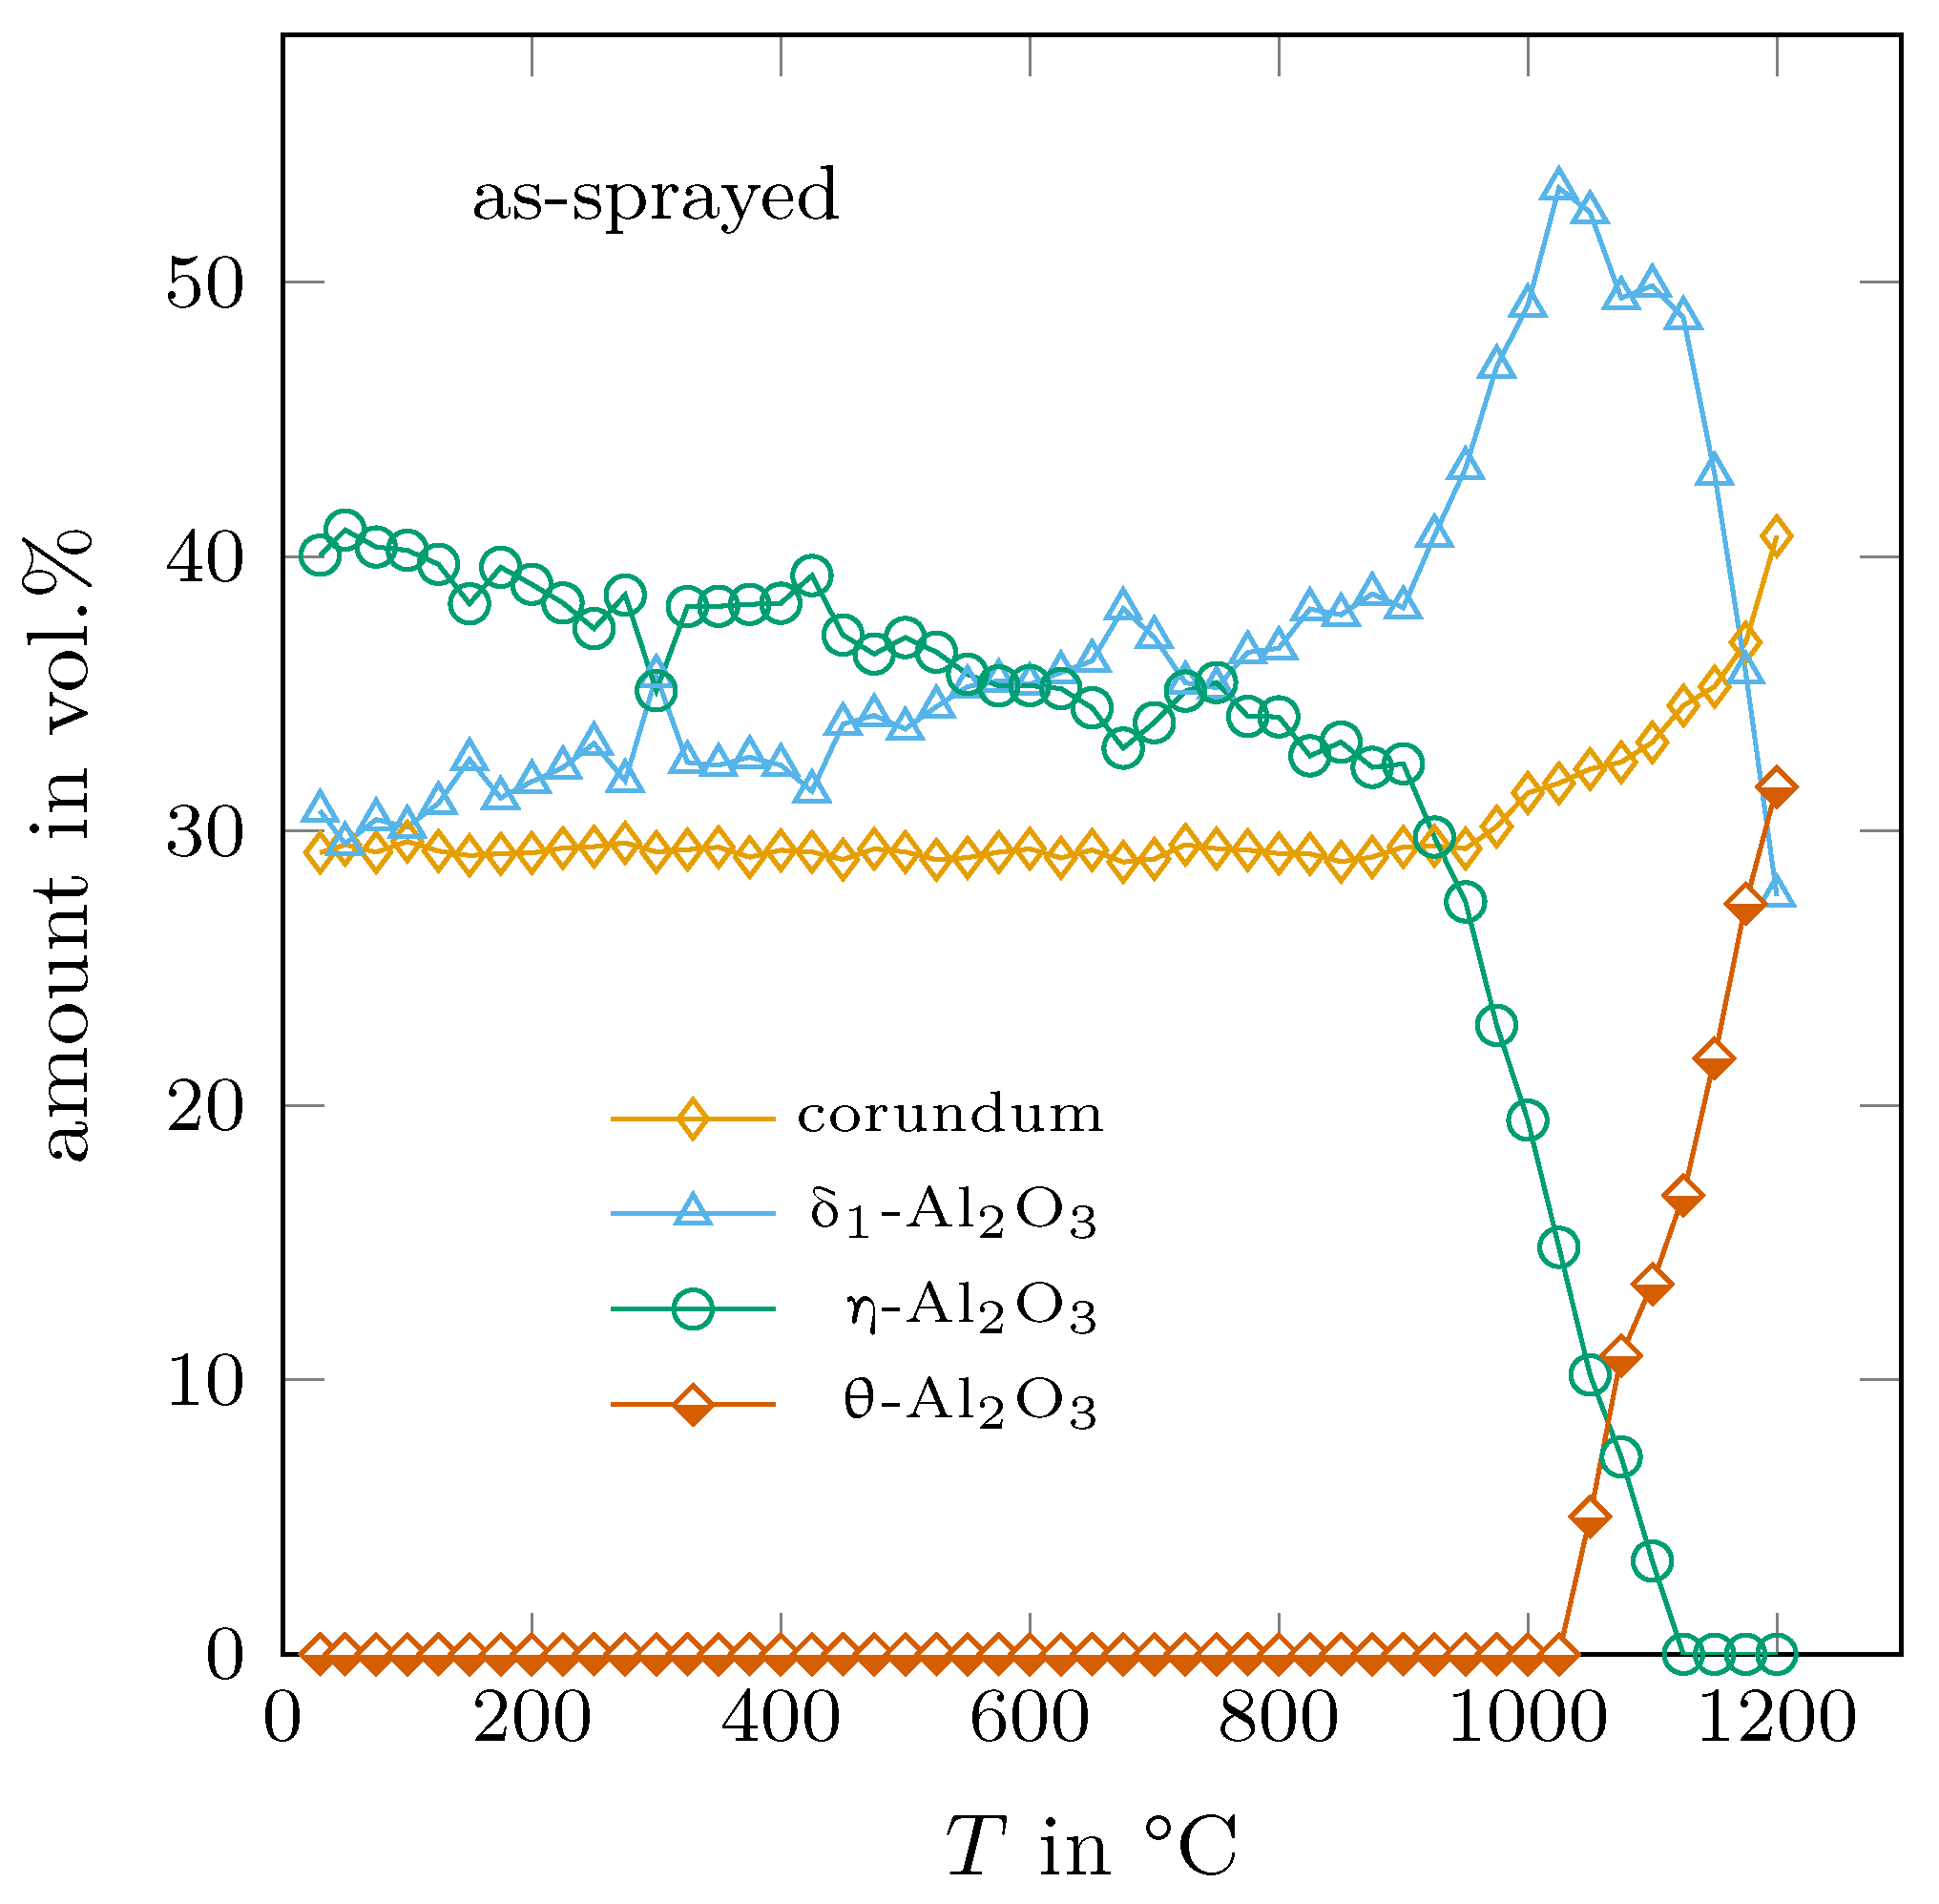
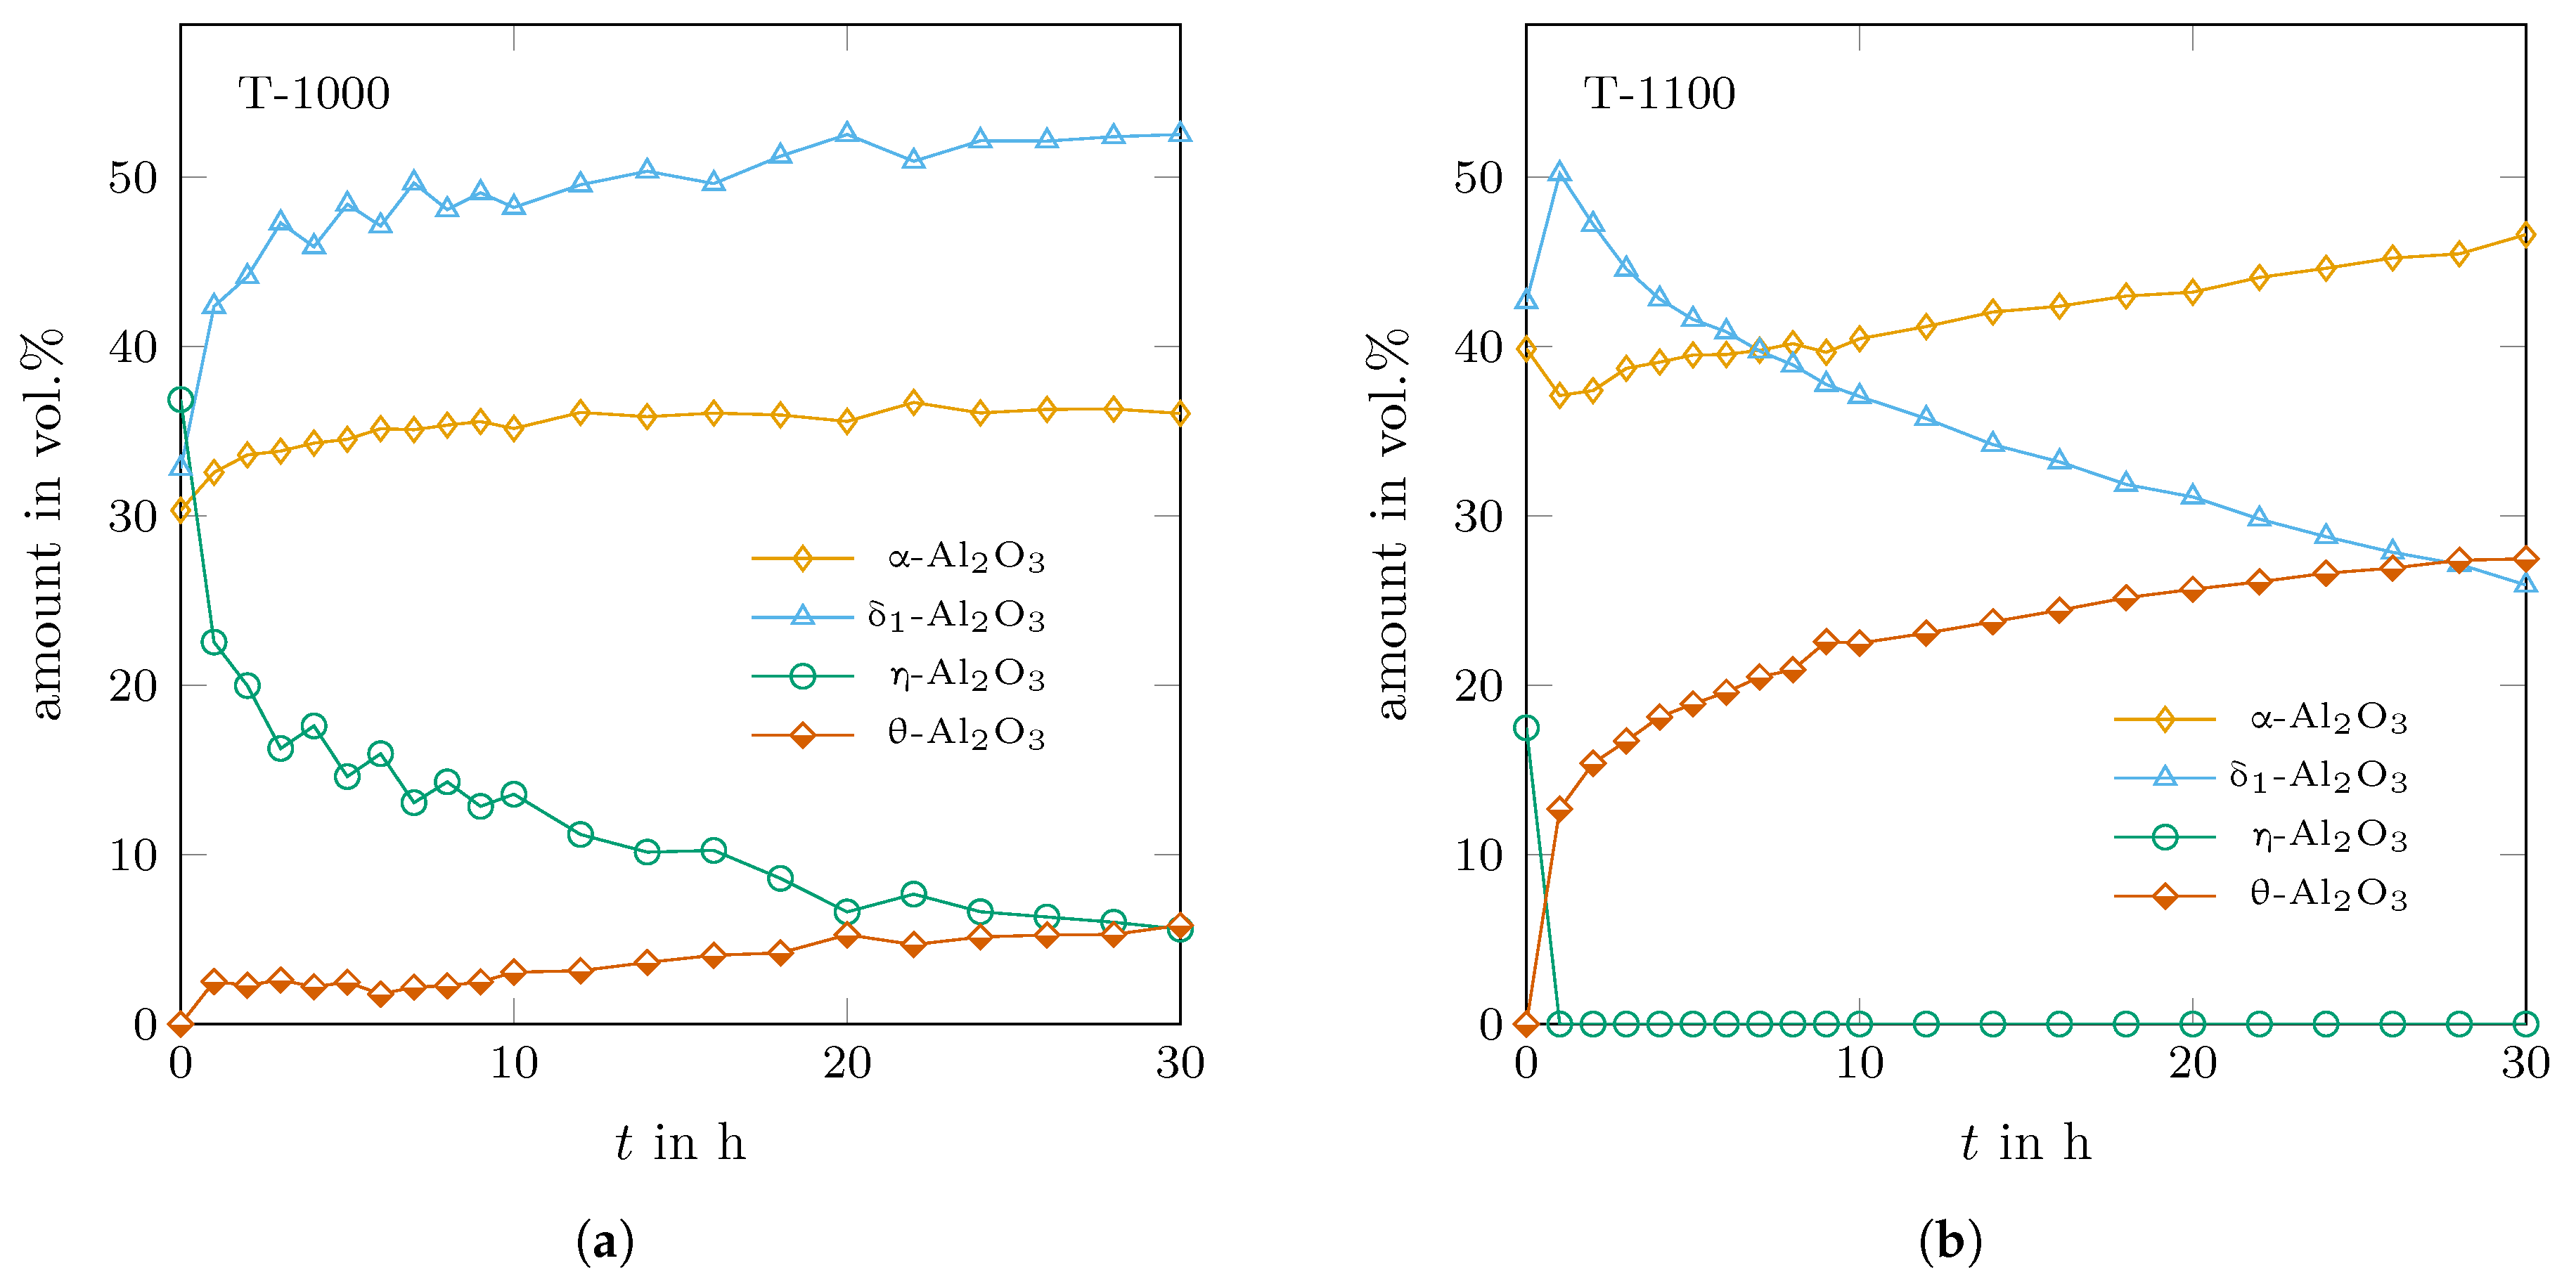
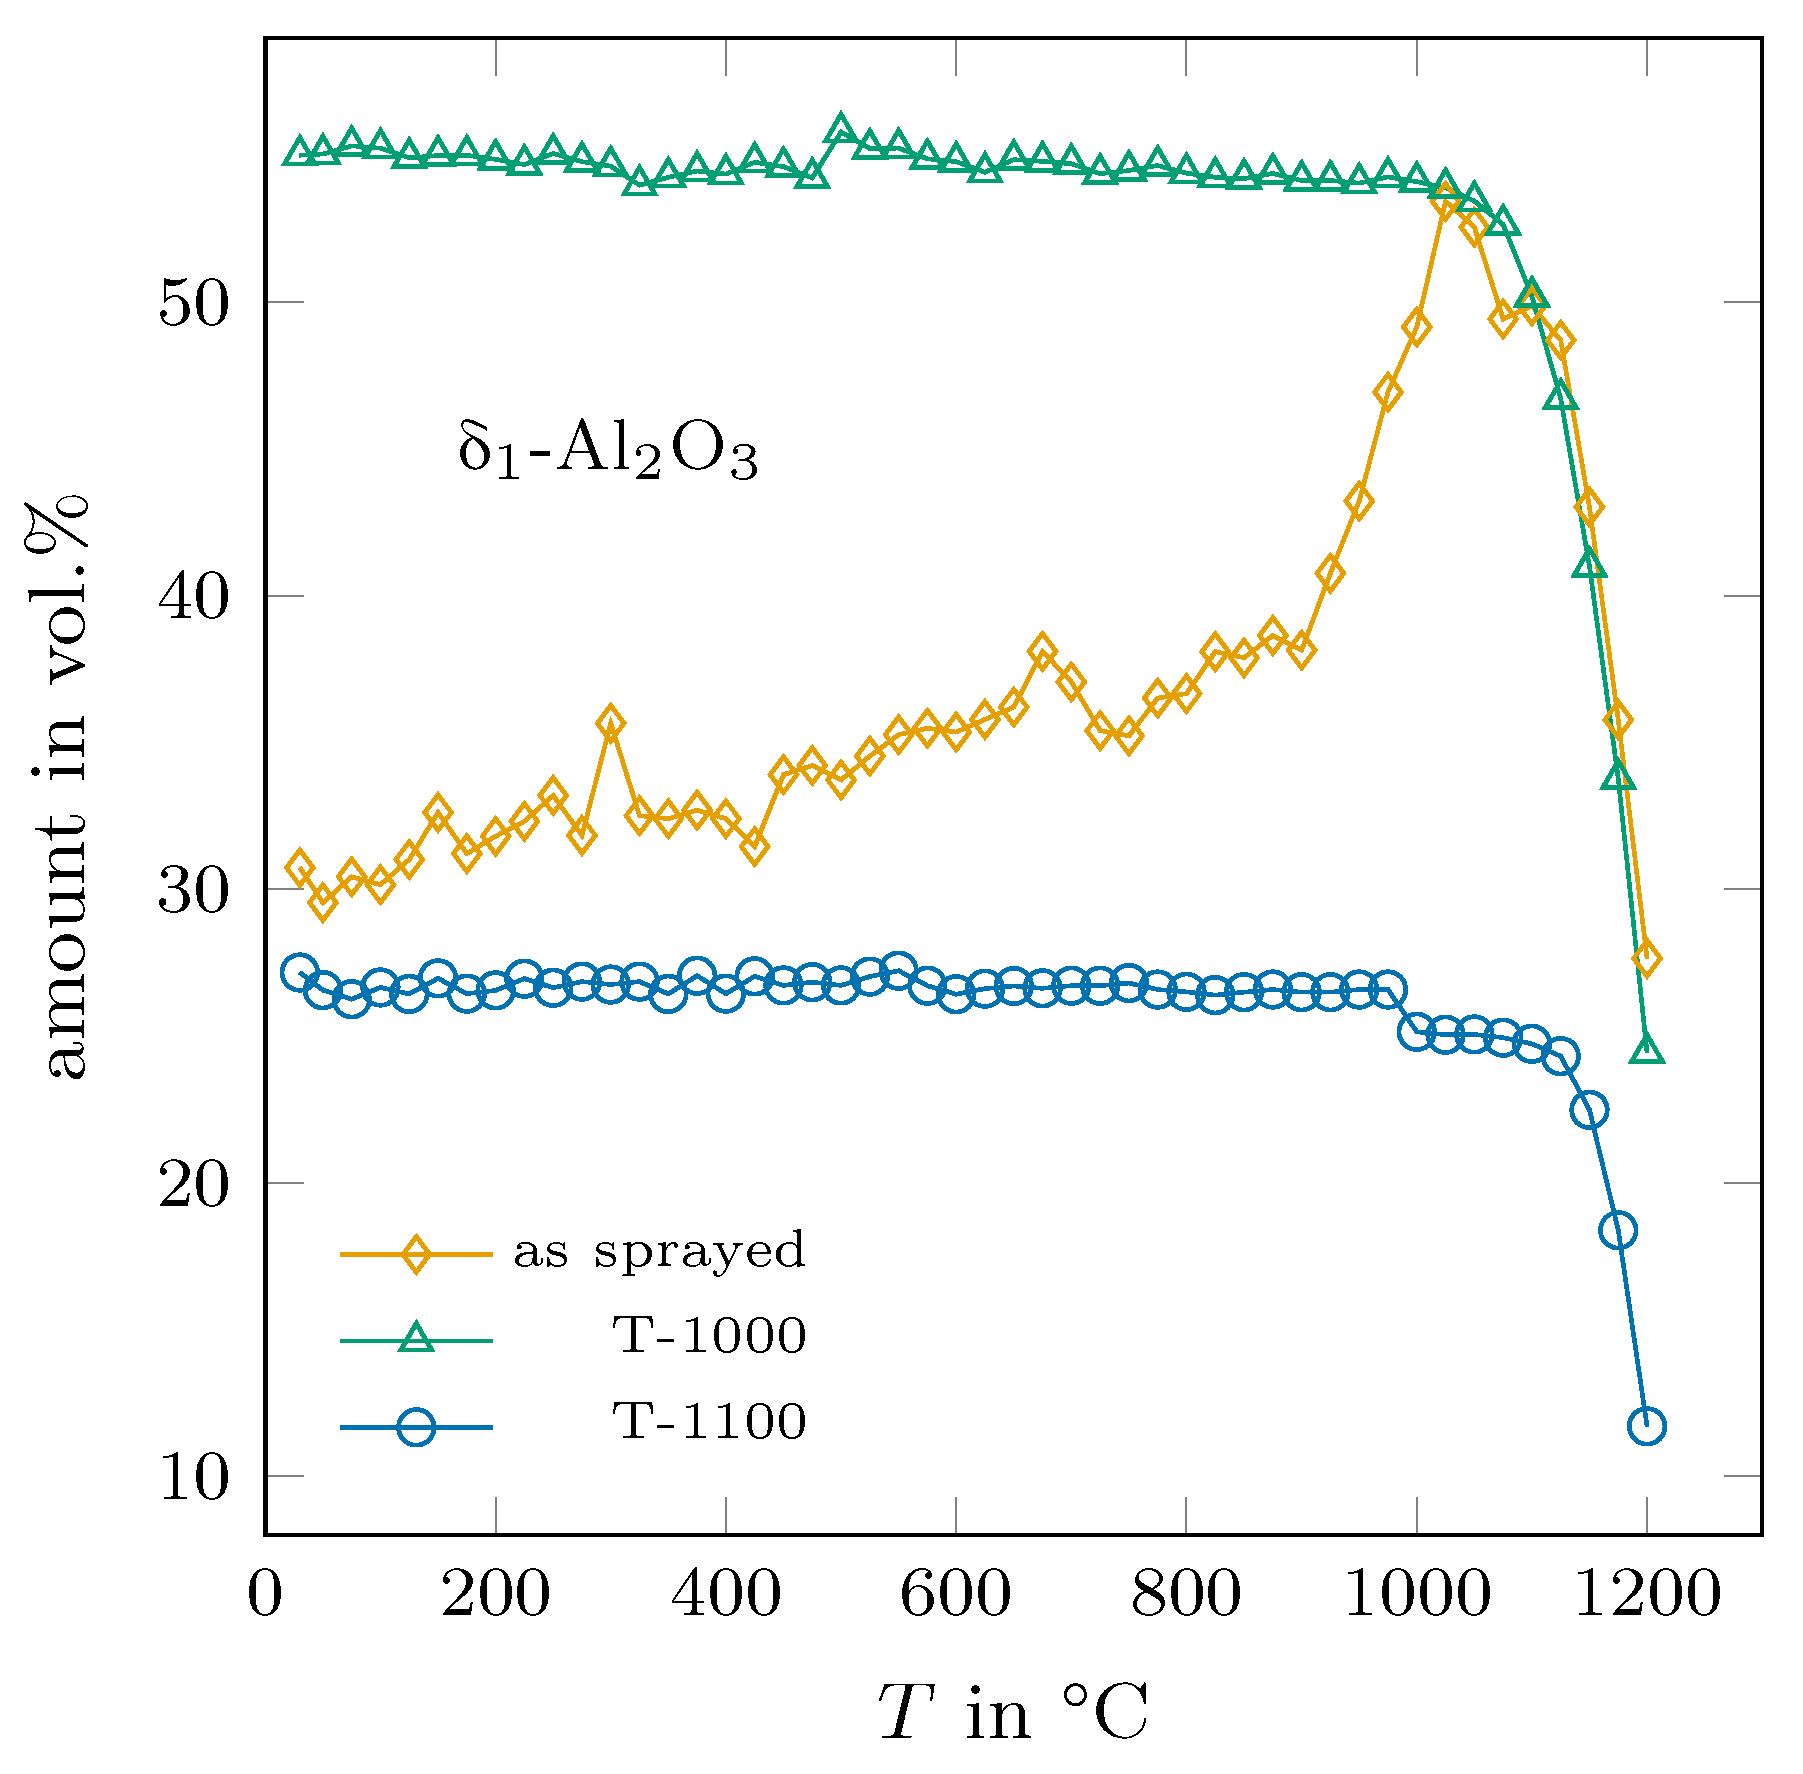
3.1. Phase Transformations of the Flame-Sprayed Sample
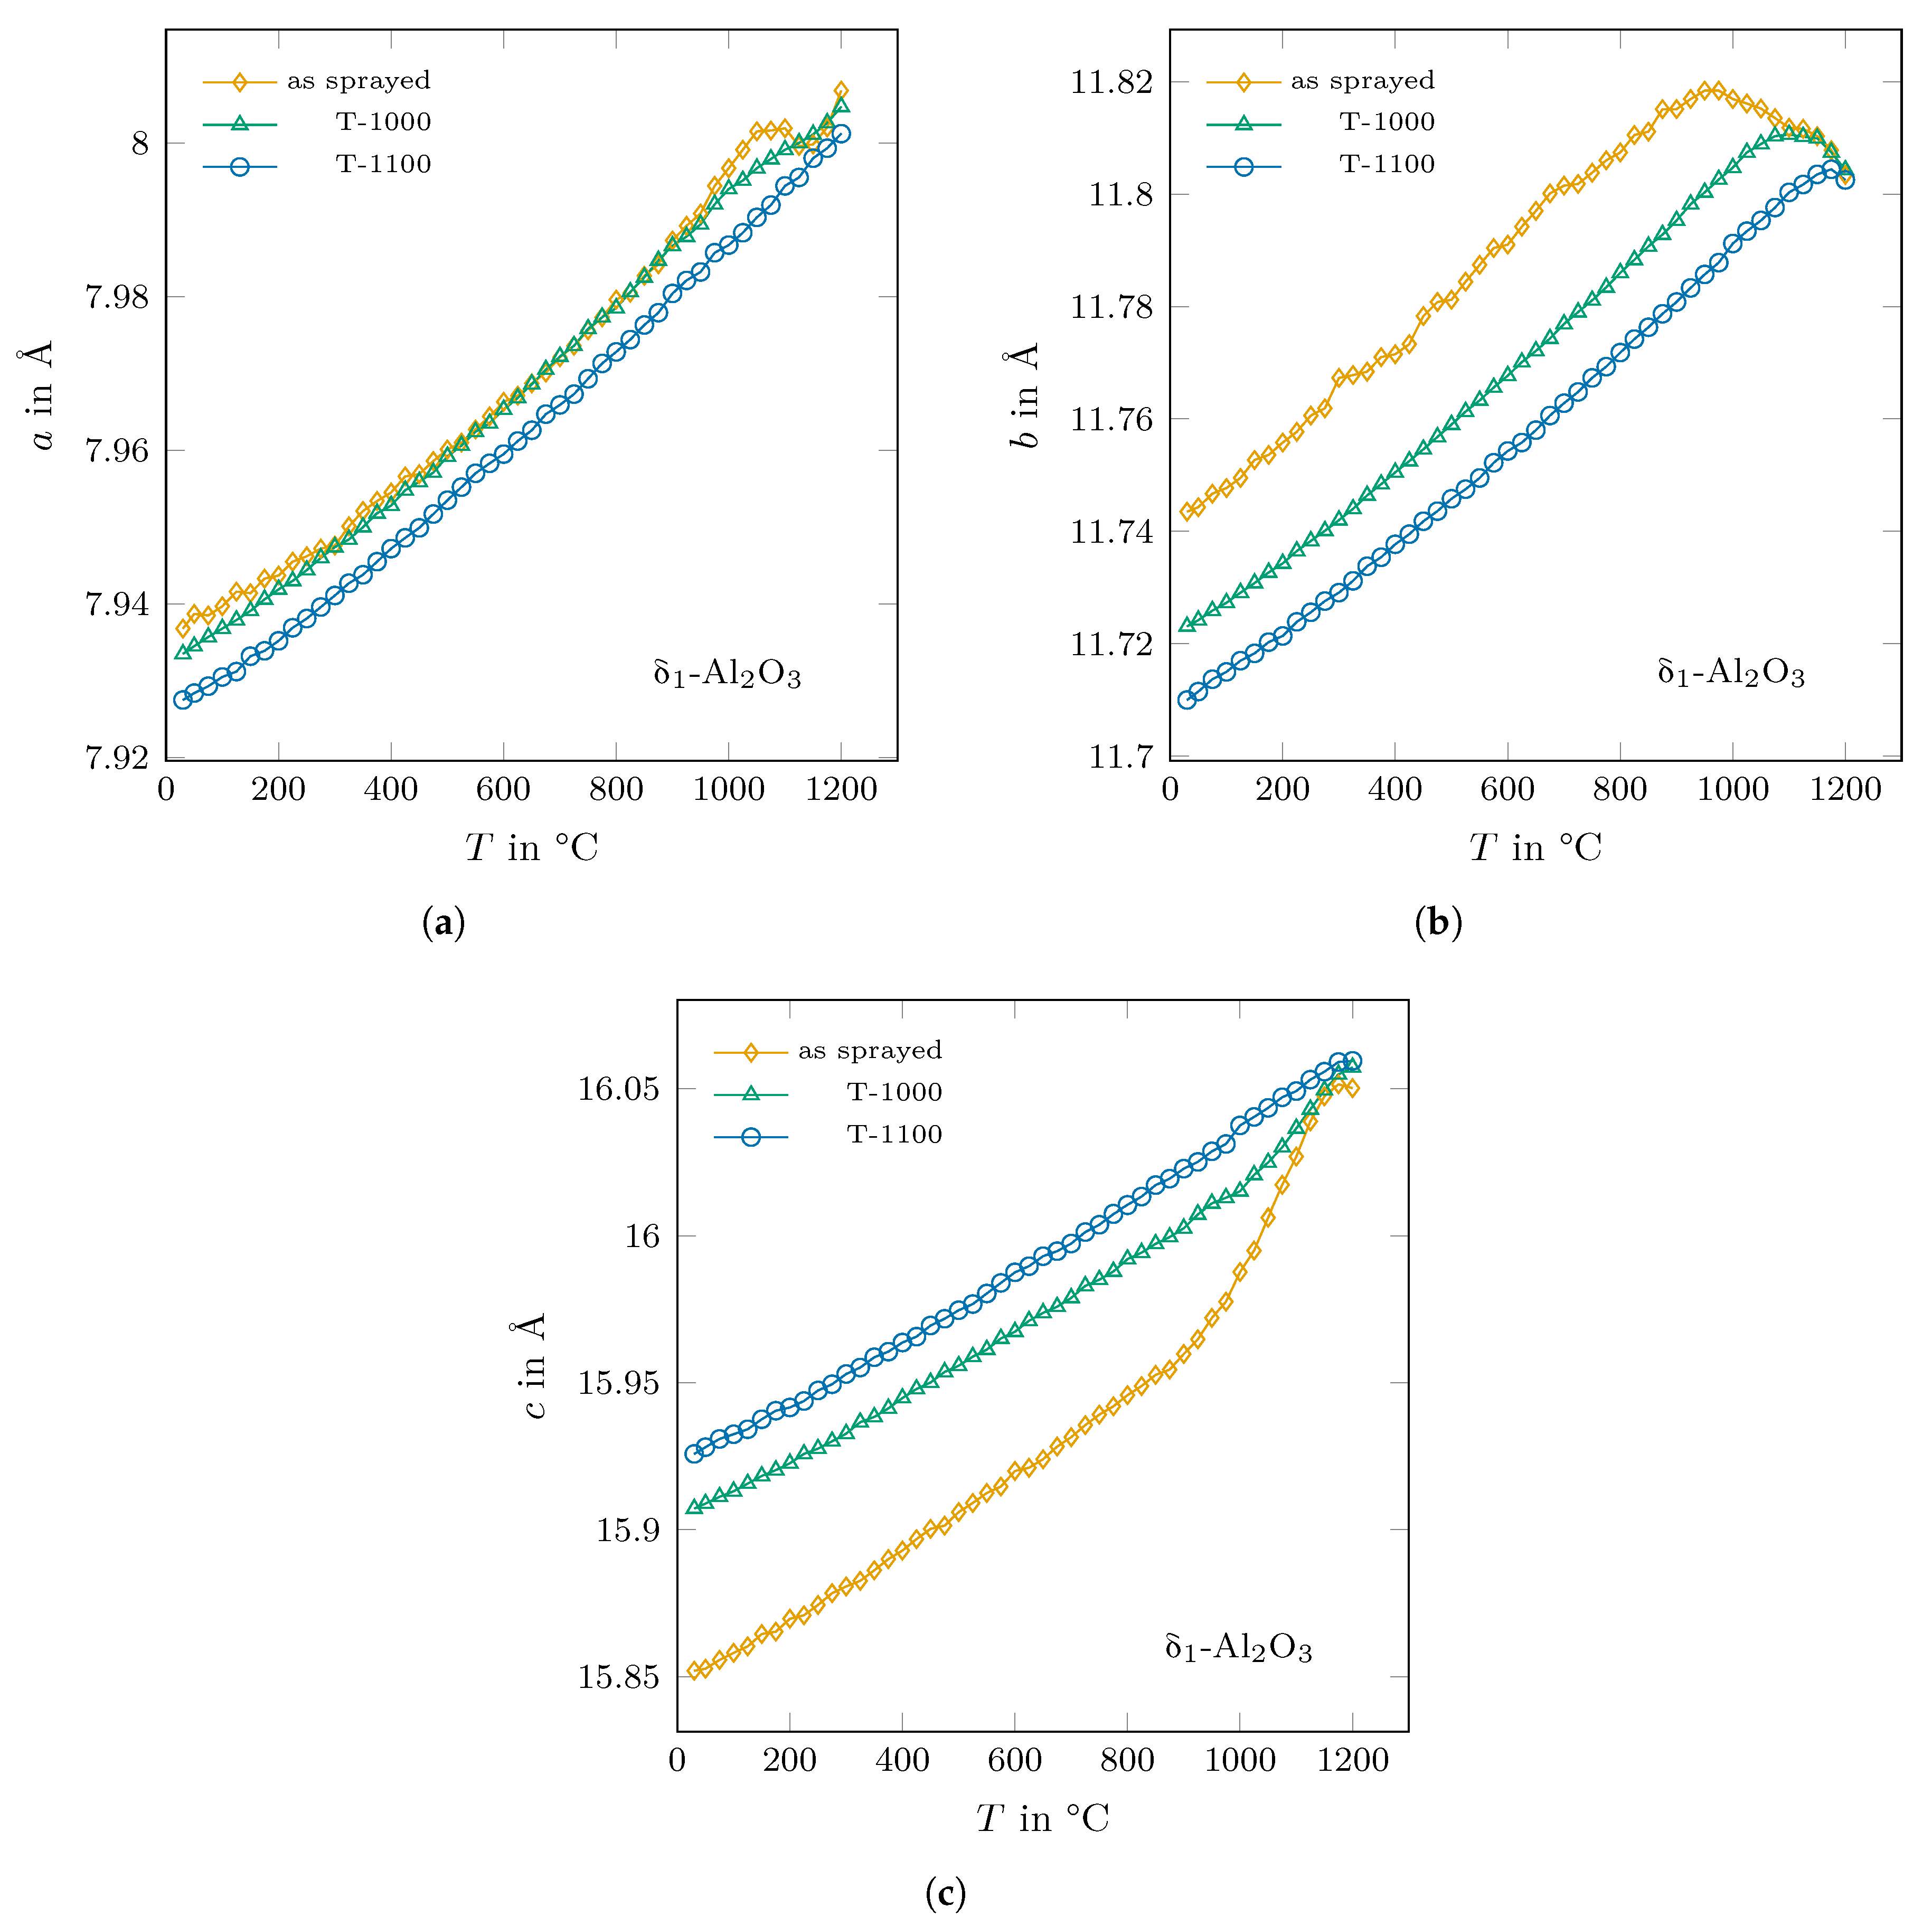
The as-sprayed sample consisted of 30 vol.% α -Al 2 O 3 and δ 1 -Al 2 O 3 , respectively, and 40 vol.% η -Al 2 O 3 . With heating up to 900 °C, approximately 8 vol.% of η -Al 2 O 3 transformed into the δ 1 polymorph. In the temperature range above 900 °C, until it completely vanished between 1100 °C and 1025 °C, η -Al 2 O 3 was mostly transformed into δ 1 -Al 2 O 3 with an increased transition rate. After reaching a maximum of 55 vol.% at 1025–1050 °C, the amount of δ 1 decreased to 28 vol.% at 1200 °C. θ -Al 2 O 3 was formed at temperatures higher than 1025 °C and its amount increased constantly up to 32 vol.% at 1200 °C. One can say that all observed transformation rates occured linearly with temperature, only the amount of α -Al 2 O 3 increased nonlinearly at temperatures above 950 °C, as it can be deduced from Figure 3. The transition rates of η -, δ 1 - and θ -Al 2 O 3 , which were obtained by least-square fitting, are summarised in Table 1.
Two things are remarkable here: (1) The linear transition rates show that the transformation sequence η δ 1 θ + α is not limited by kinetic effects (even close to room temperature). If it was so, the transition rates should increase with increasing temperature. (2) The measurements confirmed that the densities of the observed aluminas are different and show the general sequence ρ ( θ ) < ρ ( η ) < ρ ( δ 1 ) < ρ ( α ) . It is interesting that after the formation of the relatively dense δ 1 phase, it is partially transformed into the least dense θ -Al 2 O 3 . Therefore, the transformation path of the metastable aluminas to the thermodynamically stable α -variant does not follow the simple assumption that the lattices are transformed step by step in the direction of the stablest structure, e.g., from a low-density variant to the densest α -Al 2 O 3 phase.
In the following, a model will be presented that is able to explain the experimental findings and that gives proposes the driving force for the transitions of the metastable aluminas. As the transformations seem not to be thermally activated, another process must be in charge that induces a constant phase transition even at low temperatures. Thermal expansion could be a candidate, and it was found that slight differences in the thermal expansion of the phases in question are key to understanding the observations. In Figure 4a, the ratios of the measured cell volumes (per formula unit of Al 2 O 3 ) of η : α and η : δ 1 are shown. Up to a temperature of 800 °C, η and δ 1 show the same thermal expansion, but the thermal expansion coefficient of α -Al 2 O 3 is larger than the one of η , resulting in a constantly decrease in the corresponding volume ratio. With 40 vol.% η -Al 2 O 3 in the as-sprayed state, it can be assumed that α -Al 2 O 3 was dispersed and formed a nucleus in the η -Al 2 O 3 matrix. With a larger thermal expansion coefficient, the α -Al 2 O 3 grains will induce pressure on the surrounding matrix on heating. This stress can be reduced by crack formation or phase transformation. In the latter case, the transition from η - to δ 1 -Al 2 O 3 is promising as the density of δ 1 is larger than that of η , which means that an open volume can be created during transition that can be filled by α -Al 2 O 3 with increasing temperature.
With a derived dataset indexed with i, the fraction of the created free volume per transformed volume of η -Al 2 O 3 , f open , can be calculated by
f open = 1 f η δ 1 = 1 V i δ 1 V i 1 η ,
where V i * and V i 1 * are the respective cell volumes at the current temperature T i and at the preceding one at T i 1 , respectively, with * { δ 1 , η , α }. The amount of transformed η -Al 2 O 3 is then given by
Δ n V η δ 1 = f open · n V η · f η ,
where f η is the fraction of the amount of η , n V η , that is transformed on heating. In a similar way, the necessary volume for α -Al 2 O 3 can be calculated from the change in the V η / V α ratio. The volume ratios were fitted with
r * ( T ) = a + b · T + c · exp ( T 600 ) d
as it can be seen in Figure 4a. The change in the ratio is then simply calculated with Δ r α = r α ( T i ) r α ( T i 1 ) using a = 1.0934 , b = 2.68407 · 10 6 / ° C , c = 1.7055 · 10 5 and d = 0.0139101 . The additional volume for α is then
Δ n V α = Δ r i α · n V , i α .
With that, the transition rate of the volume of the η -Al 2 O 3 can be calculated by
Δ n V η Δ T = Δ n V α · n V η Δ n V η δ 1 · Δ T = Δ r i α · n V , i α f open · Δ T .
The calculated maximum transition rate for this reaction is shown in Figure 4b. The calculated rate has a maximum value of −0.13 vol.%/K at around 1000 °C, relatively close to the experimentally determined one of −0.09 vol.%/K (see Table 1), which means that approximately a maximum of 69 % of the possible η volume is affected by the induced stress field of the α expansion.
For temperatures above 600 °C, the thermal expansion of η -Al 2 O 3 becomes increasingly larger than those of the δ 1 and α phases, showing the largest volume ratios between 1025 and 1050 °C. The induced pressure on the η lattice by α -Al 2 O 3 and the resulting transition rate disappeared just below 800 °C, as can be seen in Figure 4b. With a reducing volume amount of η , δ 1 -Al 2 O 3 became the dominant phase in the phase assemblage of the investigated sample from 600 °C up to 1100 °C. Upon losing its matrix character, η -Al 2 O 3 induces pressure within the formed δ 1 matrix due to the differences in thermal expansion. Consequently, the transition rate for the second induced η δ 1 transition can be estimated as
Δ n V , i η Δ T = Δ r i δ 1 · n V , i 1 η f open · Δ T ,
using a = 1.00572 , b = 2.23484 · 10 7 / ° C , c = 1.54154 · 10 5 and d = 0.0136704 for r δ 1 ( T ) . For this reaction, a transition rate of ≈−0.002 vol.%/K was found up to a temperature of 550 °C, which increased up to −0.128 vol.%/K at 1025 °C (see Figure 4b). The transition rates obtained from the Rietveld refinement (Table 1) were 0.12 vol.%/K for δ 1 formation and −0.15 vol.%/K for the η decomposition above 900 °C.

3.2. Structural Changes in δ 1 -Al 2 O 3 and η -Al 2 O 3

The δ 1 phase undergoes a structural change under heating independent of the heat treatment history, as shown in Figure 5. Its lattice parameters show an anisotropical thermal expansion. After reaching a maximum value (at ≈950 °C for the as-sprayed sample and at ≈1100 °C and 1175 °C for the T-1000 and T-1100 samples, respectively), the lattice parameter b decreases on heating up to the maximum temperature of 1200 °C, whereas the length of the c-axis significantly increases at temperatures above 900 °C. It seems that for both axes, the lattice parameters of the as-sprayed and the annealed δ 1 phases tend to (or would tend if stable enough) to reach the same value at 1200 °C and above, respectively. In comparison, the values of the lattice parameter a were almost the same in as-cast and the T-1000 state and the T-1100 values were found to be slightly lower. In general, the a values increase with temperature with a pronounced hump for the as-cast state and a maximum at around 1050 °C. This effect is less dramatic in case of the T-1000 sample and was not detected for the T-1100 sample. The respective extension of the overall structural changes in δ 1 -Al 2 O 3 were the largest for the as-sprayed state and decreased with increasing annealing temperature.
Similarly, a strong increase in the volume of the cubic η -Al 2 O 3 was observed at temperatures above 900 °C until it was fully transformed at ≈1050 °C.

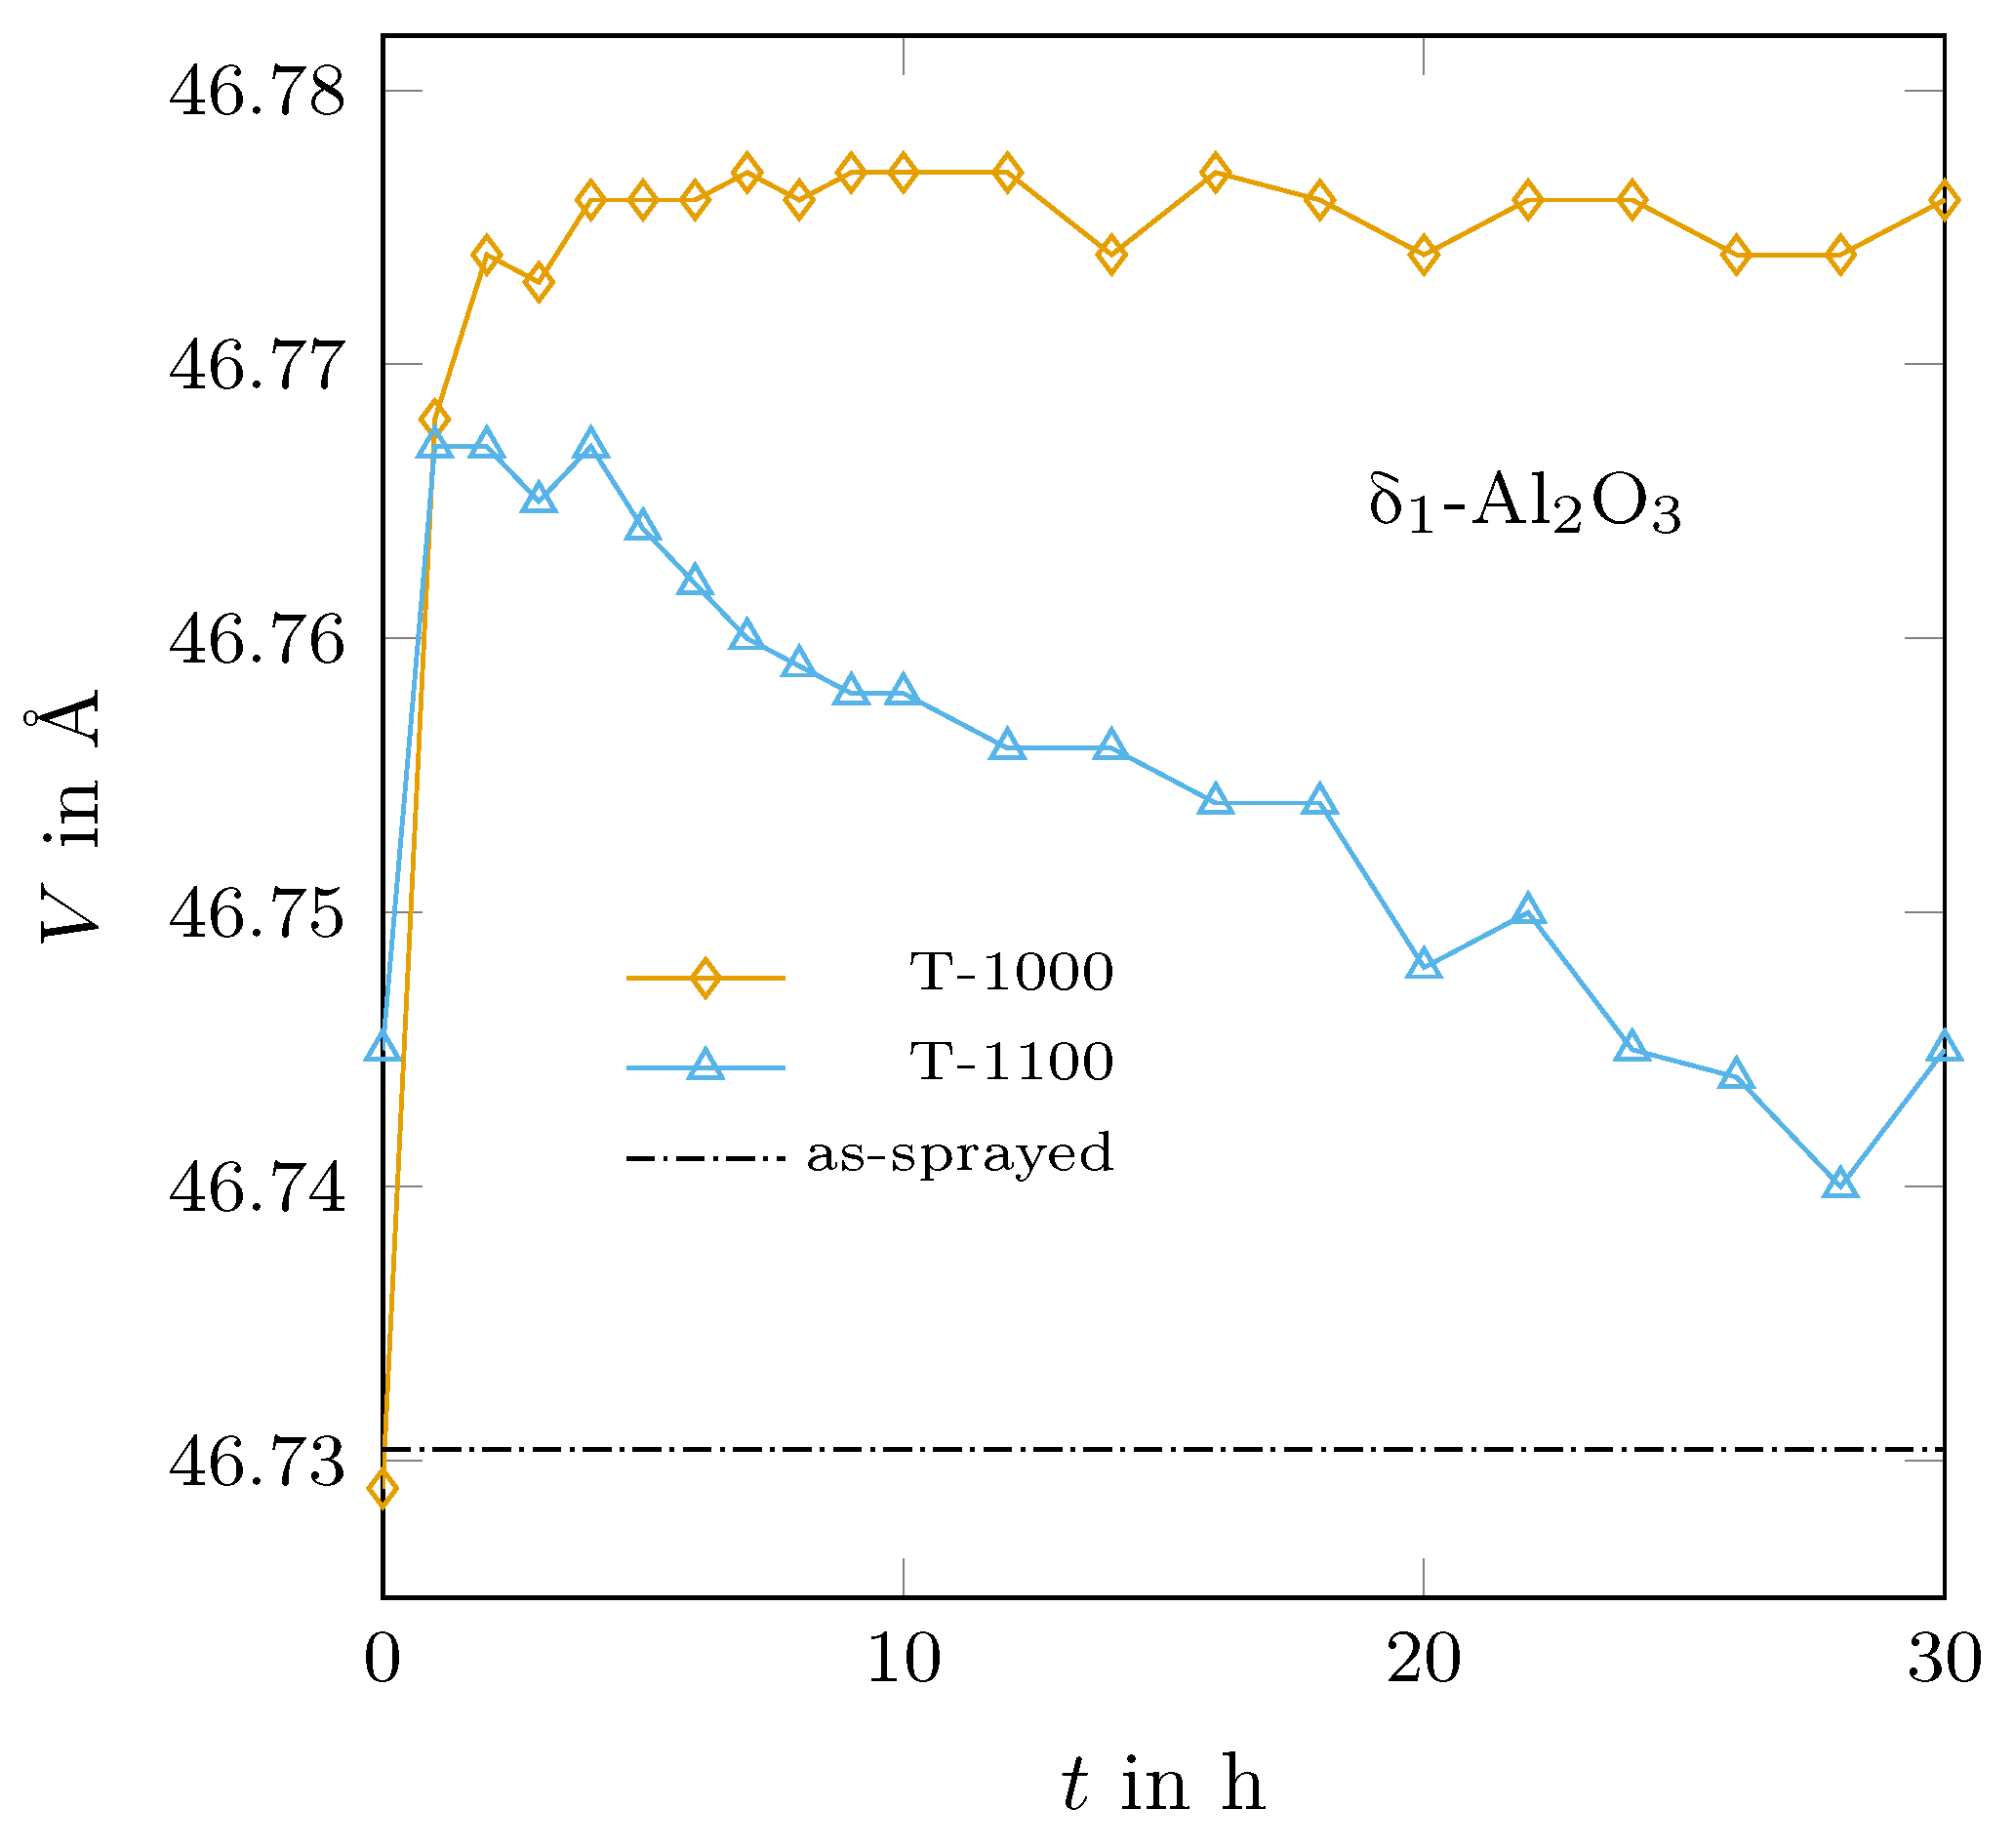
3.3. Structural Changes at a Constant Temperature

The phase relations among the different alumina structures were studied using annealing experiments at 1000 °C and 1100 °C. Especially for the δ 1 -Al 2 O 3 variant, distinct structural changes were observed, for example, the lattice dimension in a- and b-direction decreased whereas that in the c-direction strongly increased with time. However, the volume of the unit cell stayed almost constant after five hours annealing at 1000 °C, whereas the unit cell volume decreased almost constantly during annealing at 1100 °C. Interestingly, the cell volumes in both experiments were always above the value that was obtained during the thermal expansion measurement of the as-sprayed sample (heated in steps of 25 K followed by a roughly one hour holding time), as can be seen in Figure 6.
Even the δ 1 -variant showed the strongest structural changes with annealing time, there were changes in all phases—even some slight ones in α -Al 2 O 3 . It can be assumed that a change in lattice dimensions modifies the surface energy of the crystals, which could be a driving force for further phase transitions as well. Figure 7 shows the determined trend of the phase assemblages of the two experiments. η -Al 2 O 3 transformed mainly into δ 1 during annealing at 1000 °C but also the contents of α - and θ -Al 2 O 3 increased. The latter was not detected until 1050 °C in the case of 25 K-step heating of the as-sprayed material. In comparison, at 1100 °C, δ 1 -Al 2 O 3 transformed into θ - and α -Al 2 O 3 in agreement with the findings of Wilson and McConnell [16].

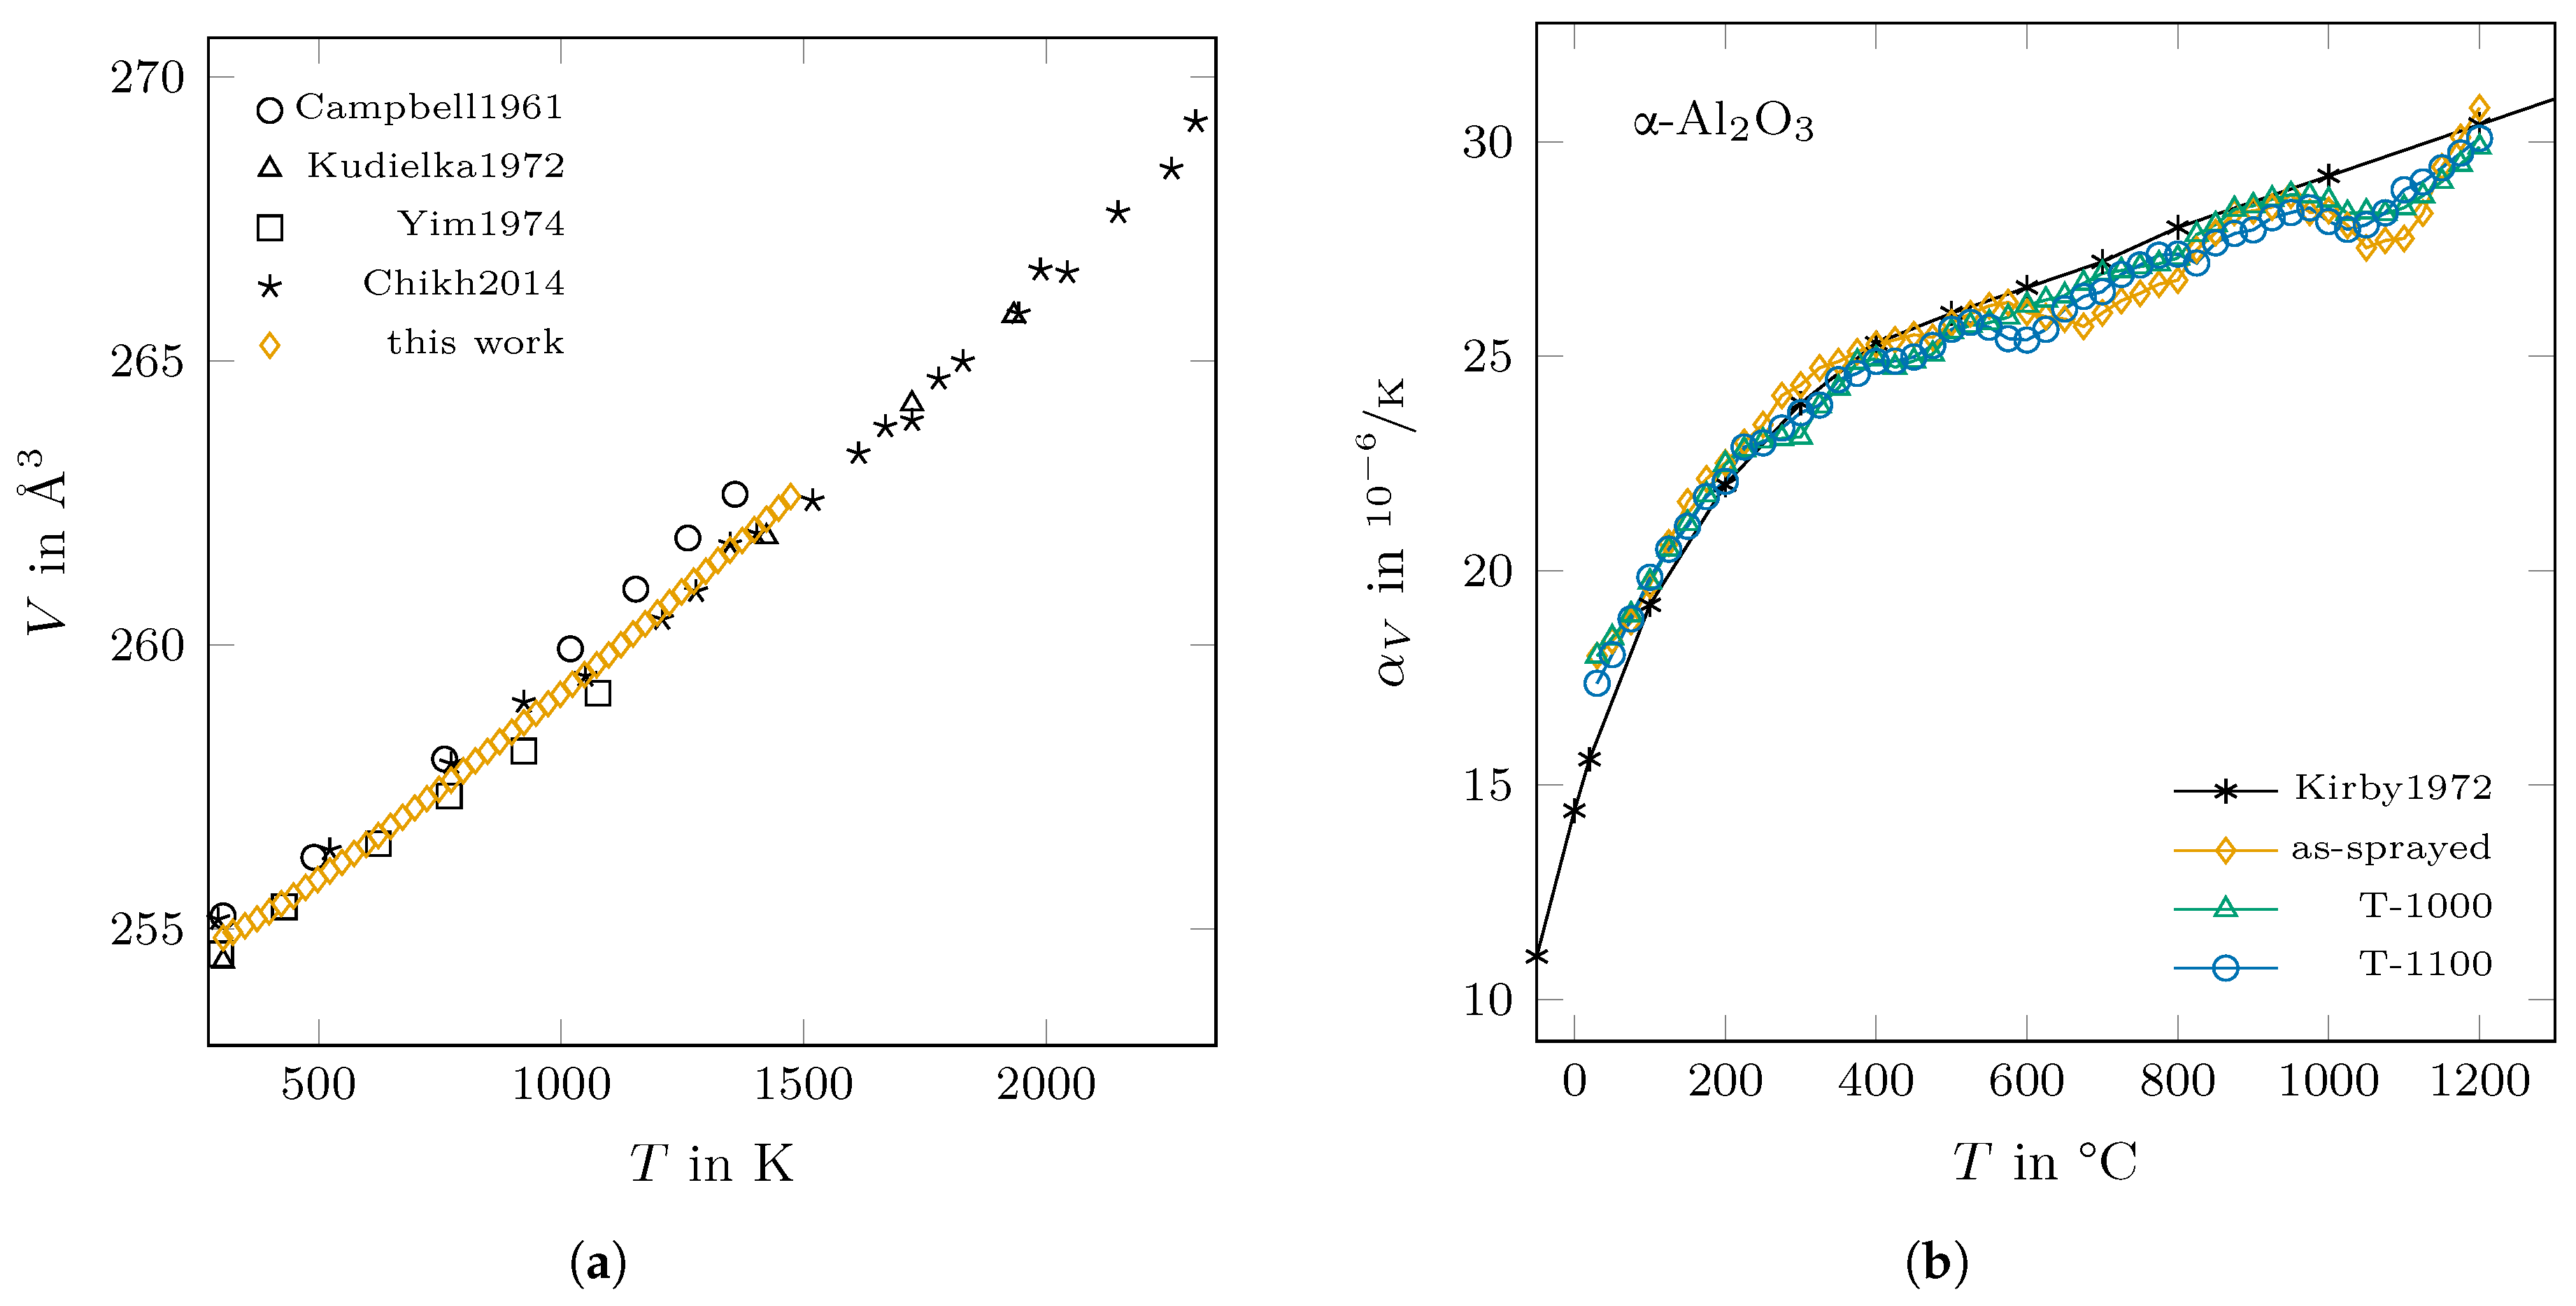
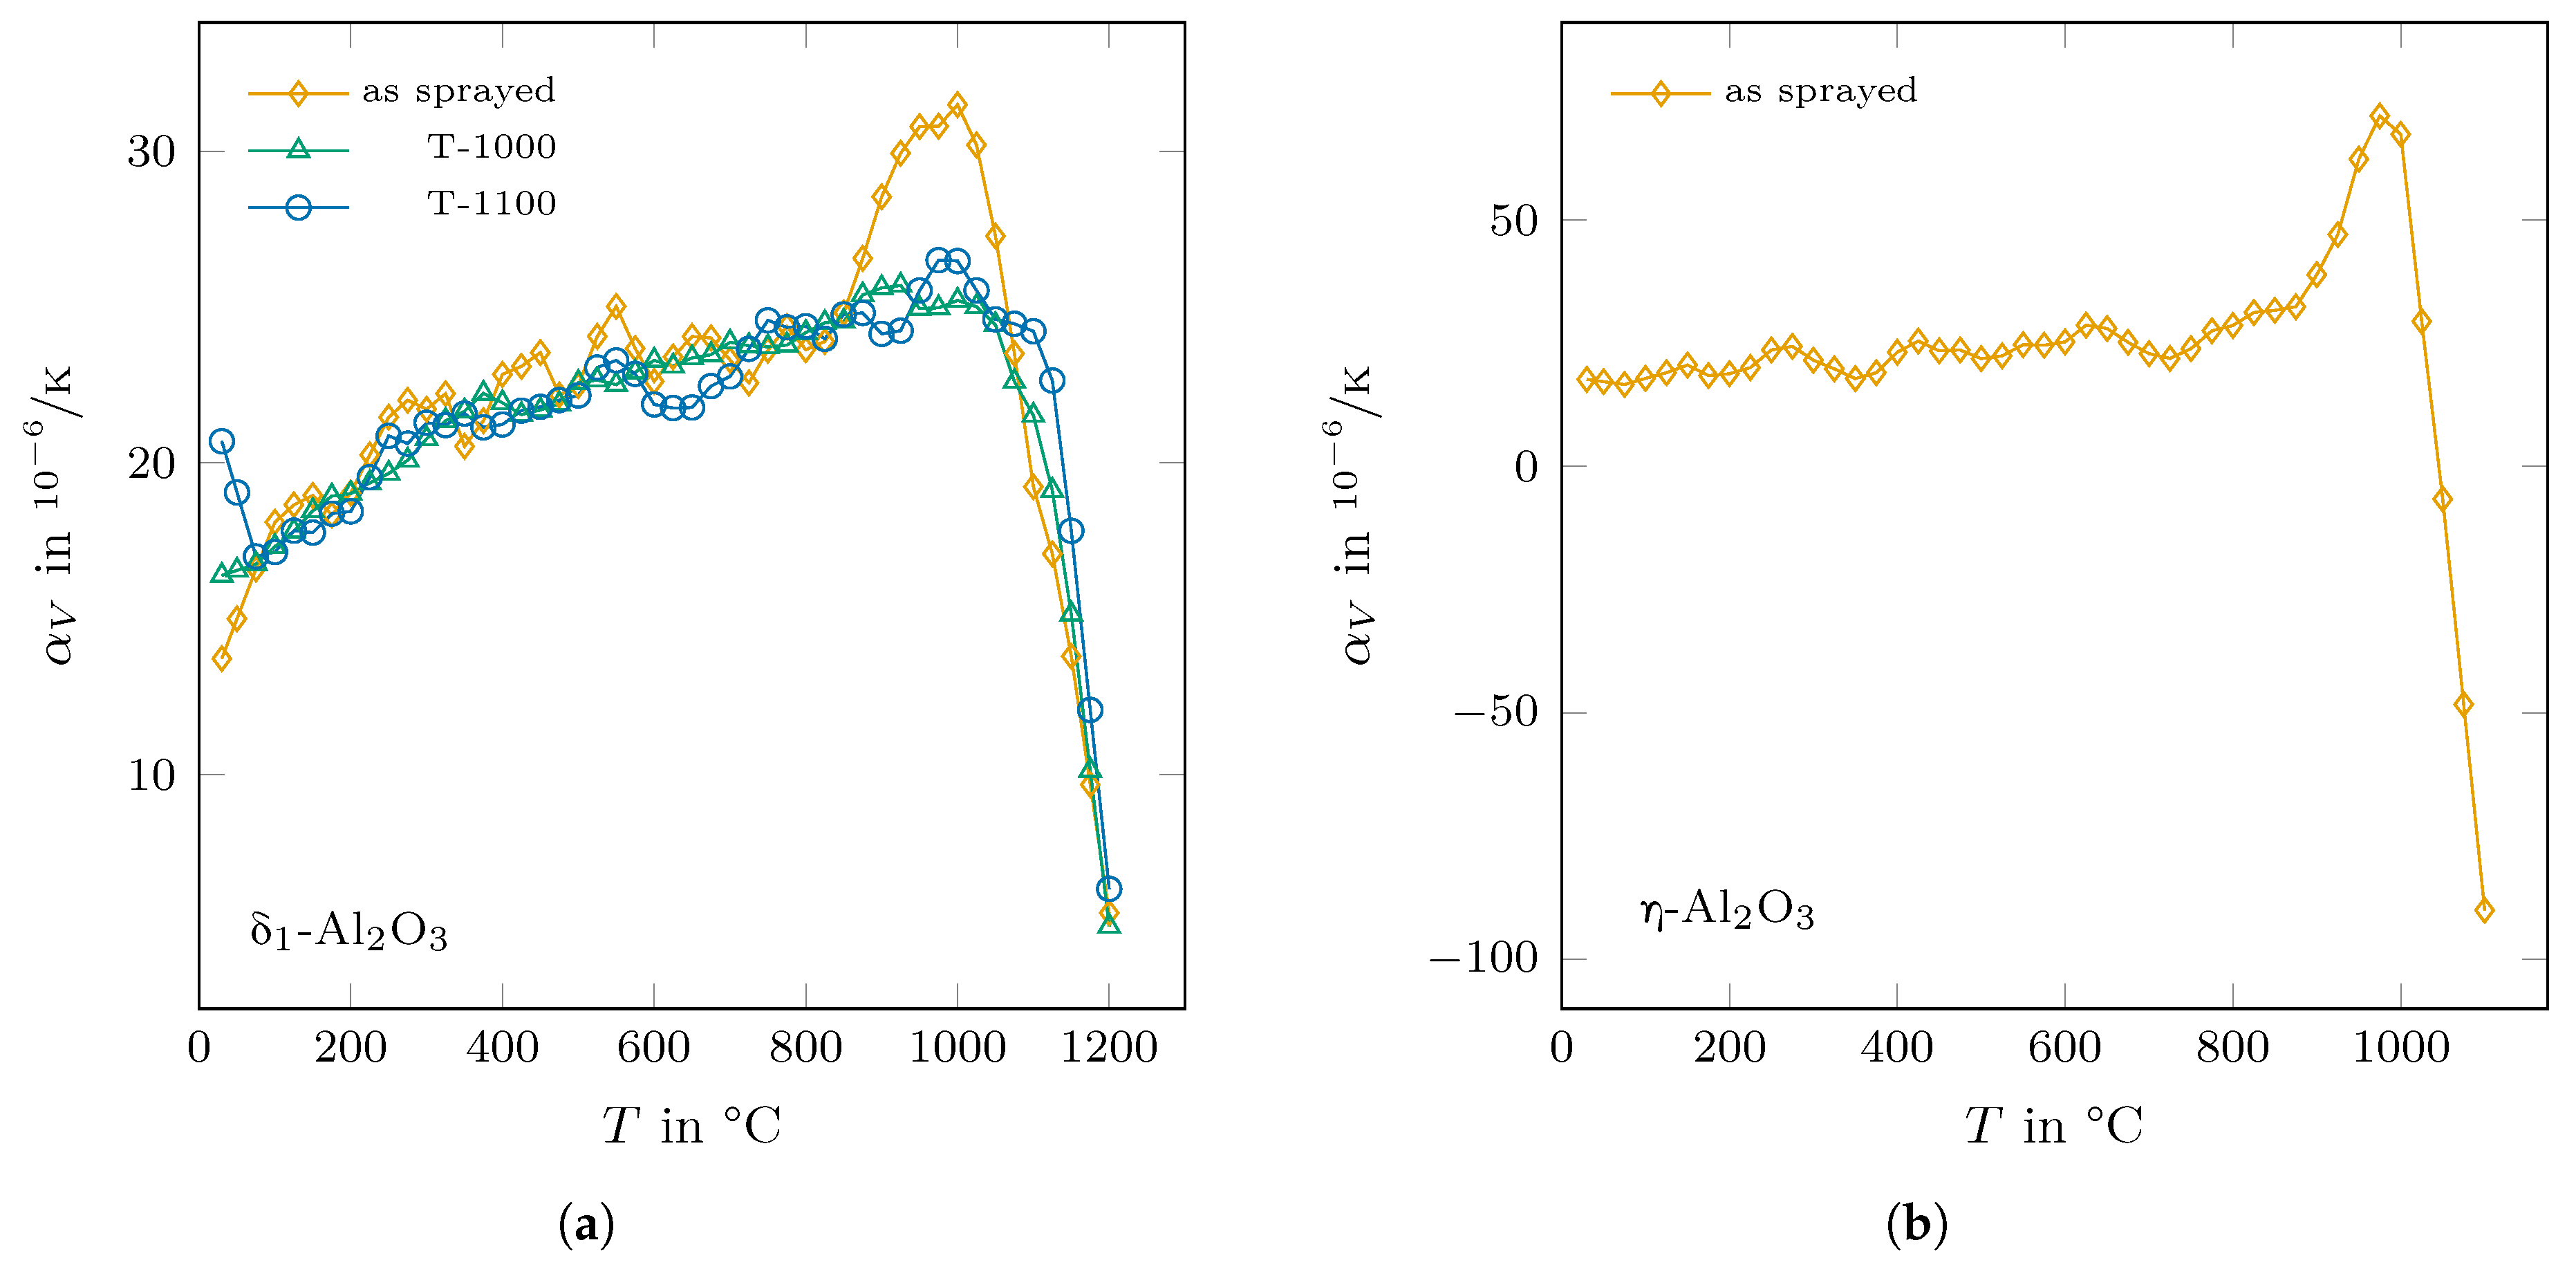
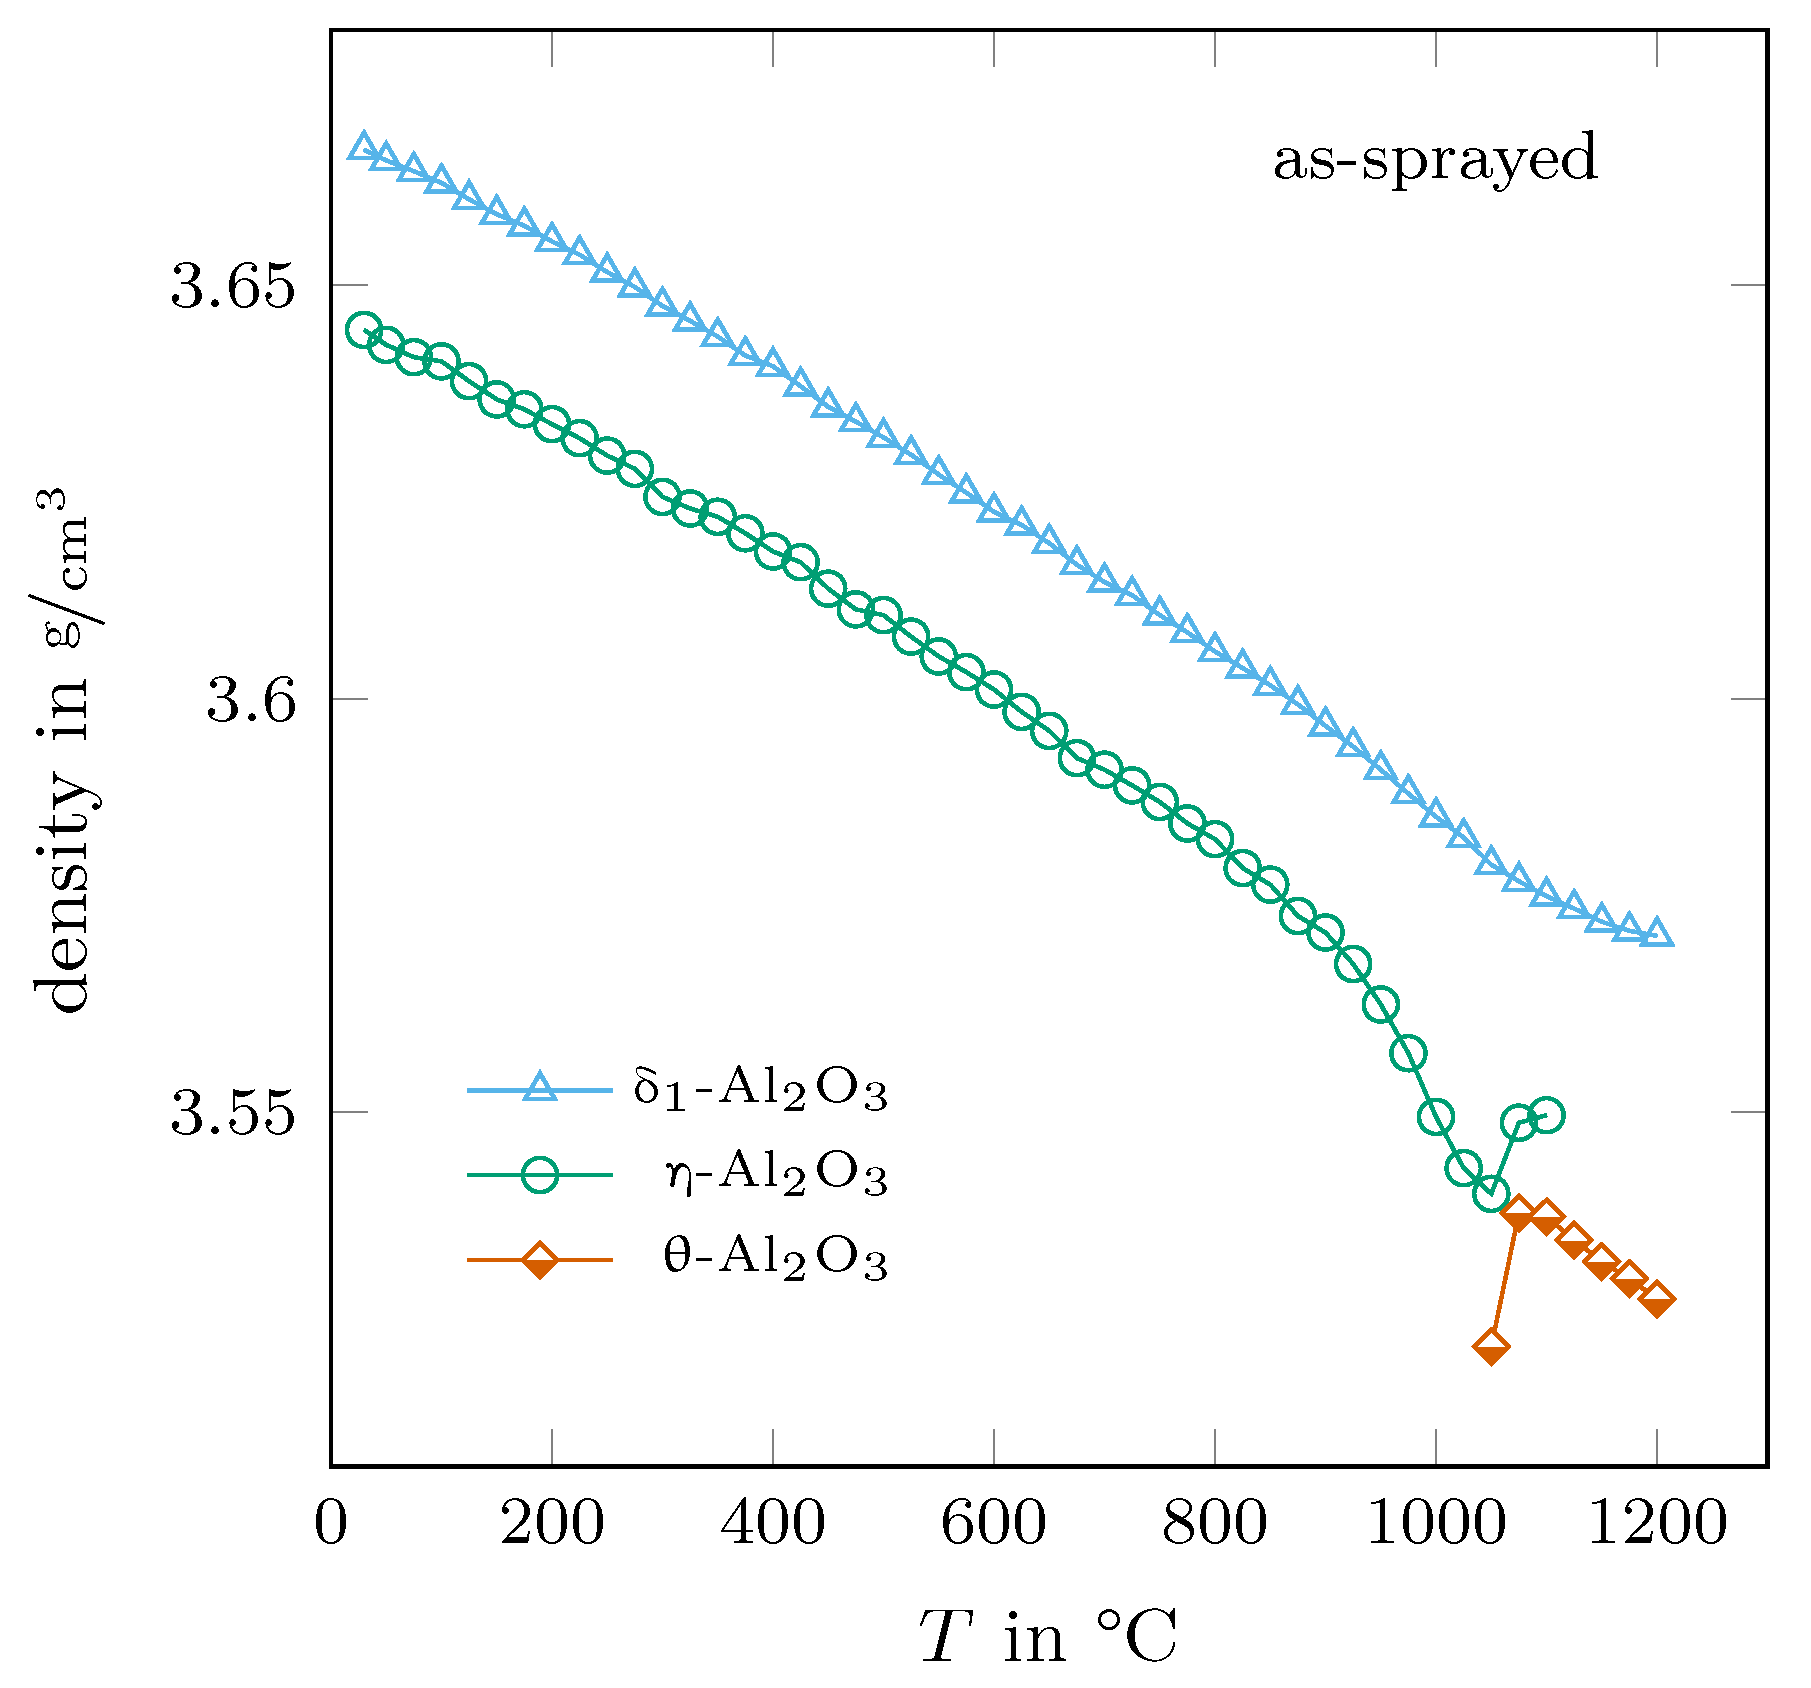
3.4. Thermal Expansion of Corundum and the Transition Aluminas

The thermal expansion of α -Al 2 O 3 was determined as a reference to validate the chosen method for determining the thermal expansion coefficient. The determined cell volume and the corresponding calculated thermal expansion coefficient are shown in comparison with reported data from the literature in Figure 8. For the latter, the calculated values closely follow the reference data [36] up to temperatures of approximately 950 °C. Above, the thermal expansion coefficient of all three samples shows a slight minimum of ≈10% below the reference value at around 1050 °C after it increases up to the reference value at 1200 °C.
Overall, the used method of determining the thermal expansion coefficient from the measured volume values worked within an acceptable range of scatter. Therefore, it was also applied to analyse the data of the transition aluminas.
As it can be expected from the presented lattice parameters in Figure 5, the thermal expansion coefficient of δ 1 -Al 2 O 3 differs much between the as-sprayed and the annealed states in the temperature range between 850 °C and 1100 °C, as can be seen in Figure 9a. For the annealed δ 1 phase, the values of α V range from 16.5 · 10 6 /K at room temperature to 25.2 · 10 6 /K at 1000 °C before they drop to 5.1 · 10 6 /K at a temperature of 1200 °C. In comparison, the as-sprayed state shows a similar trend of α V up to a temperature of 850 °C, then strongly increases up to a value of 31.5 · 10 6 /K at 1000 °C and finally decreases in value in the same way as the annealed phases.
The determined trend of the thermal expansion coefficient of the as-sprayed η -Al 2 O 3 showed a similar behaviour as the as-sprayed δ 1 phase (see Figure 9b). Here, α V ranged from 17.6 · 10 6 /K at room temperature to 32.4 · 10 6 /K at 875 °C, before it reached a maximum value of 71.1 · 10 6 /K at 975 °C and dropped below zero for temperatures above 1025 °C.

4. Discussion

The transformation of the metastable aluminas to the final α -Al 2 O 3 formation is a complex interplay between structural changes, surface energy and crystal defects. Based on the results of this work, it is suggested that the η ( γ ) δ 1 θ transformation sequence is, at least in parts, mechanically induced. Such transformations of boehmite-derived metastable aluminas to α -Al 2 O 3 were reported, e.g., in [41,42,43,44], to be triggered by milling processes. As already shown by Wilson and McConnnel [16], the transformation sequence is also a question of time at constant temperatures. In the current work, it was shown that the phases undergo some structural changes as well, which can be related to a rearrangement of the atoms within the unit cell. Such internal ordering influences properties such as the surface energy and can thus influence the thermodynamic-based relations of the different crystals at their interfaces, inducing further transformations.
After a 30 h annealing time, the T-1000 and T-1100 samples were heated and characterised by XRD in the same procedure as the as-sprayed sample. Figure 10 shows the obtained δ 1 -Al 2 O 3 content for the three samples. The annealed samples showed no change in their phase contents up to the respective annealing temperatures. Above these temperatures, the amounts of δ 1 -Al 2 O 3 were then dramatically reduced up to 1200 °C. It is worth noting that in case of the as-sprayed and the T-1000 sample, the thermal history seems to have only a slight influence on the phase content and the kinetics of the δ 1 decomposition above 1000 °C, whereas the lattice dimensions were quite different at the same time (see Figure 5).
A direct γ θ transition was reported in [1] and such a transition seems to also be indicated in the presented work. The determined trends of density for the transition aluminas of the as-sprayed sample with temperature are shown in Figure 11. As already mentioned in Section 3.2, the volume of the elemental cell of η -Al 2 O 3 strongly increases above 900 °C, leading to a corresponding decrease in density. The density values of η - and θ -Al 2 O 3 are seamlessly connected between the temperatures of 1050 °C and 1075 °C. Such behaviour would indicate a second-order phase transition. The two density values above 1050 °C for η -Al 2 O 3 and the one at 1050 °C for θ -Al 2 O 3 are ignored here. The respective phase contents were already below 5%, and with no presence of distinct (and strong) reflections in the diffraction pattern, the uncertainty of the determined lattice parameters might be too large for a correct determination.
From a technological point of view, the large values of thermal expansion on first heating observed for η -Al 2 O 3 and δ 1 -Al 2 O 3 can be problematic in the fast heating of such coatings. At the least, crack propagation can be expected or—even worse—spalling effects might be occur. One should also keep in mind that the flame-sprayed material is relatively dense perpendicular to the surface but shows extensive pore networks along the surface due to its two-dimensional layered character on the macroscale. The available pore dimensions will also influence the extension of pressure-induced phase transitions, which must be taken into account when interpreting the results of this work as micropores could still be present after milling the flame-sprayed coating.

Supplementary Materials

The following are available online at https://www.mdpi.com/article/10.3390/cryst13050743/s1.

Author Contributions

Conceptualization, T.Z.; data curation, T.Z.; formal analysis, T.Z.; methodology, T.Z.; validation, T.Z.; investigation, T.Z.; resources C.G.A.; writing—original draft preparation, T.Z.; writing—review and editing, T.Z. and C.G.A.; visualization, T.Z.; project administration, C.G.A.; funding acquisition, C.G.A. All authors have read and agreed to the published version of the manuscript.

Funding

This research was funded by the German Research Foundation (DFG) within the Research Unit FOR 3010 (project number: 416817512). The X-ray diffractometer was acquired through the “Major Research Instrumentation” funding programme of the German Research Foundation (DFG), reference number: INST 267/157-1 FUGG (project number: 395259190).

Data Availability Statement

The data presented in this study are available on request from the corresponding author. The main results of the Rietveld analysis and the processed thermal expansion data can be found in the Supplementary Files.

Acknowledgments

We are grateful for the sample preparation by Florian Kerber.

Conflicts of Interest

The authors declare no conflict of interest. The funders had no role in the design of the study; in the collection, analyses, or interpretation of data; in the writing of the manuscript; or in the decision to publish the results.

References

  1. Lee, J.; Jeon, H.; Oh, D.G.; Szanyi, J.; Kwak, J.H. Morphology-dependent phase transformation of γ-Al2O3. Appl. Catal. A Gen. 2015, 500, 58–68. [Google Scholar] [CrossRef]
  2. Kovarik, L.; Bowden, M.; Szanyi, J. High temperature transition aluminas in δ-Al2O3/θ-Al2O3 stability range: Review. J. Catal. 2021, 393, 357–368. [Google Scholar] [CrossRef]
  3. Dauger, A.; Fargeot, D. T.E.M. study of Al2O3 metastable phases. Radiat. Eff. 1983, 74, 279–289. [Google Scholar] [CrossRef]
  4. Nordahl, C.S.; Messing, G.L. Thermal analysis of phase transformation kinetics in α-Al2O3 seeded boehmite and γ-Al2O3. Thermochim. Acta 1998, 318, 187–199. [Google Scholar] [CrossRef]
  5. Fargeot, D.; Mercurio, D.; Dauger, A. Structural characterization of alumina metastable phases in plasma sprayed deposits. Mater. Chem. Phys. 1990, 24, 299–314. [Google Scholar] [CrossRef]
  6. Damani, R.; Makroczy, P. Heat treatment induced phase and microstructural development in bulk plasma sprayed alumina. J. Eur. Ceram. Soc. 2000, 20, 867–888. [Google Scholar] [CrossRef]
  7. Di Girolamo, G.; Brentari, A.; Blasi, C.; Serra, E. Microstructure and mechanical properties of plasma sprayed alumina-based coatings. Ceram. Int. 2014, 40, 12861–12867. [Google Scholar] [CrossRef]
  8. Rudolph, M.; Motylenko, M.; Rafaja, D. Structure model of γ-Al2O3 based on planar defects. IUCrJ 2019, 6, 116–127. [Google Scholar] [CrossRef]
  9. Levin, I.; Brandon, D. Metastable Alumina Polymorphs: Crystal Structures and Transition Sequences. J. Am. Ceram. Soc. 1998, 81, 1995–2012. [Google Scholar] [CrossRef]
  10. Paglia, G.; Božin, E.S.; Billinge, S.J. Fine-Scale Nanostructure in γ-Al2O3. Chem. Mater. 2006, 18, 3242–3248. [Google Scholar] [CrossRef]
  11. Pardo, P.; Alarcón, J. Thermal stability of transition alumina nanocrystals with different microstructures. Ceram. Int. 2018, 44, 11486–11496. [Google Scholar] [CrossRef]
  12. Deng, L.; Han, S.; Zhou, D.; Li, Y.; Shen, W. Morphology dependent effect of γ-Al2O3 for ethanol dehydration: Nanorods and nanosheets. CrystEngComm 2022, 24, 796–804. [Google Scholar] [CrossRef]
  13. Feng, H.; Wang, H.; Ma, Z.; Wang, S.; Li, P. Quantification of surface orientation effect on the thermal stability of γ-Al2O3 with different morphologies. Appl. Surf. Sci. 2022, 594, 153509. [Google Scholar] [CrossRef]
  14. Bolelli, G.; Cannillo, V.; Gadow, R.; Killinger, A.; Lusvarghi, L.; Manfredini, T.; Müller, P. Properties of Al2O3 coatings by High Velocity Suspension Flame Spraying (HVSFS): Effects of injection systems and torch design. Surf. Coat. Technol. 2015, 270, 175–189. [Google Scholar] [CrossRef]
  15. Rudolph, M.; Salomon, A.; Schmidt, A.; Motylenko, M.; Zienert, T.; Stöcker, H.; Himcinschi, C.; Amirkhanyan, L.; Kortus, J.; Aneziris, C.G.; et al. Thermally Induced Formation of Transition Aluminas from Boehmite. Adv. Eng. Mater. 2017, 19, 1700141. [Google Scholar] [CrossRef]
  16. Wilson, S.; Mc Connell, J. A kinetic study of the system γ-AlOOH/Al2O3. J. Solid State Chem. 1980, 34, 315–322. [Google Scholar] [CrossRef]
  17. Kovarik, L.; Bowden, M.; Shi, D.; Washton, N.M.; Andersen, A.; Hu, J.Z.; Lee, J.; Szanyi, J.; Kwak, J.h.; Peden, C.H. Unraveling the Origin of Structural Disorder in High Temperature Transition Al2O3: Structure of θ-Al2O3. Chem. Mater. 2015, 27, 7042–7049. [Google Scholar] [CrossRef]
  18. Pecharromán, C.; Sobrados, I.; Iglesias, J.; González-Carreño, T.; Sanz, J. Thermal Evolution of Transitional Aluminas Followed by NMR and IR Spectroscopies. J. Phys. Chem. B 1999, 103, 6160–6170. [Google Scholar] [CrossRef]
  19. Xu, S.; Jaegers, N.R.; Hu, W.; Kwak, J.H.; Bao, X.; Sun, J.; Wang, Y.; Hu, J.Z. High-Field One-Dimensional and Two-Dimensional 27Al Magic-Angle Spinning Nuclear Magnetic Resonance Study of θ-, δ-, and γ-Al2O3 Dominated Aluminum Oxides: Toward Understanding the Al Sites in γ-Al2O3. ACS Omega 2021, 6, 4090–4099. [Google Scholar] [CrossRef]
  20. Shirasuka, K.; Yanagida, H.; Yamaguchi, G. The Preparation of η Alumina and its Structure. J. Ceram. Assoc. 1976, 84, 610–613. [Google Scholar] [CrossRef]
  21. Paglia, G.; Rohl, A.L.; Buckley, C.E.; Gale, J.D. Determination of the structure of γ-Alumina from interatomic potential and first-principles calculations: The requirement of significant numbers of nonspinel positions to achieve an accurate structural model. Phys. Rev. B 2005, 71, 224115. [Google Scholar] [CrossRef]
  22. Samain, L.; Jaworski, A.; Edén, M.; Ladd, D.M.; Seo, D.K.; Javier Garcia-Garcia, F.; Häussermann, U. Structural analysis of highly porous γ-Al2O3. J. Solid State Chem. 2014, 217, 1–8. [Google Scholar] [CrossRef]
  23. Paglia, G.; Buckley, C.E.; Rohl, A.L.; Hart, R.D.; Winter, K.; Studer, A.J.; Hunter, B.A.; Hanna, J.V. Boehmite Derived γ-Alumina System. 1. Structural Evolution with Temperature, with the Identification and Structural Determination of a New Transition Phase, γ‘-Alumina. Chem. Mater. 2004, 16, 220–236. [Google Scholar] [CrossRef]
  24. Luo, Z. Structure of boehmite-derived γ-Alumina and its transformation mechanism revealed by electron crystallography. Acta Crystallogr. Sect. B 2021, 77, 772–784. [Google Scholar] [CrossRef]
  25. Kovarik, L.; Bowden, M.; Genc, A.; Szanyi, J.; Peden, C.H.; Kwak, J.H. Structure of δ-Alumina: Toward the Atomic Level Understanding of Transition Alumina Phases. J. Phys. Chem. C 2014, 118, 18051–18058. [Google Scholar] [CrossRef]
  26. Kovarik, L.; Bowden, M.; Shi, D.; Szanyi, J.; Peden, C.H. Structural Intergrowth in θ-Al2O3. J. Phys. Chem. C 2019, 123, 9454–9460. [Google Scholar] [CrossRef]
  27. Kovarik, L.; Bowden, M.; Andersen, A.; Jaegers, N.R.; Washton, N.; Szanyi, J. Quantification of High-Temperature Transition Al2O3 and Their Phase Transformations. Angew. Chem. Int. Ed. 2020, 59, 21719–21727. [Google Scholar] [CrossRef] [PubMed]
  28. Zienert, T.; Endler, D.; Hubálková, J.; Eusterholz, M.; Boll, T.; Heilmaier, M.; Günay, G.; Weidner, A.; Biermann, H.; Kraft, B.; et al. Coarse-grained refractory composite castables based on alumina and niobium. Adv. Eng. Mater. 2022, 24, 2200296. [Google Scholar] [CrossRef]
  29. Günay, G.; Zienert, T.; Endler, D.; Aneziris, C.G.; Biermann, H.; Weidner, A. High-temperature compressive behavior of refractory alumina-niobium composite material. Adv. Eng. Mater. 2022, 24, 2200292. [Google Scholar] [CrossRef]
  30. Kraft, B.; Wagner, S.; Hoffmann, M.J. Field Assisted Sintering of Nb-Al2O3 Composite Materials and Investigation of Electrical Conductivity. Adv. Eng. Mater. 2022, 24, 202200063. [Google Scholar] [CrossRef]
  31. Zienert, T.; Farhani, M.; Dudczig, S.; Aneziris, C.G. Coarse-grained refractory composites based on Nb-Al2O3 and Ta-Al2O3 castables. Ceram. Int. 2018, 44, 16809–16818. [Google Scholar] [CrossRef]
  32. Aneziris, C.G.; Gehre, P.; Kratschmer, T.; Berek, H. Thermal Shock Behavior of Flame-Sprayed Free-Standing Coatings Based on Al2O3 with TiO2- and ZrO2-Additions. Int. J. Appl. Ceram. Technol. 2011, 8, 953–964. [Google Scholar] [CrossRef]
  33. Maslen, E.; Streltsov, V.; Streltsova, N.; Ishizawa, N.; Satow, Y. Synchrotron X-ray study of the electron density in α-Al2O3. Acta Crystallogr. Sect. B 1993, 49, 973–980. [Google Scholar] [CrossRef]
  34. Husson, E. Structural studies of transition aluminas. Theta alumina. Eur. J. Solid State Inorg. Chem. 1996, 33, 1223–1231. [Google Scholar]
  35. Gutiérrez, G.; Taga, A.; Johansson, B. Theoretical structure determination of γ-Al2O3. Phys. Rev. B 2001, 65, 012101. [Google Scholar] [CrossRef]
  36. Kirby, R.K.; Hahn, T.A.; Rothrock, B.D. American Institute of Physics Handbook—4f: Thermal Expansion, 3rd ed.; McGraw-Hill Book Company: New York, NY, USA, 1972. [Google Scholar]
  37. Campbell, W.J.; Grain, C. Thermal Expansion of Alpha-Alumina. Adv. X-ray Anal. 1961, 5, 244–256. [Google Scholar] [CrossRef]
  38. Kudielka, H. Die thermische Ausdehnung der isotypen Mischreihen-Endglieder Cr2O3 und α-Al2O3, ermittelt mit einer neuen, lichtstarken Seemann-Bohlin-Kammer. Monatshefte Chem. 1972, 103, 72–80. [Google Scholar] [CrossRef]
  39. Yim, W.; Paff, R. Thermal expansion of AlN, sapphire, and silicon. J. Appl. Phys. 1974, 45, 1456–1457. [Google Scholar] [CrossRef]
  40. Chikh, H.; Si-Ahmed, F.; Afir, A.; Pialoux, A. In-situ X-ray Diffraction Study of Alumina α-Al2O3 Thermal Behavior. Int. J. Recent Dev. Eng. Technol. 2014, 3, 137–143. [Google Scholar]
  41. Tonejc, A.; Kosanović, C.; Stubićar, M.; Tonejc, A.; Subotić, B.; Smit, I. Equivalence of ball milling and thermal treatment for phase transitions in the Al2O3 system. J. Alloys Compd. 1994, 204, L1–L3. [Google Scholar] [CrossRef]
  42. Bodaghi, M.; Mirhabibi, A.; Zolfonun, H.; Tahriri, M.; Karimi, M. Investigation of phase transition of γ-Alumina to α-Alumina via mechanical milling method. Phase Transit. 2008, 81, 571–580. [Google Scholar] [CrossRef]
  43. Kozawa, T.; Naito, M. Mechanically induced formation of metastable χ- and κ-Al2O3 from boehmite. Adv. Powder Technol. 2016, 27, 935–939. [Google Scholar] [CrossRef]
  44. Daraio, D.; Villoria, J.; Ingram, A.; Alexiadis, A.; Stitt, E.H.; Munnoch, A.L.; Marigo, M. Using Discrete Element method (DEM) simulations to reveal the differences in the γ-Al2O3 α-Al2O3 mechanically induced phase transformation between a planetary ball mill and an attritor mill. Miner. Eng. 2020, 155, 106374. [Google Scholar] [CrossRef]
Figure 1. Determined XRD pattern of the as-sprayed material at 1000 °C showing the reflections of η -, δ 1 - and α -Al 2 O 3 .
Crystals 13 00743 g001
Figure 2. Determined XRD pattern of the as-sprayed material at 1200 °C showing the reflections of θ -, δ 1 - and α -Al 2 O 3 .
Crystals 13 00743 g002
Figure 3. Determined trend of the phase composition with temperature of the as-sprayed sample.
Crystals 13 00743 g003
Figure 4. Calculated (a) ratios of the cell volumes (per formula unit of Al 2 O 3 ) for η -Al 2 O 3 : δ 1 -Al 2 O 3 and η -Al 2 O 3 : α -Al 2 O 3 and (b) maximum transition rate of the η δ 1 reaction induced by the thermal expansion of δ 1 - and α -Al 2 O 3 .
Crystals 13 00743 g004
Figure 5. The trend of the lattice parameters (ac) of δ 1 -Al 2 O 3 with temperature for the as-sprayed sample and for the ones annealed at 1000 °C and 1100 °C, respectively.
Crystals 13 00743 g005
Figure 6. Determined molar volumes of δ 1 -Al 2 O 3 measured at 600 °C for the isothermally held samples in comparison to the value of the as-sprayed material obtained during the thermal expansion experiment.
Crystals 13 00743 g006
Figure 7. Determined trends of the phase assemblages with time for the samples annealed at (a) 1000 °C and (b) 1100 °C.
Crystals 13 00743 g007
Figure 8. Thermal expansion of α -Al 2 O 3 : (a) determined volumes of the elemental cell in comparison to the literature (Campbell and Grain (1961) [37], Kudielka (1972) [38], Yim and Paff (1974) [39] and Chikh et al. (2014) [40]) and (b) the derived thermal expansion coefficients of the as-sprayed and annealed samples in comparison to reference data from Kirby et al. (1972) [36].
Crystals 13 00743 g008
Figure 9. Determined thermal expansion coefficents of (a) for δ 1 -Al 2 O 3 for the as-sprayed and the annealed states and (b) for the as-sprayed η -Al 2 O 3 .
Crystals 13 00743 g009
Figure 10. Determined amounts of δ 1 -Al 2 O 3 for the as-sprayed sample and for the ones annealed at 1000 °C and 1100 °C, respectively.
Crystals 13 00743 g010
Figure 11. Determined densities of the metastable aluminas present in the as-sprayed sample.
Crystals 13 00743 g011
Table 1. Determined transition rates of the metastable aluminas from the as-sprayed sample.
PhaseTemperature Range: Transition Rate in vol.%/K
η -Al 2 O 3 30–900 °C: −0.0089900–1125 °C: −0.1505
δ 1 -Al 2 O 3 30–900 °C: 0.0091900–1025 °C: 0.12041125–1200 °C: −0.2817
θ -Al 2 O 3 1025–1200 °C: 0.1756
Disclaimer/Publisher’s Note: The statements, opinions and data contained in all publications are solely those of the individual author(s) and contributor(s) and not of MDPI and/or the editor(s). MDPI and/or the editor(s) disclaim responsibility for any injury to people or property resulting from any ideas, methods, instructions or products referred to in the content.

