Article

Optimizing Struvite Crystallization at High Stirring Rates

1
College of Sciences, King Khalid University (KKU), P.O. Box 960, Abha 61421, Saudi Arabia
2
LVMU, Centre National de Recherches en Sciences des Matériaux, Technopole de Borj-Cédria, BP 73, Soliman 8027, Tunisia
3
Centre de Recherches et Technologies des Eaux, Technopole Borj-Cédria, BP 273, Route Touristique de Soliman, Nabeul 8020, Tunisia
*
Author to whom correspondence should be addressed.
Crystals 2023, 13(4), 711; https://doi.org/10.3390/cryst13040711
Submission received: 26 March 2023 / Revised: 18 April 2023 / Accepted: 19 April 2023 / Published: 21 April 2023
(This article belongs to the Special Issue Crystallization Process and Simulation Calculation)

Abstract

:
Phosphorus and ammonium can both be recovered in the presence of magnesium through struvite (MgNH4PO4·6H2O) crystallization. The present work aimed to optimize struvite crystallization at turbulent solution flow. Struvite was crystallized by magnetic stirring at different initial phosphorus concentrations between 200 and 800 mg·L−1 and high stirring rates between 100 and 700 rpm. The crystals obtained were analyzed by powder X-ray diffraction, Fourier-transform infrared spectroscopy, and scanning electron microscopy. For all experiments, the only phase detected was struvite. It was shown that for an initial phosphorus concentration of 200 mg·L−1, increasing the stirring rate to 500 rpm accelerated the precipitation of struvite, improved the phosphorus removal efficiency, and obtained larger struvite crystals. A decrease in the phosphorus removal efficiency and smaller struvite crystals were obtained at higher stirring rates. This was attributed to the solution turbulence. The limiting effect of turbulence could be overcome by enhancing the initial phosphorus concentration or by lowering the stirring rate. The highest phosphorus removal efficiency (~99%) through large struvite crystals (~400 μm in size) was obtained for an initial phosphorus concentration of 800 mg·L−1 and a stirring rate of 100 rpm.

1. Introduction

The world’s surface is covered by water to a great extent, most of it in the oceans. Only 3% of this water is fresh, of which only ~0.5% is available [1]. The rest (2.5%) is locked up in glaciers and soil or is too deep below the earth’s surface to be easily extracted at an affordable cost. Unfortunately, freshwater can be polluted by industrial effluents, animal discharges, and chemical fertilizers. Phosphorus and nitrogen are two of the main nutrients found in water. Their presence in high concentrations pollutes the water and caused eutrophication. For this reason, their recycling has gained importance, especially since the European legislation against water pollution has imposed a phosphorus concentration below 2 mg·L−1 [2]. Phosphorus and nitrogen can be simultaneously recycled, in a basic medium and in the presence of magnesium, through the crystallization of a sparingly soluble salt, struvite (MgNH4PO4·6H2O). This prevents eutrophication and varies phosphate resources. Struvite is recognized as a valuable fertilizer [3]. Recently, it was shown that struvite could be used effectively as a fire-extinguishing agent [4]. For these reasons, struvite crystallization from synthetic solutions and real wastewater has been intensively studied [5,6,7,8].
The control of both the nucleation and growth of struvite crystals is difficult because they depend on various physical and chemical parameters such as ion transfer between the liquid and solid phases, reaction kinetics, temperature, supersaturation, pH of the solution, concentrations of struvite constituent ions, foreign ions (Ca2+, Fe2+, Cu2+, and others), and flow turbulence. The optimal temperature reported in the literature for struvite crystallization was in the range of 15–30 °C [9,10]. Indeed, higher temperatures decreased the struvite solubility and affected both its morphology and purity [11]. The precipitation pH used was in the range of 8–11 [9,10,12]. That is, alkaline solutions promoted struvite crystallization.
At a given phosphate concentration, enhancing the magnesium concentration in the solution lowered the struvite crystallization pH and considerably increased the effectiveness of phosphate and ammonium removal [13]. Depending on the added concentration, the addition of phosphate to the solution at a fixed magnesium concentration can either delay or entirely inhibit struvite crystallization [13]. An increase in magnesium or phosphate concentration affected the struvite crystals’ purity, shape, and size. However, adding ammonium in excess to the solution favored struvite crystallization without affecting the purity of the obtained struvite crystals [13]. Jaffer et al. [14] showed that struvite crystallization occurred at a sewage treatment plant when the molar ratio of Mg:P was at least 1.05:1 and for lower ratios, phosphorus removal decreased but not exclusively as struvite. Kruk et al. [15] studied the crystallization of struvite from the supernatant of fermented waste-activated sludge using magnesium sacrificial anode at N:P molar ratios between 1.98 and 2.05. They found that up to 98% of soluble phosphorus was recovered through struvite crystallization. Korchef et al. [13] demonstrated that there was no optimal value for the Mg:P:N ratio for struvite crystallization that could be considered independently of the initial constituent ions concentrations, but it should be adjusted with respect to the initial phosphate, ammonium, and magnesium concentrations and operating parameters.
The presence of foreign ions in the solution such as the ions of calcium [16], copper [16,17], zinc [17], iron [18], aluminum [18,19], cadmium [19], and nickel [20], among other ions, affected the ammonium and phosphate recovery and limited struvite crystallization. Indeed, these ions can be incorporated with struvite, adsorbed on struvite surfaces, or precipitated as separated phases. Unlike heavy metal ions, the presence of phenolic organics enhanced the struvite crystallization rate [21].
Different techniques, such as stirring [22,23], CO2 repelling [24,25], electrochemical deposition [26], and ion exchange [27], have been used to precipitate struvite from synthetic solutions and real wastewater. In this work, struvite was precipitated by magnetic stirring. It was shown that stirring strongly affected struvite crystallization. Indeed, increasing the stirring rate affected the mass transfer between the solution and the struvite crystals and enhanced the struvite crystal growth rate [28]. Capdevielle et al. [22] found that more than 90% of phosphorus was recovered through large struvite crystals at a high N:P ratio of 3:1 and moderate stirring rates between 45 and 90 rpm. Perera et al. [29] studied the precipitation of struvite in a stainless steel reactor at pH 9, and a N:P:Mg molar ratio equal to 1:1.2:1.2. They found that stirring at 50 rpm did not allow sufficient mixing, thus affecting the struvite growth. They found that the removal efficiencies of nitrogen and phosphate were 97% and 71%, respectively, for a stirring rate of 500 rpm. Xu et al. [30] investigated the effect of stirring on laboratory-scale recovery of phosphorus and potassium from urine. They showed that for stirring rates between 100 and 200 rpm, 68% of the phosphorus was recovered in the form of struvite and 76% of the potassium in the form of K-struvite (MgKPO4∙6H2O). Zhang et al. [31] investigated the effect of stirring and experiment time on struvite crystallization from swine wastewater as pretreatment to anaerobic digestion. They found that 38% and 44% of ammonium were recovered after 10 min at stirring rates of 160 and 400 rpm, respectively, and with increasing the reaction time no remarkable changes in the recovered amounts were observed. The optimal operating conditions for struvite crystallization were a P:Mg:N molar ratio of 1:1:1.2, pH = 10, and initially stirring at 400 rpm for 10 min and then stirring for 30 min at 160 rpm. From an experimental point of view, the precipitation of struvite under magnetic stirring is one of the easiest methods to implement on a laboratory scale. It requires space-saving equipment whose price remains reasonable. It saves consumables and time on the preparation and progress of manipulations.
The present work aimed to investigate struvite crystallization at turbulent solution flow caused by magnetic stirring. It is not unfounded to expect that the effect of turbulence due to high stirring rates on struvite crystallization can be overcome by controlling the solution volume or the concentrations of the struvite constituent ions. For this reason, the effect of stirring at a fixed volume and initial phosphorus concentration was first investigated. Then, the effect of the solution volume on the crystallization of struvite at a fixed initial phosphorus concentration and stirring rate was investigated. Finally, the effect of the initial phosphorus concentration on struvite crystallization was studied at a fixed stirring rate and solution volume. Phosphorus concentration and solution pH were monitored over time. Struvite crystals were examined by powder X-ray diffraction (XRD), and Fourier-transform infrared (FTIR) spectroscopy. Their morphology was observed by scanning electron microscopy (SEM).

2. Materials and Methods

The crystallization of struvite (MgPO4NH4∙6H2O) was carried out by magnetic stirring (with an HI 190 stirrer, Hanna Instruments, Woonsocket, RI, USA) in a cylindrical 2 L Pyrex cell. The working solutions were prepared by mixing two solutions of magnesium chloride hexahydrate (MgCl2·6H2O) and ammonium dihydrogen phosphate (NH4H2PO4) in distilled water. The solutions of NH4H2PO4 and MgCl2·6H2O were prepared by dissolving the corresponding solids NH4H2PO4 (purity > 99%, Sigma Aldrich, Burlington, MA, USA) and MgCl2·6H2O (purity > 99%, Fluka, Charlotte, NC, USA) in distilled water. Tablets of NaOH (>99% purity, Sigma Aldrich) were dissolved in distilled water to obtain 1 M NaOH solution. This alkaline solution was used to adjust the initial pH of the working solution to the desired value. For all experiments, the molar ratio of Mg:P:N was set at 1:1:1 corresponding to struvite (MgNH4PO4·6H2O) solid. The solution temperature was fixed at 25 °C using a thermostat with circulating water. The solution pH was monitored using a pH meter (pH 213, Hanna Instruments, USA) with a combination glass/Ag/AgCl electrode after calibration with commercially available standard buffer solutions from Biopharm at pH 4, 7, and 10. Each experiment was performed at least four times for reproducibility, and the mean values are reported in the present work. The error on the reported values was less than 5%.
To study the effect of stirring on struvite precipitation, four series of experiments were performed. All the experiments performed in the present work aimed to optimize the crystallization of struvite at high stirring rates. In the first series of experiments, the stirring rate varied between 100 and 700 rpm (100, 300, 500, and 700 rpm), the initial solution pH was adjusted to 8, the initial phosphorus concentration was 200 mg·L−1 (6.45 mM) and the solution volumes were 600 and 1200 mL. In the second series of experiments, the initial phosphorus concentration was assessed at 600 mg·L−1 (19.35 mM) and the initial pH, the stirring rate, and the solution volume were assessed as those of the first series of experiments. The third series of experiments was performed at different solution volumes between 600 and 1200 mL, a stirring rate of 700 rpm, an initial solution pH of 8, and an initial phosphorus concentration of 200 mg·L−1. The increase in the solution volume was expected to lower the flow turbulence caused by stirring and favor struvite precipitation. Finally, a series of experiments was set at initial phosphorus concentrations ranging from 200 to 800 mg·L−1. The increase in the constituent ion concentrations may overcome the effect of turbulence on struvite crystallization. For this series of experiments, the stirring rate was set at 700 rpm, the initial pH at 8, and the volume of the solution at 600 mL.
During each experiment performed in this work, periodic samples of 1 mL were withdrawn from the solution and then filtered through a 0.45 µm membrane filter. Next, the concentration of phosphorus was determined photochemically by a HACH DR/4000 spectrophotometer. At the end of each experiment, the solution was filtered using a 0.45 µm membrane filter. The recovered precipitates were dried at room temperature and analyzed by XRD, SEM, and FTIR spectroscopy. XRD was carried out at room temperature using a Philips X’PERT PRO diffractometer in step scanning mode using Cu-Kα radiation. The XRD patterns were recorded in the scanning range 2θ = 10–70° using a small angular step of 2θ = 0.017° and a fixed counting time of 4 s. The positions of the XRD reflections were determined using ‘X-Pert HighScore Plus’ software, Version 2.1. The XRD patterns of the collected precipitates were compared with the Joint Committee on Powder Diffraction Standards data. The FTIR spectra were recorded between 400 and 4000 cm−1 (Shimadzu IRAffinity-1) using pressed powder samples in KBr medium. The size of particles was measured using a Mastersizer 2000 (Version 6.01, Malvern Instruments, Malvern, UK) combined with a Hydro 2000 MU.

3. Results

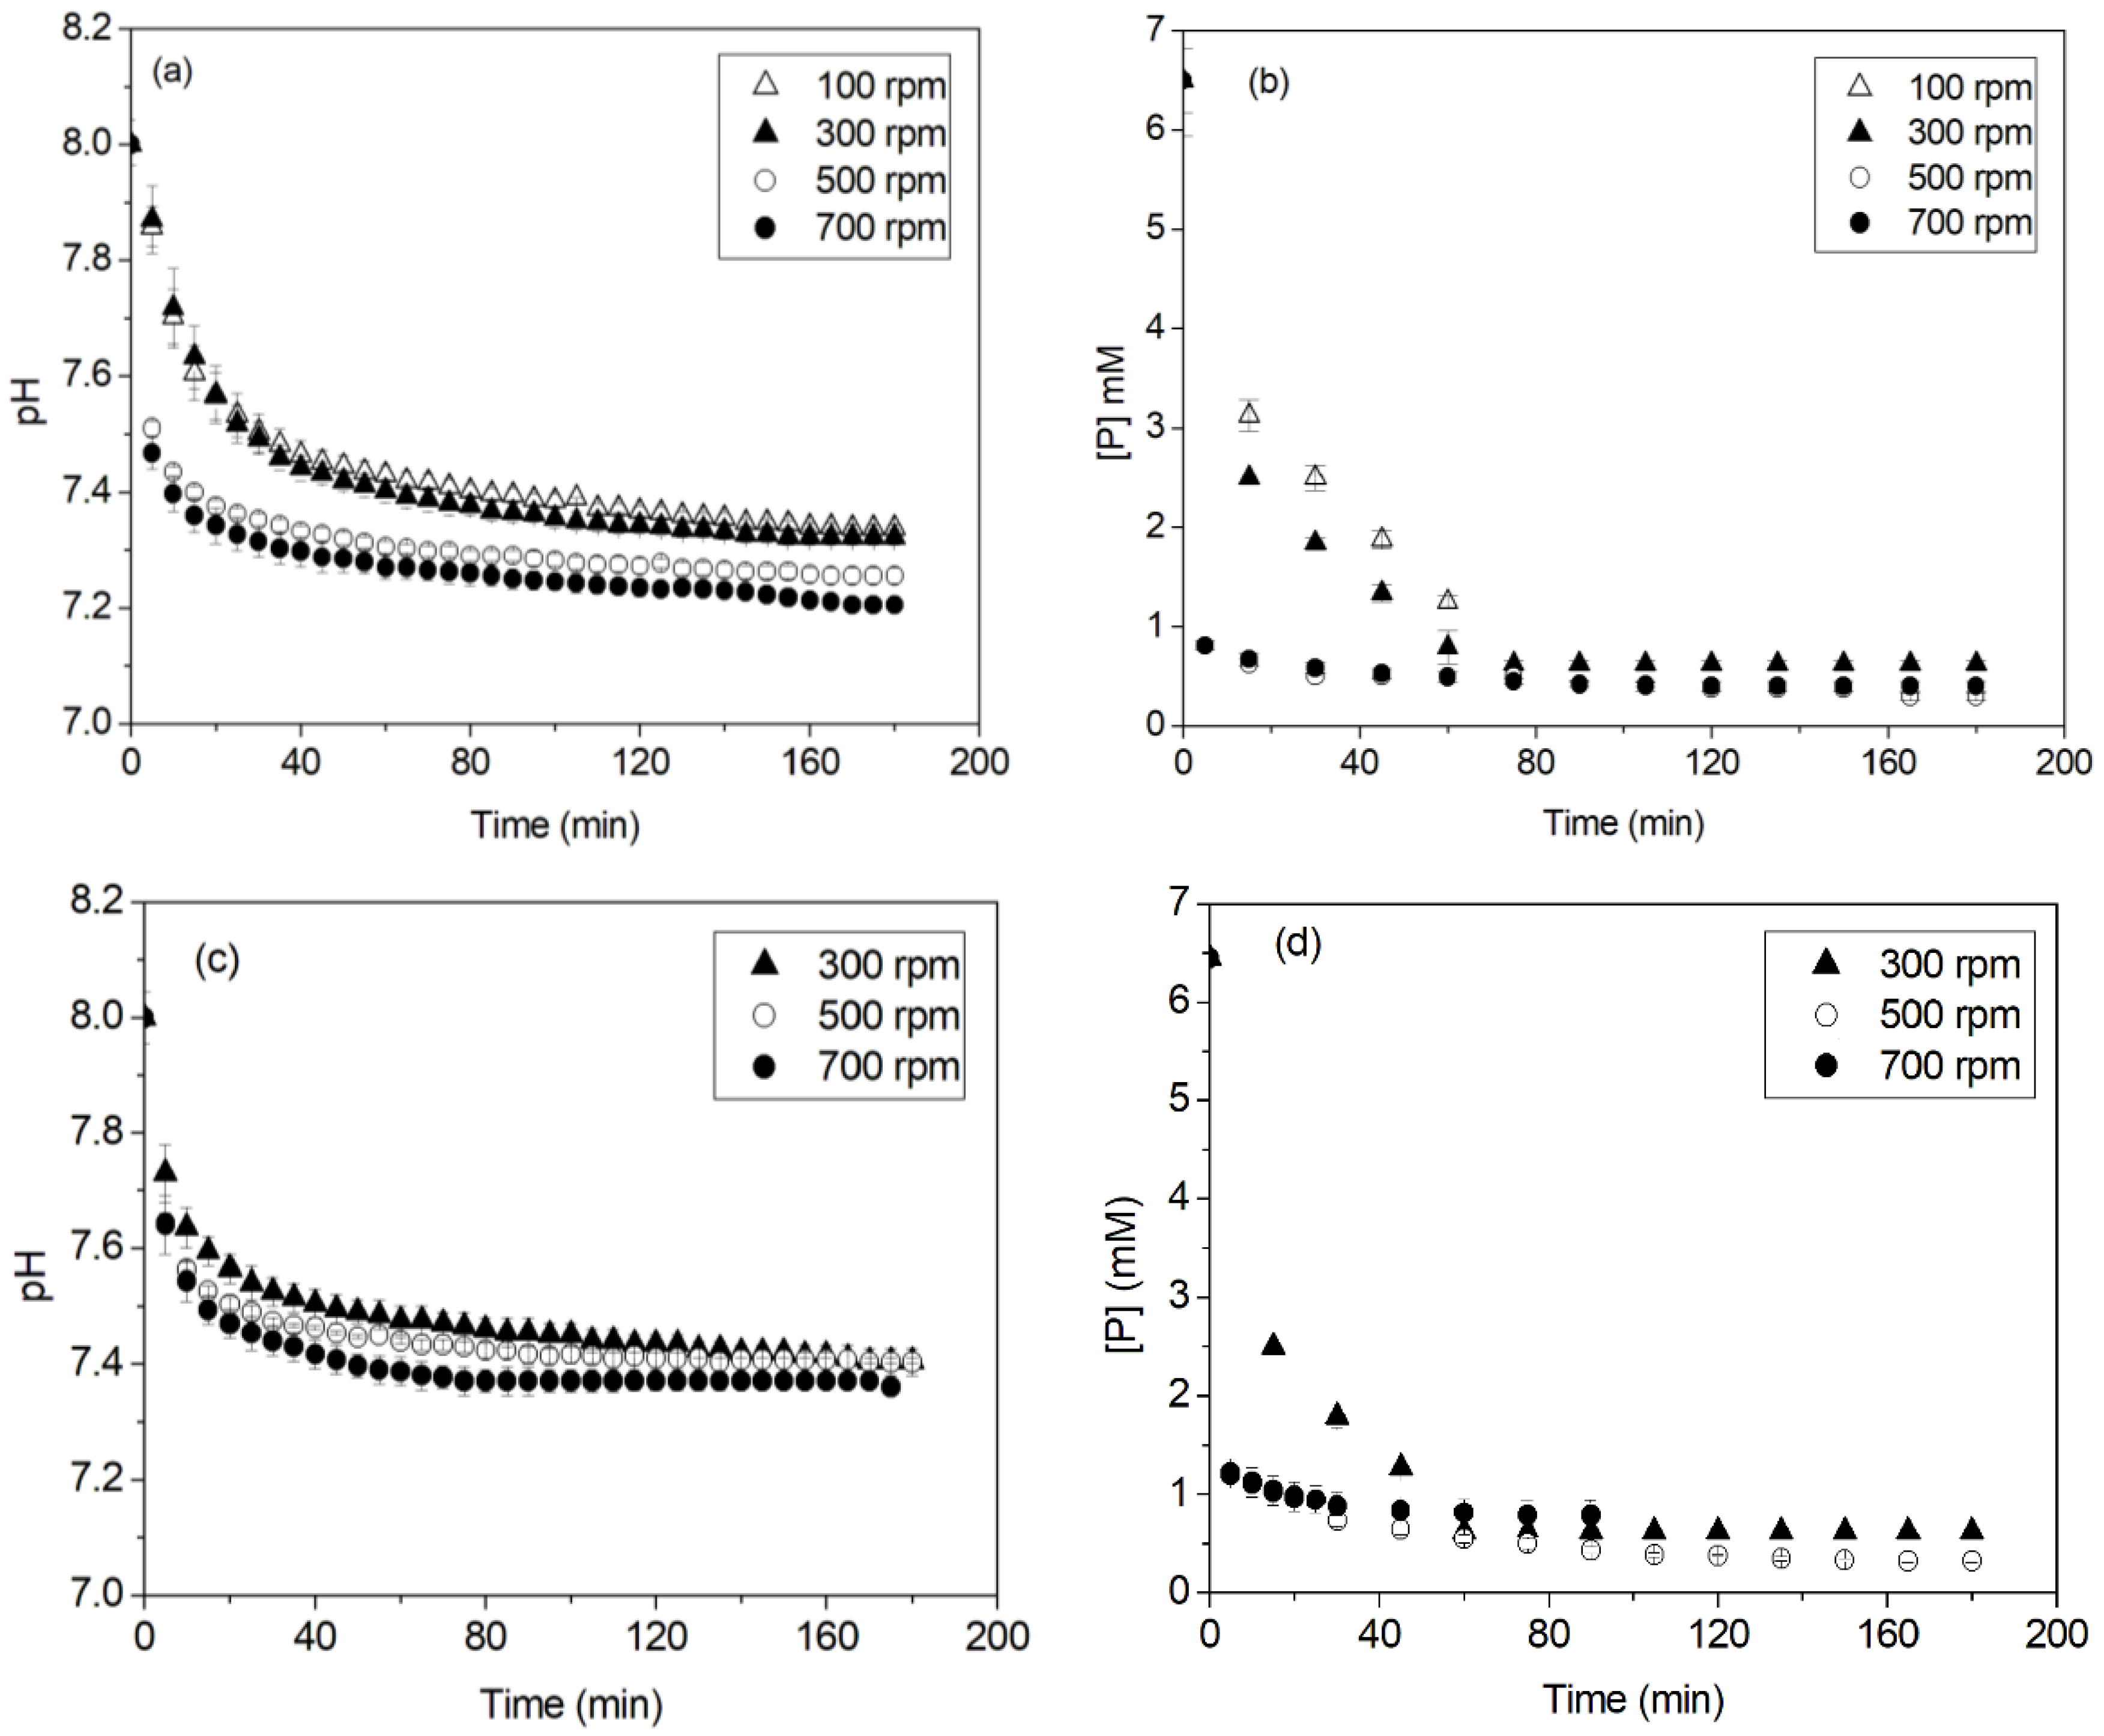
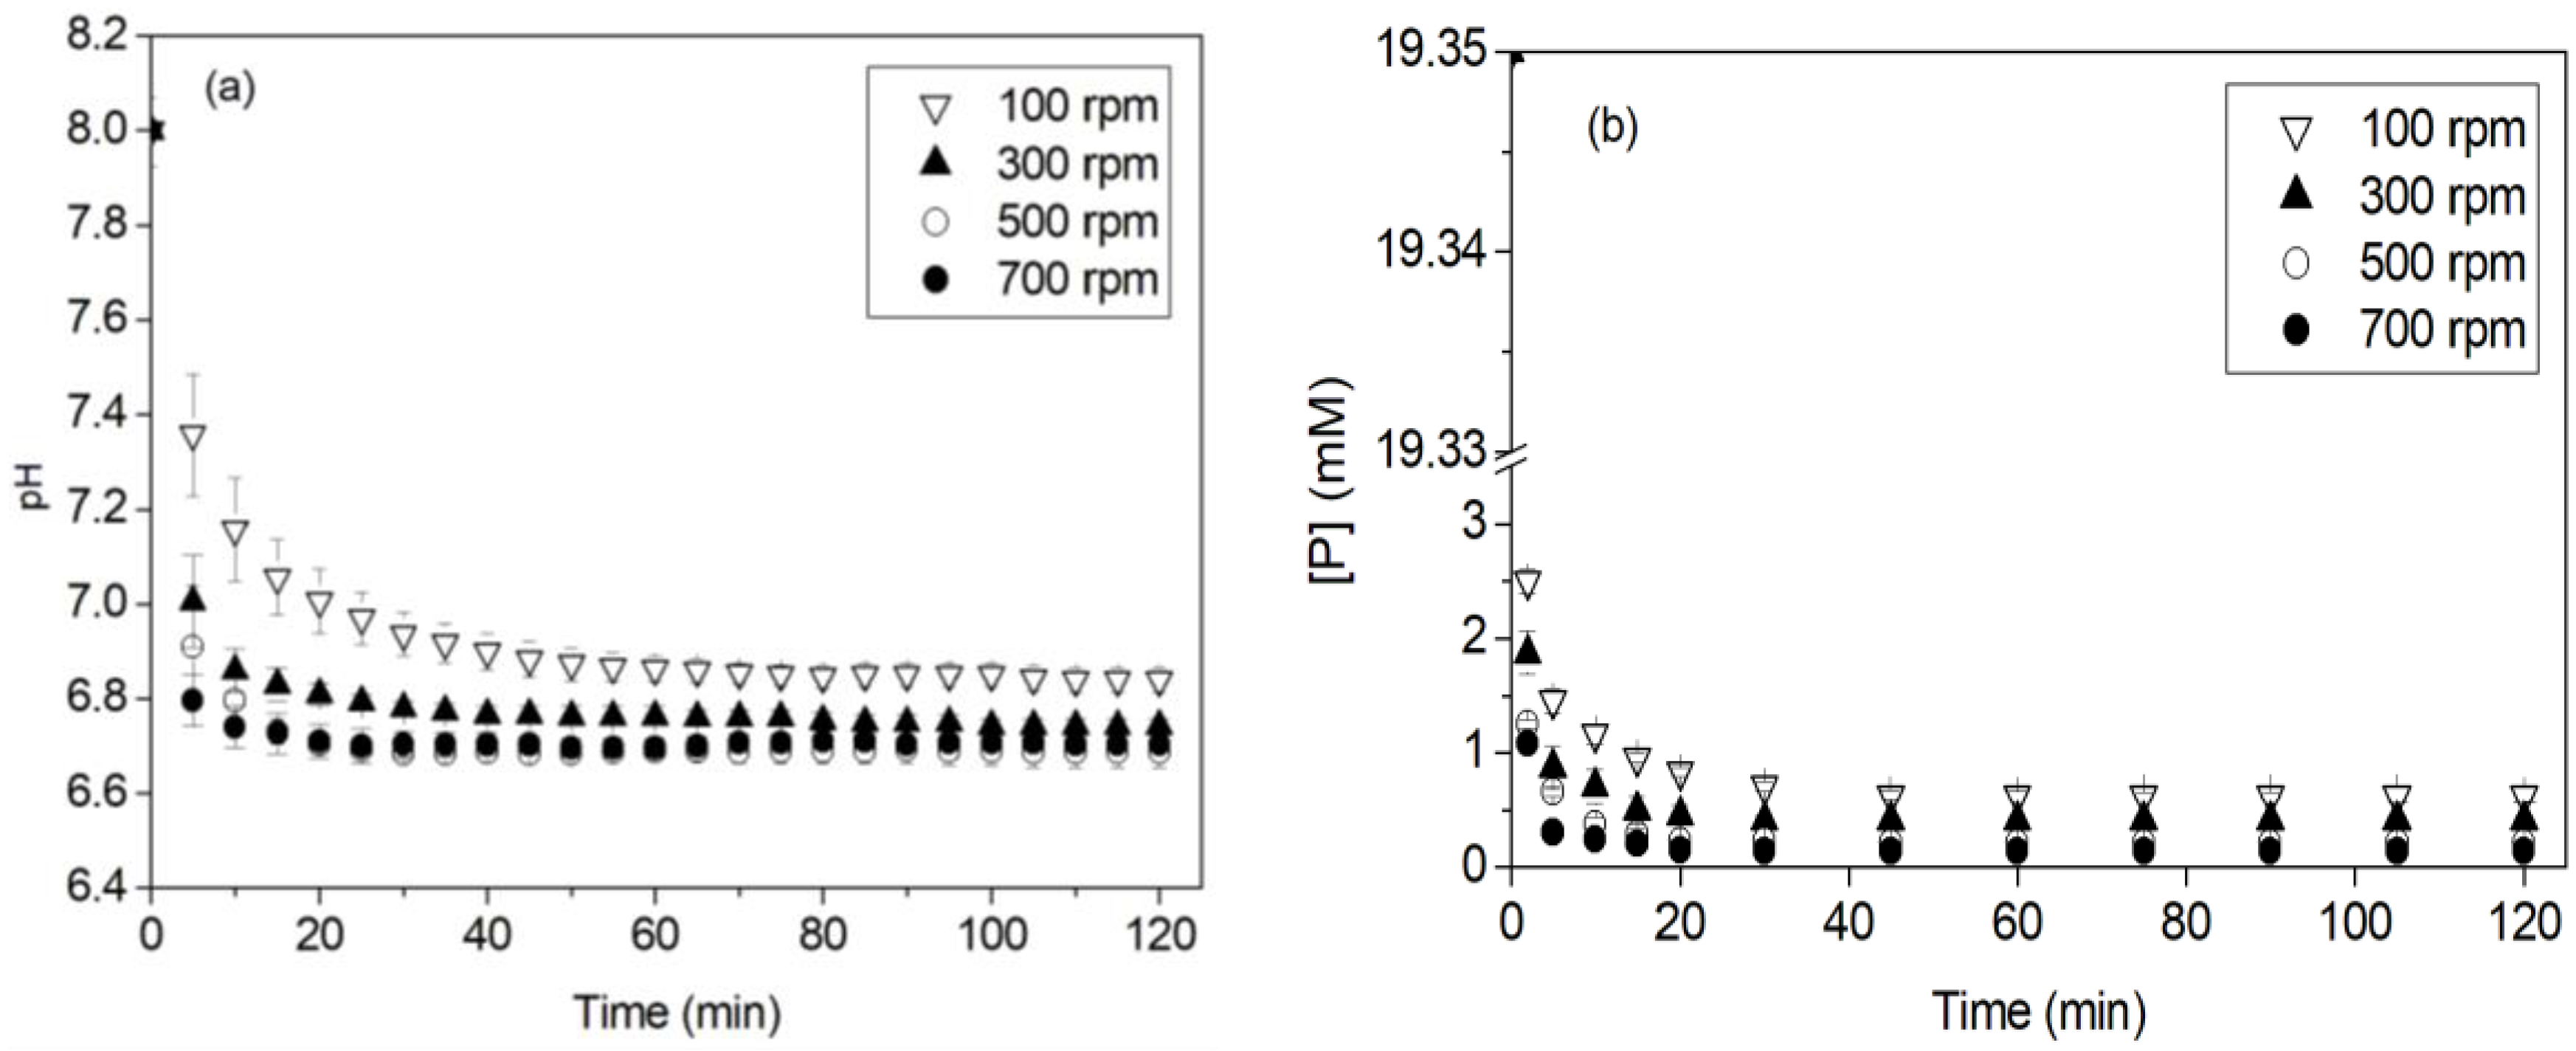
3.1. Effect of Stirring

For all the experiments carried out in the present work, the precipitated phase observed was struvite. A typical X-ray diffractogram and FTIR spectrum of the precipitates obtained are given in Figure 1a,b, respectively. The XRD pattern (Figure 1a) showed that the characteristic reflections of the obtained precipitates were comparable to those of the pattern for the struvite standard (JCPDS 15-0762) [32]. The FTIR spectrum (Figure 1b) presented the characteristic band of PO43− located at 1005 cm1 and the characteristic band of NH4+ located at 2933 cm1. Comparable struvite spectra were reported by Korchef et al. [13] and Zhang et al. [33]. The following absorption bands were also observed: a large band between 3600 and 2270 cm1 corresponding to O-H and N-H stretching vibrations, a low-intensity band located at 1660 cm1 attributed to H-O-H bending modes, which indicates water of crystallization, and a band at 1432 cm1 attributed to the asymmetric bending vibration of N-H in NH4+. The bands detected between 1005 and 456 cm1 are characteristics of the ion PO43−, where the wide low-intensity band at 1005 cm1 was associated with the asymmetric bending vibration of PO43−, the weak band at 870 cm1 was attributed to the vibration of coordinated water, the band at 566 cm1 was associated with the asymmetric bending modes of PO43−, and the band at 456 cm1 was attributed to the symmetric bending vibration of PO43 units. SEM analysis confirmed the results obtained by XRD and FTIR spectroscopy and showed precipitates with the typical prismatic pattern characteristic of struvite crystals (Figure 2).
Figure 3 illustrates the changes in pH and phosphorus concentration over time at varied stirring rates between 100 and 700 rpm for an initial phosphorus concentration of 200 mg·L1 and solution volumes of 600 and 1200 mL. For all experiments performed, the pH decreased over time, and then from a certain time (depicted herein as the end of precipitation time), it remained practically constant (Figure 3a). Concomitantly, a decrease in phosphorus concentration was observed, followed by a plateau (Figure 3b). The higher the stirring rate was, the lower the concentration obtained at the end of the precipitation. The decrease in pH and phosphorus concentration over time was due to struvite precipitation according to the following reaction [34]:
M g 2 + + N H 4 + + H n P O 4 n 3 + 6 H 2 O M g N H 4 P O 4 · 6 H 2 O + n H +
where n = 0, 1, and 2 depending on the solution pH and the initial phosphorus concentration.
The constant values of pH and phosphorus concentration for advanced reaction times indicated the end of precipitation. The precipitation of struvite occurred as soon as the solution pH was adjusted to 8, and it was manifested by a significant decrease in phosphorus concentration and pH in the first minutes. Comparable results were found when struvite precipitated from pig manure in an anaerobic digester [35]. At the end of precipitation, the solution pH reached values between 7.2 and 7.4 for all experiments. This agreed with the results of Stratful et al. [36], who observed that at a pH equal to 7, no precipitation of struvite occurred, and at a slightly higher pH of 7.5, only a small amount was recovered through very small crystals. Several studies on the effect of pH on struvite crystallization were reported in the literature, and it was depicted that pH affected the solubility of struvite. Indeed, it was found that for pH values between 8 and 10 the solubility of struvite significantly decreased, and the struvite crystallization rate increased [23,37,38,39].
The pH and phosphorus concentration values obtained over time for the stirring rates 100 and 300 rpm and a solution volume of 600 mL were comparable but slightly higher than those obtained for 500 and 700 rpm (Figure 3a,b). When the volume increased to 1200 mL, the curves showing the changes in pH (Figure 3c) and phosphorus concentration (Figure 3d) over time presented the same evolution trends as those for a volume of 600 mL.
Table 1 gives the precipitation end time (tf), the initial precipitation rate (Vi), and the phosphorus removal efficiency, R (%), obtained at different stirring rates and solution volumes of 600 and 1200 mL. The precipitation end time (tf) corresponded to the first point of stabilization of the phosphorus concentration after precipitation. The initial precipitation rate (Vi) was determined from the slope of the linear part of the time curve of phosphorus concentration for times less than tf. The phosphorus removal efficiency, R (%), was calculated using the following equation:
R % = C i C f C i × 100
where (Ci) and (Cf) are the initial and final phosphorus concentrations, respectively.
As the stirring rate increased, the precipitation end time (tf) decreased for both volumes used. For example, tf decreased from 75 to 45 min when the stirring rate increased from 100 to 700 rpm, respectively, for a solution volume of 600 mL (Table 1). For a given stirring rate, the precipitation end time obtained for a solution volume of 1200 mL was greater than that obtained for a solution volume of 600 mL. The highest precipitation end time (90 min) was obtained for a stirring rate of 500 rpm and a solution volume of 1200 mL (Table 1) where, in addition to precipitation in the bulk solution, a significant amount of struvite precipitated on the cell walls. The change in the precipitation nature (from precipitation in the bulk solution to precipitation on the cell walls) could be the cause of the increase in the precipitation end time at the stirring rate of 500 rpm and the solution volume of 1200 mL. By increasing the stirring rate to 700 rpm, precipitation occurred mainly in the bulk solution and the precipitation end time decreased to 45 min for both volumes used.
The initial precipitation rate (Vi) increased with the increase in the stirring rate for both solution volumes of 600 and 1200 mL. At 100 rpm and a solution volume of 600 mL, the initial precipitation rate Vi was equal to 0.22 mmol·L1.min1. The increase in the stirring rate to 500 rpm resulted in a slight increase in Vi to 0.36 mmol·L1·min1 (Table 1). A more pronounced increase in the initial precipitation rate was observed when the stirring rate increased to 700 rpm., i.e., it became approximately five times higher (Vi =1.13 mmol·L1.min1). Comparable results were found for a solution volume of 1200 mL. However, the acceleration of struvite precipitation was accompanied by a slight decrease in the phosphorus removal efficiency. Indeed, increasing the stirring rate from 100 to 500 rpm significantly improved the phosphorus removal efficiency, and comparable values were obtained for both solution volumes. For example, the phosphorus removal efficiency, at a solution volume of 600 mL, increased from ~90% to ~95% when the stirring rate increased from 100 to 500 rpm, respectively, and it decreased slightly to ~94% at a higher stirring rate of 700 rpm (Table 1). This decrease was more pronounced for a solution volume of 1200 mL where the removal efficiency of phosphorus reached ~89% at a stirring rate of 700 rpm. A detailed study of the effect of the solution volume on struvite precipitation is given herein.
To conclude, for an initial phosphorus concentration of 200 mg·L1, the optimal stirring rate (which gave the highest efficiency) was 500 rpm for both solution volumes of 600 and 1200 mL. Comparable results were depicted by Perera et al. [29], who found that magnetic stirring at 500 rpm gave the highest phosphorus removal through struvite crystallization from swine waste biogas digester effluent where the molar ratio of N:Mg:P was 1:1.2:1.2, the working volume was 3 L, and pH was equal to 9.
Figure 4 shows the variation in phosphorus concentration over time at stirring rates between 100 and 700 rpm, an initial phosphorus concentration of 600 mg·L1, and a solution volume of 600 mL. As soon as the initial pH was adjusted to 8, the concentration of phosphorus in the solution decreased. This decrease became more pronounced as the stirring rate increased. In addition, the pH attained at the end of precipitation reached ~6.9 for a stirring rate of 100 rpm and ~6.7 for stirring rates of 500 and 700 rpm. The initial rate of struvite precipitation increased with the stirring rate, and the end of precipitation time decreased (except at 700 rpm where a slight increase in tf was observed). In addition, the phosphorus removal efficiency increased with the stirring rate. Indeed, it increased from ~97.5% for a stirring rate of 100 rpm to ~99.4% for a stirring rate of 700 rpm (Table 2). Therefore, at the high initial phosphorus concentration of 600 mg·L1 and a solution volume of 600 mL, increasing the stirring rate accelerated the precipitation of struvite, and higher struvite amounts were obtained at relatively shorter times. Comparing the values of tf, Vi, and R (%) obtained for the initial phosphorus concentrations of 200 and 600 mg·L1 and the solution volume of 600 mL (Table 1 and Table 2) indicated that the values obtained for 600 mg·L1 were significantly higher than those obtained for 200 mg·L1. This can be explained by the flow turbulence of the solution. Indeed, when the turbulence of the solution became stronger (by increasing the stirring rate at a fixed solution volume), the transition of the constituent ions of struvite from the liquid phase to the solid phase became more difficult, and consequently, the reaction with the struvite crystal surface was inhibited. This resulted in a decrease in struvite crystal growth and fewer amounts were obtained. The limiting effect of turbulence became less consequent to the precipitation of struvite when the phosphorus concentration increased to 600 mg·L1 at a fixed solution volume of 600 mL.
Changes in pH and phosphorus concentration over time for different solution volumes between 600 and 1400 mL, an initial phosphorus concentration of 200 mg·L−1, and a stirring rate of 700 rpm are shown in Figure 5a,b. The obtained curves showed the same evolution trends as those obtained for the different stirring rates presented in Figure 3. The increase in the solution volume resulted in an increase in the phosphorus concentration obtained at the end of precipitation. That is, fewer amounts of struvite were obtained when the solution volume increased. This explains the slight increase in the solution pH obtained at the end of struvite precipitation. Indeed, struvite precipitation is accompanied by the release of protons (see Equation (1)). The initial precipitation rate Vi, the end of precipitation time tf, and the phosphorus removal efficiency R (%) for different solution volumes, an initial phosphorus concentration of 200 mg·L−1, and a stirring rate of 700 rpm are given in Figure 5c,d. The initial precipitation rate decreased from ~1.13 to ~1 mmol·L−1·min−1 when the volume of the solution increased from 600 to 800 mL, respectively. For higher volumes, it remained practically constant. The end of precipitation time remained practically constant up to a volume of 800 mL, then it increased significantly (Figure 5c). The phosphorus removal efficiency decreased as the volume of the solution increased. For example, it decreased from ~94% to ~85% as the volume increased from 600 to 1400 mL, respectively (Figure 5d). At a constant stirring rate and initial phosphorus concentration, the increase in the solution volume affected the transfer of struvite constituent ions from the liquid phase to the solid phase and inhibited their reaction with the crystal surfaces, which limited the rate of struvite crystal growth. Consequently, the amount of precipitated struvite decreased. This was confirmed by the decrease in the initial precipitation rate and the increase in the end of precipitation time. This agreed with the fact that increasing the stirring rate up to 500 rpm at a constant volume of 600 mL increased the phosphorus removal efficiency by increasing the transfer rate of struvite constituent ions. At 700 rpm, the solution became strongly turbulent, and the opposite effect (limitation of the precipitation reaction) occurred. In conclusion, under the experimental conditions of the present work, to obtain a high phosphorus removal efficiency through struvite precipitation, the stirring rate should be set at 500 rpm when working at constant volume. For higher stirring rates, the volume of the solution should be reduced.

3.2. Effect of Phosphorus Concentration
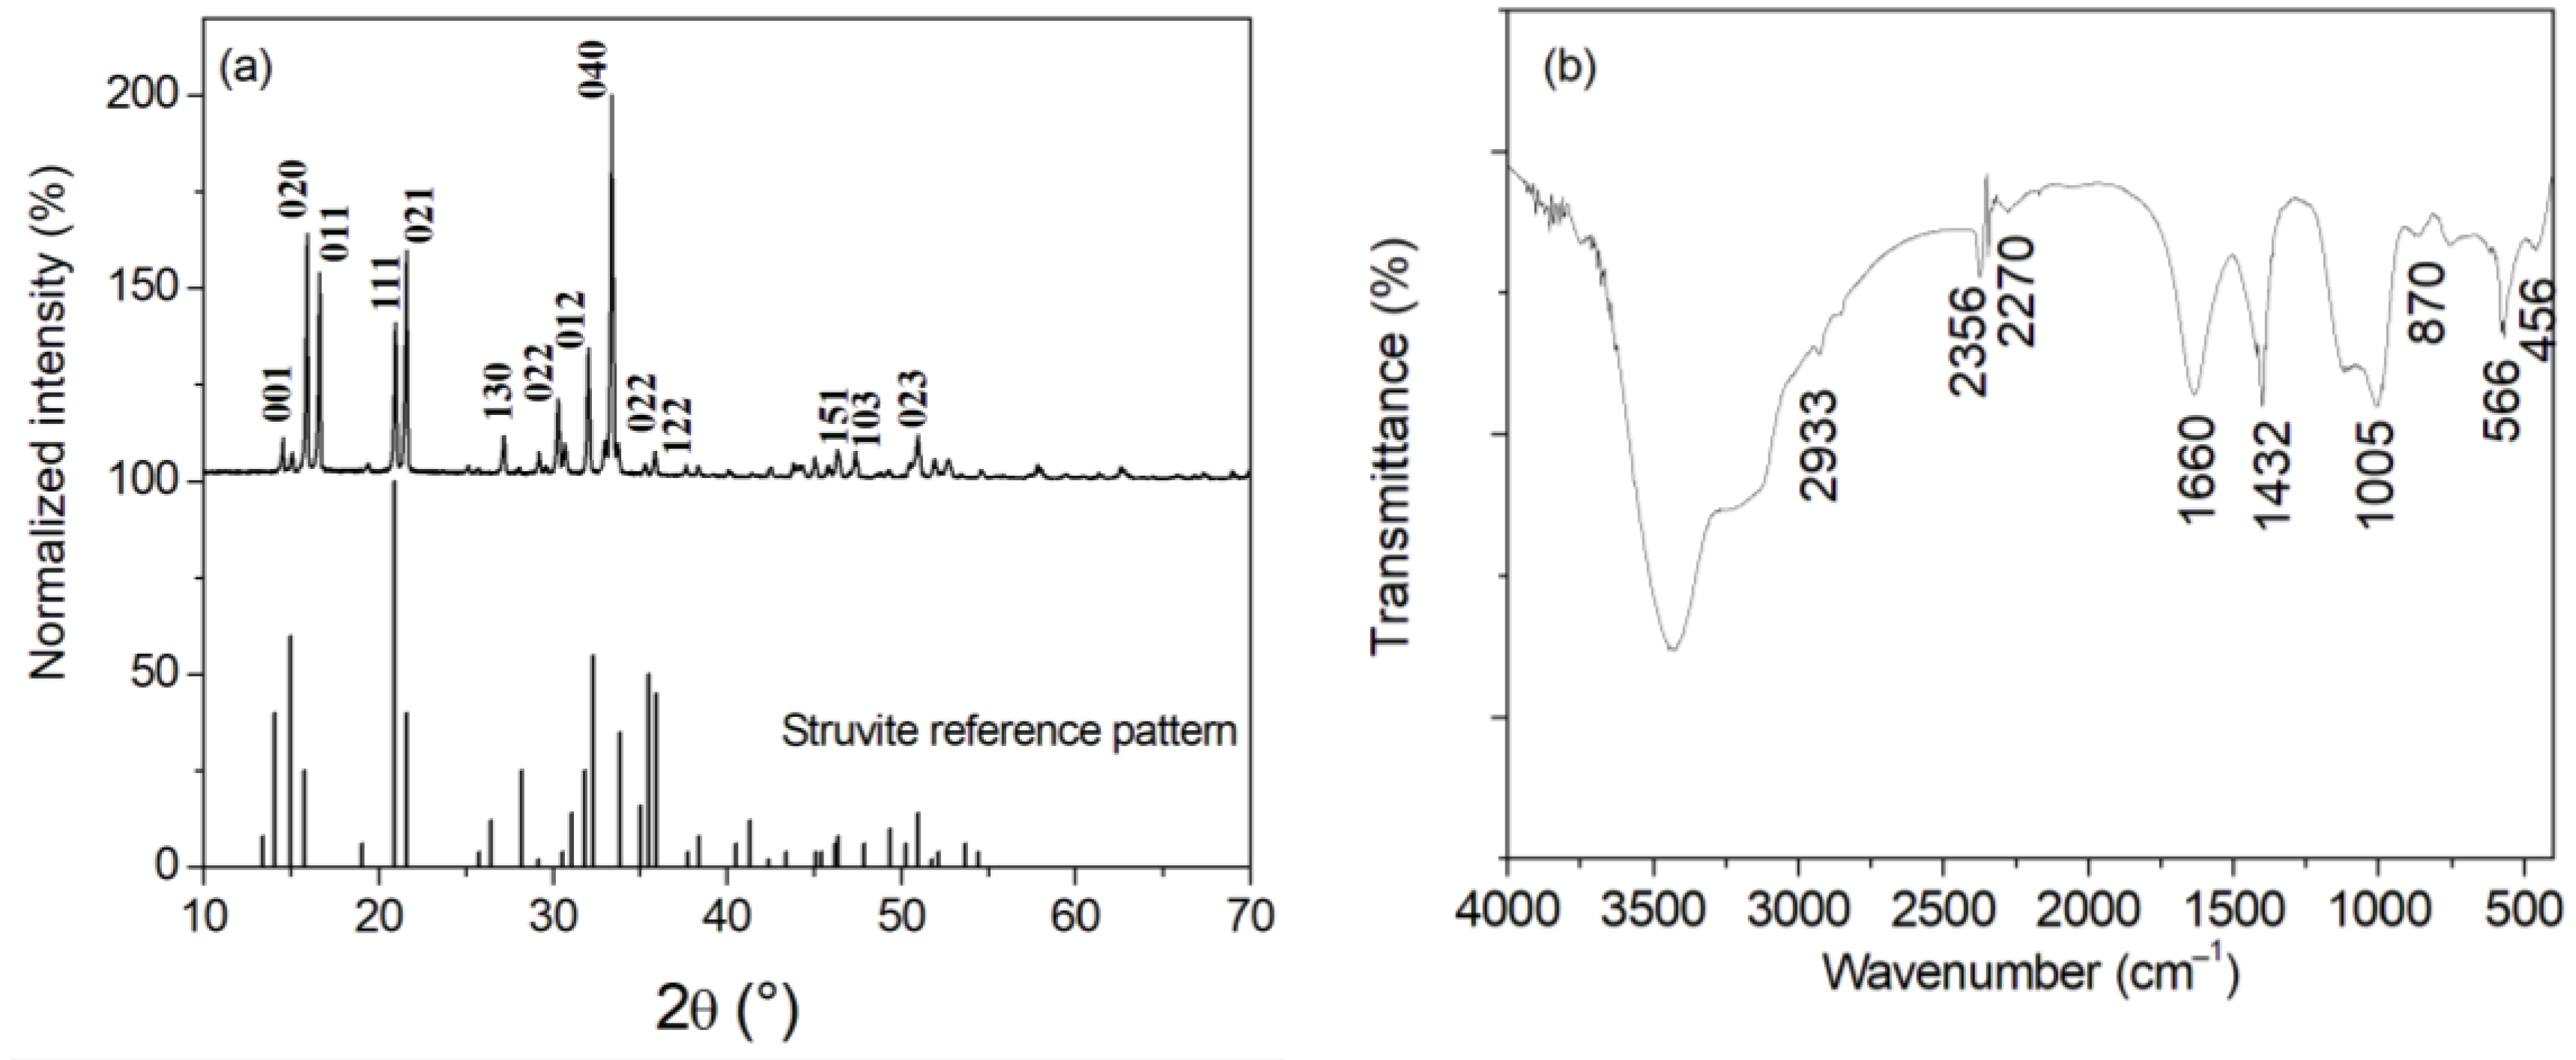
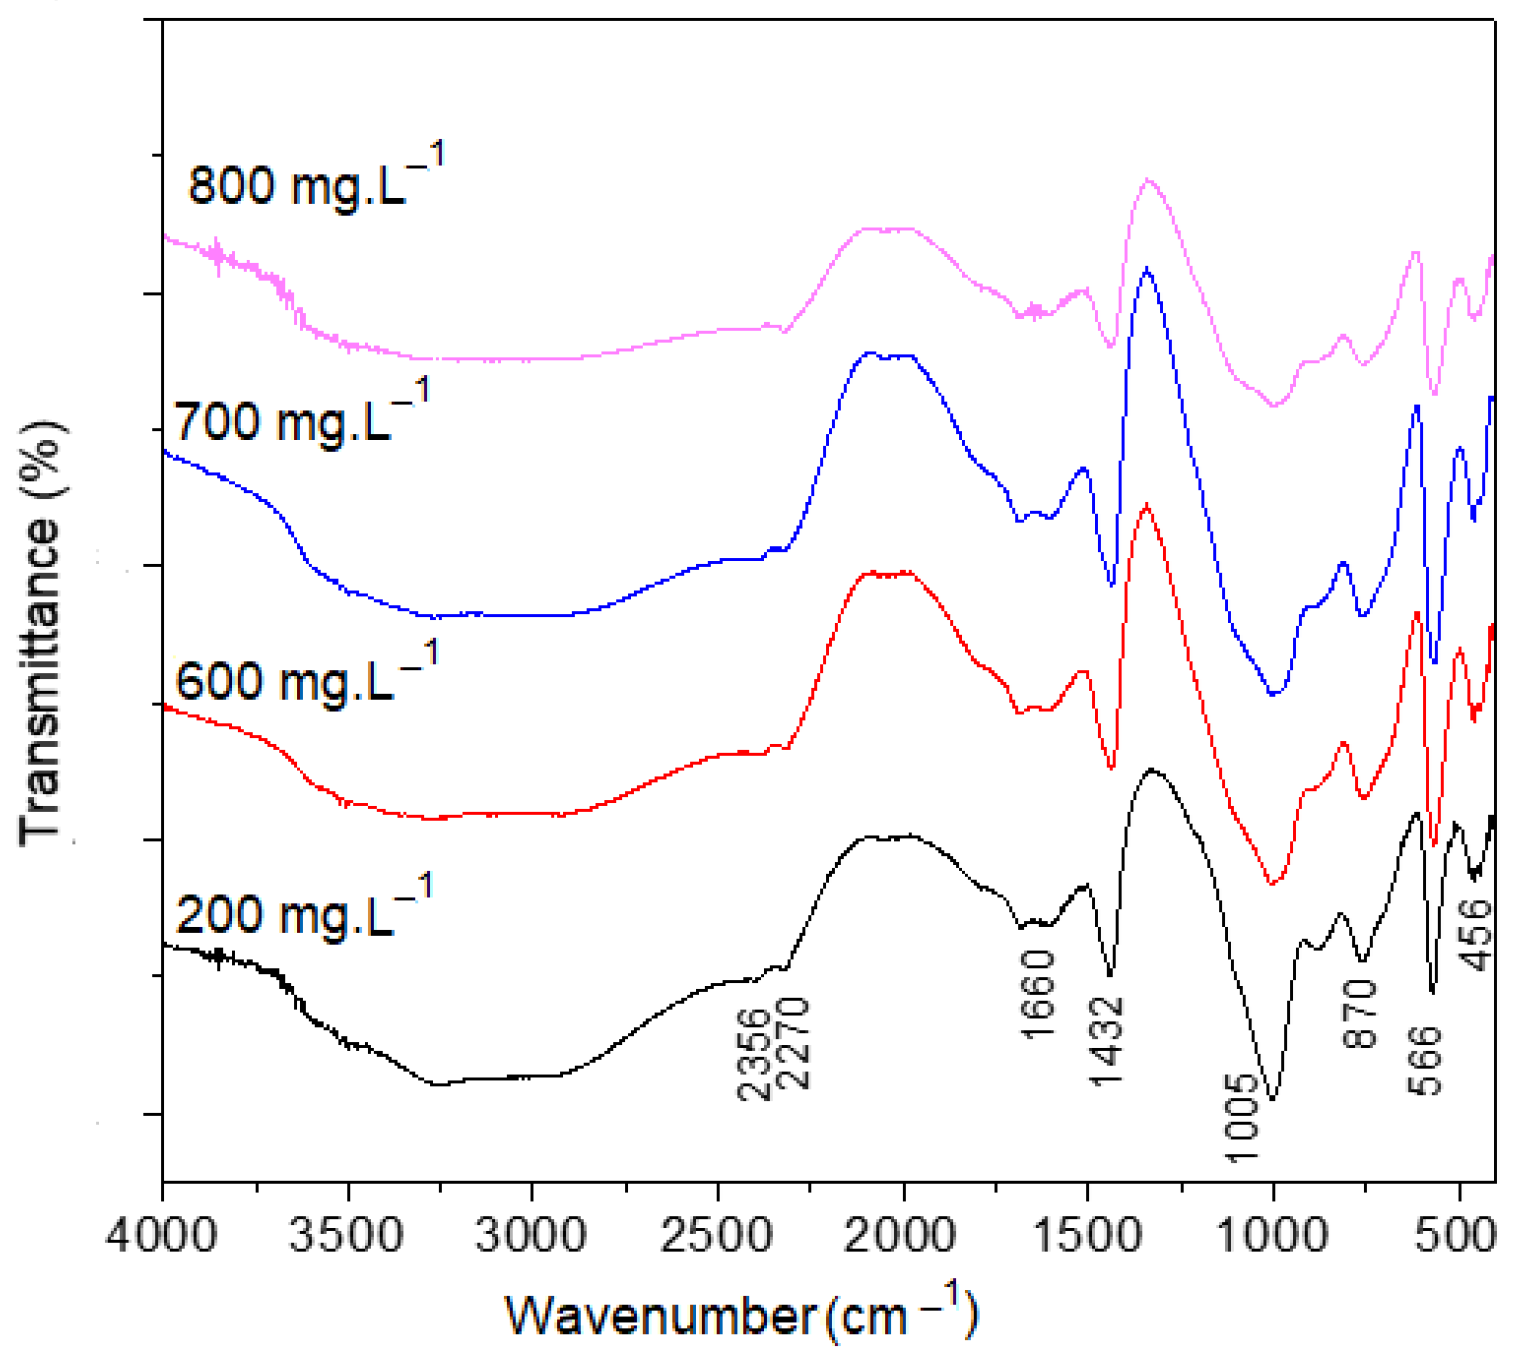
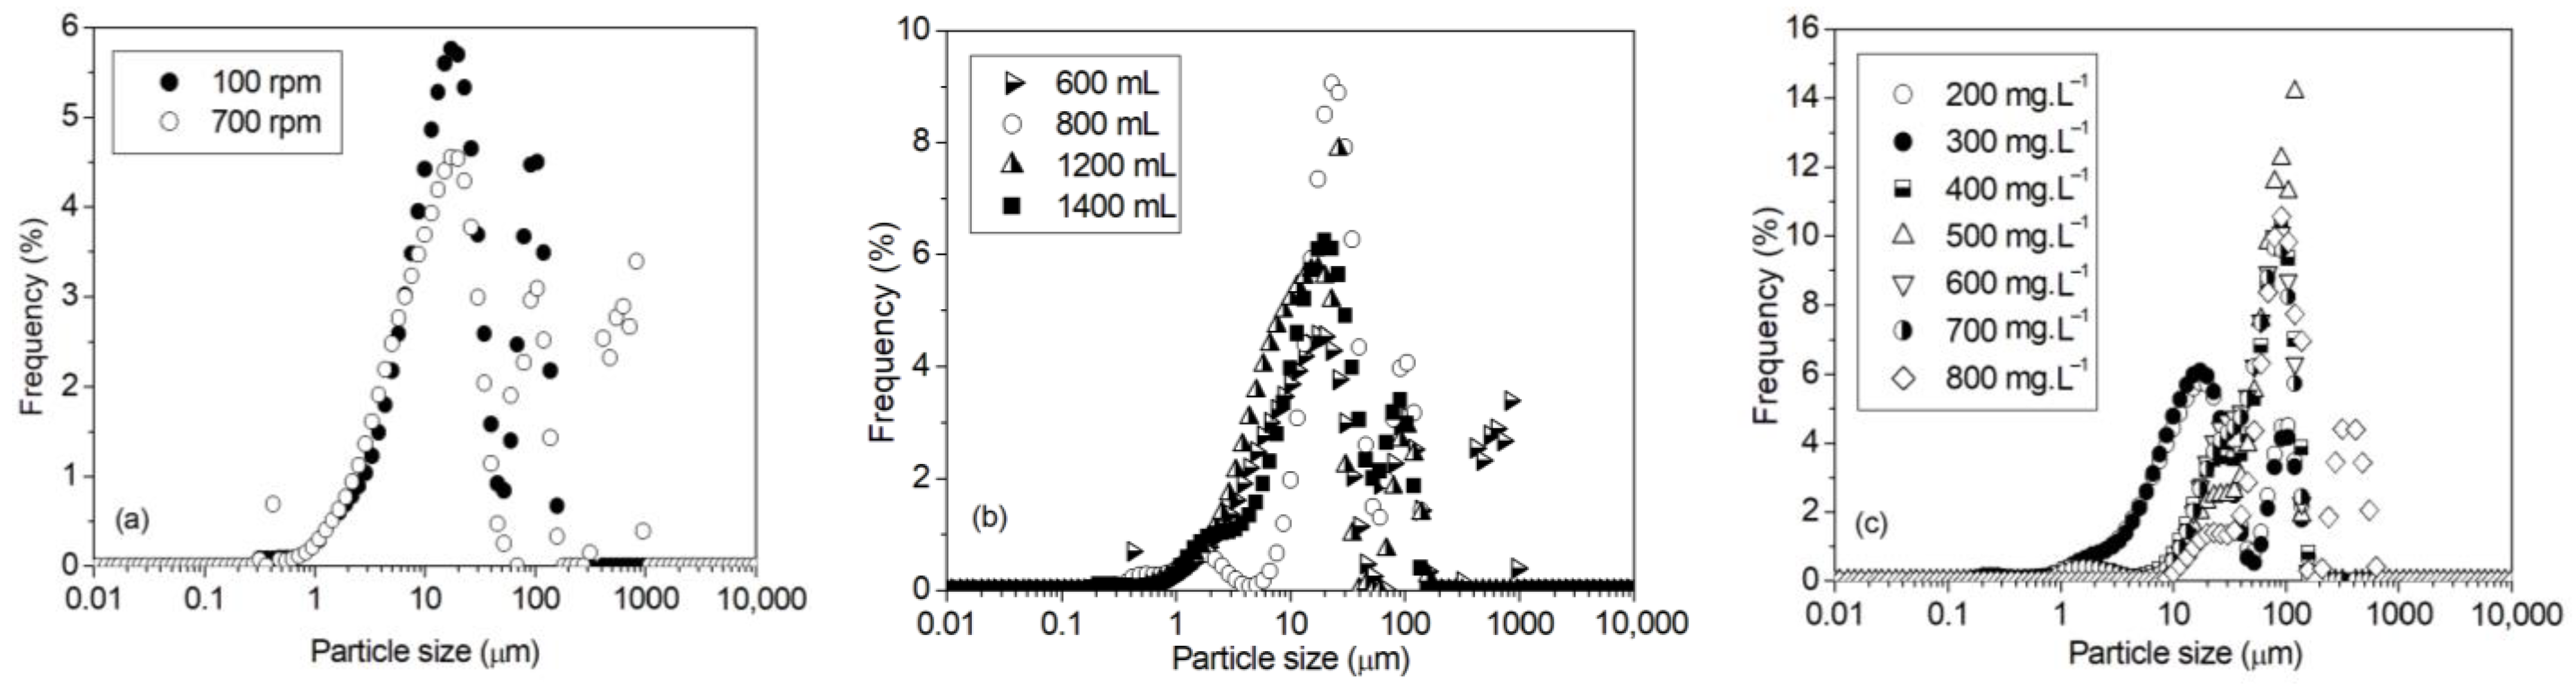
To study the effect of the initial phosphorus concentration on struvite crystallization, we performed a series of experiments at a constant stirring rate of 100 rpm, a solution volume of 600 mL, and an initial phosphorus concentration ranging from 200 to 800 mg·L1 (6.45 to 25.8 mM, respectively). The FTIR spectra of the precipitates obtained at different initial phosphorus concentrations are given in Figure 6. These spectra were comparable to the struvite spectrum. Therefore, the variation in the initial phosphorus concentration up to 800 mg·L1, at a constant stirring rate of 100 rpm and a solution volume of 600 mL, did not affect the nature of the precipitated phase.
Changes in pH and phosphorus concentration over time for different initial phosphorus concentrations, a stirring rate of 100 rpm, and a solution volume of 600 mL (not presented herein) showed the same evolution trends as those obtained for different stirring rates, an initial phosphorus concentration of 600 mg·L1, and a solution volume of 600 mL presented in Figure 4. That is, the pH and the phosphorus concentration decreased over time, and then from a certain time remained practically constant, which indicated the end of struvite precipitation. The end of precipitation time (tf), the initial precipitation rate (Vi), and the phosphorus removal efficiency R (%) obtained for the different initial phosphorus concentrations are given in Table 3. The end of precipitation time decreased with increasing the initial phosphorus concentration, while the initial precipitation rate increased. For example, tf decreased from 50 to 20 min and Vi increased from 2.33 to 12.55 mmol·L1·min1 when the phosphorus concentration increased from 300 to 800 mg·L1, respectively (Table 3). The phosphorus removal efficiency increased from ~87% to ~99% when the initial phosphorus concentration increased from 300 to 800 mg·L1, respectively. Therefore, the increase in the initial phosphorus concentration, at a fixed stirring rate of 100 rpm and a solution volume of 600 mL, improved phosphorus recovery, and more struvite crystals were precipitated at a shorter experiment time.

3.3. Particle Size

For an initial phosphorus concentration of 200 mg·L1, a solution volume of 600 mL and varied stirring rates, the particle size distribution curves showed a polymodal distribution, i.e., two maxima were observed for a stirring rate of 100 rpm, and three maxima were observed for a stirring rate of 700 rpm (Figure 7a). For both stirring rates, the first maximum was located at ~18 μm and the second one was located at ~100 μm. The third maximum observed at a stirring rate of 700 rpm appeared at ~875 μm. Therefore, the increase in the stirring rate led to the formation of large struvite crystals. This can be explained by a greater transfer of the struvite constituent ions from the liquid phase (solution) to the solid phase (the germs formed) for higher stirring. At a stirring rate of 700 rpm and an initial phosphorus concentration of 200 mg·L1, when the volume of the solution increased, the particle size distribution curves showed a polymodal distribution and a decrease in struvite particle size was observed (Figure 7b). For example, for a volume of 800 mL, the size distribution was trimodal and the maxima observed were located at ~2, ~18, and ~100 μm. For higher volumes of 1200 and 1400 mL, the size distribution became bimodal, and the maxima were located at ~18 and ~100 μm.
The particle size distributions of struvite crystals for phosphorus concentrations ranged from 200 to 700 mg·L1, a stirring rate of 100 rpm and a solution volume of 600 mL showed a bimodal distribution (Figure 7c). For a phosphorus concentration of 800 mg·L1, the size distribution became trimodal. For 200 and 300 mg·L1, the first maximum was observed at ~10 μm and the second one at ~100 μm. For initial phosphorus concentrations between 400 and 700 mg·L1, the first maximum was observed at ~30 μm and the second one at ~100 μm. For a phosphorus concentration of 800 mg·L1, besides the two maxima at 30 and 100 μm, a third maximum was observed at ~400 μm. Therefore, the increase in initial phosphorus concentration led to an increase in struvite particle size.
In summary, at an initial phosphorus concentration of 200 mg·L1 and a constant volume of 600 mL, increasing the stirring rate up to 500 rpm accelerated the precipitation of struvite, improved the phosphorus removal efficiency, and obtained larger struvite crystals. According to the results of Natsi et al. [7] and considering the dependence of phosphorus recovery through struvite crystallization on the solution turbulence depicted in the present work, the predominant mechanism of struvite crystallization can be surface-diffusion controlled. Indeed, the increase in the stirring rate from 100 to 500 rpm led to significant turbulence of the solution, which accelerated the diffusion of the constituent ions to the germs formed in the solution, and therefore an acceleration of struvite crystalline growth occurred. As a result, the particle size increased. This is of utmost importance from an experimental point of view since large struvite crystals formed in the solution facilitate its separation from the liquid phase. In addition, struvite shows slow-release properties [40] and a large surface area to volume ratio accelerates the release of ammonium and phosphorus from struvite used as fertilizer [41]. Increasing the stirring rate from 500 to 700 rpm to maintain more precipitates in suspension for a larger effective precipitation area resulted, however, in a decrease in phosphorus removal, and smaller struvite crystals were obtained. Indeed, when the stirring rate significantly increased, the mixing energy increased as well, the flow became turbulent, and the liquid shear stress was higher. This affected the transfer of struvite constituent ions from the liquid phase to the solid phase and inhibited their reaction with the crystal surfaces, limiting struvite crystal growth. By increasing the volume of the solution at a high stirring rate of 700 rpm, the turbulence of the solution decreased, and therefore, the diffusion of the constituent ions became less important, which led to smaller particles. Increasing the initial phosphorus concentration overcame the limiting effect of turbulence and resulted in an increase in struvite particle size.
In real wastewater, the concentration of total nitrogen can vary from ~50 mg·L1, i.e., in municipal wastewater with a low C/N ratio [42], to ~2700 mg·L1 in swine wastewater, for example [16]. The concentration of phosphorus and magnesium can vary from a few tens of mg·L−1 to concentrations near 900 mg·L−1 [14]. The constituent ion concentrations used in the present work fitted well with these ranges of concentrations. Real wastewater may also contain calcium (~20–60 mg·L1 [13,14,16] ), chlorine (~90 mg·L1 [16]), and low concentrations of heavy metals such as Cu (~2 mg·L1), Zn (~6 mg·L1), Cd (~0.5 mg·L1), Pb (~0.8 mg·L1), Mn (~1 mg·L1) [16], and Fe (~5 mg·L1) [43]. Note that the concentrations are given as an indication. These foreign ions can adsorb on struvite surfaces, incorporate in the struvite lattice, or precipitate as separate phases that disturb struvite growth in all cases. For example, calcium precipitated in treated wastewater as calcium phosphate salts [44,45], which affected struvite crystallization. Copper and iron precipitated in the form of hydroxides during struvite crystallization [43], and zinc precipitated as Zn-PO4 at low Zn concentration and Zn-OH at high Zn concentration [46]. Depending on the added concentration, lead can be adsorbed on struvite surfaces ([Pb] < 1 mg·L−1) or precipitated as Pb hydroxide and Pb phosphate ([Pb] between 10 and 100 mg·L−1) [47]. Like lead, the presence of nickel in the wastewater competed with struvite crystallization, i.e., at low concentrations (<1 mg·L1), nickel formed Ni-OH and Ni-PO4 on the struvite surface and precipitated separately as amorphous Ni-struvite, Ni hydroxide, and Ni phosphate at higher concentrations between 10 and 100 mg·L−1 [20]. Additionally, we showed in the present work that under a constant stirring rate, in the range between 100 and 500 rpm, the increase in the solution volume from 600 to 1200 mL did not significantly affect the struvite crystal growth, and for a higher stirring rate of 700 rpm, the volume of the solution should be reduced to obtain high amounts of struvite. However, experiments in the present work were conducted on free foreign ion solutions with relatively low volumes that did not exceed 1.4 L. Obviously, the volumes of wastewater treated in industrial processes are significantly larger than those used in the present work. For those reasons, further work is needed to investigate struvite crystallization from real wastewater at laboratory and industrial scales.

4. Conclusions

Phosphorus and ammonium can be recovered in the presence of magnesium through struvite (MgNH4PO4·6H2O) crystallization. Struvite is recognized as an effective fertilizer. In the present work, the crystallization of struvite by magnetic stirring was investigated at different initial phosphorus concentrations, solution volumes, and stirring rates. The crystals obtained were characterized by XRD, FTIR spectroscopy, and SEM. For all experiments, struvite was the only solid observed. It was shown that:
  • For an initial phosphorus concentration of 200 mg·L−1, as the stirring rate increased from 100 to 500 rpm, the initial precipitation rate increased, the precipitation end time decreased, the phosphorus removal efficiency increased from 90% to 95%, respectively, and struvite particle size increased.
  • A decrease in the removal efficiency and the struvite particle size was found at a higher stirring rate of 700 rpm. This was attributed to the solution turbulence, which caused the struvite precipitation reaction to be limited.
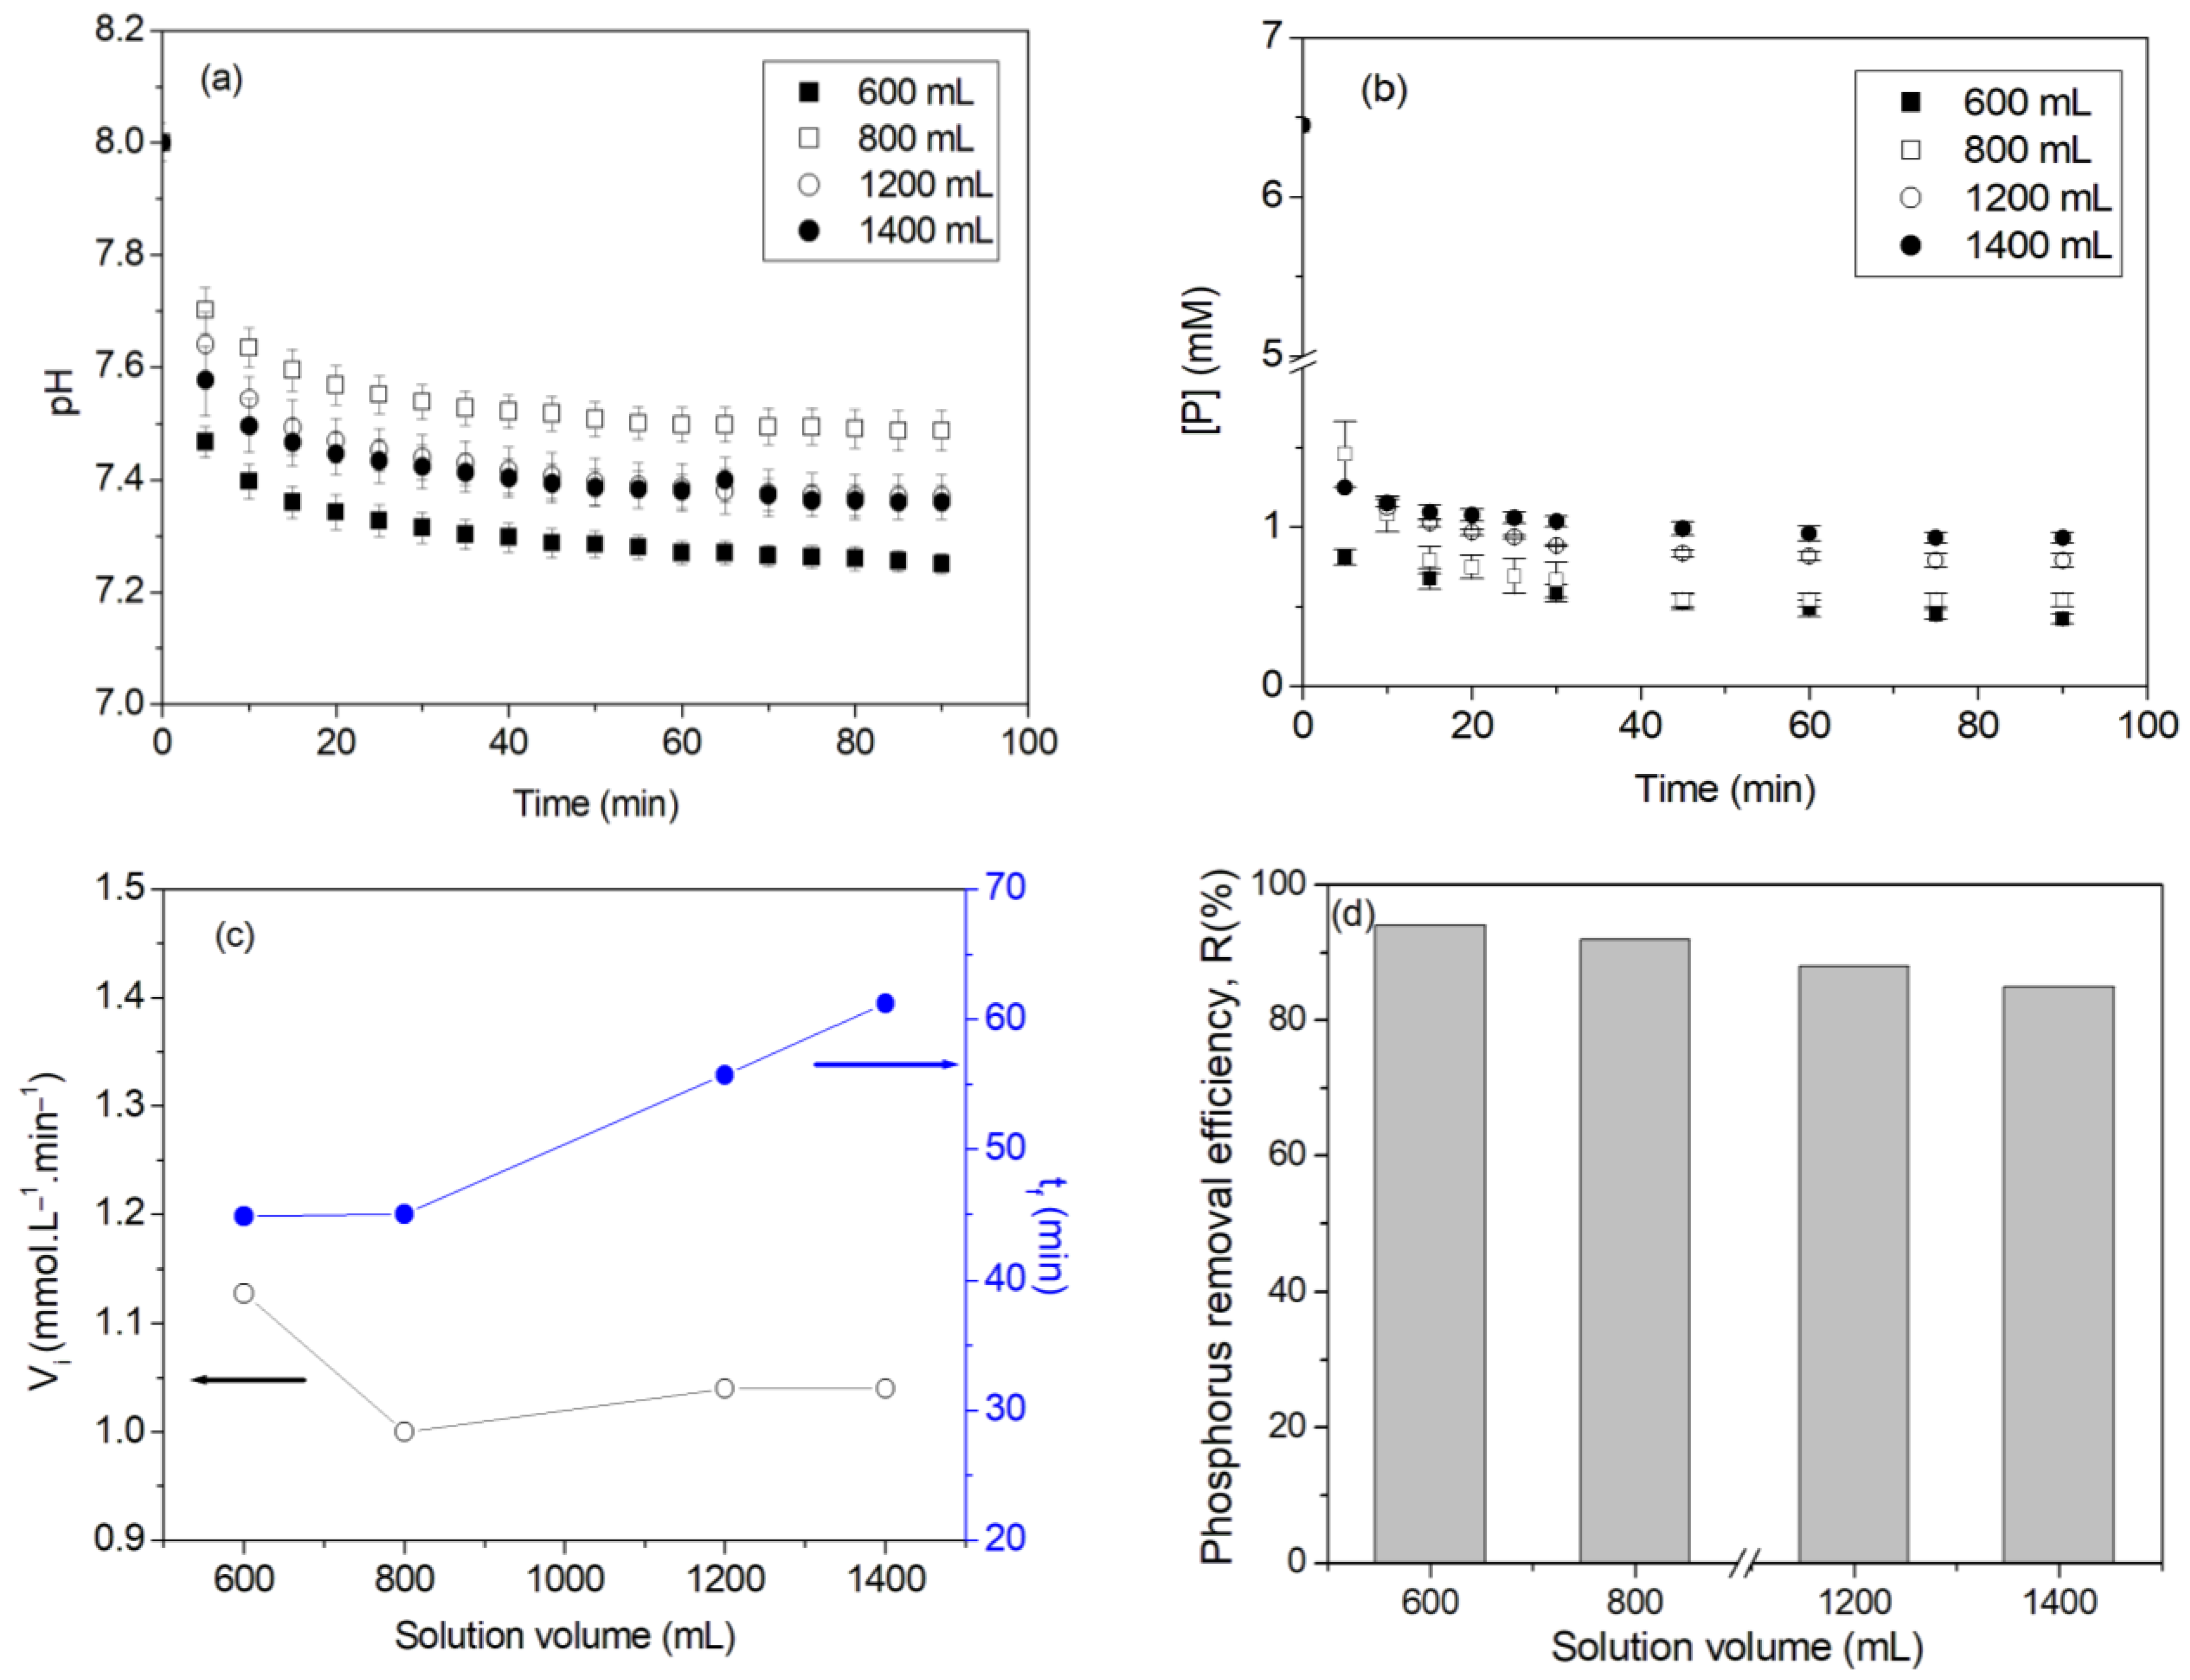
  • At a fixed stirring rate and initial phosphorus concentration, the increase in the solution volume decreased the initial precipitation rate, increased the precipitation end time, and decreased the phosphorus removal efficiency.
  • An increase in the phosphorus concentration overcame the limiting effect of turbulence. Indeed, it accelerated the precipitation of struvite and increased the phosphorus recovery (~99%) through large struvite crystals (~400 µm in size).
  • Large struvite crystals formed in the solution facilitate the separation of struvite from the liquid phase and accelerate the release of ammonium and phosphate ions in soils when struvite is used as a fertilizer.
  • Real wastewater contains ions of calcium, sulfate, and heavy metals, among others. The presence of these foreign ions influences the nature, shape, and size of the precipitated phase. Therefore, further study on the recycling of phosphorus and nitrogen through struvite crystallization from real wastewater is needed since it will allow us to identify these phases and to determine, in the case of insertion or adsorption, the rate of removal of these ions by the crystallization of struvite.

Author Contributions

A.K. was involved in the methodology, experimental investigation, supervision, and writing and editing of the work. S.A. was involved in the experimental investigation. I.S. was involved in ensuring resources, data curation, and formal analysis of the work. All authors have read and agreed to the published version of the manuscript.

Funding

This research was funded by the Deanship of Scientific Research at King Khalid University, Saudi Arabia, grant number GRP/87/44.

Institutional Review Board Statement

Not applicable.

Informed Consent Statement

Not applicable.

Data Availability Statement

Not available.

Acknowledgments

The authors extend their appreciation to the Deanship of Scientific Research at King Khalid University, Saudi Arabia, for funding this work through General Research Project under grant number GRP/87/44.

Conflicts of Interest

The authors declare no conflict of interest.

References

  1. US Bureau of Reclamation. Water Facts—Worldwide Water Supply. 2022. Available online: https://www.usbr.gov/mp/arwec/water-facts-ww-water-sup.html (accessed on 25 March 2023).
  2. EU. Drinking Water Directive; Council Directive 76/464/EEC of 4 May 1976 on Pollution Caused by Certain Dangerous Substances Discharged into the Aquatic Environment of the Community. 1976. Available online: https://eur-lex.europa.eu/legal-content/EN/TXT/PDF/?uri=CELEX:31976L0464&from=EN (accessed on 25 March 2023).
  3. Wang, L.; Ye, C.; Gao, B.; Wang, X.; Li, Y.; Ding, K.; Li, H.; Ren, K.; Chen, S.; Wang, W.; et al. Applying struvite as a N-fertilizer to mitigate N2O emissions in agriculture: Feasibility and mechanism. J. Environ. Manag. 2023, 330, 117143. [Google Scholar] [CrossRef] [PubMed]
  4. Liang, Z.; Liu, J.; Wan, Y.; Feng, Z.; Zhang, P.; Wang, M.; Zhang, H. Preparation and fire extinguishing mechanism of novel fire extinguishing powder based on recyclable struvite. Mater. Today Comm. 2023, 34, 105410. [Google Scholar] [CrossRef]
  5. Giulio, G.; Ferretti, G.; Rosinger, C.; Huber, S.; Medoro, V.; Mentler, A.; Díaz-Pinés, E.; Gorfer, M.; Faccini, B.; Keiblinger, K.M. Recycling nitrogen from liquid digestate via novel reactive struvite and zeolite minerals to mitigate agricultural pollution. Chemosphere 2023, 317, 137881. [Google Scholar] [CrossRef]
  6. Ha, T.-H.; Mahasti, N.N.; Lu, M.C.; Huang, Y.H. Ammonium-nitrogen recovery as struvite from swine wastewater using various magnesium sources. Sep. Purif. Technol. 2023, 308, 122870. [Google Scholar] [CrossRef]
  7. Natsi, P.D.; Goudas, K.-A.; Koutsoukos, P.G. Phosphorus recovery from municipal wastewater: Brucite from MgO hydrothermal treatment as magnesium source. Crystals 2023, 13, 208. [Google Scholar] [CrossRef]
  8. Sultana, R.; Kékedy-Nagy, L.; Daneshpour, R.; Greenlee, L. Electrochemical recovery of phosphate from synthetic wastewater with enhanced salinity. Electrochim. Acta 2022, 426, 140848. [Google Scholar] [CrossRef]
  9. Song, L.; Li, Z.; Wang, G.; Tian, Y.; Yang, C. Supersaturation control of struvite growth by operating pH. J. Mol. Liq. 2021, 336, 116293. [Google Scholar] [CrossRef]
  10. Abbona, F.; Madsen, H.L.; Boistelle, R. Crystallization of two magnesium phosphates, struvite and newberyite: Effect of pH and concentration. J. Cryst. Growth 1982, 57, 6–14. [Google Scholar] [CrossRef]
  11. Aage, H.; Andersen, B.; Blom, A.; Jensen, I. The solubility of struvite. J. Radioanal. Nucl. Chem. 1997, 223, 213–215. [Google Scholar] [CrossRef]
  12. Li, M.; Zhang, H.; Sun, H.; Mohammed, A.; Liu, Y.; Lu, Q. Effect of phosphate and ammonium concentrations, total suspended solids and alkalinity on lignin-induced struvite precipitation. Sci. Rep. 2022, 12, 2901. [Google Scholar] [CrossRef]
  13. Korchef, A.; Saidou, H.; Ben Amor, M. Phosphate recovery through struvite precipitation by CO2 removal: Effect of magnesium, phosphate and ammonium concentrations. J. Hazard. Mater. 2011, 186, 602–613. [Google Scholar] [CrossRef]
  14. Jaffer, Y.; Clark, T.A.; Pearce, P.; Parsons, S.A. Potential phosphorus recovery by struvite formation. Water Res. 2002, 36, 1834–1842. [Google Scholar] [CrossRef]
  15. Kruk, D.J.; Elektorowicz, M.; Oleszkiewicz, J.A. Struvite precipitation and phosphorus removal using magnesium sacrificial anode. Chemosphere 2014, 101, 28–33. [Google Scholar] [CrossRef]
  16. Wang, Y.; Da, J.; Deng, Y.; Wang, R.; Liu, X.; Chang, J. Competitive adsorption of heavy metals between Ca-P and Mg-P products from wastewater during struvite crystallization. J. Environ. Manag. 2023, 335, 117552. [Google Scholar] [CrossRef]
  17. Wang, Y.; Deng, Y.; Liu, X.; Chang, J. Adsorption behaviors and reduction strategies of heavy metals in struvite recovered from swine wastewater. J. Chem. Eng. 2022, 437, 135288. [Google Scholar] [CrossRef]
  18. Hutnik, N.; Stanclik, A.; Piotrowski, K.; Matynia, A. Kinetic conditions of struvite continuous reaction crystallisation from wastewater in presence of aluminium(III) and iron(III) ions. Int. J. Environ. Pollut. 2019, 64, 358–374. [Google Scholar] [CrossRef]
  19. Saidou, H.; Korchef, A.; Moussa, S.B.; Amor, M.B. Study of Cd2+, Al3+, and SO42− ions influence on struvite precipitation from synthetic water by dissolved CO2 degasification technique. Open J. Inorg. Chem. 2015, 5, 41. [Google Scholar] [CrossRef]
  20. Lu, X.; Xu, W.; Zeng, Q.; Liu, W.; Wang, F. Quantitative, morphological, and structural analysis of Ni incorporated with struvite during precipitation. Sci. Total Environ. 2022, 817, 152976. [Google Scholar] [CrossRef]
  21. Rabinovich, A.; Rouff, A.A. Effect of phenolic organics on the precipitation of struvite from simulated dairy wastewater. ACS EST Water 2021, 1, 910–918. [Google Scholar] [CrossRef]
  22. Capdevielle, A.; Sýkorová, E.; Biscans, B.; Béline, F.; Daumer, M.L. Optimization of struvite precipitation in synthetic biologically treated swine wastewater-Determination of the optimal process parameters. J. Hazard. Mater. 2013, 244, 357–369. [Google Scholar] [CrossRef]
  23. Bouropoulos, N.C.; Koutsoukos, P.G. Spontaneous precipitation of struvite from aqueous solutions. J. Cryst. Growth 2000, 213, 381–388. [Google Scholar] [CrossRef]
  24. Fattah, K.P.; Zhang, Y.; Mavinic, D.S.; Koch, F.A. Application of carbon dioxide stripping for struvite crystallization-I: Development of a carbon dioxide stripper model to predict CO2 removal and pH changes. J. Environ. Eng. Sci. 2008, 7, 345–356. [Google Scholar] [CrossRef]
  25. Saidou, H.; Korchef, A.; Moussa, S.B.; Amor, M.B. Struvite precipitation by the dissolved CO2 degasification technique: Impact of the airflow rate and pH. Chemosphere 2009, 74, 338–343. [Google Scholar] [CrossRef] [PubMed]
  26. Wang, L.; Gu, K.; Zhang, Y.; Sun, J.; Gu, Z.; Zhao, B.; Hu, C. Enhanced struvite generation and separation by magnesium anode electrolysis coupled with cathode electrodeposition. Sci. Total Environ. 2022, 804, 150101. [Google Scholar] [CrossRef] [PubMed]
  27. Chen, H.; Shashvatt, U.; Amurrio, F.; Stewart, K.; Blaney, L. Sustainable nutrient recovery from synthetic urine by Donnan dialysis with tubular ion-exchange membranes. J. Chem. Eng. 2023, 460, 141625. [Google Scholar] [CrossRef]
  28. Perwitasari, D.S.; Santi, S.S.; Yahya, A. The effect of stirrer rotation on crystallization of struvite that can be used as fertilizer. Int. J. Mech. Eng. 2022, 7, 2969–2972. [Google Scholar]
  29. Perera, P.W.A.; Wu, W.-X.; Chen, Y.-X.; Han, Z.-Y. Struvite Recovery from Swine Waste Biogas Digester Effluent through a Stainless Steel Device under Constant pH Conditions. Biomed. Environ. Sci. 2009, 22, 201–209. [Google Scholar] [CrossRef]
  30. Xu, K.; Wang, C.; Wang, X.; Qian, Y. Laboratory experiments on simultaneous removal of K and P from synthetic and real urine for nutrient recycle by crystallization of magnesium–potassium–phosphate–hexahydrate in a draft tube and baffle reactor. Chemosphere 2012, 88, 219–223. [Google Scholar] [CrossRef]
  31. Zhang, D.; Chen, Y.; Jilani, G.; Wu, W.; Liu, W.; Han, Z. Optimization of struvite crystallization protocol for pretreating the swine wastewater and its impact on subsequent anaerobic biodegradation of pollutants. Bioresour. Technol. 2012, 116, 386–395. [Google Scholar] [CrossRef]
  32. International Centre for Diffraction Data, Ammonium Magnesium Phosphate Hydrate (Standard #15-0762), A Computer Database. 1996. Available online: https://www.icdd.com (accessed on 25 March 2023).
  33. Zhang, T.; Ding, L.; Ren, H. Pretreatment of ammonium removal from landfill leachate by chemical precipitation. J. Hazard. Mater. 2009, 166, 911–915. [Google Scholar] [CrossRef]
  34. Korchef, A.; Naffouti, S.; Souid, I. Recovery of high concentrations of phosphorus and ammonium through struvite crystallization by CO2 repelling. Cryst. Res. Technol. 2022, 57, 2200123. [Google Scholar] [CrossRef]
  35. Nelson, N.O.; Mikkelsen, R.L.; Hesterberg, D.L. Struvite precipitation in anaerobic swine lagoon liquid: Effect of pH and Mg:P ratio and determination of rate constant. Bioresour. Technol. 2003, 89, 229–236. [Google Scholar] [CrossRef]
  36. Stratful, I.; Scrimshaw, M.D.; Lester, J.N. Conditions influencing the precipitation of magnesium ammonium phosphate. Water Res. 2001, 35, 4191–4199. [Google Scholar] [CrossRef]
  37. Muys, M.; Cámara, S.J.G.; Derese, S.; Spiller, M.; Verliefde, A.; Vlaeminck, S.E. Dissolution rate and growth performance reveal struvite as a sustainable nutrient source to produce a diverse set of microbial protein. Sci. Total Environ. 2023, 866, 161172. [Google Scholar] [CrossRef]
  38. González-Morales, C.; Fernández, B.; Molina, F.J.; Naranjo-Fernández, D.; Matamoros-Veloza, A.; Camargo-Valero, M.A. Influence of pH and temperature on struvite purity and recovery from anaerobic digestate. Sustainability 2021, 13, 10730. [Google Scholar] [CrossRef]
  39. Buchanan, J.R.; Mote, C.R.; Robinson, R.B. Thermodynamics of struvite formation. Trans. ASAE. 1994, 37, 617–621. [Google Scholar] [CrossRef]
  40. Mancho, C.; Diez-Pascual, S.; Alonso, J.; Gil-Díaz, M.; Lobo, M.C. Assessment of recovered struvite as a safe and sustainable phosphorous fertilizer. Environments 2023, 10, 22. [Google Scholar] [CrossRef]
  41. Li, B.; Boiarkina, I.; Young, B.; Yu, W. Quantification and mitigation of the negative impact of calcium on struvite purity. Adv. Powder Technol. 2016, 27, 2354–2362. [Google Scholar] [CrossRef]
  42. Yang, Y.; Peng, Y.; Cheng, J.; Zhang, S.; Liu, C.; Zhang, L. A novel two-stage aerobic granular sludge system for simultaneous nutrient removal from municipal wastewater with low C/N ratios. Chem. Eng. J. 2023, 462, 142318. [Google Scholar] [CrossRef]
  43. Guan, Q.; Zeng, G.; Gong, B.; Li, Y.; Ji, H.; Zhang, J.; Song, J.; Liu, C.; Wang, Z.; Deng, C. Phosphorus recovery and iron, copper precipitation from swine wastewater via struvite crystallization using various magnesium compounds. J. Clean. Prod. 2021, 328, 129588. [Google Scholar] [CrossRef]
  44. Pastor, L.; Mangin, D.; Barat, R.; Seco, A. A pilot-scale study of struvite precipitation in a stirred tank reactor: Conditions influencing the process. Bioressour. Technol. 2008, 99, 6285–6291. [Google Scholar] [CrossRef] [PubMed]
  45. Le Corre, K.S.; Valsami-Jones, E.; Hobbs, P.; Parsons, S.A. Impact of calcium on struvite crystal size, shape and purity. J. Cryst. Growth. 2005, 283, 514–522. [Google Scholar] [CrossRef]
  46. Rouff, A.A.; Juarez, K.M. Zinc interaction with struvite during and after mineral formation. Environ. Sci. Technol. 2014, 48, 6342. [Google Scholar] [CrossRef] [PubMed]
  47. Lu, X.; Zhong, R.; Liu, Y.; Li, Z.; Yang, J.; Wang, F. The incorporation of Pb2+ during struvite precipitation: Quantitative, morphological and structural analysis. J. Environ. Manag. 2020, 276, 111359. [Google Scholar] [CrossRef]
Figure 1. Typical examples of the (a) XRD pattern and (b) FTIR spectrum of the obtained precipitates.
Crystals 13 00711 g001
Figure 2. SEM micrograph of the precipitates obtained with the typical prismatic pattern characteristic of struvite crystals.
Crystals 13 00711 g002
Figure 3. Variations of pH and phosphorus concentration over time for different stirring rates, an initial phosphorus concentration of 200 mg·L−1 and solution volumes of (a,b) 600 mL and (c,d) 1200 mL.
Crystals 13 00711 g003
Figure 4. Variations of (a) pH and (b) phosphorus concentration over time for different stirring rates, an initial phosphorus concentration of 600 mg·L−1, and a solution volume of 600 mL.
Crystals 13 00711 g004
Figure 5. Variations of (a) pH, and (b) phosphorus concentration over time for different solution volumes, and variations of the (c) end of precipitation time tf and initial precipitation rate Vi, and (d) phosphorus removal efficiency with the solution volume for an initial phosphorus concentration of 200 mg·L−1 and a stirring rate of 700 rpm.
Crystals 13 00711 g005
Figure 6. FTIR spectra of the precipitates obtained for different initial phosphorus concentrations, a stirring rate of 100 rpm, and a solution volume of 600 mL.
Crystals 13 00711 g006
Figure 7. Particle size distributions of struvite crystals for (a) selected stirring rates at an initial phosphorus concentration of 200 mg·L−1 and a solution volume of 600 mL, (b) different solution volumes at a stirring rate of 700 rpm, and (c) different initial phosphorus concentrations at a stirring rate of 100 rpm and a solution volume of 600 mL.
Crystals 13 00711 g007
Table 1. End of precipitation time (tf), initial precipitation rate (Vi), and phosphorus removal efficiency (R%) for different stirring rates, solution volumes of 600 and 1200 mL, and an initial phosphorus concentration of 200 mg·L−1.
Solution VolumeStirring Rate (rpm)Vi (mmol·L−1·min−1)tf (min)R (%)
600 mL1000.227590.31
3000.267590.31
5000.394595.48
7001.134594.01
1200 mL1000.227590.31
3000.266090.31
5000.369095.04
7001.044588.71
Table 2. End of precipitation time (tf), initial precipitation rate (Vi), and phosphorus removal efficiency (R%) for different stirring rates, an initial phosphorus concentration of 600 mg·L−1, and a solution volume of 600 mL.
Stirring Rate (rpm)Vi (mmol·L−1·min−1)tf (min)R (%)
1008.424597.51
3008.743097.92
5009.052098.73
7009.133099.42
Table 3. End of precipitation time (tf), the initial precipitation rate (Vi), and the phosphorus removal efficiency (R%) obtained for different initial phosphorus concentrations ([P]0), a stirring rate of 100 rpm and a solution volume of 600 mL.
[P]0 (mg·L−1)Vi (mmol·L−1·min−1)tf (min)R (%)
3002.335087.32
4004.434091.74
5007.032595.77
6008.422296.15
70010.792098.21
80012.552098.94
Disclaimer/Publisher’s Note: The statements, opinions and data contained in all publications are solely those of the individual author(s) and contributor(s) and not of MDPI and/or the editor(s). MDPI and/or the editor(s) disclaim responsibility for any injury to people or property resulting from any ideas, methods, instructions or products referred to in the content.

