Article

Microstructures and Mechanical Properties of Annealed Ti50Ni47Fe3 Shape Memory Alloy

1
State Key Laboratory of Nonferrous Metals and Processes, China GRINM Group Co., Ltd., Beijing 100088, China
2
GRIMAT Engineering Institute Co., Ltd., Beijing 101407, China
3
General Research Institute for Nonferrous Metals, Beijing 100088, China
*
Author to whom correspondence should be addressed.
Crystals 2023, 13(4), 706; https://doi.org/10.3390/cryst13040706
Submission received: 28 March 2023 / Revised: 17 April 2023 / Accepted: 19 April 2023 / Published: 21 April 2023
(This article belongs to the Special Issue Emerging Topics on High Performance Alloys)

Abstract

:
The effect of annealing temperature on the microstructures and mechanical properties of Ti50Ni47Fe3 (at. %) shape memory alloy was investigated by using a cold-rolled alloy sheet. For this purpose, a scanning electron microscope, electron backscatter diffraction, a transmission electron microscope, X-ray diffraction, tensile tests and Vickers hardness tests were used. The evolution of the microstructures, mechanical properties and fracture morphology of Ti50Ni47Fe3 alloy was studied. The results show that the recovery occurs at an annealing temperature of 500 °C, and the recrystallization occurs at 600 °C. Because of the recrystallization at 600 °C, the <110>//RD texture disappears, and the intensity of the <111>//RD texture decreases; the alloy reaches its maximum elongation while maintaining a high strength, and at this annealing temperature, the alloy has excellent comprehensive mechanical properties. After the temperature exceeds 600 °C, the mechanical properties of the alloy decrease sharply. With the increase of the annealing temperature, the quantity and distribution of elliptical Ti2Ni-phase particles show almost no specific changes. Additionally, with the increase of annealing temperatures to 600 °C, the fracture surface of Ti50Ni47Fe3 alloys becomes flatter.

1. Introduction

TiNi shape memory alloys (SMAs) show an extraordinary shape memory effect (SME) and superelasticity (SE). These peculiar functional properties originate from the solid-to-solid martensitic transformation and its reverse transformation between the B2 austenite phase and B19′ martensite phase, which is called thermoelastic martensitic transformation (MT) [1,2]. Owing to their unique memory effects, TiNi and TiNi-based SMAs can be widely used in the aerospace industry, electronic products, mechanical control, biomedicine and even architecture fields [3,4,5,6]. It is known that plastic deformation is the most important method to manufacture SMA products, as it is able to induce a high density of dislocations and fine broken grains and will promote SE and SME. However, the mechanical properties of SMAs after plastic deformation will decrease sharply, so that the annealing process after deformation is extremely necessary [7,8]. The annealing process after deformation can influence the microstructural evolution, mechanical properties and phase transformation of the alloys [9]. To improve the mechanical properties of TiNi-based SMAs, researchers have reported two main methods. One is heat treatment and the other is the addition of third elements in the TiNi SMAs, such as Fe, Nb, Cu, etc. The addition of a Cu element in TiNi-based alloys can lead to a cubic-B2-to-orthorhombic-B19 transformation and will reduce the transformation hysteresis [10,11]. Additionally, the addition of a Nb element will cause both a wide transformation hysteresis and low martensitic transformation temperature [12,13]. However, the addition of both Cu and Nb in TiNi binary alloys has limitations in terms of their application to aviation industries. In these circumstances, TiNiFe SMA shows unique advantages. An Fe atom can replace Ni in the TiNi unit cell and form an intermetallic compound, resulting in lattice distortion and atomic relaxation. It not only continues the excellent shape memory characteristics and mechanical properties of TiNi SMA but also makes the transformation temperature of martensite lower with the addition of the Fe element. Therefore, TiNiFe SMA is often used in a cryogenic service environment [14,15]. At the same time, the addition of an Fe element will lead to point defects, resulting in the appearance of an R phase transformation and the stability of the R phase in thermodynamics. Additionally, a lower phase-transition potential barrier is generated in kinetics [16], thus inhibiting the B2-B19’ phase transformation of the alloy [17,18].
At present, research on TiNiFe alloys mainly focuses on deformation behavior, phase transformation behavior and mechanical properties. It has been found that the addition of an Fe element can promote nucleation, and with the increase of Fe content, the grains are refined, the B2 phase will be stable, and the hardness of TiNiFe alloys will increase. Additionally, recent studies show that the hot deformation of TiNiFe alloys will induce dynamic recrystallization, which is mainly a softening mechanism [19]. Furthermore, during the hot deformation process, the flow stress increases with the decrease of the deformation temperature [20].
Cold deformation methods, such as cold rolling, cold drawing and high-pressure torsion, have been widely used in TiNi SMAs’ formation. After cold deformation, the recovery stress and recoverable strain of TiNi SMAs have been greatly improved. Additionally, it is found that the larger the cold deformation, the higher the tensile strength and deformation-stored energy [21]. However, the plasticity of TiNi SMAs decreases rapidly after cold deformation. Hence, the annealing process after cold deformation will play a vital role. For Ni-rich TiNi alloys, the formation of precipitates increases the strength of the material after the annealing process [22]. Additionally, an appropriate annealing temperature will also reduce the internal stress and homogenize the grains [23,24].
TiNiFe SMAs cannot be strengthened by solution strengthening. Cold deformation can induce a large number of defects and is prone to work hardening. Furthermore, the hardening index of TiNiFe alloy is extremely high, which affects its application in practical engineering [25,26]. Research on the cold deformation of TiNi-based alloys is mainly focused on deformation methods and processes, transformation behavior and SME [7,27,28,29]. Meanwhile, the investigation of heat treatment on the microstructures and mechanical properties of TiNiFe SMAs has not been sufficiently comprehensive. To provide guidance for a cold-deformed Ti50Ni47Fe3 heat-treatment system and to obtain the optimal strength–toughness matching after heat treatment, a cold-deformed Ti50Ni47Fe3 alloy was used as experimental material for this study.

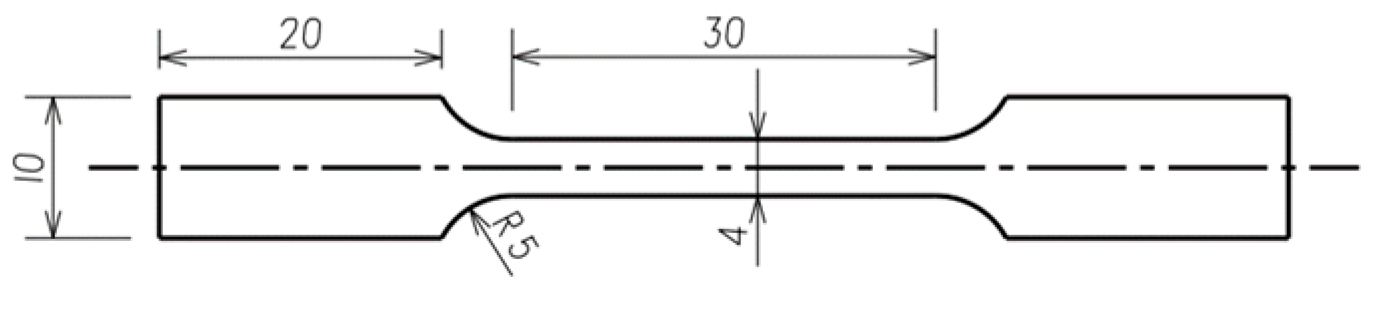
2. Materials and Methods

A Ti50Ni47Fe3 alloy ingot with a diameter of 150 mm was prepared by vacuum induction melting. A graphite crucible was used in the vacuum induction melting process, the vacuum degree of the induction furnace was 1 × 10⁻² Pa, and argon gas was used as the protective gas during the melting process. After cogging and forging, a 200-mm-long sample was forged into a 30 × 30 mm square billet. Then, the billet was wire-cut into a Ti50Ni47Fe3 slice and acid-dipped, and an alloy sheet with a thickness of 1.1 mm was obtained after cold rolling. The cold-rolling reduction of Ti50Ni47Fe3 alloy is 27%. To investigate the effect of different annealing temperatures on the microstructure and properties of Ti50Ni47Fe3, the cold-rolled Ti50Ni47Fe3 alloy sheet was annealed at 400~800 °C for 60 min followed by air-cooling (AC), with an annealing temperature interval of 50 °C. The selection of the annealing temperature range and interval is because the overall temperature range of the recovery, recrystallization and grain-growth process is wide; choosing 50 °C as the heat-treatment temperature range has a high representativeness and significance. Additionally, the chemical composition of the material is given in Table 1.
The tensile test specimens were prepared by wire-cutting parallel to the rolling direction. Furthermore, the dimensions of the specimens are shown in Figure 1 The tensile properties at room temperature were tested by an MTS electromechanical test system, with an initial strain rate of 5 × 10⁻⁴ s−1. The microhardness tests were conducted on the WILSON VH1150 Vickers hardness tester with a 49 N load (HV5), and the average value was taken after measuring five groups.
The microstructures and fracture morphology observations were carried out by a JEOL JSM-7900F field emission scanning electron microscope (SEM) equipped with an electron backscattered diffraction (EBSD) probe. The SEM and EBSD samples were wire-cut, sandpapered and polished by Struers OP-S. After that, the SEM samples were etched in a solution of HF:HNO3:H2O = 1:2:10 (volume fraction). Additionally, the EBSD samples were electropolished with a solution of 30 vol. % HNO3 and 70 vol. % CH3OH at −30 °C. The transmission electron microscope (TEM) observations were carried out by an FEI TECNAI G2 F20 microscope. The foils for TEM observations were prepared by twin-jet polishing technique using a solution of 10 vol. %HClO4 and 90 vol. %C2H5OH. Additionally, X-ray diffraction (XRD) via a Rigaku D/Max 2500 VB2 was used for the analysis of the phase composition of alloys.

3. Results and Discussion

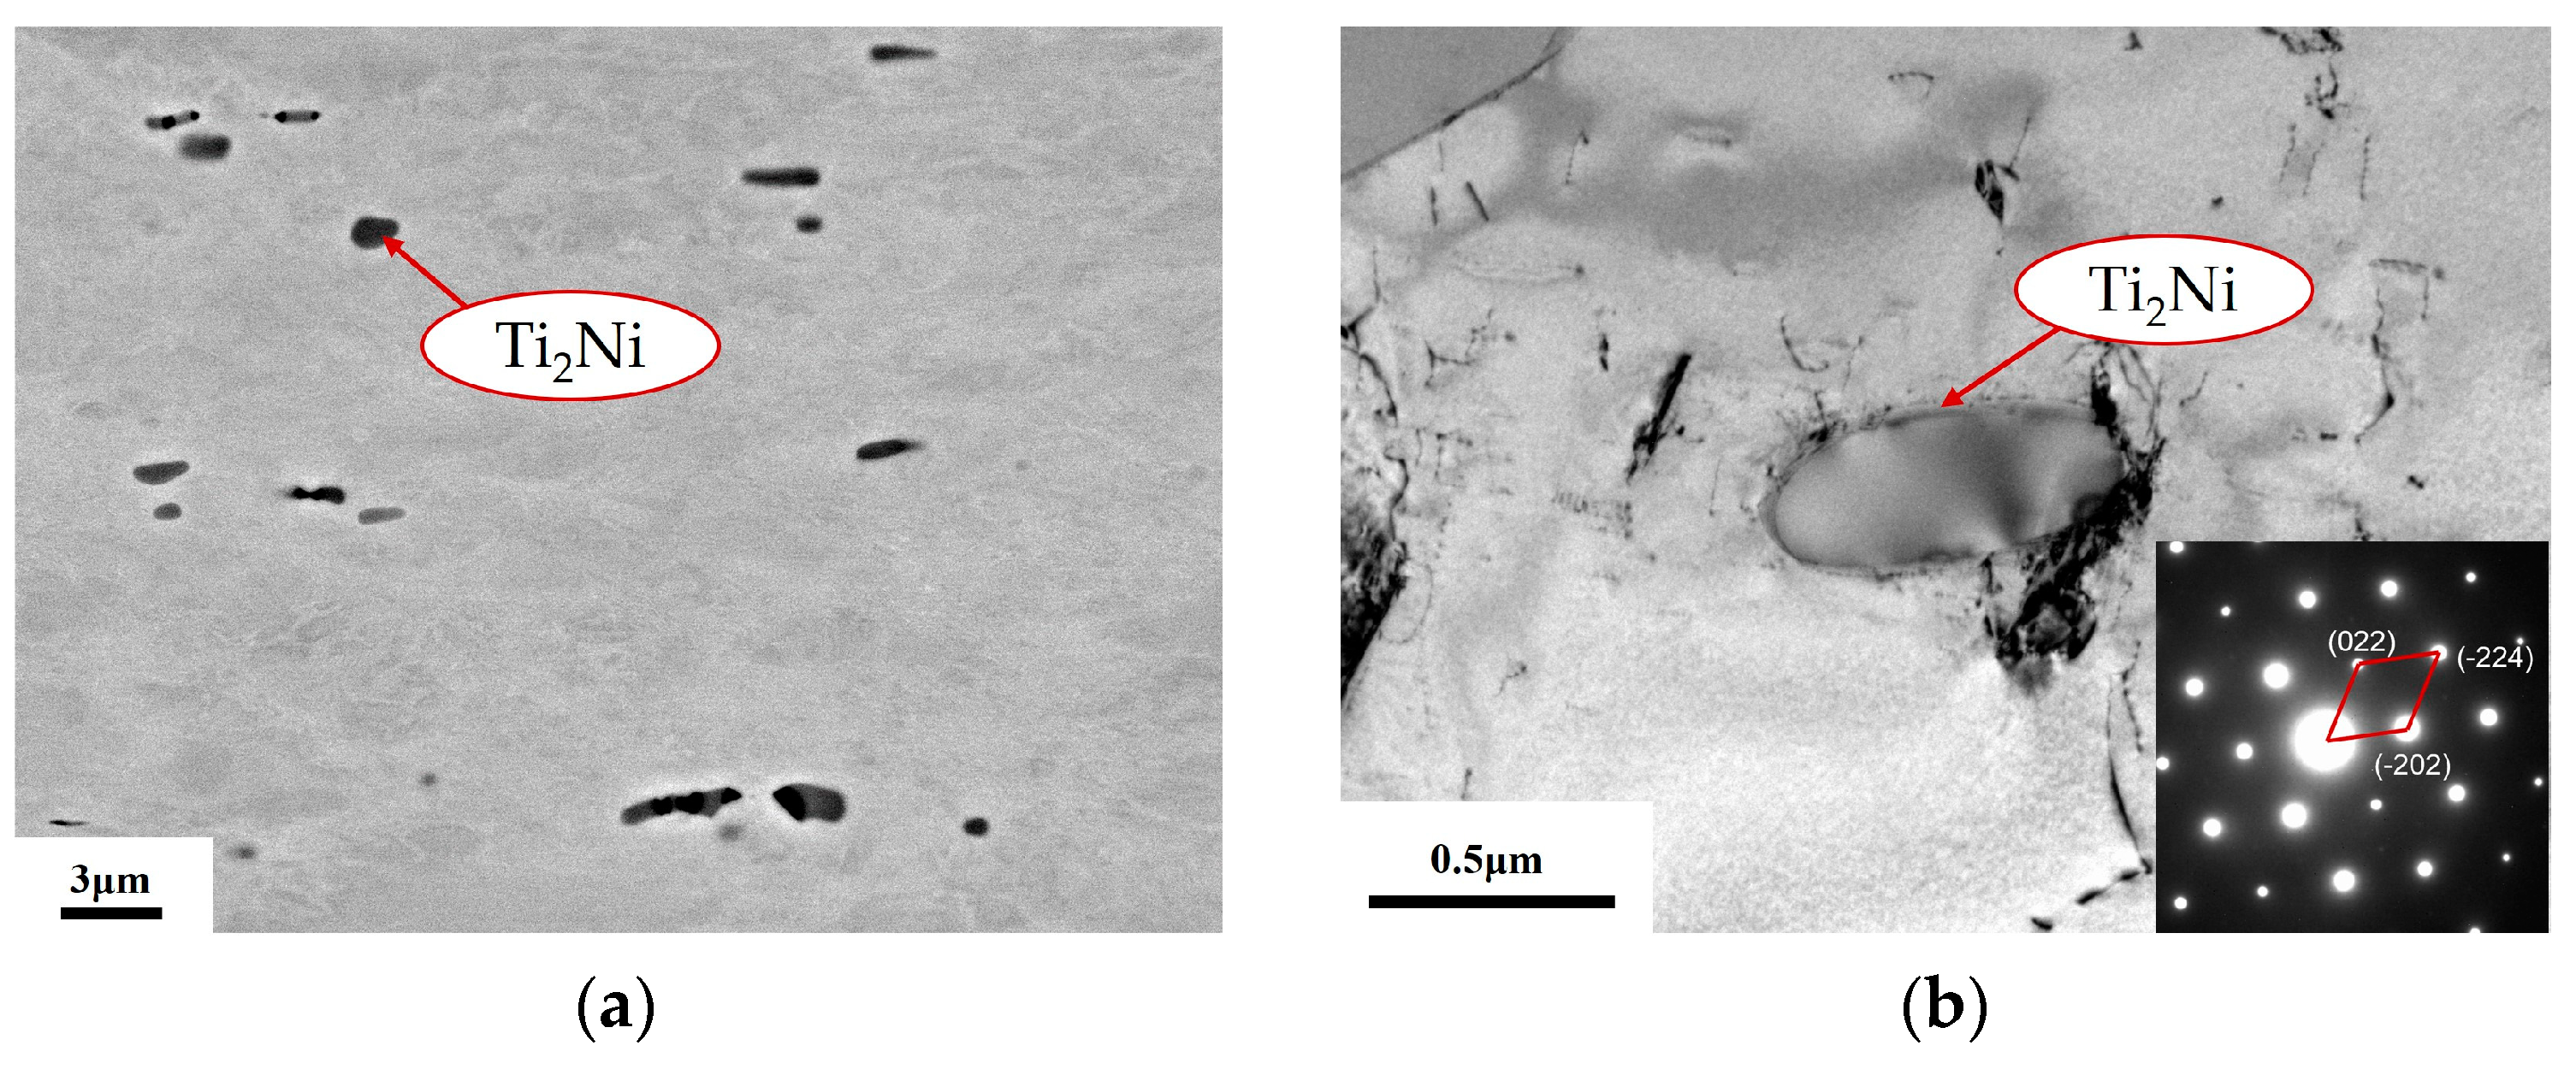
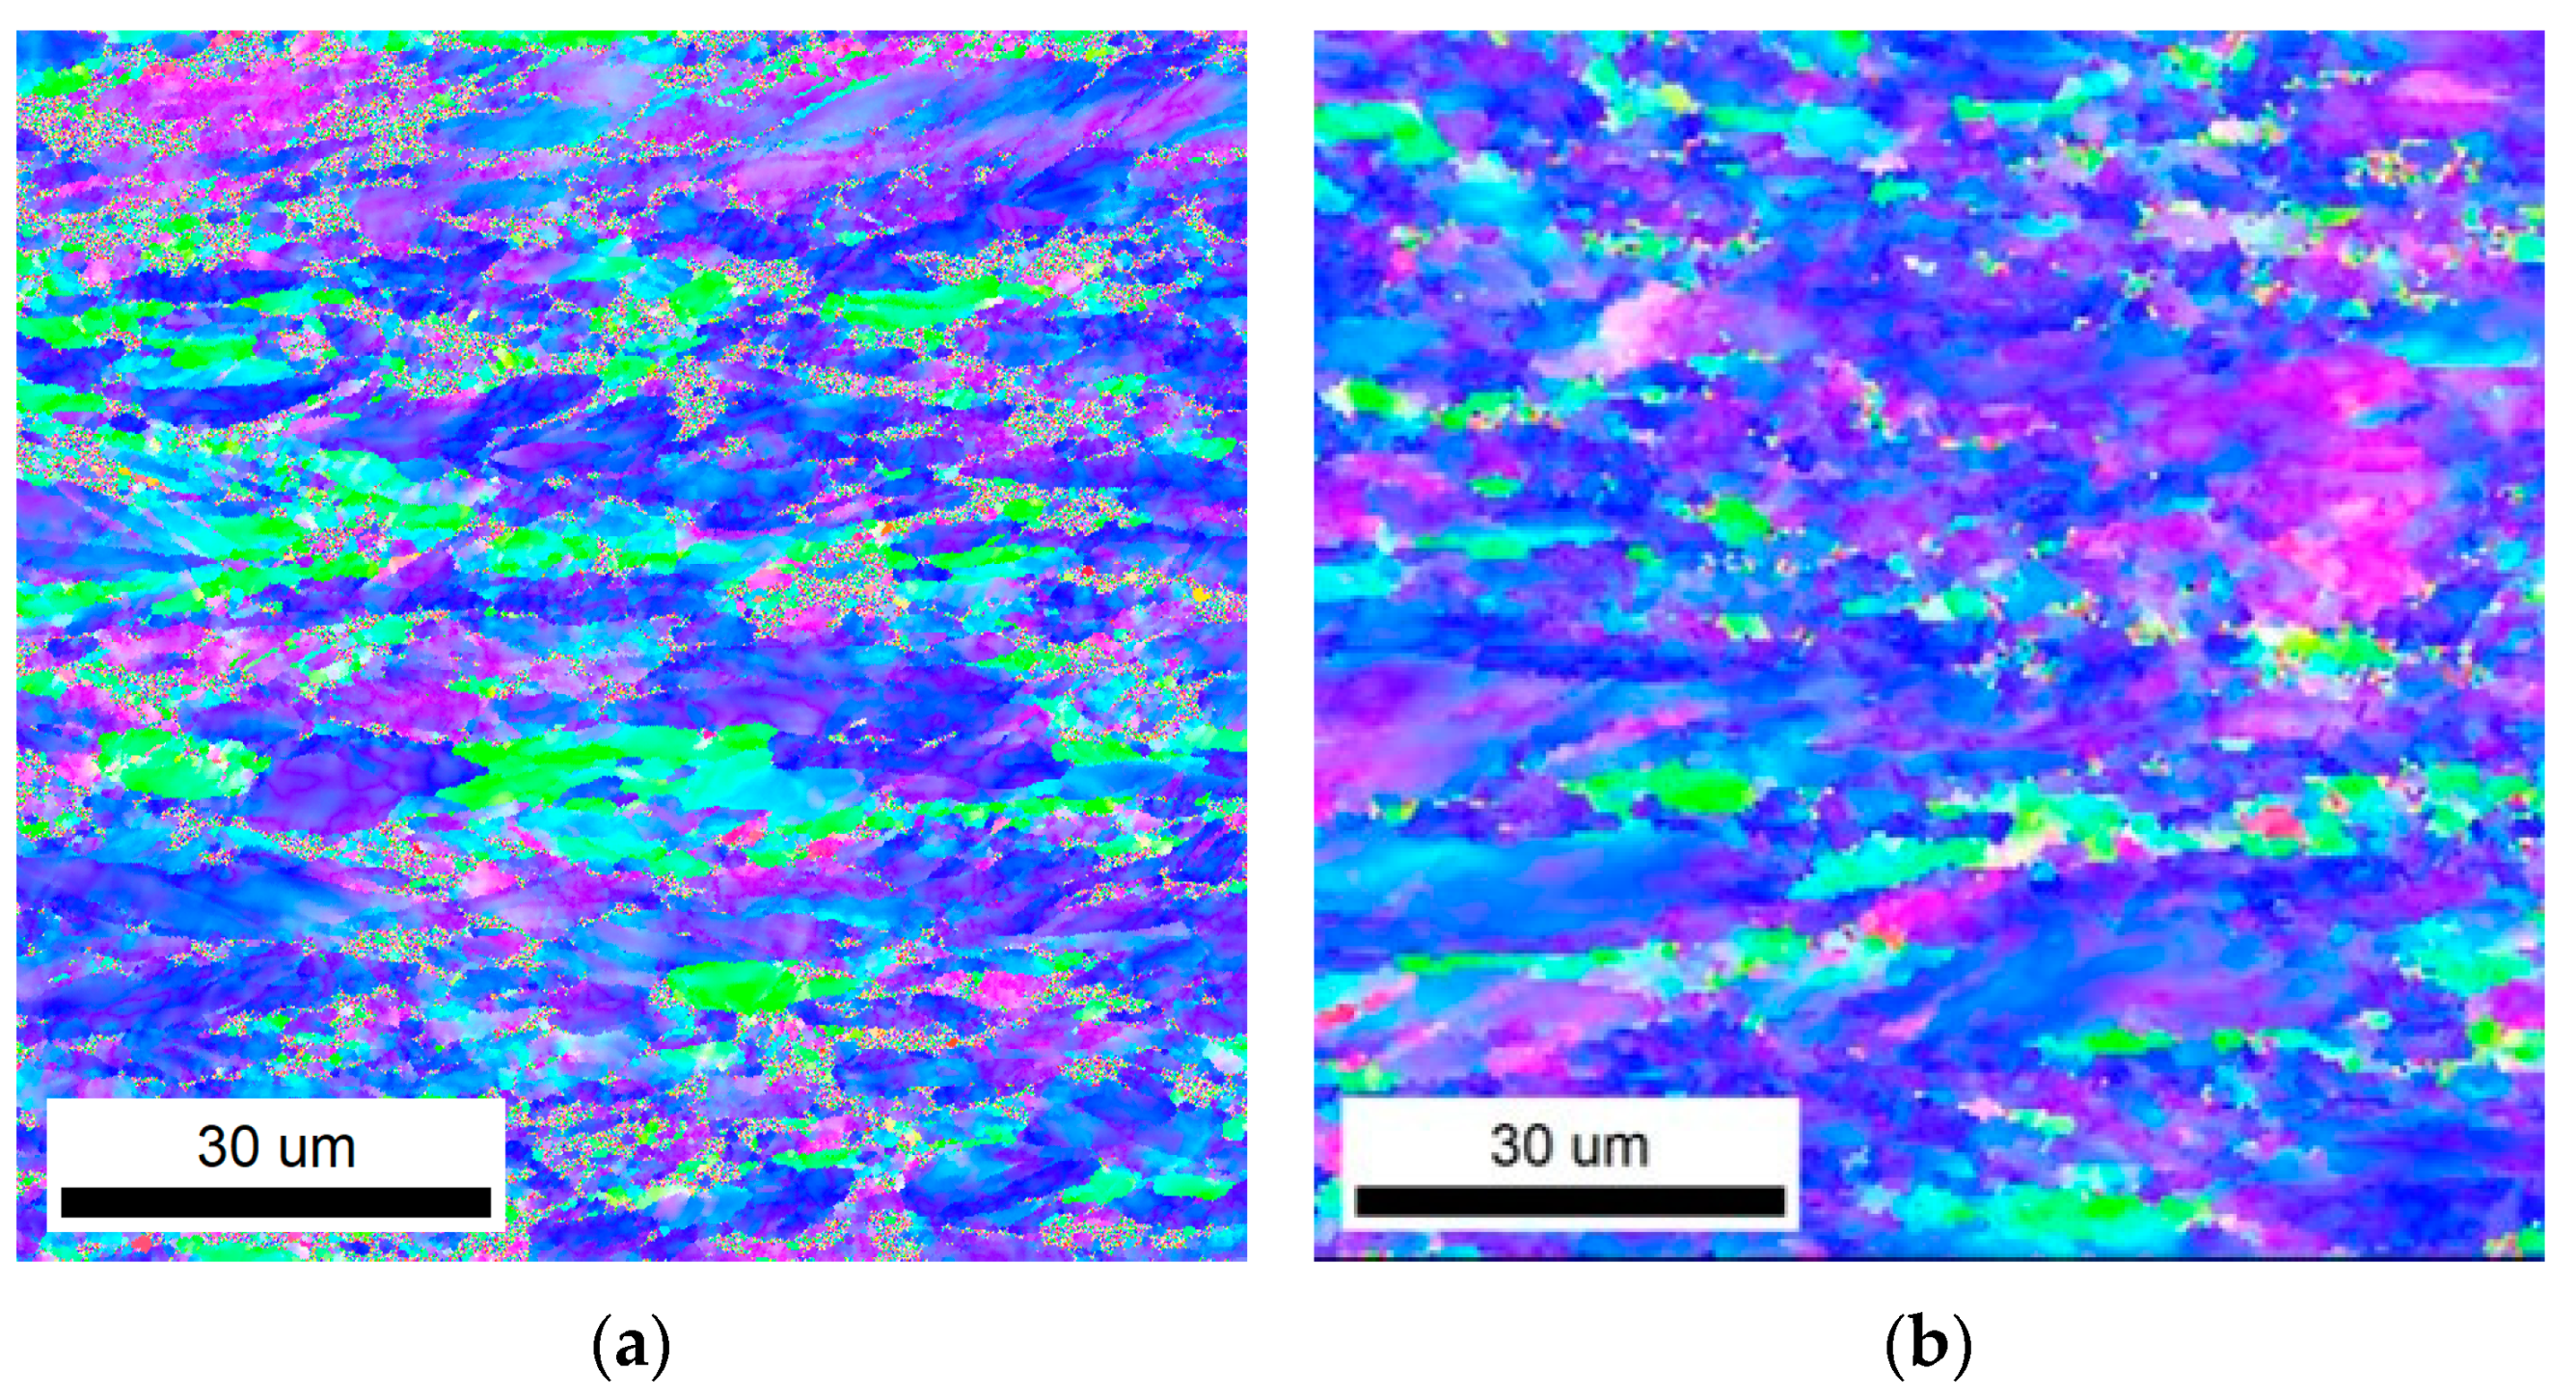
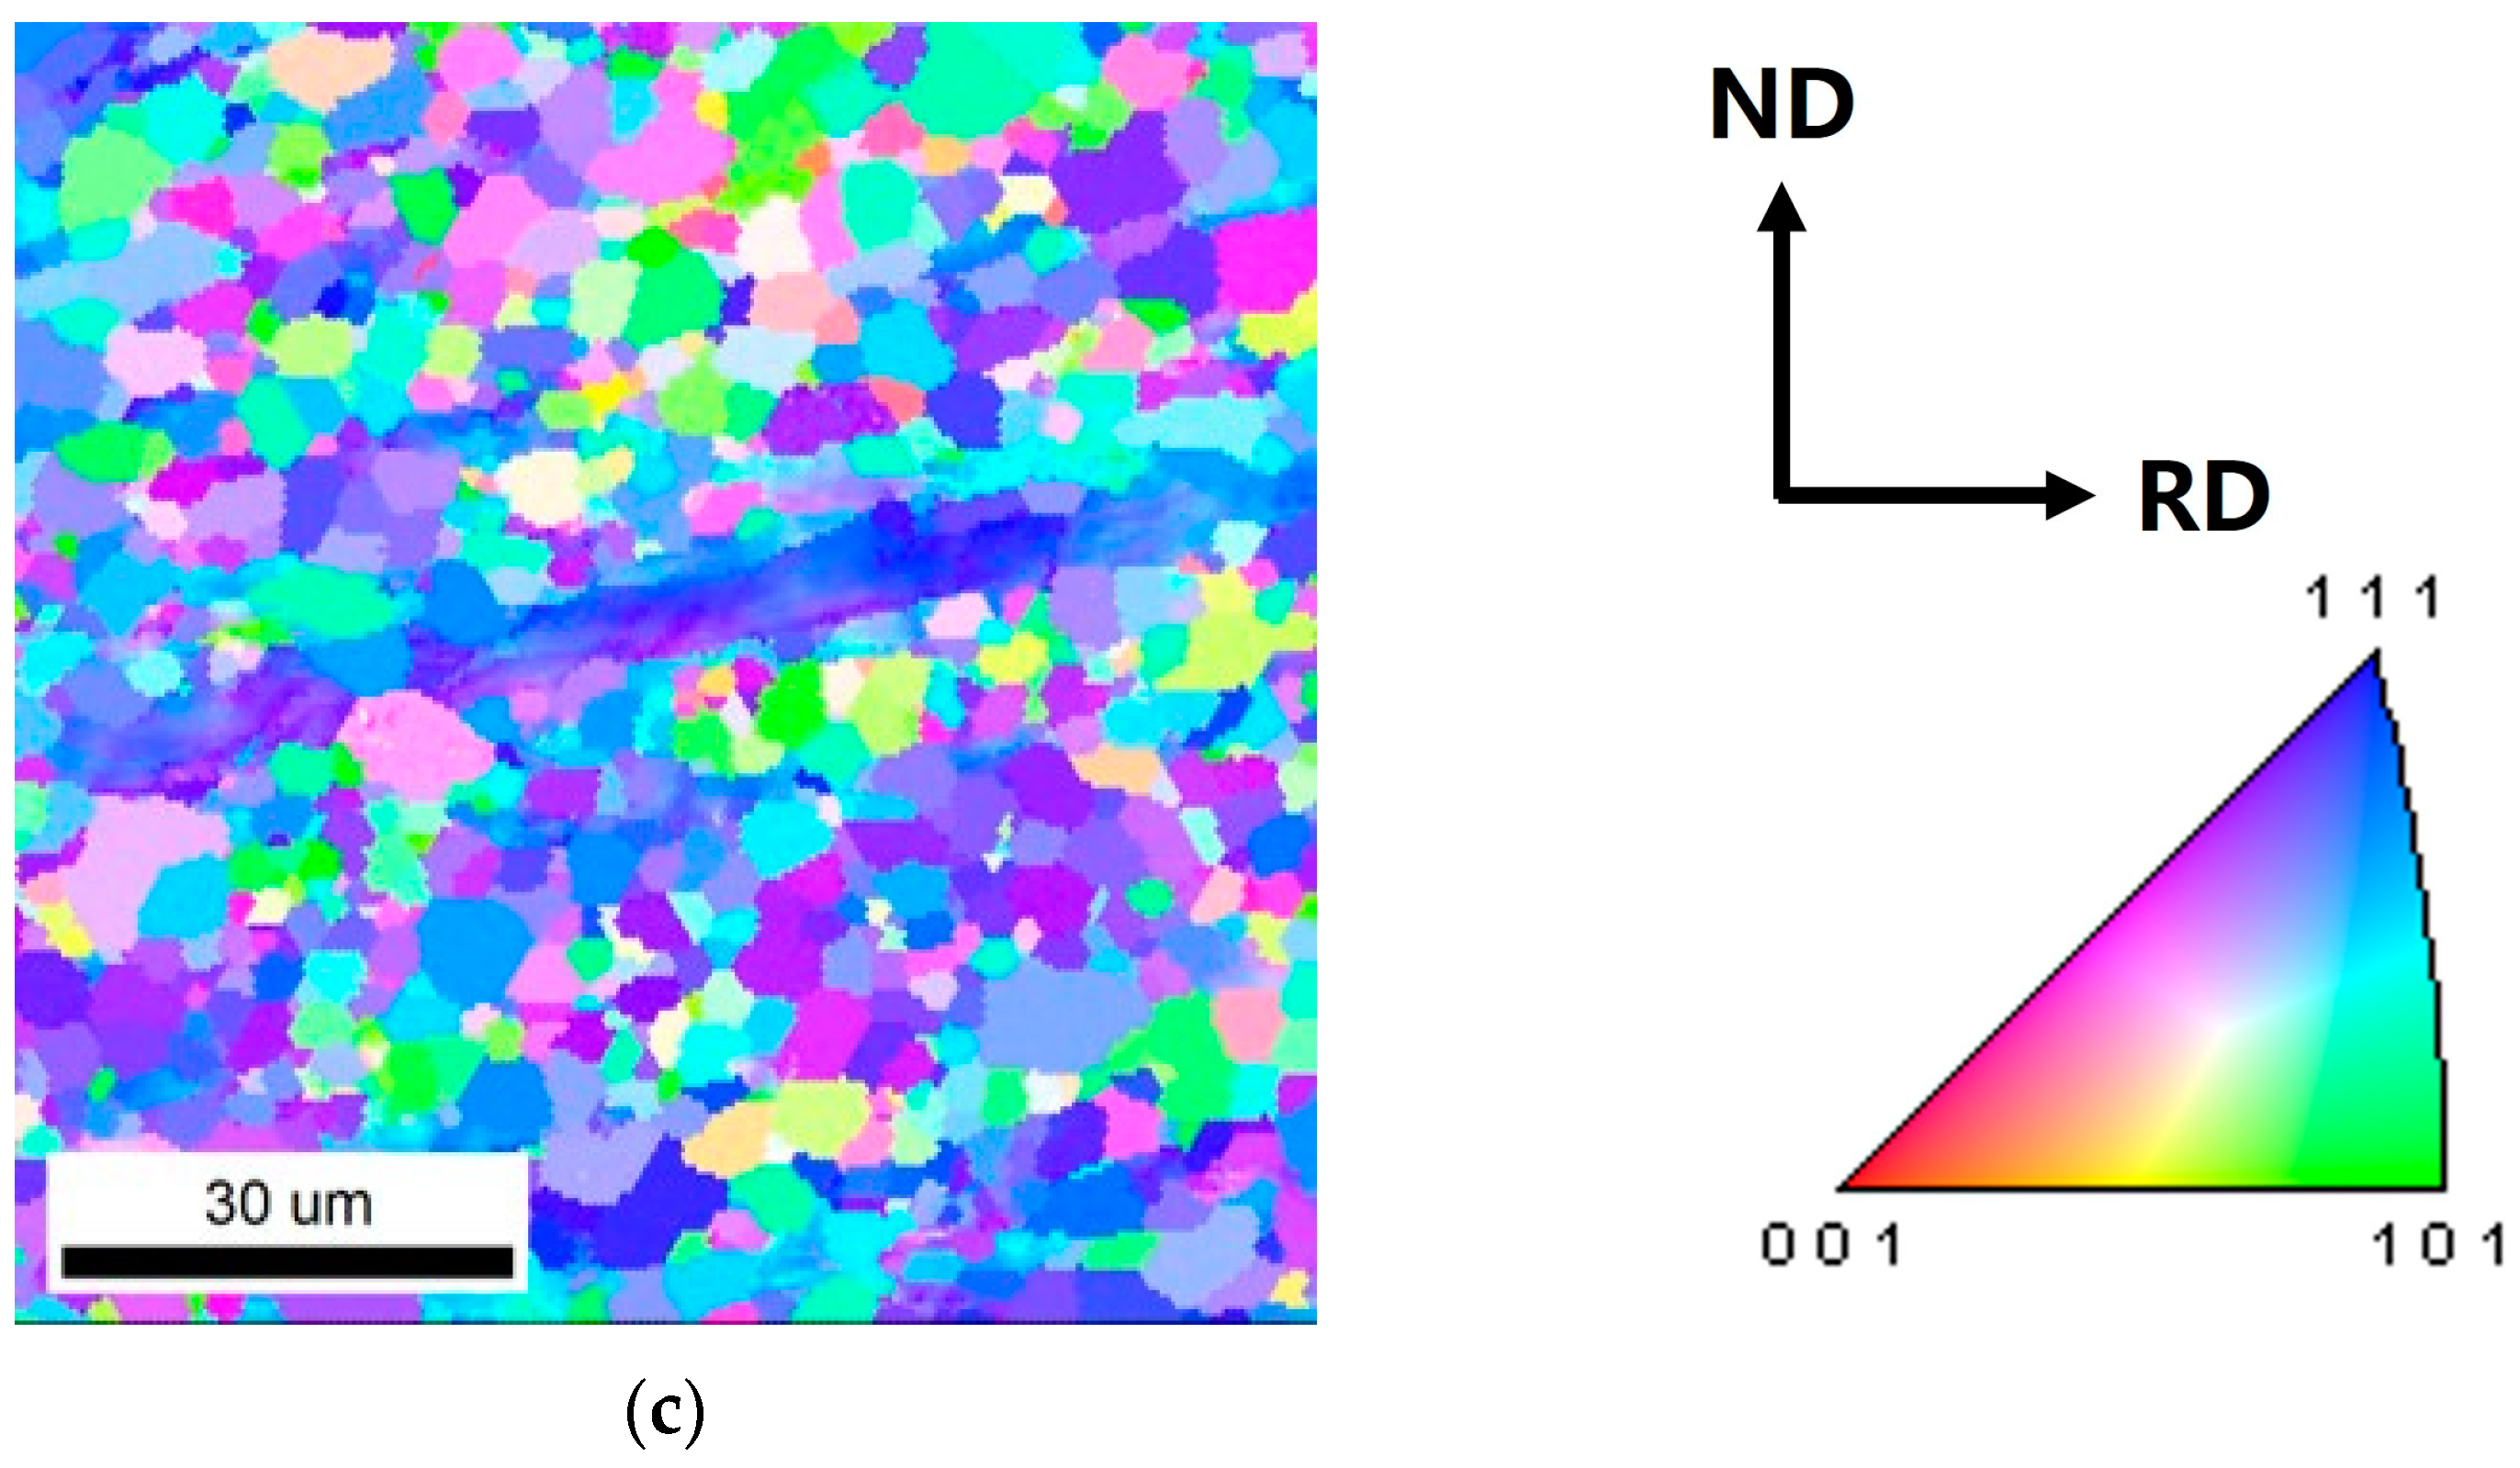
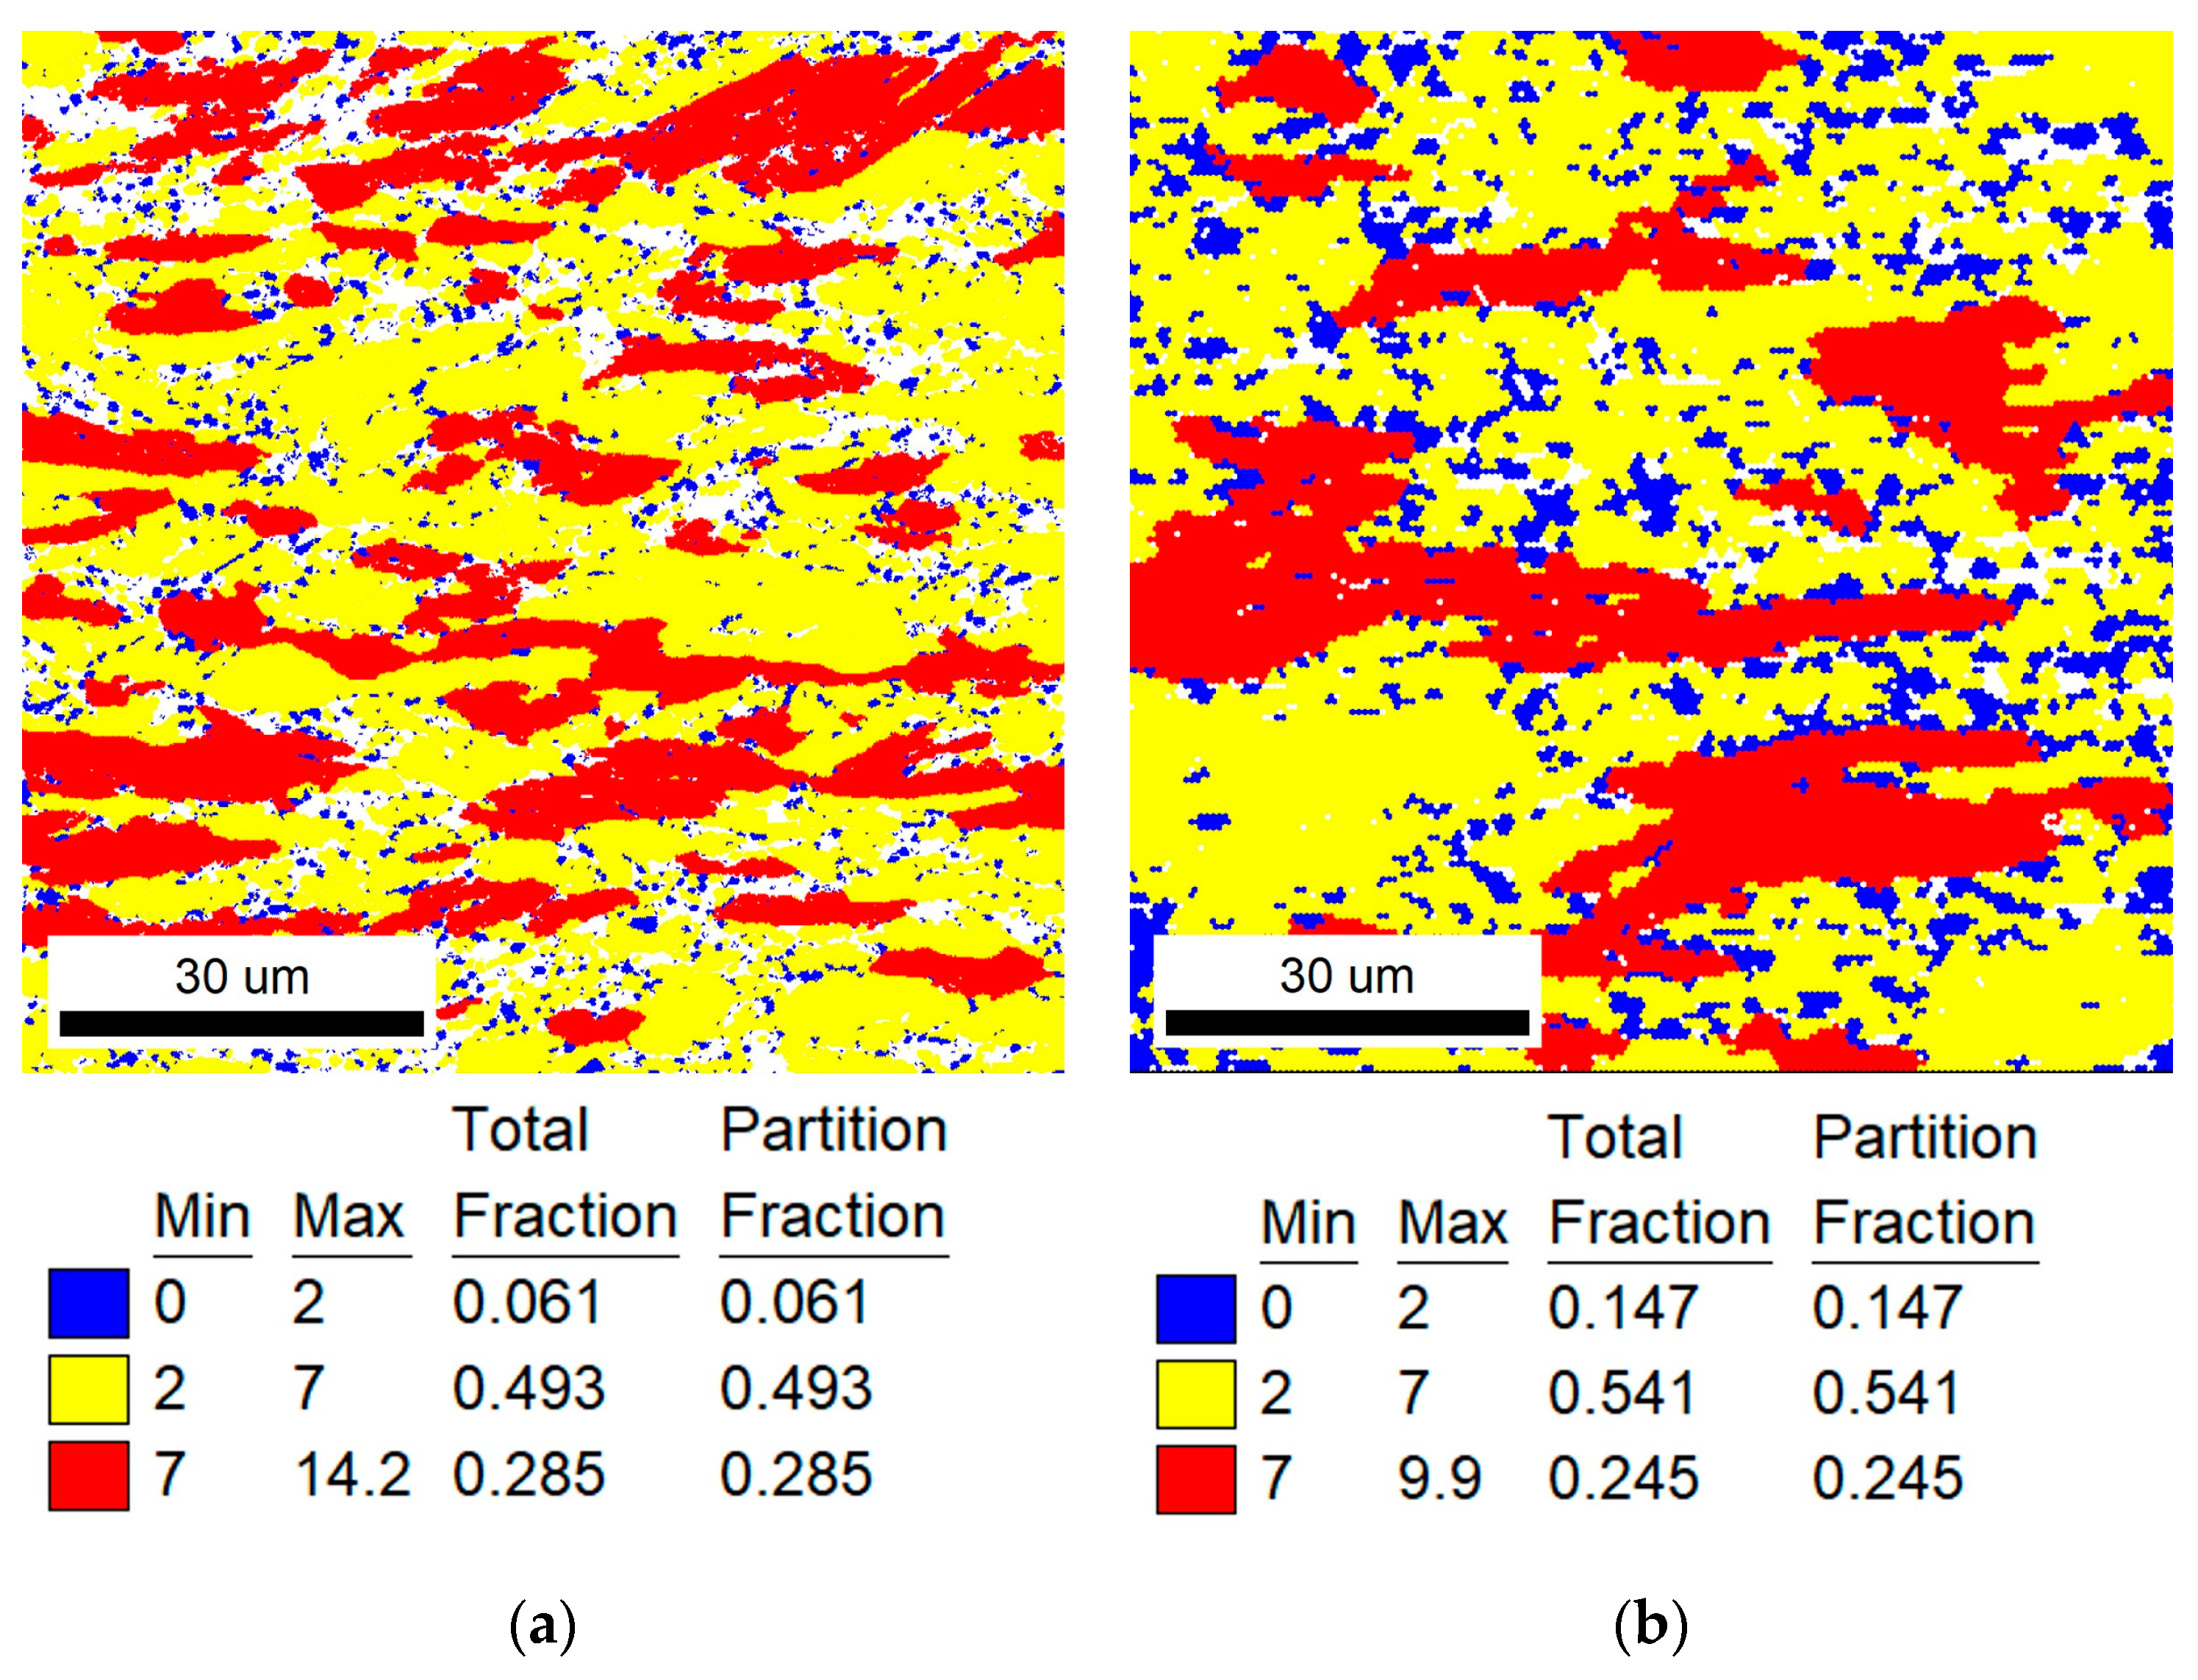
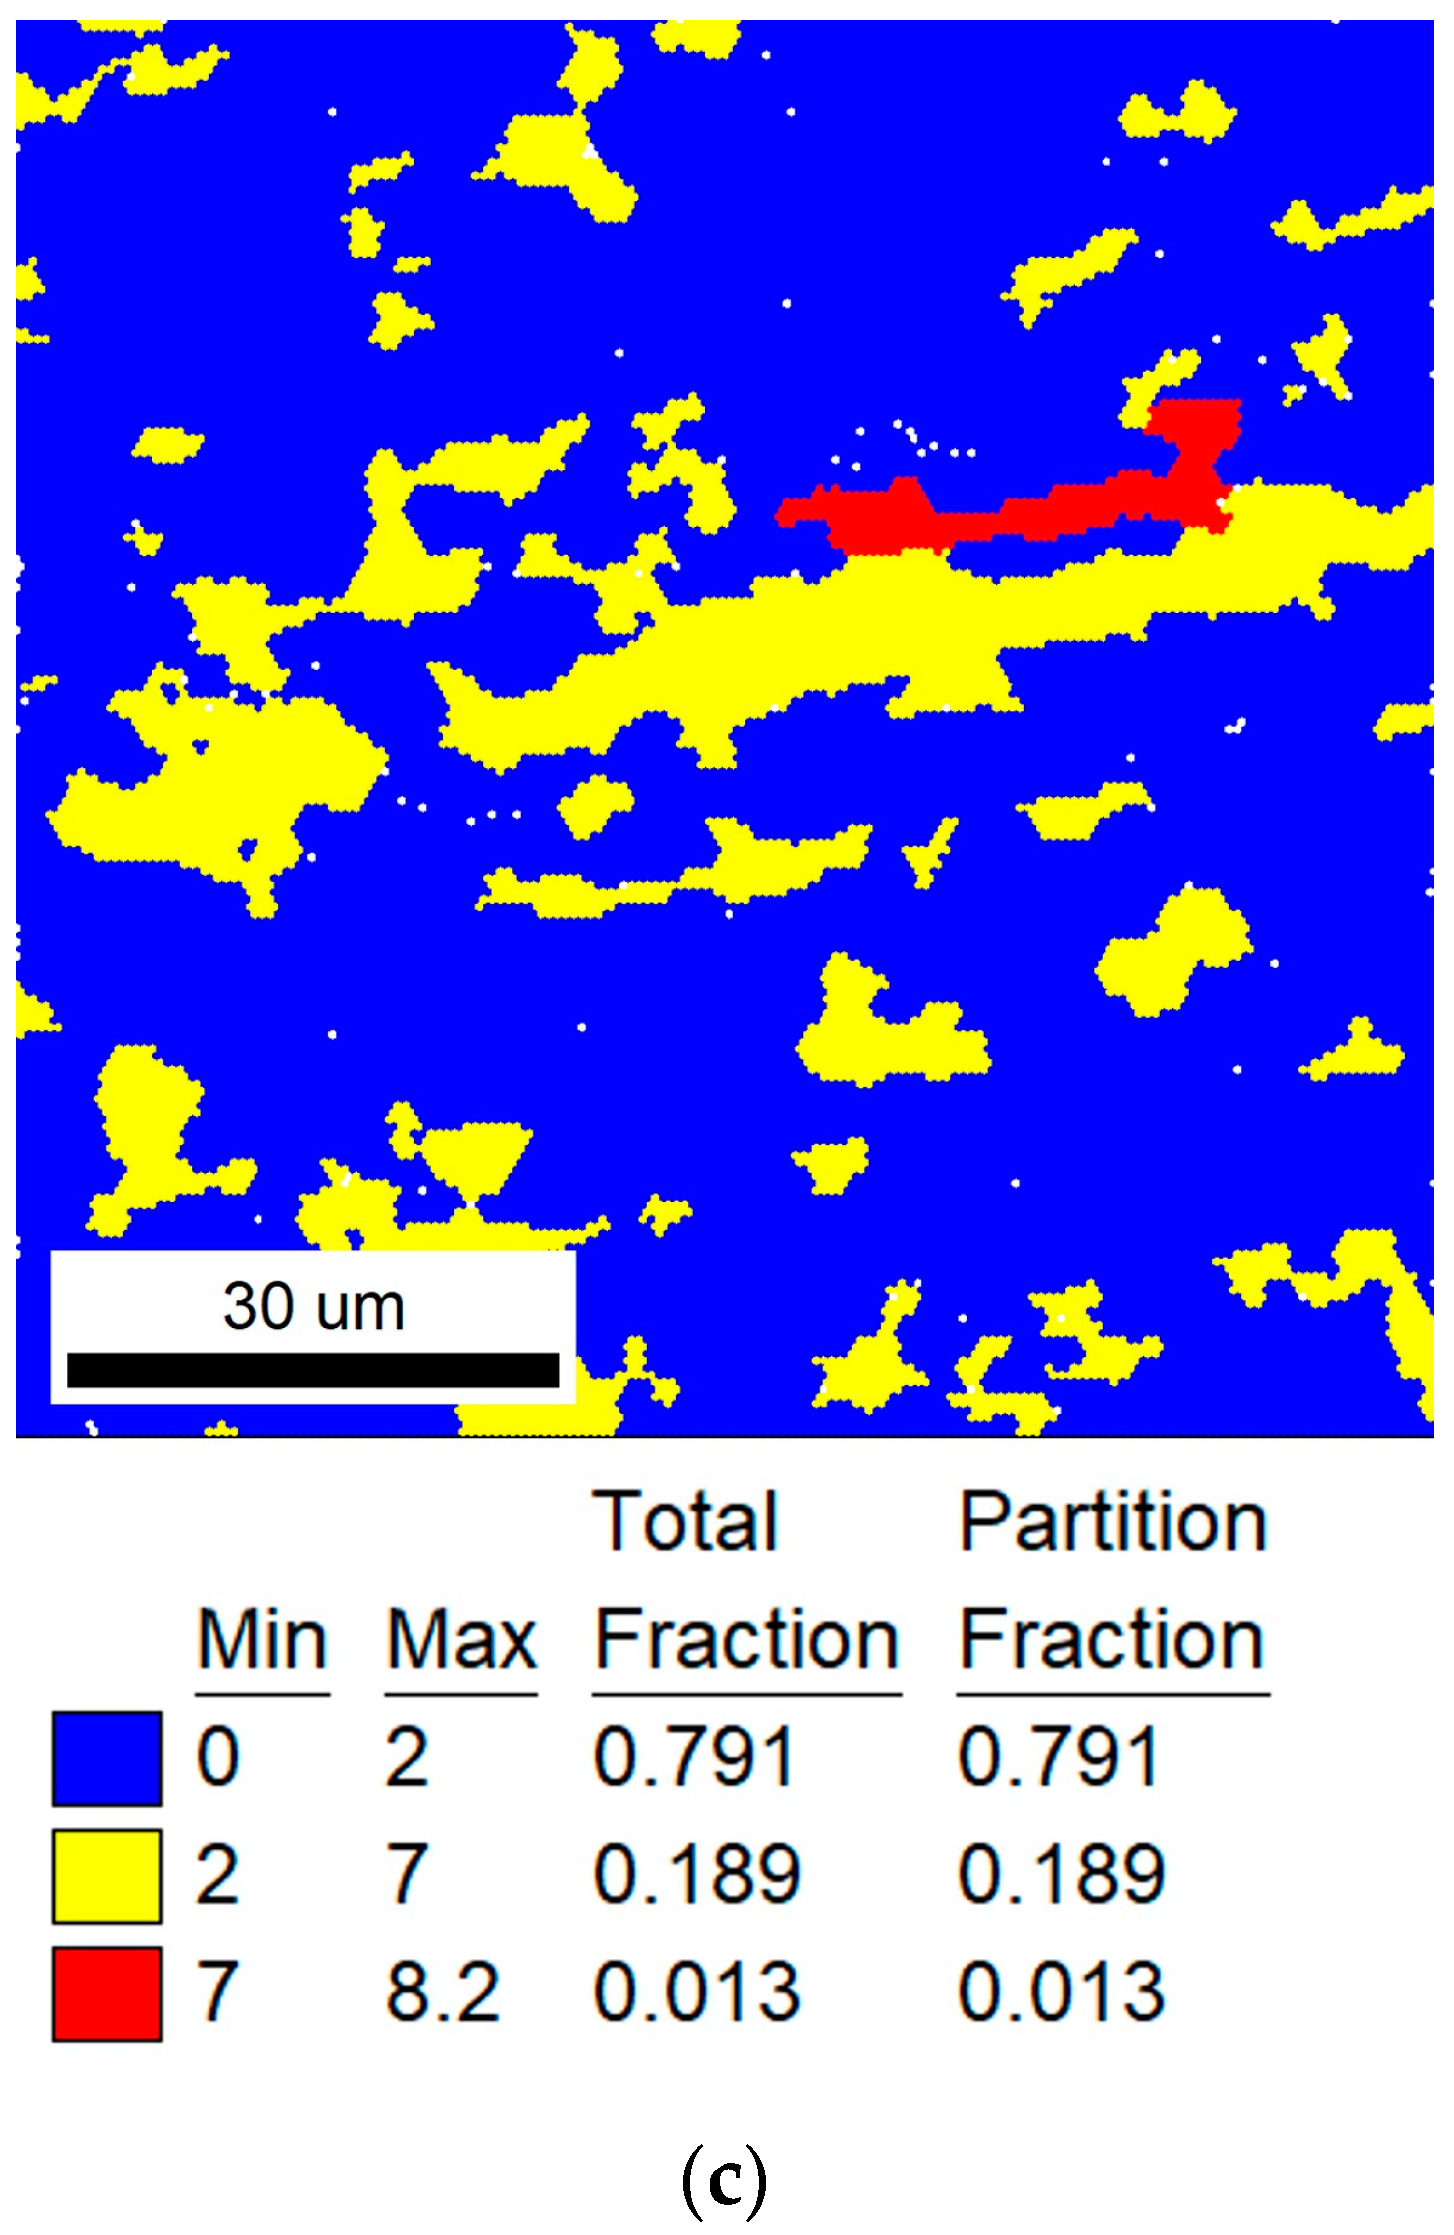
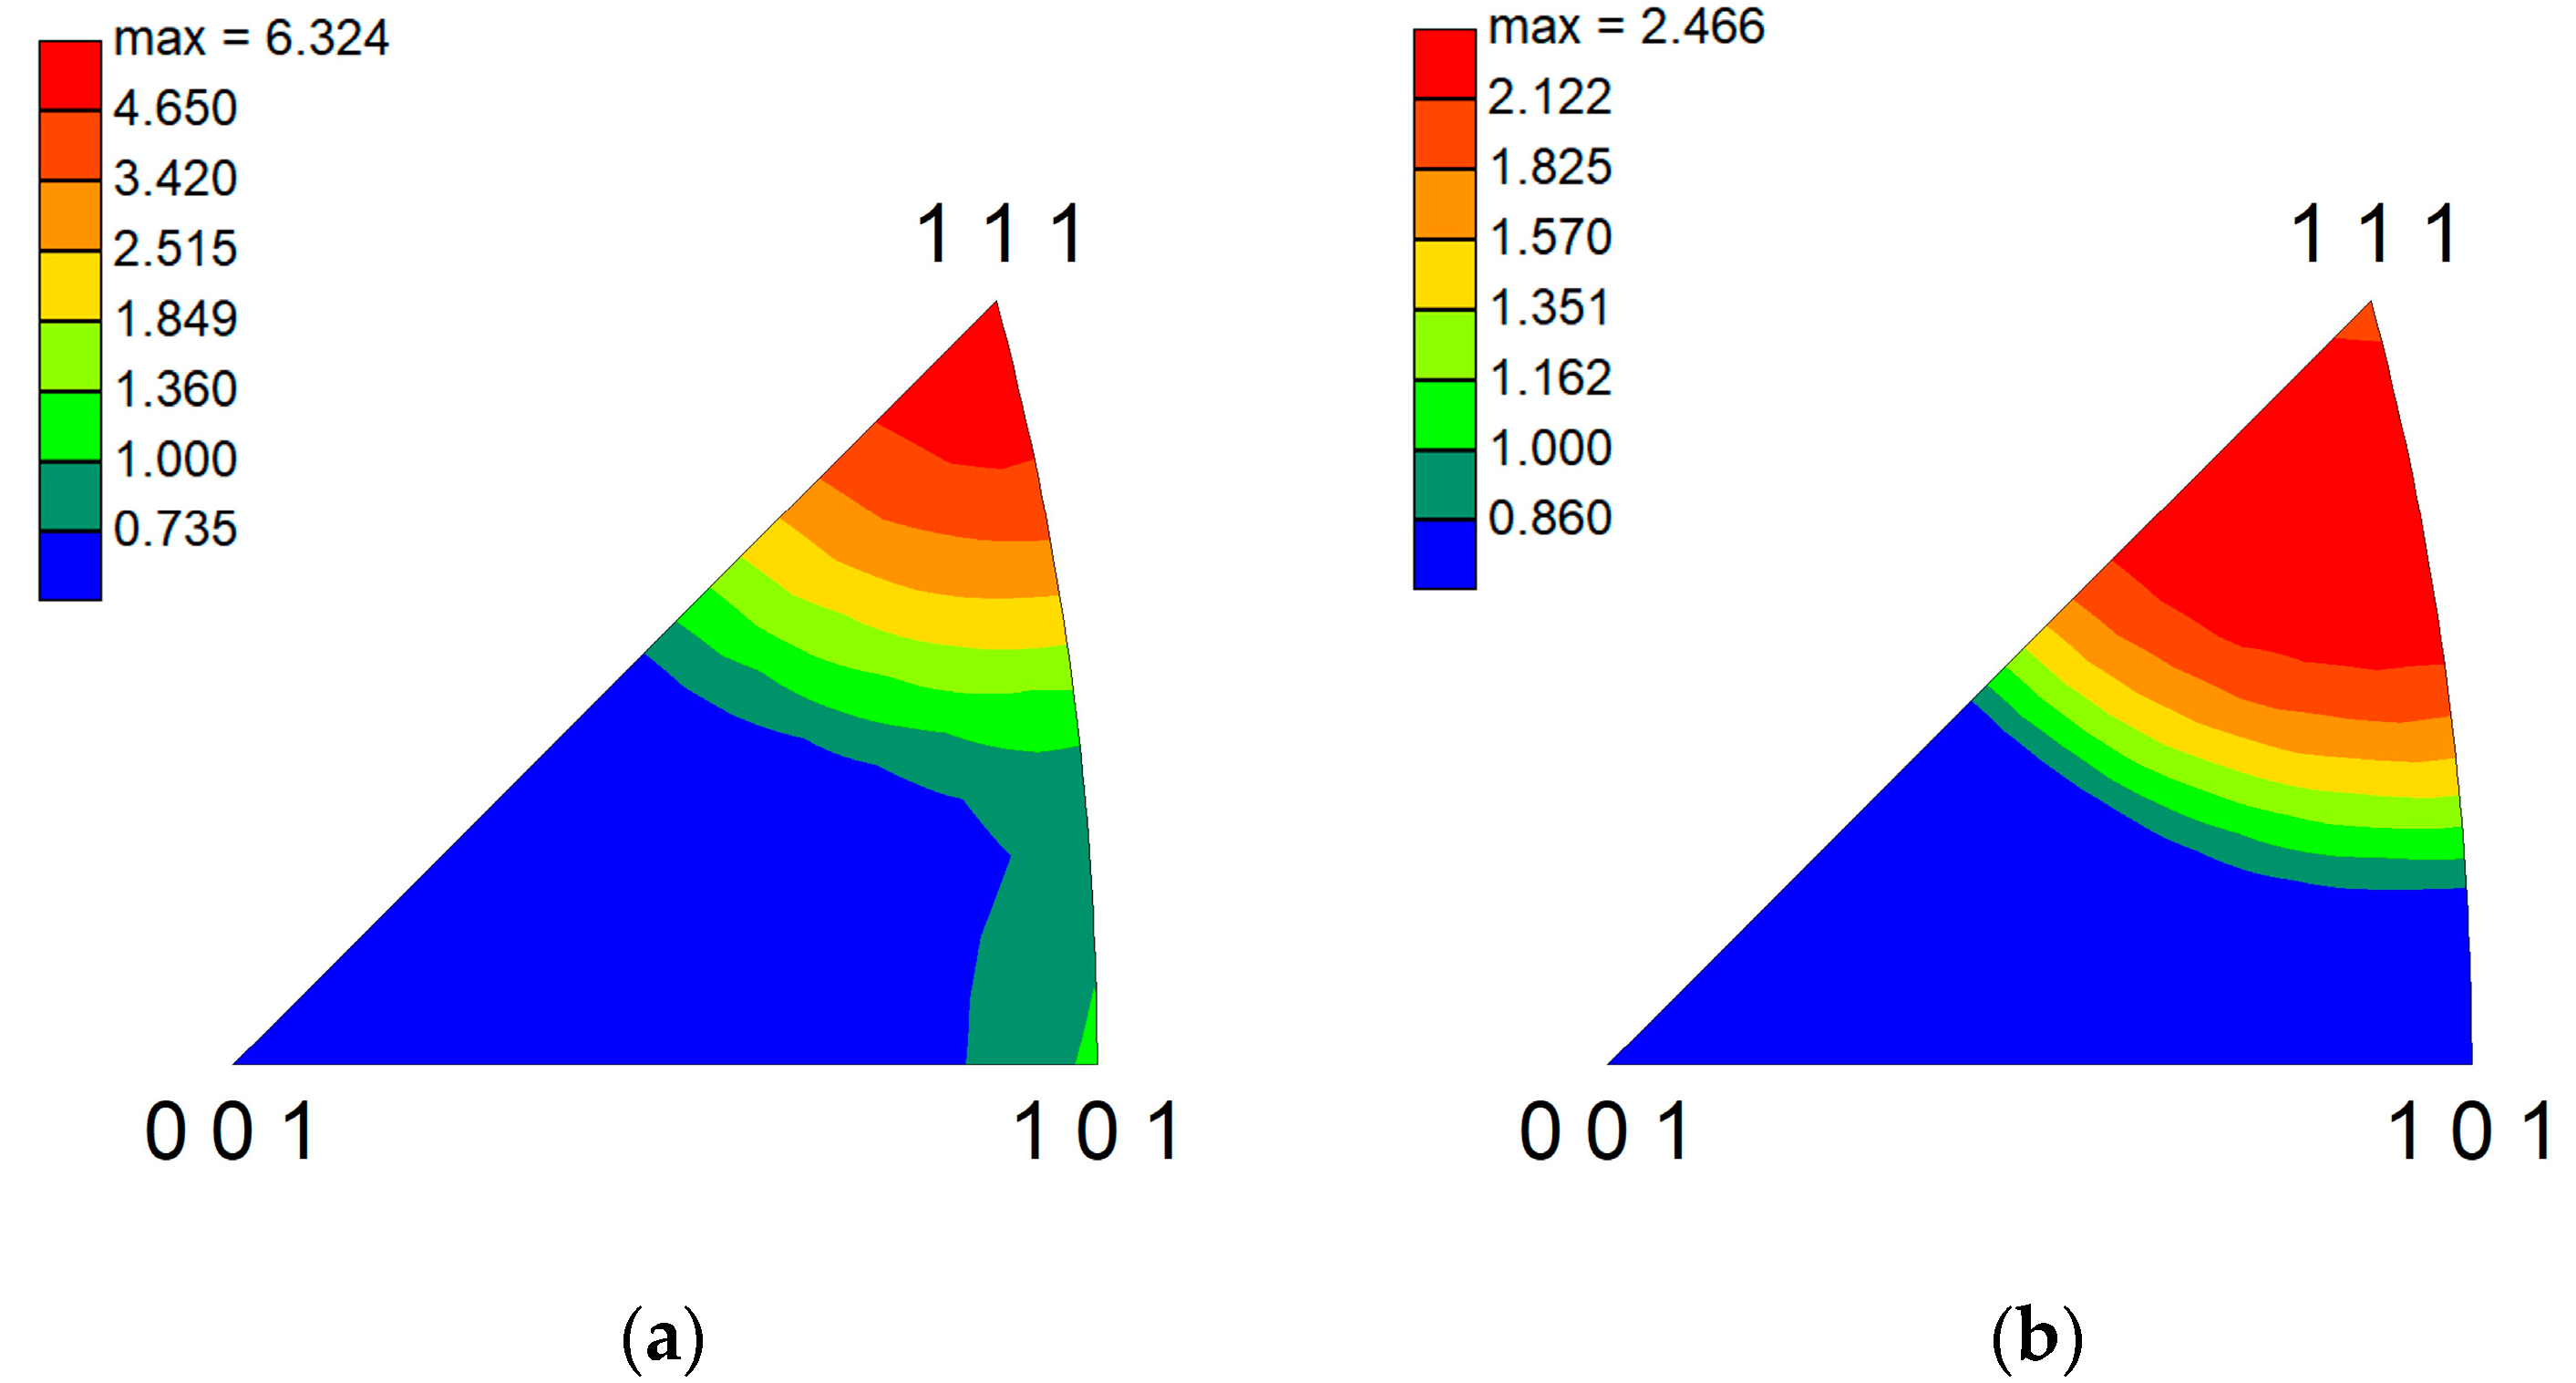
3.1. Microstructure Observations
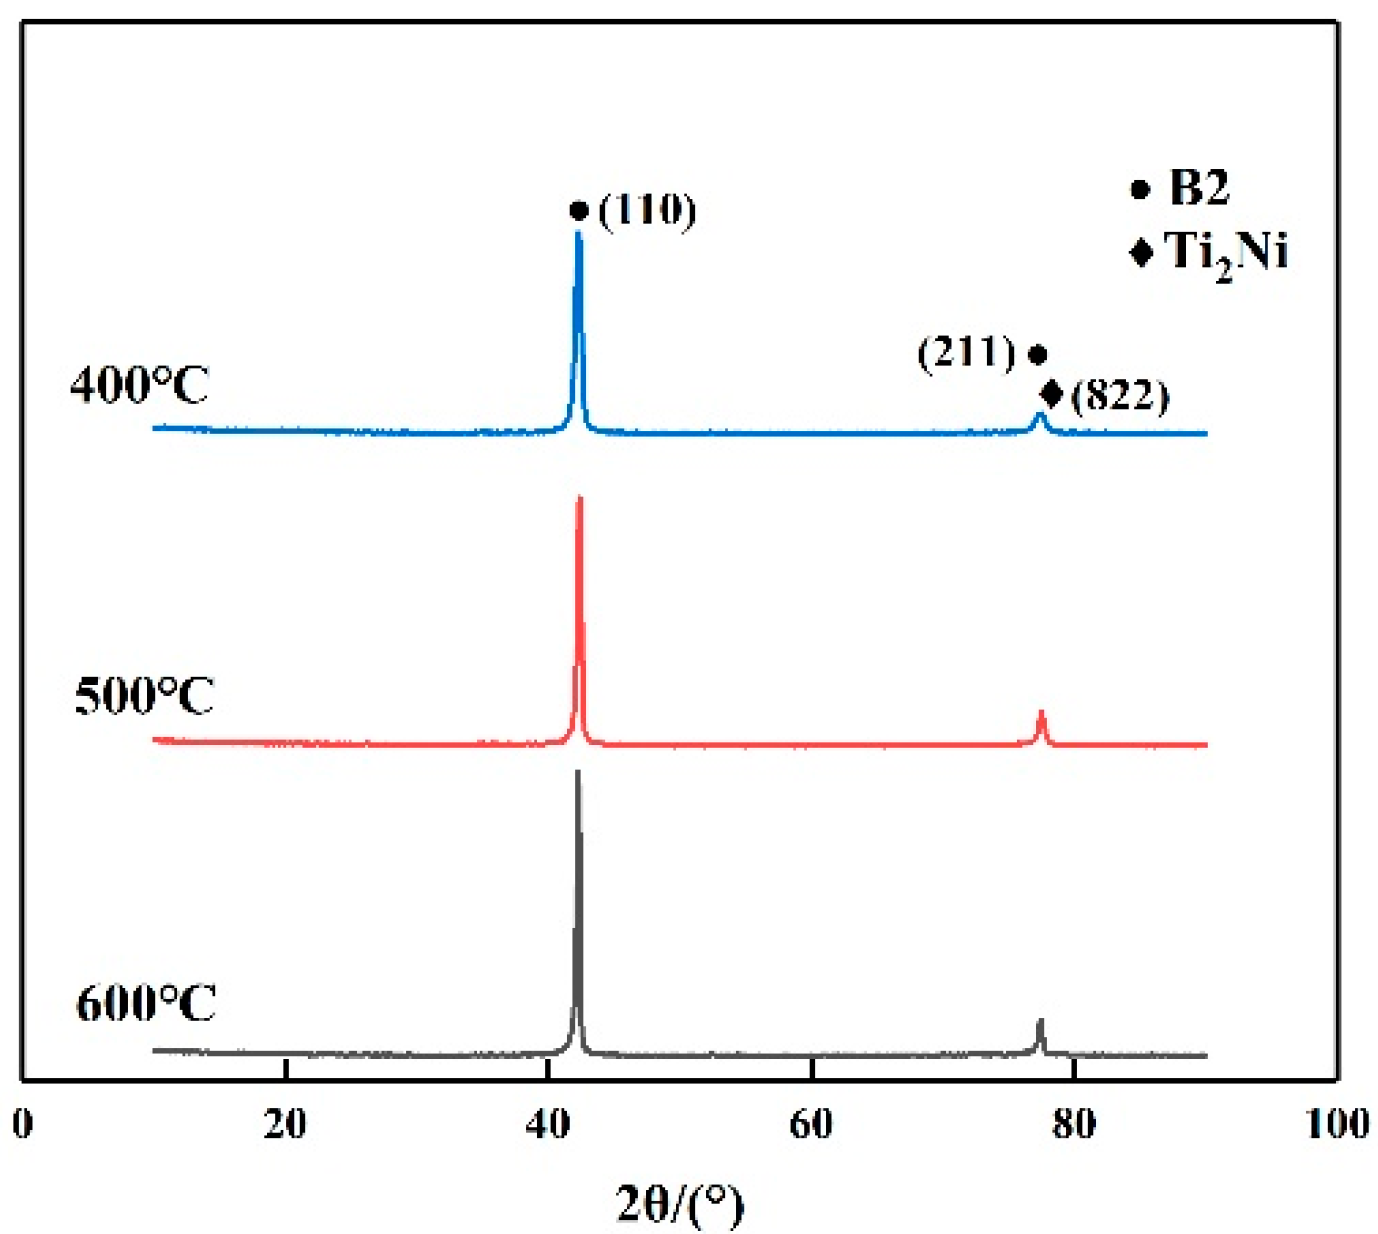
Figure 2 shows the microstructures of the alloy after annealing at different temperatures. When the annealing temperature is 400 °C, the alloy shows a long strip-shaped deformation structure with a large aspect ratio, as shown in Figure 2a. And the same structure can also be observed when the annealing temperature is 500 °C, as shown in Figure 2b. When the annealing temperature increases to 600 °C, most of the regions exhibit fine equiaxed grains, and a small amount of long strip-shaped deformation structure still remains, which indicates that a large range of recrystallization occurs, as shown in Figure 2c. When the annealing temperature is further increased to 800 °C, as shown in Figure 2e, the specimen shows a full equiaxed structure, and the grain size grows and becomes homogenized, indicating that complete recrystallization occurs. The average grain-size variation of the alloy is shown in Table 2. When the annealing temperature is 600 °C, the alloy undergoes a recrystallization process, and the size of fine recrystallized grains may be smaller than that of deformed grains. When the annealing temperature rises to 800 °C, the grains grow significantly due to the high heat input.
Through annealing for 60 min, the alloy will undergo recrystallization at 600 °C, and the recrystallized grain size is extremely fine. This is due to the large deformation and severely broken grain, introduced by cold working and leading to a high deformation-stored energy in the cold-rolled alloy. Thus, a large amount of stored energy remains after the recovery process at lower temperatures, leading to recrystallization occurring at 600 °C. After the recrystallization process, the misorientation angle between adjacent grains is large, the migration speed of the grain boundary is high, and, with the increase of the temperature, the internal energy of the grains is higher, resulting in the migration of the grain boundary and the devouring of grains under various effects.
It is worth noting that a large number of second-phase particles can be observed near the grain boundaries and within the grains, as shown in Figure 2. The appearance of the precipitates does not significantly change as the annealing temperature increases. The composition of the black phase, as shown in Figure 3a, is determined by EDS as Ti-32Ni-2Fe (at. %). From Figure 3b, the particles show an overall oval shape. Additionally, the corresponding selected area electron diffraction (SAED) in Figure 3b can be indexed as an FCC structure with a lattice parameter a = 1.13 nm. Accordingly, the second phase in the alloy is constituted by Ti2Ni particles.
The inverse pole figures (IPFs) of annealed Ti50Ni47Fe3 alloys were characterized via EBSD, as shown in Figure 4. One can see that with the increase of the annealing temperature, the alloy grains gradually change from long stripe shapes after cold deformation to a fine equiaxed structure. When the annealing temperature is 400 °C, the alloy shows the deformation structure to be elongated along the rolling direction. With the annealing temperature reaching 500 °C, recrystallized grains can be found at the grain boundaries of the deformed grains, but the recrystallized grains are extremely fine. When the temperature is further raised to 600 °C, under the influence of external heat input, the recrystallization process is almost completed, recrystallized grains at the grain boundaries expand into deformed grains, and the recrystallization process is intense; however, there are still a few non-recrystallized grains inside the alloy at this time, as shown in the box in Figure 4c.
With the EBSD analysis of annealed Ti50Ni47Fe3 alloys, the GOS maps are shown in Figure 5. The deformation stress state existing inside the individual grains is still high when the annealing temperature is 400 °C; additionally, the recovery process is not fully carried out. As the annealing temperature reaches 500 °C, the alloy is at the end of the recovery process and the beginning of the recrystallization process. Under these conditions, due to the high energy at the grain boundaries, subgrain nucleation can easily occur, and the recrystallized grains are preferentially nucleated at the deformed grain boundaries with a high stored energy. With the annealing temperature augmenting to 600 °C and above, the internal deformation-stored energy of the alloy is almost released, at this time the stress level and dislocation density are at a low level, and most of the internal microstructures of the alloy are fine recrystallized grains.
The inverse pole figures along the rolling direction for the annealed Ti50Ni47Fe3 alloys are shown in Figure 6. The texture of Ti50Ni47Fe3 alloys annealed at 400 °C, at which temperature the recovery process is not fully carried out, is <111>//RD and <110>//RD with the highest intensities of 6.32 and 1.04. When the annealing temperature reaches 600 °C, with the recrystallization of Ti50Ni47Fe3 alloys, the <110>//RD texture disappears, and the intensity of <111>//RD texture decreases to 2.47. This is because the higher annealing temperature causes the recrystallization process, and the cold-deformed structure transforms into fine equiaxed grains, resulting in a decrease of the texture intensity.

3.2. XRD Analysis

The phase and structures of annealed Ti50Ni47Fe3 alloys were further investigated by XRD, as shown in Figure 7. It can be noted that the matrix of Ti50Ni47Fe3 alloy is B2 phase with a small amount of Ti2Ni phase, even if plenty of Ti2Ni phase can be observed from the SEM in the Ti50Ni47Fe3 alloy. With the increase of annealing temperatures, there is no significant change in the XRD patterns of Ti50Ni47Fe3 alloys, indicating that although Ti50Ni47Fe3 alloys undergo recovery and recrystallization at different annealing temperatures, there is no obvious change in phase compositions.

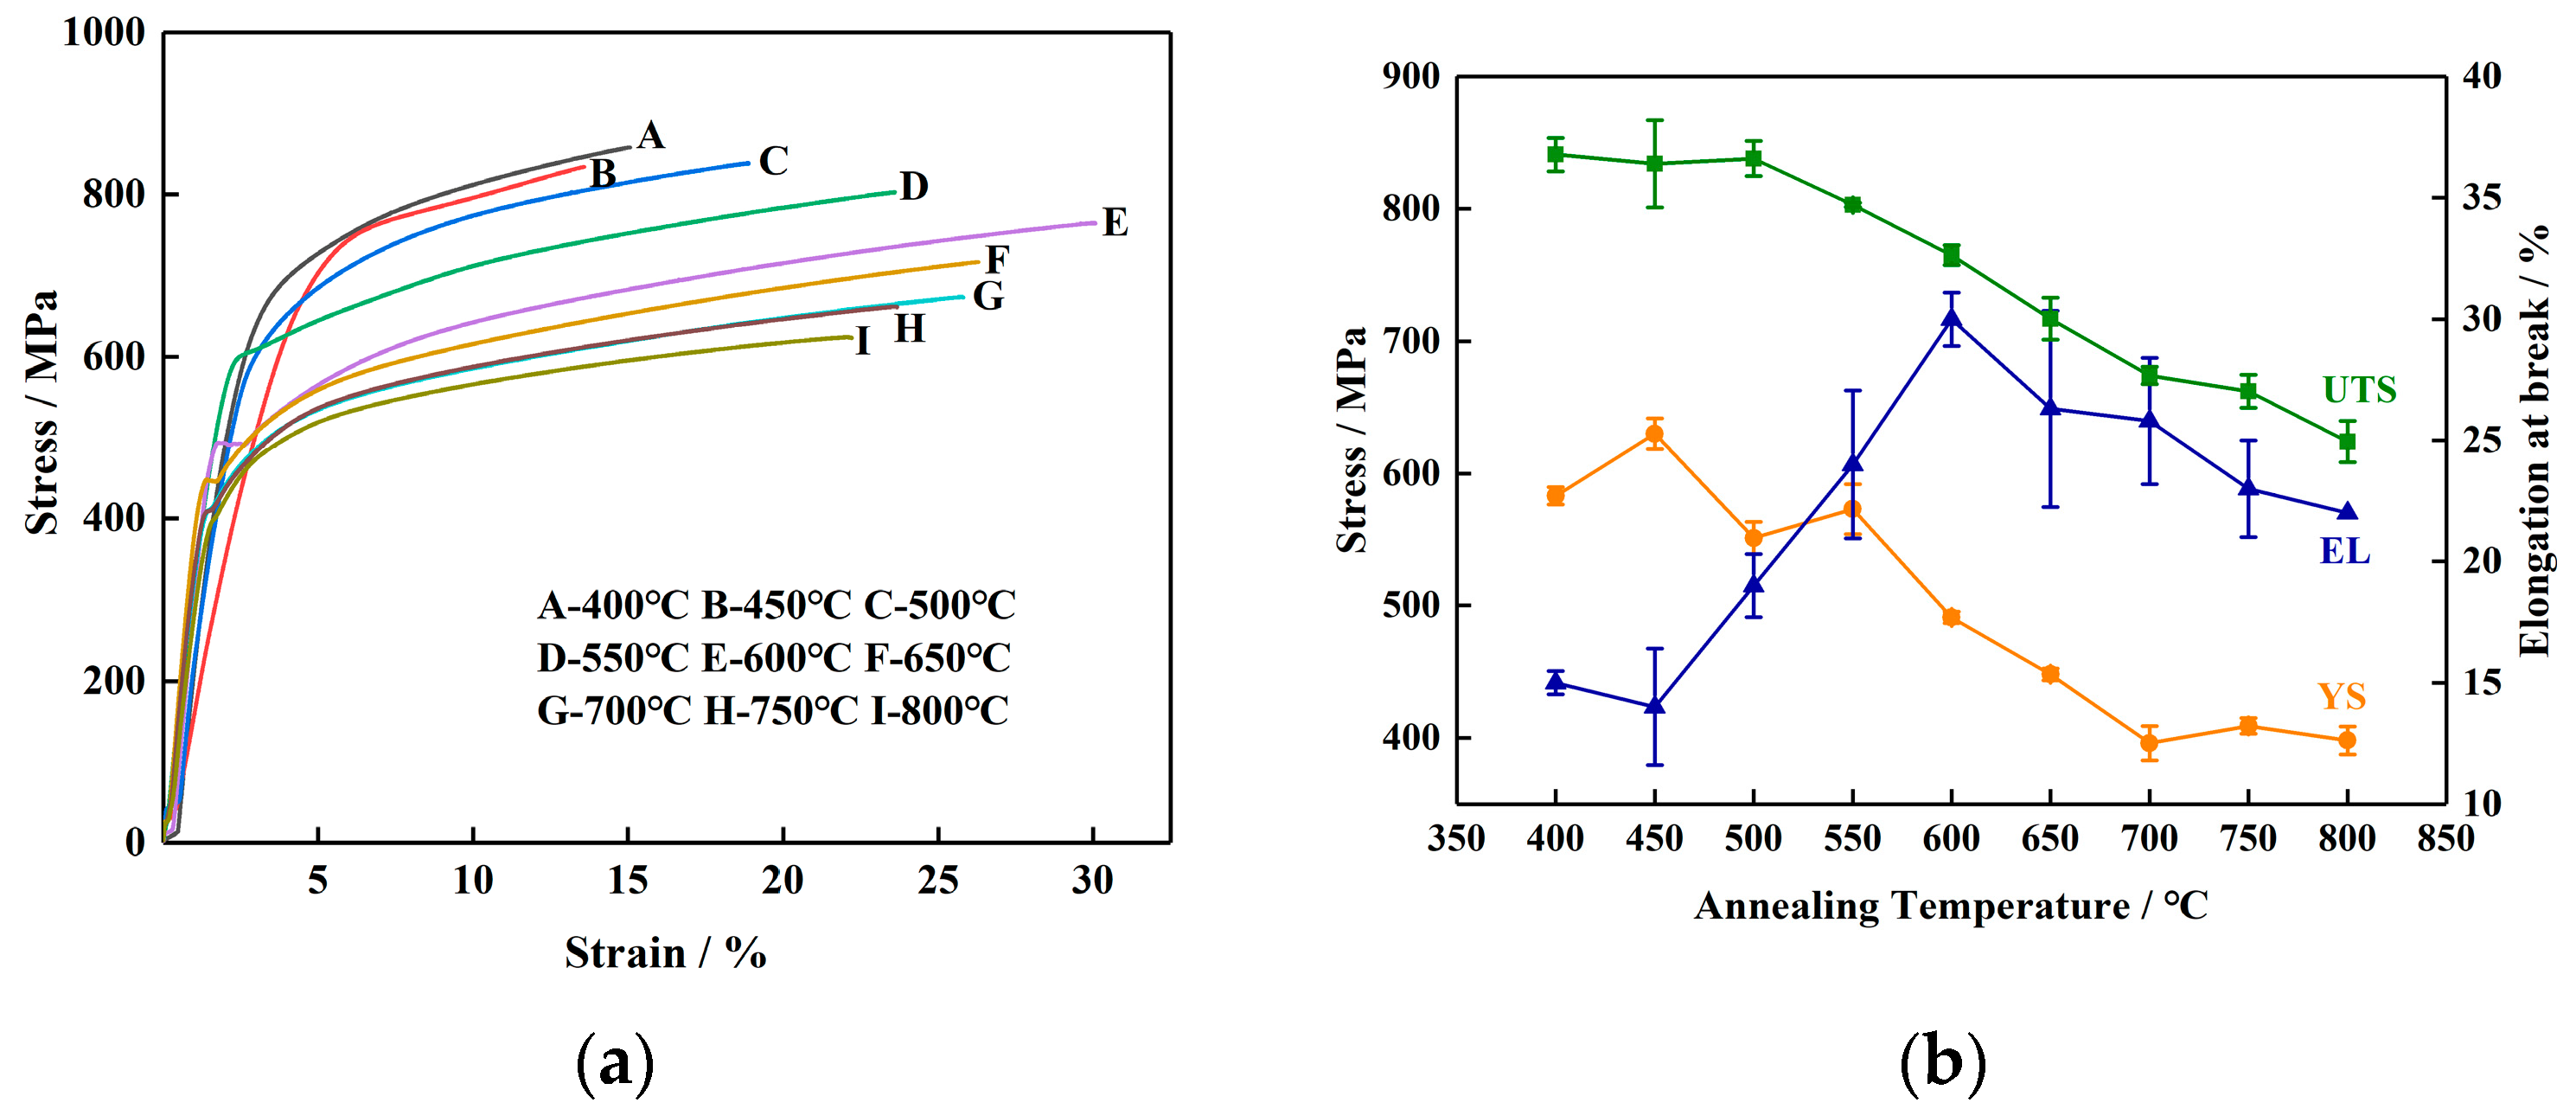
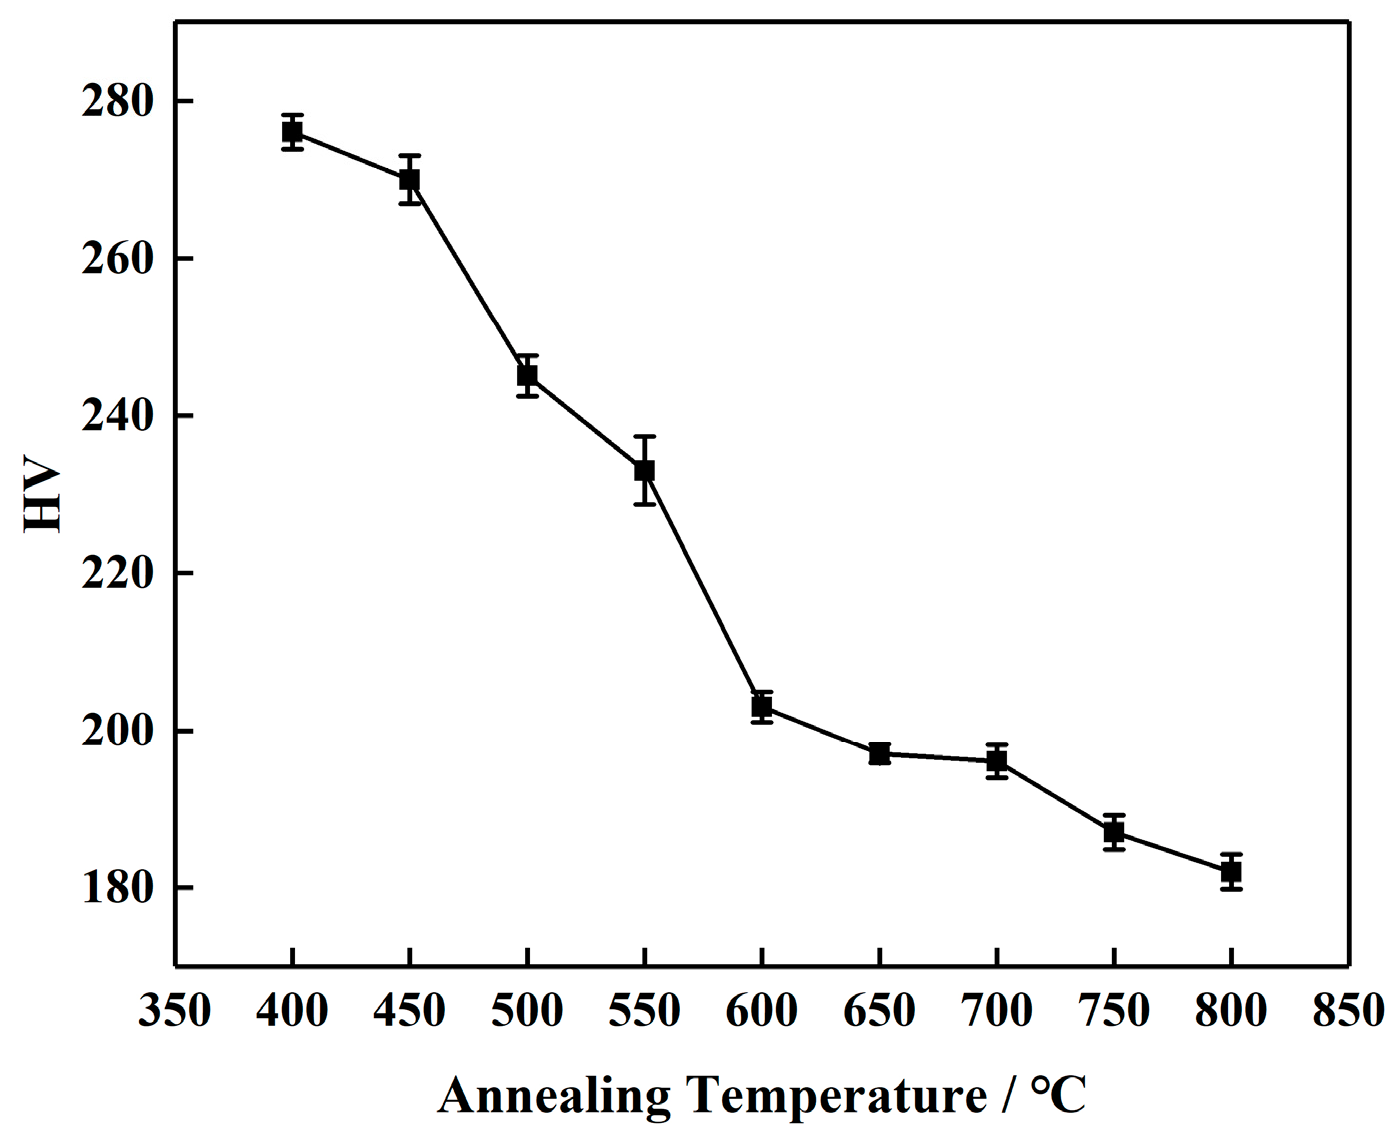
3.3. Mechanical Properties

Figure 8 shows the mechanical properties of the alloy at different annealing temperatures. From the stress-strain curves in Figure 8a, one can see that the tensile behaviors are dramatically affected by the annealing temperatures. Figure 8b illustrates the relationship between the tensile properties and annealing temperature, including the ultimate tensile strength (UTS), yield strength (YS) and elongation (EL). With the increase of annealing temperatures, both the UTS and YS of Ti50Ni47Fe3 alloy show a decreasing trend, while the EL first presents an increasing trend and then a decreasing one. This is because when the annealing temperature is low, the alloy is dominated by the recovery process, the dislocation density is still high, and a large internal stress field is in the alloy. Meanwhile, during the recovery process, the work-hardening phenomenon of the alloy gradually weakens. Therefore, the plasticity of the alloy increases significantly, and the strength of the alloy is still high. With the increase of the annealing temperature, the strength of the alloy decreases linearly, and the reduction rate of UTS is equivalent to that of YS. However, the maximum EL of Ti50Ni47Fe3 alloys occurs at 600 °C and then decreases dramatically. This is because when the temperature reaches 600 °C, severe recrystallization occurs, the internal dislocation density decreases, and the microstructure of the Ti50Ni47Fe3 alloy is dominated by fine equiaxed grains. When the annealing temperature exceeds 600 °C, the recrystallized grains in Ti50Ni47Fe3 alloys continue to grow with the increase of the annealing temperature, resulting in the reduction of both strength and plasticity.
Additionally, the curve of the annealing temperature and microhardness of the alloy in Figure 9 clearly shows that the microhardness decreases with the increase of the annealing temperature. Furthermore, the changing trend of the microhardness is consistent with the strength in general. It is worth noting that the hardness value drops sharply in the range of 400~600 °C and then slows down as the temperature further increases. This is related to the recrystallization and growth of grains, as revealed above.

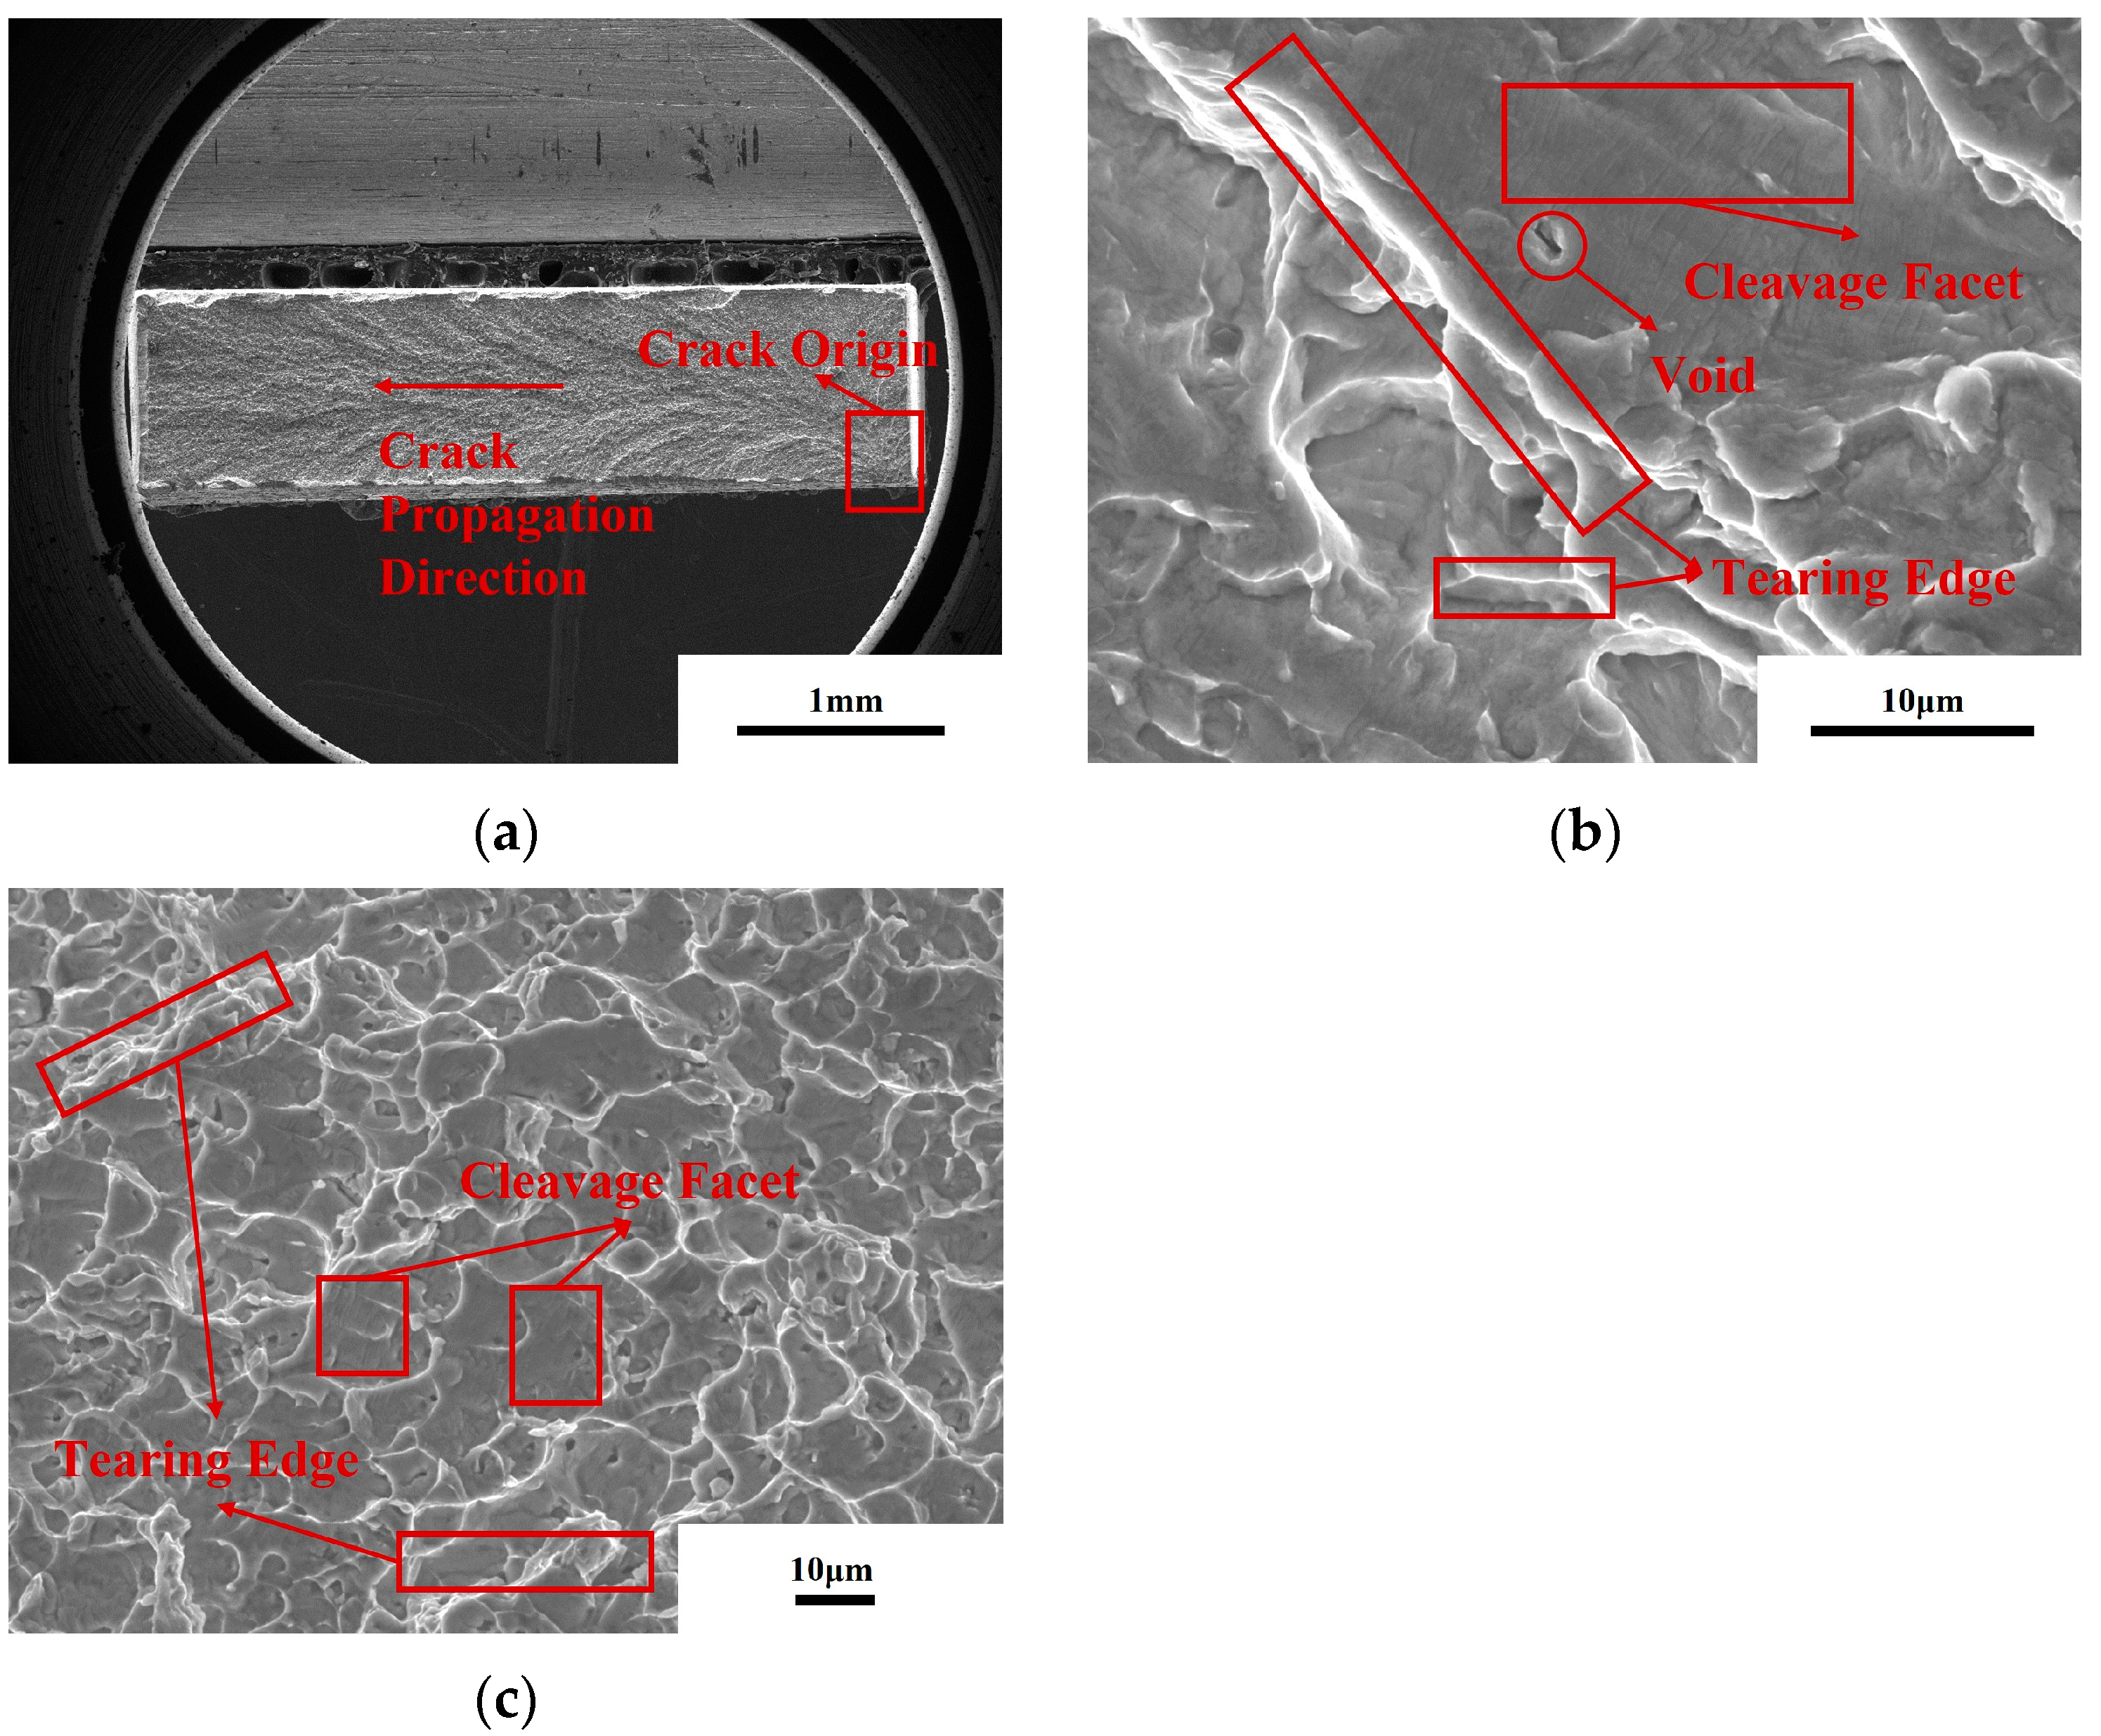
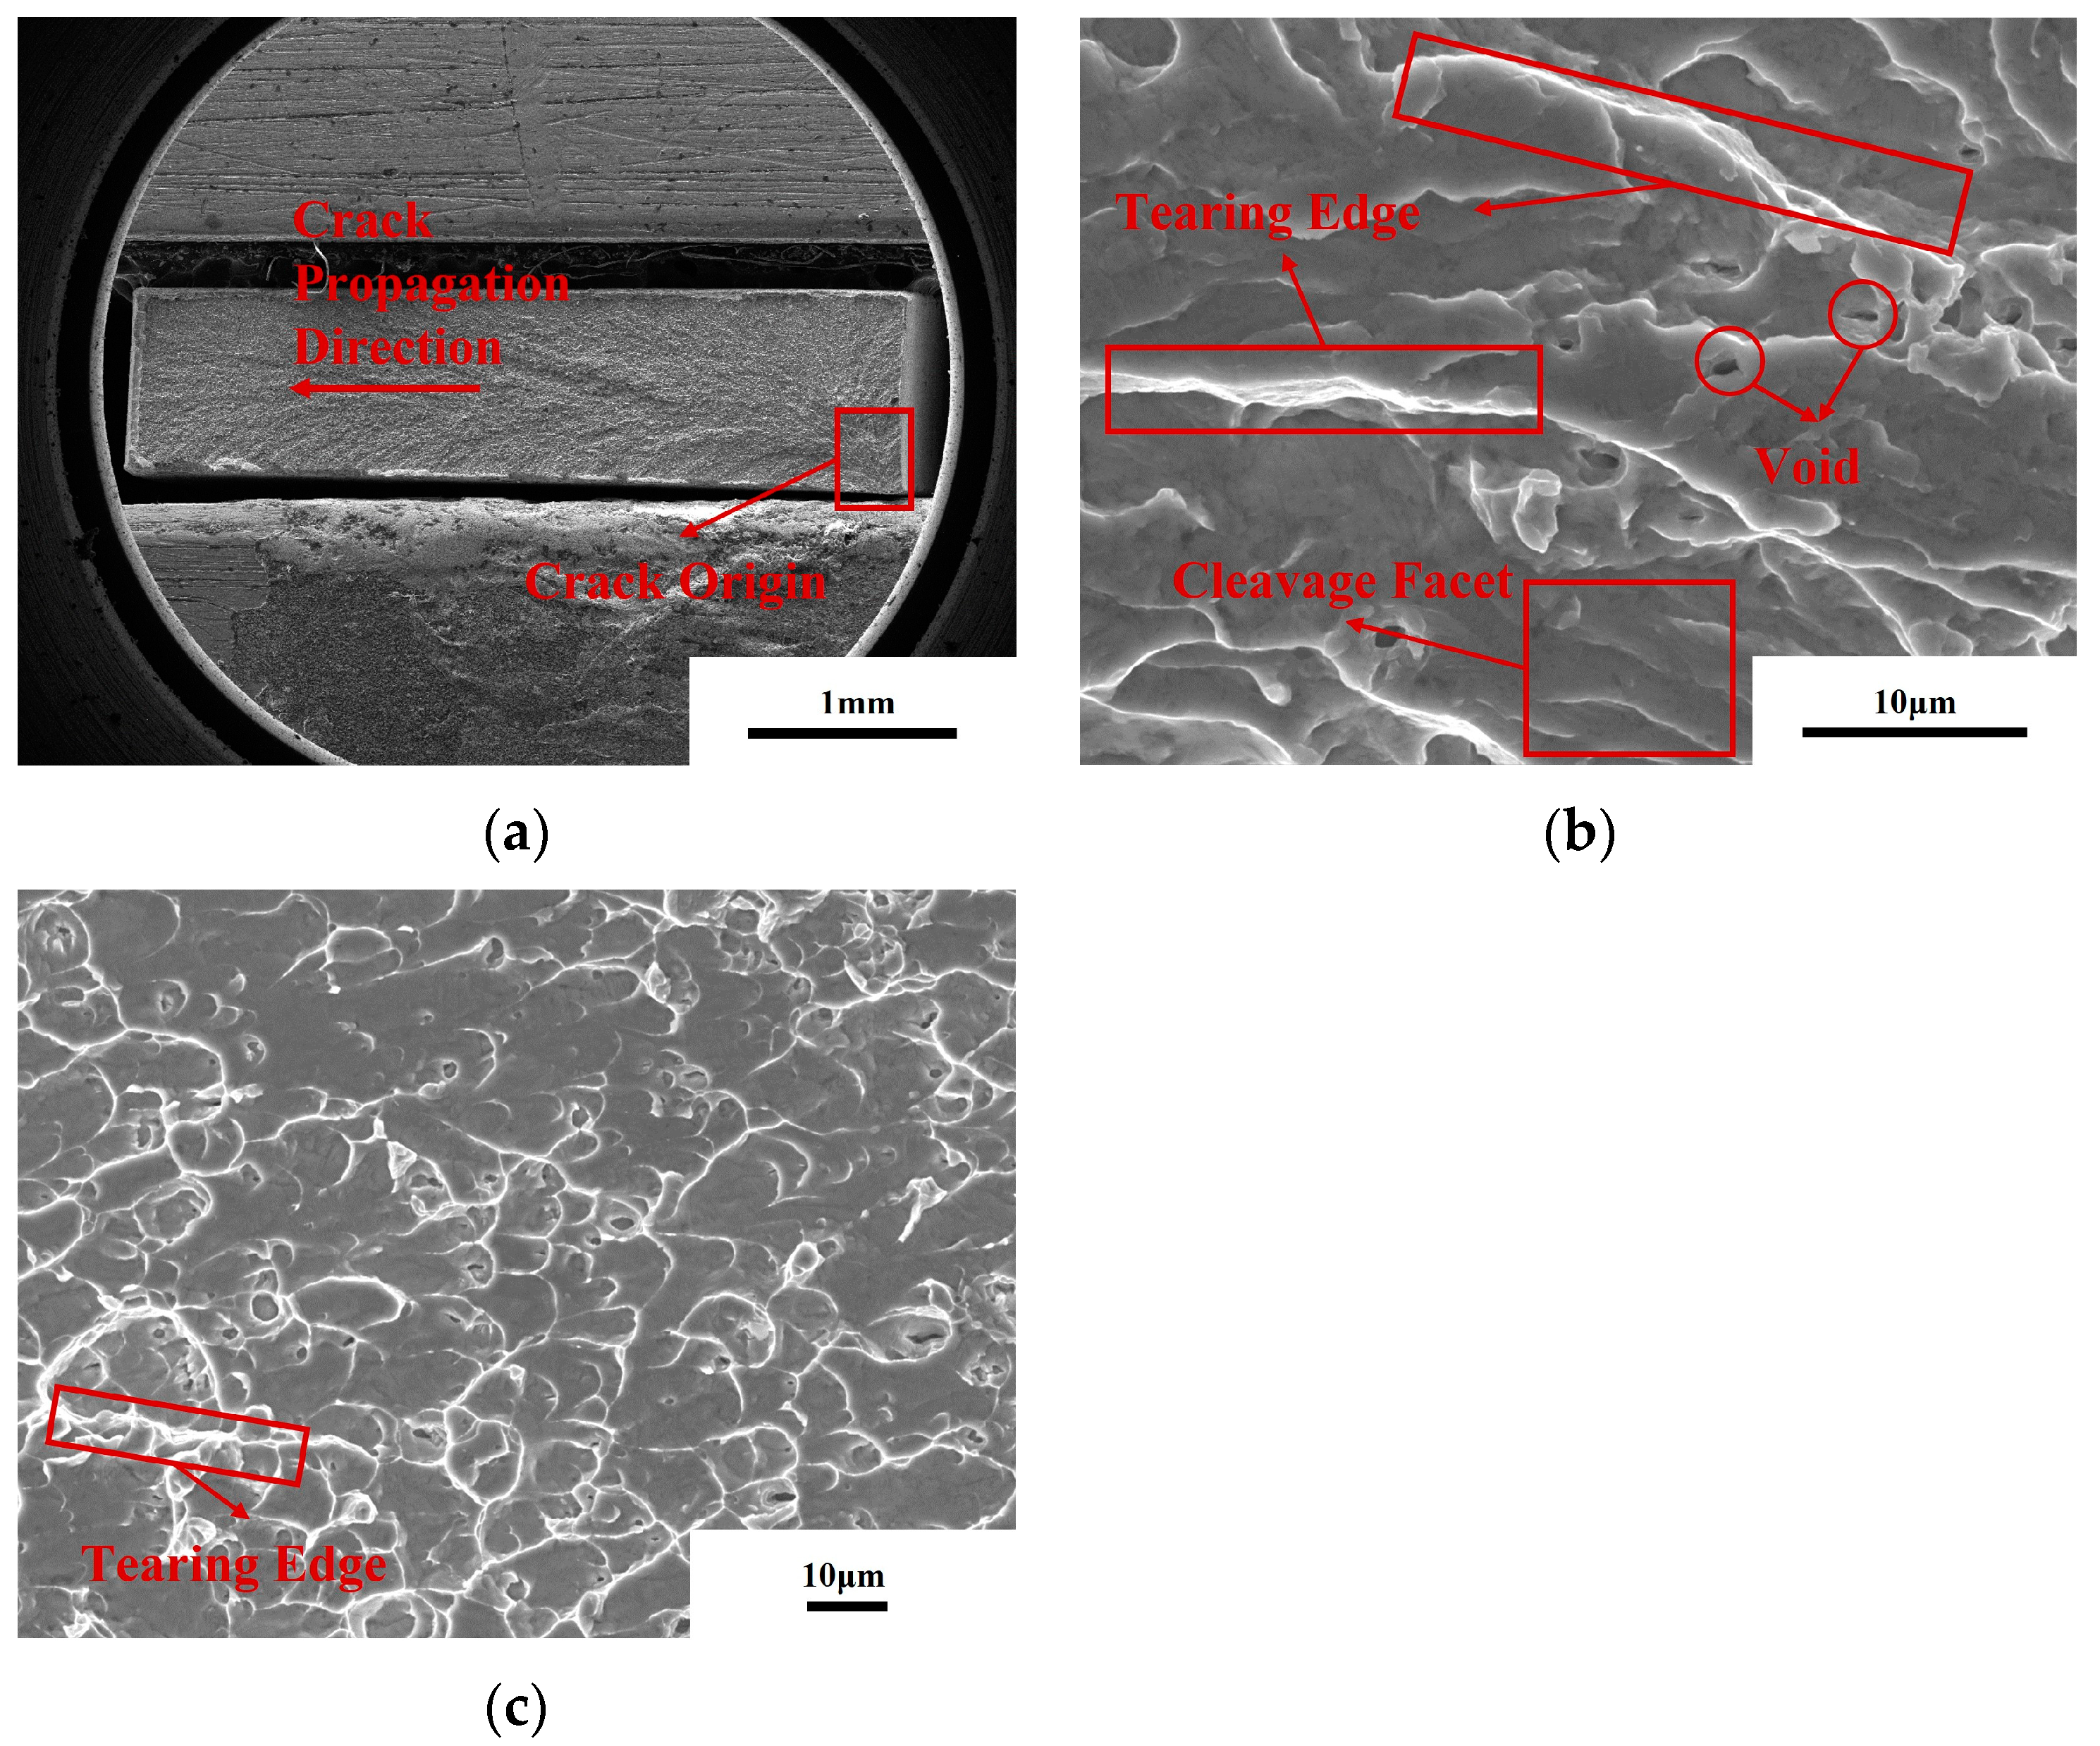
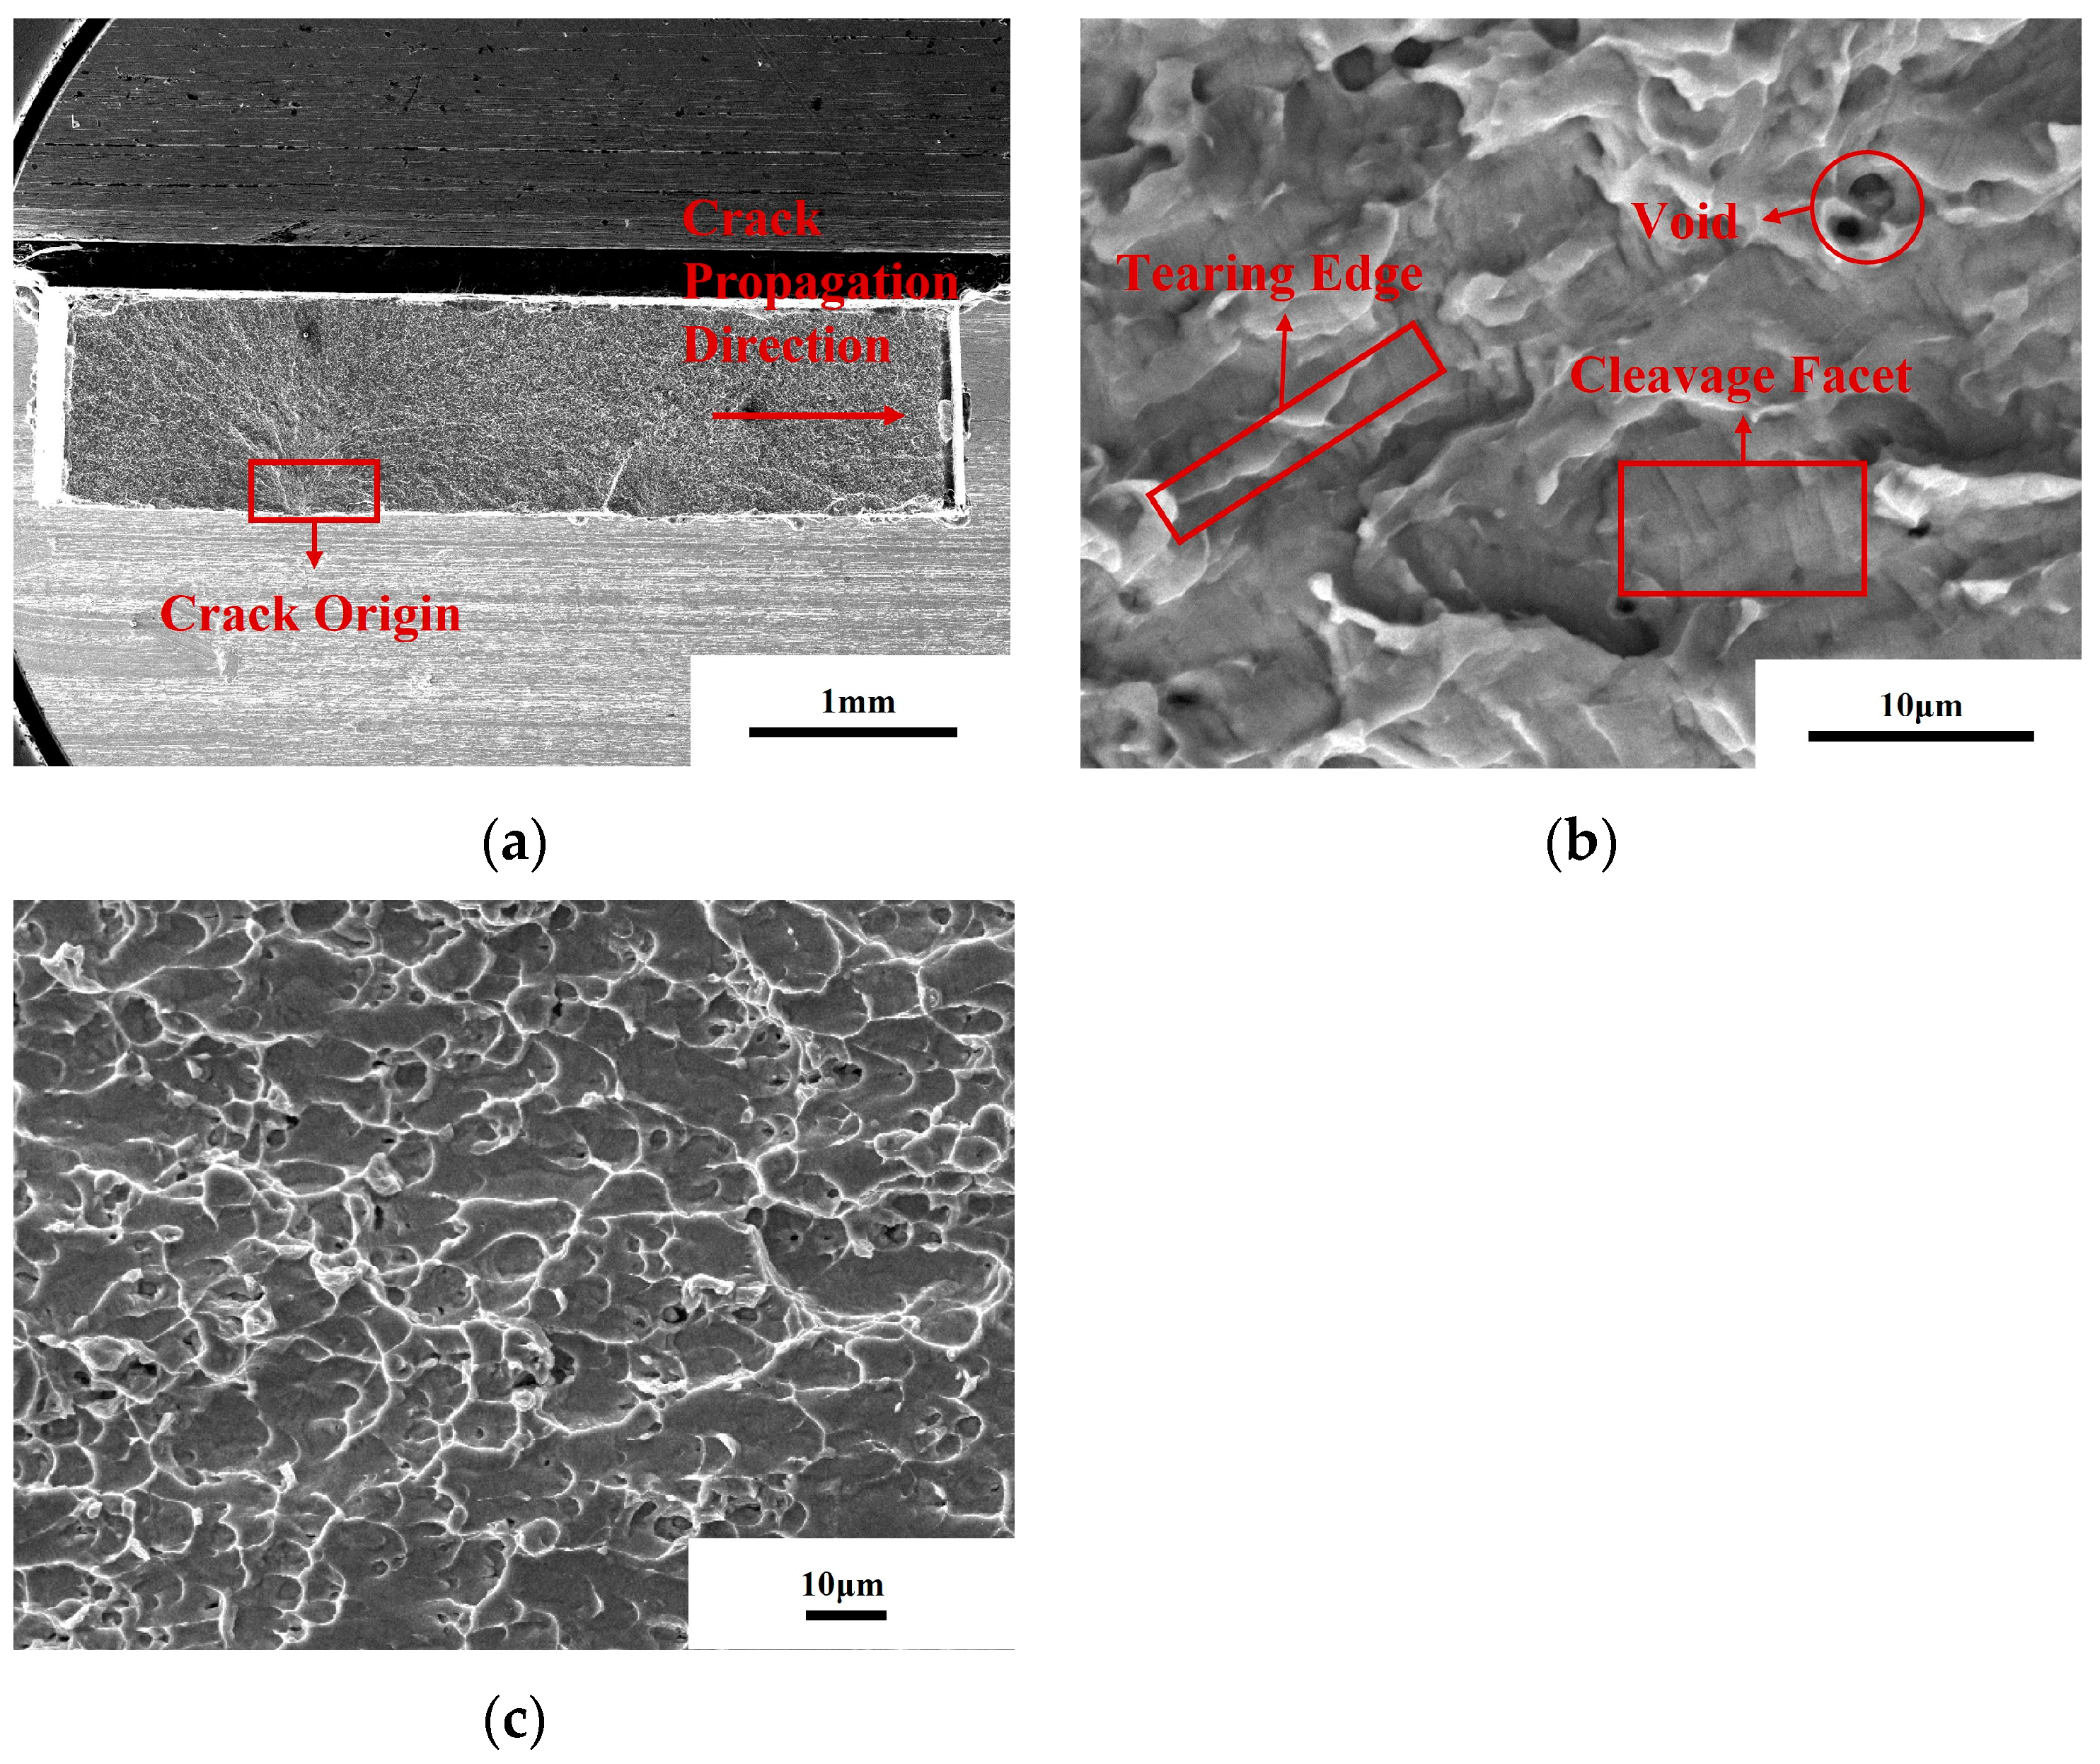
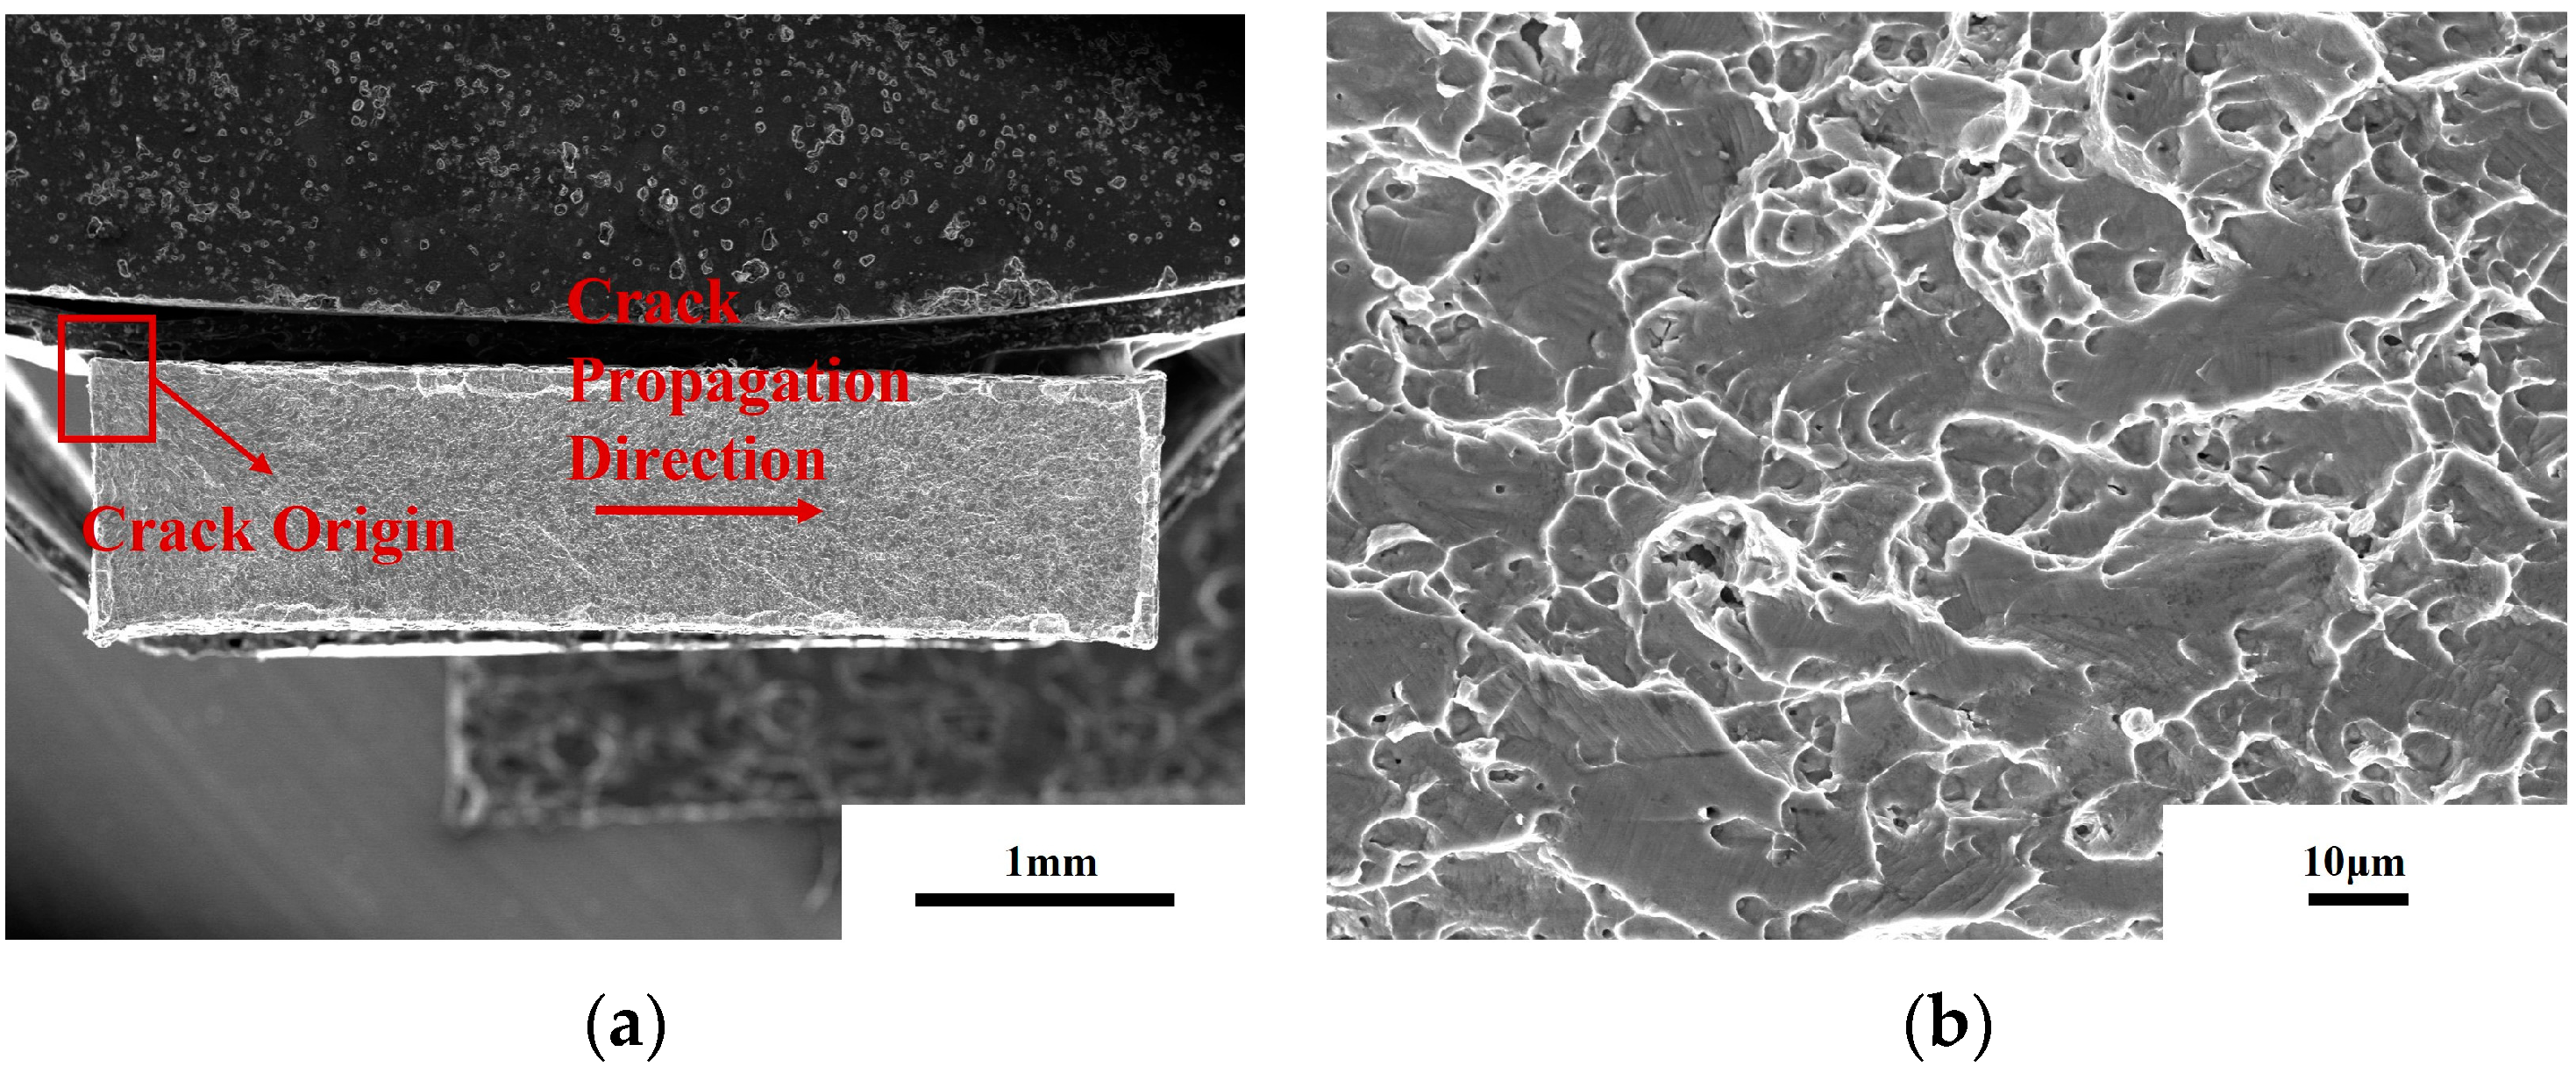
3.4. Fracture Characteristic

To understand the fracture properties of Ti50Ni47Fe3 alloys, fractographies are shown in Figure 10, Figure 11, Figure 12 and Figure 13.
Figure 10 and Figure 11 are the SEM photos of the fracture area with annealing temperatures of 400 °C and 500 °C. The fracture morphology of the two samples is similar, which is because both samples are in the recovery stage, and their microstructure and mechanical properties are similar.
We take the sample with an annealing temperature of 500 °C as an example to analyze the fracture morphology. Figure 11 shows the SEM photo of the fracture area with an annealing temperature of 500 °C. In Figure 11a, one can clearly observe that the fracture surface is not flat and that the pattern of fatigue crack growth looks like an inverted Y. The shear lip zone is at the edge of the specimen and is relatively smooth. At the microscale, one can see that there are obvious tearing edges and small cleavage facets in the crack propagation area, as shown in Figure 11b, and there are voids in the crack propagation area, caused by the Ti2Ni phase detaching from the matrix during the tensile process. Additionally, there are a large number of dimples at the fracture, as shown in Figure 11c. Due to different stress states during the fracture process, there are also differences in the shape of dimples: circular dimples produced under tensile conditions and parabolic dimples formed under shear conditions. Furthermore, the size distribution of dimples is relatively uneven, while there are still tearing edges and small cleavage facets in this area. One can see that the fracture of the alloy under this annealing system is a combination of quasi-cleavage fracture and ductile fracture, the fracture form is a transgranular fracture, and the plasticity is relatively poor.
The fracture surface of Ti50Ni47Fe3 alloy annealing at 600 °C is shown in Figure 12. From Figure 12, one can see that the fracture surface is relatively flat and that the inverted Y pattern is shallower than that of the 500 °C specimens. Compared with the fracture area of the 500 °C specimen, the sizes of cleavage facets are relatively small, as shown in Figure 12b. As shown in Figure 12c, the edges of the dimples are relatively flat, with only small tearing edges in the dimple enrichment area. Under this annealing temperature of 600 °C, the distribution of dimples is more uniform, the sizes of cleavage facets are smaller, the plasticity of the alloy is improved, and the fracture form is also a transgranular fracture.
After annealing at 800 °C, as shown in Figure 13a, one can see that the flatness of the fracture surface is reduced. Additionally, as shown in Figure 13b, after annealing at 800 °C, the size of dimples at the fracture surface are inhomogeneous; this is due to the high annealing temperature and grain growth, which reduces the strength and plasticity of the alloy. Meanwhile, the fracture form is also a transgranular fracture.

4. Conclusions

(1)
The microstructure of Ti50Ni47Fe3 alloy is composed of a TiNi matrix and Ti2Ni second phase. With the increase of the annealing temperature, the alloy structure changes from a long strip-shaped deformation structure to an equiaxed recrystallization structure, and the recrystallization process occurs dramatically at 600 °C. With a further increase of the annealing temperature, the devouring of grains occurs and results in the growth of grains.
(2)
With the increase of annealing temperatures, both the UTS and YS of Ti50Ni47Fe3 alloy decrease. The highest EL of Ti50Ni47Fe3 alloy is present at 600 °C and then decreases sharply. This is because with the increase of the annealing temperature, the alloy will experience three stages: recovery, recrystallization and grain growth. In the recrystallization stage, Ti50Ni47Fe3 alloy has the best strength–toughness match.
(3)
With the increase of the annealing temperature, due to the recrystallization and grain-growth process, the fracture surface tends to flatten out at 600 °C; furthermore, dimples become the most uniform at the same time, and the alloy has the best plasticity. After exceeding 600 °C, the dimple size at the fracture surface of the alloy is uneven, and the plasticity decreases.

Author Contributions

Conceptualization, Y.Y., W.Y. and S.H.; methodology, S.L.; formal analysis, Y.L. and X.S.; resources, Y.Y., W.Y. and S.H.; writing—original draft preparation, S.L.; writing—review and editing, S.L. and Y.L. All authors have read and agreed to the published version of the manuscript.

Funding

This research received no external funding.

Data Availability Statement

The data and materials that support the findings of this study are available from the corresponding author upon reasonable request.

Conflicts of Interest

The authors declare no conflict of interest.

References

  1. Huo, X.J.; Chen, P.; Lahkar, S.; Jin, M.J.; Han, X.C.; Song, Y.W.; Wang, X.D. Occurrence of the R-phase with increased stability induced by low temperature precipitate-free aging in a Ni50.9Ti49.1 alloy. Acta Mater. 2022, 227, 117688. [Google Scholar] [CrossRef]
  2. Yu, H.; Qiu, Y.; Young, M.L. Influence of Ni4Ti3 precipitate on pseudoelasticity of austenitic NiTi shape memory alloys deformed at high strain rate. Mater. Sci. Eng. A 2021, 804, 140753. [Google Scholar] [CrossRef]
  3. Otsuka, K.; Ren, X. Physical metallurgy of Ti-Ni-based shape memory alloys. Prog. Mater. Sci. 2005, 50, 511–678. [Google Scholar] [CrossRef]
  4. Cai, W.; Meng, X.L.; Zhao, L.C. Recent development of TiNi-based shape memory alloys. Curr. Opin. Solid State Mater. Sci. 2005, 9, 296–302. [Google Scholar] [CrossRef]
  5. Otsuka, K.; Ren, X. Recent developments in the research of shape momery alloys. Intermetallics 1999, 7, 511–528. [Google Scholar] [CrossRef]
  6. Sreekumar, M.; Nagaraja, T.; Singaperumal, M.; Zoppi, M.; Molfino, R. Critical review of current trends in shape memory alloy actuators for intelligent robots. Ind. Robot. 2007, 34, 285–294. [Google Scholar] [CrossRef]
  7. Liang, Q.L.; Zhao, S.S.; Liang, C.X.; Zhao, T.F.; Wang, D.; Ding, X.D.; Li, S.L.; Wang, Y.D.; Zheng, Y.F.; Ren, X.B.; et al. Strain states and unique properties in cold-rolled TiNi shape memory alloys. Acta Mater. 2022, 231, 117890. [Google Scholar] [CrossRef]
  8. Mahmud, A.S.; Wu, Z.G.; Yang, H.; Liu, Y.N. Effect of cold work and partial annealing on thermomechanical behaviour of Ti-50.5at% Ni. Shape Mem. Superelast. 2017, 3, 57–66. [Google Scholar] [CrossRef]
  9. Liang, Y.L.; Jiang, S.Y.; Zhang, Y.Q.; Hu, L.; Zhao, C.Z. Microstructure evolution and deformation mechanism of NiTiFe shape memory alloy based on plane strain compression and subsequent annealing. Mater. Chem. Phys. 2018, 215, 112–120. [Google Scholar] [CrossRef]
  10. Nam, T.H.; Saburi, T.; Shimizu, K. Cu-Content dependence of shape memory characteristics in Ti-Ni-Cu alloys. Mater. Trans. JIM 1990, 31, 959–967. [Google Scholar] [CrossRef]
  11. Wang, G.C.; Hu, K.P.; Tong, Y.X.; Tian, B.; Chen, F.; Li, L.; Zheng, Y.F.; Gao, Z.Y. Influence of Nb content on martensitic transformation and mechanical properties of TiNiCuNb shape memory alloys. Intermetallics 2016, 72, 30–35. [Google Scholar] [CrossRef]
  12. Tong, Y.X.; Jiang, P.C.; Chen, F.; Tian, B.; Li, L.; Zheng, Y.F.; Gunderov, D.V.; Valiev, R.Z. Microstructure and martensitic transformation of an ultrafine-grained TiNiNb shape memory alloy processed by equal channel angular pressing. Intermetallics 2014, 49, 81–86. [Google Scholar] [CrossRef]
  13. Wang, Y.; Zheng, Y.F.; Tong, Y.X.; Tian, B.; Chen, F.; Li, L. Microstructure and martensitic transformation of TiNiNbB shape memory alloys. Intermetallics 2015, 64, 32–36. [Google Scholar] [CrossRef]
  14. Choi, M.; Fukuda, T.; Kakeshita, T. Anomalies in resistivity, magnetic susceptibility and specific heat in iron-doped Ti-Ni shape memory alloys. Scr. Mater. 2005, 53, 869–873. [Google Scholar] [CrossRef]
  15. Ingale, B.D.; Wei, W.C.; Chang, P.C.; Kuo, Y.K.; Wu, S.K. Anomalous transport and thermal properties of NiTi and with Cu and Fe-doped shape memory alloys near the martensitic transition. J. Appl. Phys. 2011, 110, 113721. [Google Scholar] [CrossRef]
  16. Ji, Y.C.; Wang, D.; Ding, X.D.; Otsuka, K.; Ren, X.B. Origin of an isothermal R-martensite formation in Ni-rich Ti-Ni solid solution: Crystallization of strain glass. Phys. Rev. Lett. 2015, 114, 055701. [Google Scholar] [CrossRef]
  17. Chang, P.C.; Ko, M.L.; Ramachandran, B.; Kuo, Y.K.; Chien, C.; Wu, S.K. Comparative study of R-phase martensitic transformations in TiNi-based shape memory alloys induced by point defects and precipitates. Intermetallics 2017, 84, 130–135. [Google Scholar] [CrossRef]
  18. Ramachandran, B.; Chang, P.C.; Kuo, Y.K.; Chen, C.; Wu, S.K. Characteristics of martensitic and strain-glass transitions of the Fe-substituted TiNi shape memory alloys probed by transport and thermal measurements. Sci. Rep. 2017, 7, 1–11. [Google Scholar] [CrossRef]
  19. Yin, X.Q.; Park, C.H.; Li, Y.F.; Ye, W.J.; Zuo, Y.T.; Lee, S.W.; Yeom, J.T.; Mi, X.J. Mechanism of continuous dynamic recrystallization in a 50Ti-47Ni-3Fe shape memory alloy during hot compressive deformation. J. Alloys Compd. 2017, 693, 426–431. [Google Scholar] [CrossRef]
  20. Wang, S.J.; Mi, X.J.; Yin, X.Q.; Li, Y.F. Deformation behavior of TiNiFe alloy in isothermal compression. Rare Met. 2012, 31, 323–327. [Google Scholar] [CrossRef]
  21. Li, Y.F.; Kang, X.Y.; Yin, X.Q.; Xie, H.F.; Mi, X.J. Microstructure and mechanical properties of cold-rolled Ti50Ni47Fe3 shape memory alloy. Trans. Nonferrous Met. Soc. China 2014, 24, 2890–2895. [Google Scholar] [CrossRef]
  22. Karaca, H.E.; Kaya, I.; Tobe, H.; Basaran, B.; Nagasako, M.; Kainuma, R.; Chumlyakov, Y. Shape memory behavior of high strength Ni54Ti46 alloys. Mater. Sci. Eng. A 2013, 580, 66–70. [Google Scholar] [CrossRef]
  23. Sergueeva, A.V.; Song, C.; Valiev, R.Z.; Mukherjee, A.K. Structure and properties of amorphous and nanocrystalline NiTi prepared by severe plastic deformation and annealing. Mater. Sci. Eng. A 2003, 339, 159–165. [Google Scholar] [CrossRef]
  24. Ishida, A.; Sato, M. Microstructure and shape memory behaviour of annealed Ti51.5Ni(48.5-x)Cux (x = 6.5–20.9) thin films. Philos. Mag. 2007, 87, 5523–5538. [Google Scholar] [CrossRef]
  25. Okamoto, Y.; Hamanaka, H.; Miura, F.; Tamura, H.; Horikawa, H. Reversible changes in yield stress and transformation temperature of a NiTi alloy by alternate heat treatments. Scr. Metal. Mater. 1988, 22, 517–520. [Google Scholar] [CrossRef]
  26. Abujudom, D.N.; Thoma, P.E.; Fariabi, S. The effect of cold work and heat treatment on the phase transformations of near equiatomic NiTi shape memory alloy. Mater. Sci. Forum. 1991, 56–58, 565–570. [Google Scholar] [CrossRef]
  27. Choi, E.; Choi, J.; Seo, J. Recovery stress effect of crimped NiTi SMA fibers on dynamic direct tensile behavior of mortar with considering fiber volume fraction. Eng. Struct. 2022, 262, 114328. [Google Scholar] [CrossRef]
  28. Zhang, J.; Chen, T.; Li, W.; Bednarcik, J.; Dippel, A.C. High temperature superelasticity realized in equiatomic Ti-Ni conventional shape memory alloy by severe cold rolling. Mater. Des. 2020, 193, 108875. [Google Scholar] [CrossRef]
  29. Cui, B.; Yao, J.; Wu, Y.; Cai, W. Effect of cold rolling ratio on the microstructure and recovery properties of Ti-Ni-Nb-Co shape memory alloys. J. Alloy. Compd. 2019, 772, 728–734. [Google Scholar] [CrossRef]
Figure 1. Schematic diagram of tensile specimen.
Crystals 13 00706 g001
Figure 2. SEM micrographs of Ti50Ni47Fe3 alloy after annealing at different temperatures. (a) 400 °C/60 min/AC; (b) 500 °C/60 min/AC; (c) 600 °C/60 min/AC; (d) 700 °C/60 min/AC; and (e) 800 °C/60 min/AC.
Crystals 13 00706 g002
Figure 3. The SEM and TEM images of Ti2Ni-phase particles. (a) SEM-BED and the EDS analysis show the composition of the second phase; (b) TEM-bright field image (inset is the corresponding SAED).
Crystals 13 00706 g003
Figure 4. Inverse pole figure (IPF) of annealed Ti50Ni47Fe3 alloys. (a) 400 °C/60 min/AC; (b) 500 °C/60 min/AC; and (c) 600 °C/60 min/AC.
Crystals 13 00706 g004aCrystals 13 00706 g004b
Figure 5. Grain orientation spread (GOS) of annealed Ti50Ni47Fe3 alloys. (a) 400 °C/60 min/AC; (b) 500 °C/60 min/AC; and (c) 600 °C/60 min/AC.
Crystals 13 00706 g005aCrystals 13 00706 g005b
Figure 6. Inverse pole figures along rolling direction for the annealed Ti50Ni47Fe3 alloys. (a) 400 °C/60 min/AC; and (b) 600 °C/60 min/AC.
Crystals 13 00706 g006
Figure 7. XRD patterns of annealed Ti50Ni47Fe3 alloys.
Crystals 13 00706 g007
Figure 8. Tensile properties of Ti50Ni47Fe3 alloy with different annealing treatments. (a) Stress-strain curves of Ti50Ni47Fe3 SMA; and (b) the yield strength (YS), ultimate tensile strength (UTS) and elongation (EL) trends with the increase of annealing temperature.
Crystals 13 00706 g008
Figure 9. Effect of different annealing temperatures on microhardness of Ti50Ni47Fe3 SMA.
Crystals 13 00706 g009
Figure 10. Fracture morphology after tensile test of alloy annealed at 400 °C for 60 min. (a) Low magnification morphology of fracture area; (b) crack propagation area; and (c) dimple region.
Crystals 13 00706 g010
Figure 11. Fracture morphology after tensile test of alloy annealed at 500 °C for 60 min. (a) Low magnification morphology of fracture area; (b) crack propagation area; and (c) dimple region.
Crystals 13 00706 g011
Figure 12. Fracture morphology after tensile test of alloy annealed at 600 °C for 60 min. (a) Low magnification morphology of fracture area; (b) crack propagation area; and (c) dimple region.
Crystals 13 00706 g012
Figure 13. Fracture morphology after tensile test of alloy annealed at 800 °C for 60 min. (a) Low magnification morphology of fracture area; and (b) dimple region.
Crystals 13 00706 g013
Table 1. Chemical compositions of TiNiFe alloys.
ElementFeNiCOTi
Content (wt. %)3.2752.160.0028<0.002Bal.
Table 2. Effect of annealing temperature on the average grain size of Ti50Ni47Fe3 alloys.
Annealing Temperature/°C400600800
Average Grain Size/μm5.65.311.9
Disclaimer/Publisher’s Note: The statements, opinions and data contained in all publications are solely those of the individual author(s) and contributor(s) and not of MDPI and/or the editor(s). MDPI and/or the editor(s) disclaim responsibility for any injury to people or property resulting from any ideas, methods, instructions or products referred to in the content.

