Article

Features of the Spectroscopic Characteristics of Yttrium–Aluminum Garnets Doped with Europium at Different Concentrations

by
Nurgul Zhanturina
1,*,
Daulet Sergeyev
1,
Zukhra Aimaganbetova
1,
Abzal Zhubaev
1 and
Karlygash Bizhanova
2
1
Department of Physics, K.Zhubanov Aktobe Regional University, Aktobe 030000, Kazakhstan
2
Department of Fundamental Sciences, Yessenov University, Aktau 130000, Kazakhstan
*
Author to whom correspondence should be addressed.
Crystals 2023, 13(4), 702; https://doi.org/10.3390/cryst13040702
Submission received: 1 March 2023 / Revised: 5 April 2023 / Accepted: 17 April 2023 / Published: 20 April 2023
(This article belongs to the Section Inorganic Crystalline Materials)

Abstract

:
The article presents the results of measuring the luminescence spectra and luminescence excitation spectra for YAG:Eu with europium concentrations of 2, 6, 8, and 10%. The materials were synthesized by solid-phase synthesis. For samples with europium concentrations of 2, 8, and 10%, the diffraction patterns showed full agreement with the phases. However, the yttrium–aluminum–perovskite phase was present in the sample with a concentration of 6%, even though the samples were obtained under the same conditions. The spectra of the photoluminescence excitation and photoluminescence were recorded for all samples. The concentration dependences of the luminescence bands and luminescence excitation bands were also plotted. The bandgap and absorption spectra were simulated for the sample of YAG:Eu, doped with 2–4 ions of europium for comparison.

1. Introduction

Yttrium–aluminum garnets (YAG) are model objects for studying luminescence processes and the effect of ions that activate this material in luminescence processes. Scientists investigating the problem of crystal phosphors have comprehensively considered the effect of rare-earth metal ions on the spectroscopic properties of yttrium–aluminum garnets [1,2].
In recent years, a divalent europium (Eu2+) center has attracted attention as a luminescent center for scintillators. Eu2+ shows luminescence due to the spin- and parity-allowed 5d–4f transitions with a broad absorption and emission band in the ultraviolet and visible regions. Since Eu2+ exhibits a relatively short decay time and a high emission efficiency, Eu2+-doped scintillators with a high sensitivity to various types of ionizing radiation have been developed [3,4,5,6]. The luminescence of Eu2+, originating from the 4f74f6 5d transition, strongly relies on the type of environment (e.g., crystal field) around the Eu2+ ions. This means that the emission wavelength of an Eu-doped scintillator depends on the host material. Europium-doped garnets have excellent photoluminescent (PL) intensity, and (photo)chemical stability. They are used for optical imaging due to their stable luminescence, long fluorescence decay time, and sharp emission peaks in the red to near-infrared (NIR) regions [7], a biologically appropriate emission. For a high-doping level, Eu emits due to the 5D07fj transition. All YAG:Eu samples exhibit an orange–red luminescence with similar characteristic emission bands. In the 580–640 nm domain, the PL spectra present five bands with maxima situated at 587, 592, 598, 611, and 631 nm, which are associated with 5D07fJ (J = 0, 1, 2) transitions in Eu3+ ions [8]. Therefore, the doping of material increases the radiation centers and energy transfer from the host to luminescence centers [9]. Therefore, from an academic viewpoint, the investigation of new Eu-doped materials is very interesting [10]. YAG doped with Eu2+ and Eu3+ ions is very interesting as a phosphor center for converting a light-emitting diode light to white light sources [11].
Eu-doped YAG is widely used as an active element in solid-state lasers, in field emission displays (FED) [9], and in cathode ray tubes (CRT) [12]. In this work, the influence of europium concentration on the luminescent characteristics of the material was studied. A decrease in the luminescence intensity with increasing dopant concentration was observed, potentially due to the expansion of the lattice constant.
In the case of europium doping, the increase in concentration leads to a rise in the active number of luminescent centers, and Eu3+ ions are incorporated into the lattice, enhancing the probability of radiative recombination [8].
The aim of this research was to investigate the behavior of the PL and PLE band intensities at europium concentrations of 2, 6, 8, and 10% in order to determine the processes of energy transfer from luminescence centers to the initial matrix with an increase in the degree of doping and the influence of the doping level on luminescence quenching.

2. Materials and Methods

YAG:Eu samples were obtained by solid-phase synthesis at the Research Center of the Aktobe Ferroalloy Plant.
For synthesis, yttrium oxide (99.999%), europium oxide (99.995%), and aluminum oxide were all purchased from Nevatorg LLC. All reagents were purchase at 300 g.
To obtain the materials, the initial reagents of aluminum oxide, yttrium oxide, and europium oxide, taken in the proportions of the stoichiometric compound Y2O3 (99.999%) 51%, Al2O3 (99.99%) 43%, and Eu2O3 (99.99%) 6%; Y2O3 (99.999%) 49%, Al2O3 (99.99%) 43%, and Eu2O3 (99.99%) 8%; and Y2O3 (99.999%) 47%, Al2O3 (99.99%) 43%, and Eu2O3 (99.99%) 10% were weighed on a balance to give YAG:Eu (6%), YAG:Eu (8%), and YAG:Eu (10%), respectively. After obtaining the powders in the appropriate stoichiometric ratio, they were placed in a magnetic grinder for thorough mixing.
Next, the resulting mixture of yttrium oxide, aluminum oxide, and europium oxide was loaded into alundum crucibles placed in graphite crucibles to create a reducing atmosphere. Subsequently, the mixture was calcined at a temperature of 1650 °C for 5 h. After this, the heating elements were turned off, and the chamber was left to cool to room temperature at a rate of 80–100 °C per hour. The resulting materials were characterized by X-ray diffractometry (Figure 1, Figure 2, Figure 3 and Figure 4).
The X axis of the XRD spectra is the 2 Theta (2Q), when Q is the angle of reflection of the X-rays. The Y axis of an XRD pattern corresponds to the intensity of the signal, and it is presented in counts per acquisition step. In the figure, we specify the PDF Card number by which we have identified the phases. The red lines correspond to the phase of yttrium–aluminum–garnet. So, as we see, the sample with 2% of europium contained a 100% YAG phase.
The main peak of the cubic YAG:Eu structure is centered at 2Q = 33.35°. The lattice constant was 12.0062. Some other XRD diffraction lines are situated at 29.74, 36.63, 41.15, 46.6, 55.11, 57.7, and others.
The black lines correspond to the garnet doped with europium. As the degree of doping increases, the frequency of the black lines increases.
From the XRD results, the presence of other phases besides YAG can be observed. The quantitative analysis showed that 62.6% of the products were in the YAG phase, 23.5% in the YAP phase, and 13.9% in the corundum phase. The lattice constant was 12.0062. The synthesis of this sample involved slow heating to 1473 K and cooling to 1023 K at a rate of 5 K h−1, followed by furnace cooling.
From the XRD patterns, we can see that the 8% Eu-doped sample contained an yttrium–aluminate phase with a garnet structure. The main peak of the cubic YAG:Eu structure was centered at 2Q = 33.4° and corresponded to the crystalline plane with a Miller index of 420. The space group of YAG was Ia-3d (SG 230). The lattice constant was equal to 12.0062, corresponding to the garnet structure.
We can see that, as the europium concentration increased to 10%, the number of coexisting phases in the material decreased, while in the sample with 10% europium, there was only one yttrium–aluminum–garnet phase. However, the lattice constant changed to 12.013.
YAG:Eu (6%) contained both an yttrium–aluminum–garnet phase and an yttrium–aluminum–perovskite phase, as well as corundum. Note that the intensity of the main peak in the sample with 6% europium was two times less than in the 8% and 10% samples. Table 1 shows the quantitative analysis of the samples.
From [11], it can be noted that the amount of the YAG phase decreased when the concentration increased from 0 to 3%, and increasing the concentration to 5% led to an increase in the pure YAG phase. Our results coincided with this. It can be noted that the lattice constant increased with a Eu concentration of 10%. The room temperature (RT) photoluminescence excitation (PLE) spectra of the powder samples were measured with a FluoroMax-4P spectrofluorometer (Horiba) equipped with a 150 W xenon lamp as an excitation source and a R928 Hamamatsu photomultiplier as a detector, allowing the PL and PLE spectra to be recorded in the 250–850 nm spectral range. The PL was measured with an excitation wavelength of 390 nm.
The particle sizes were calculated using the Scherrer equation:
d = K λ β c o s θ ,
where d is the average size of particles, K is the Scherrer constant (0.94),  λ  denotes the X-ray wavelength, β is the line broadening at half the maximum intensity (FWHM) (in radians, 2θ), and θ is the Bragg angle [12,13].
The results of the calculations of particle size are presented in Table 2.
The table shows that the average particle size of the Eu-doped YAG was between 0.43 and 0.57 nm. With an increase in the Eu concentration, the halfwidth decreased and the particle size increased.

3. Results

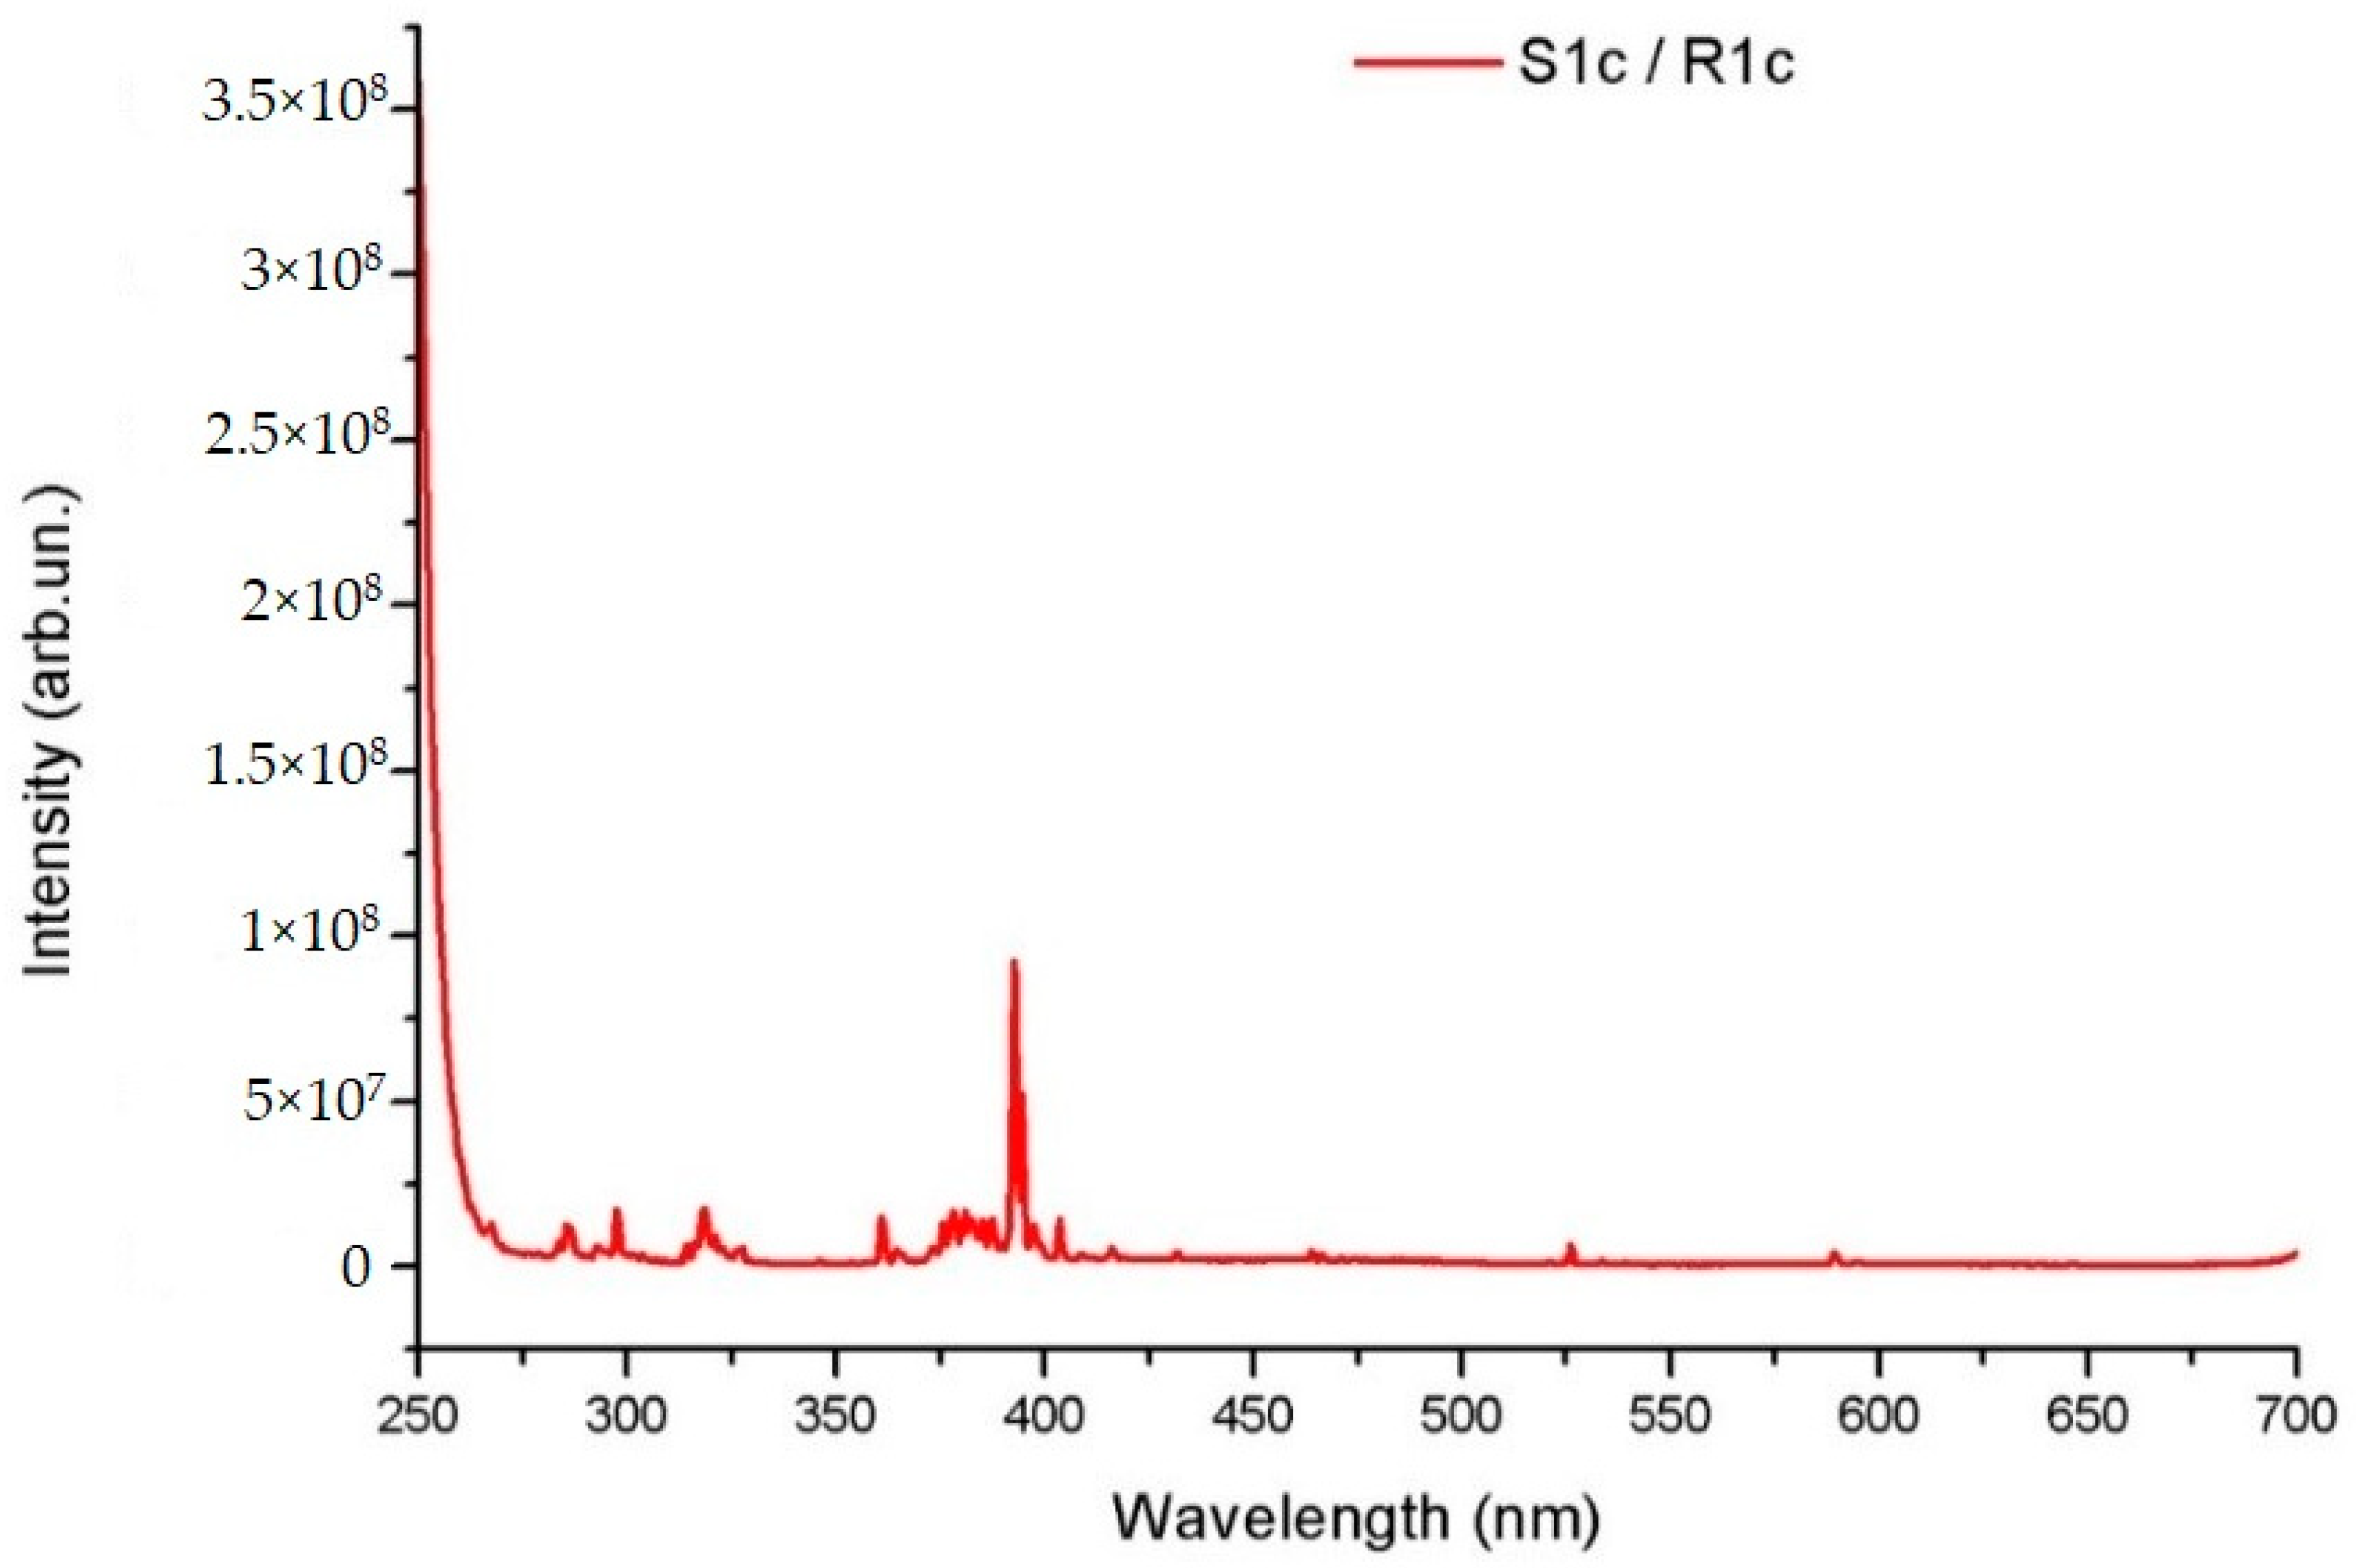
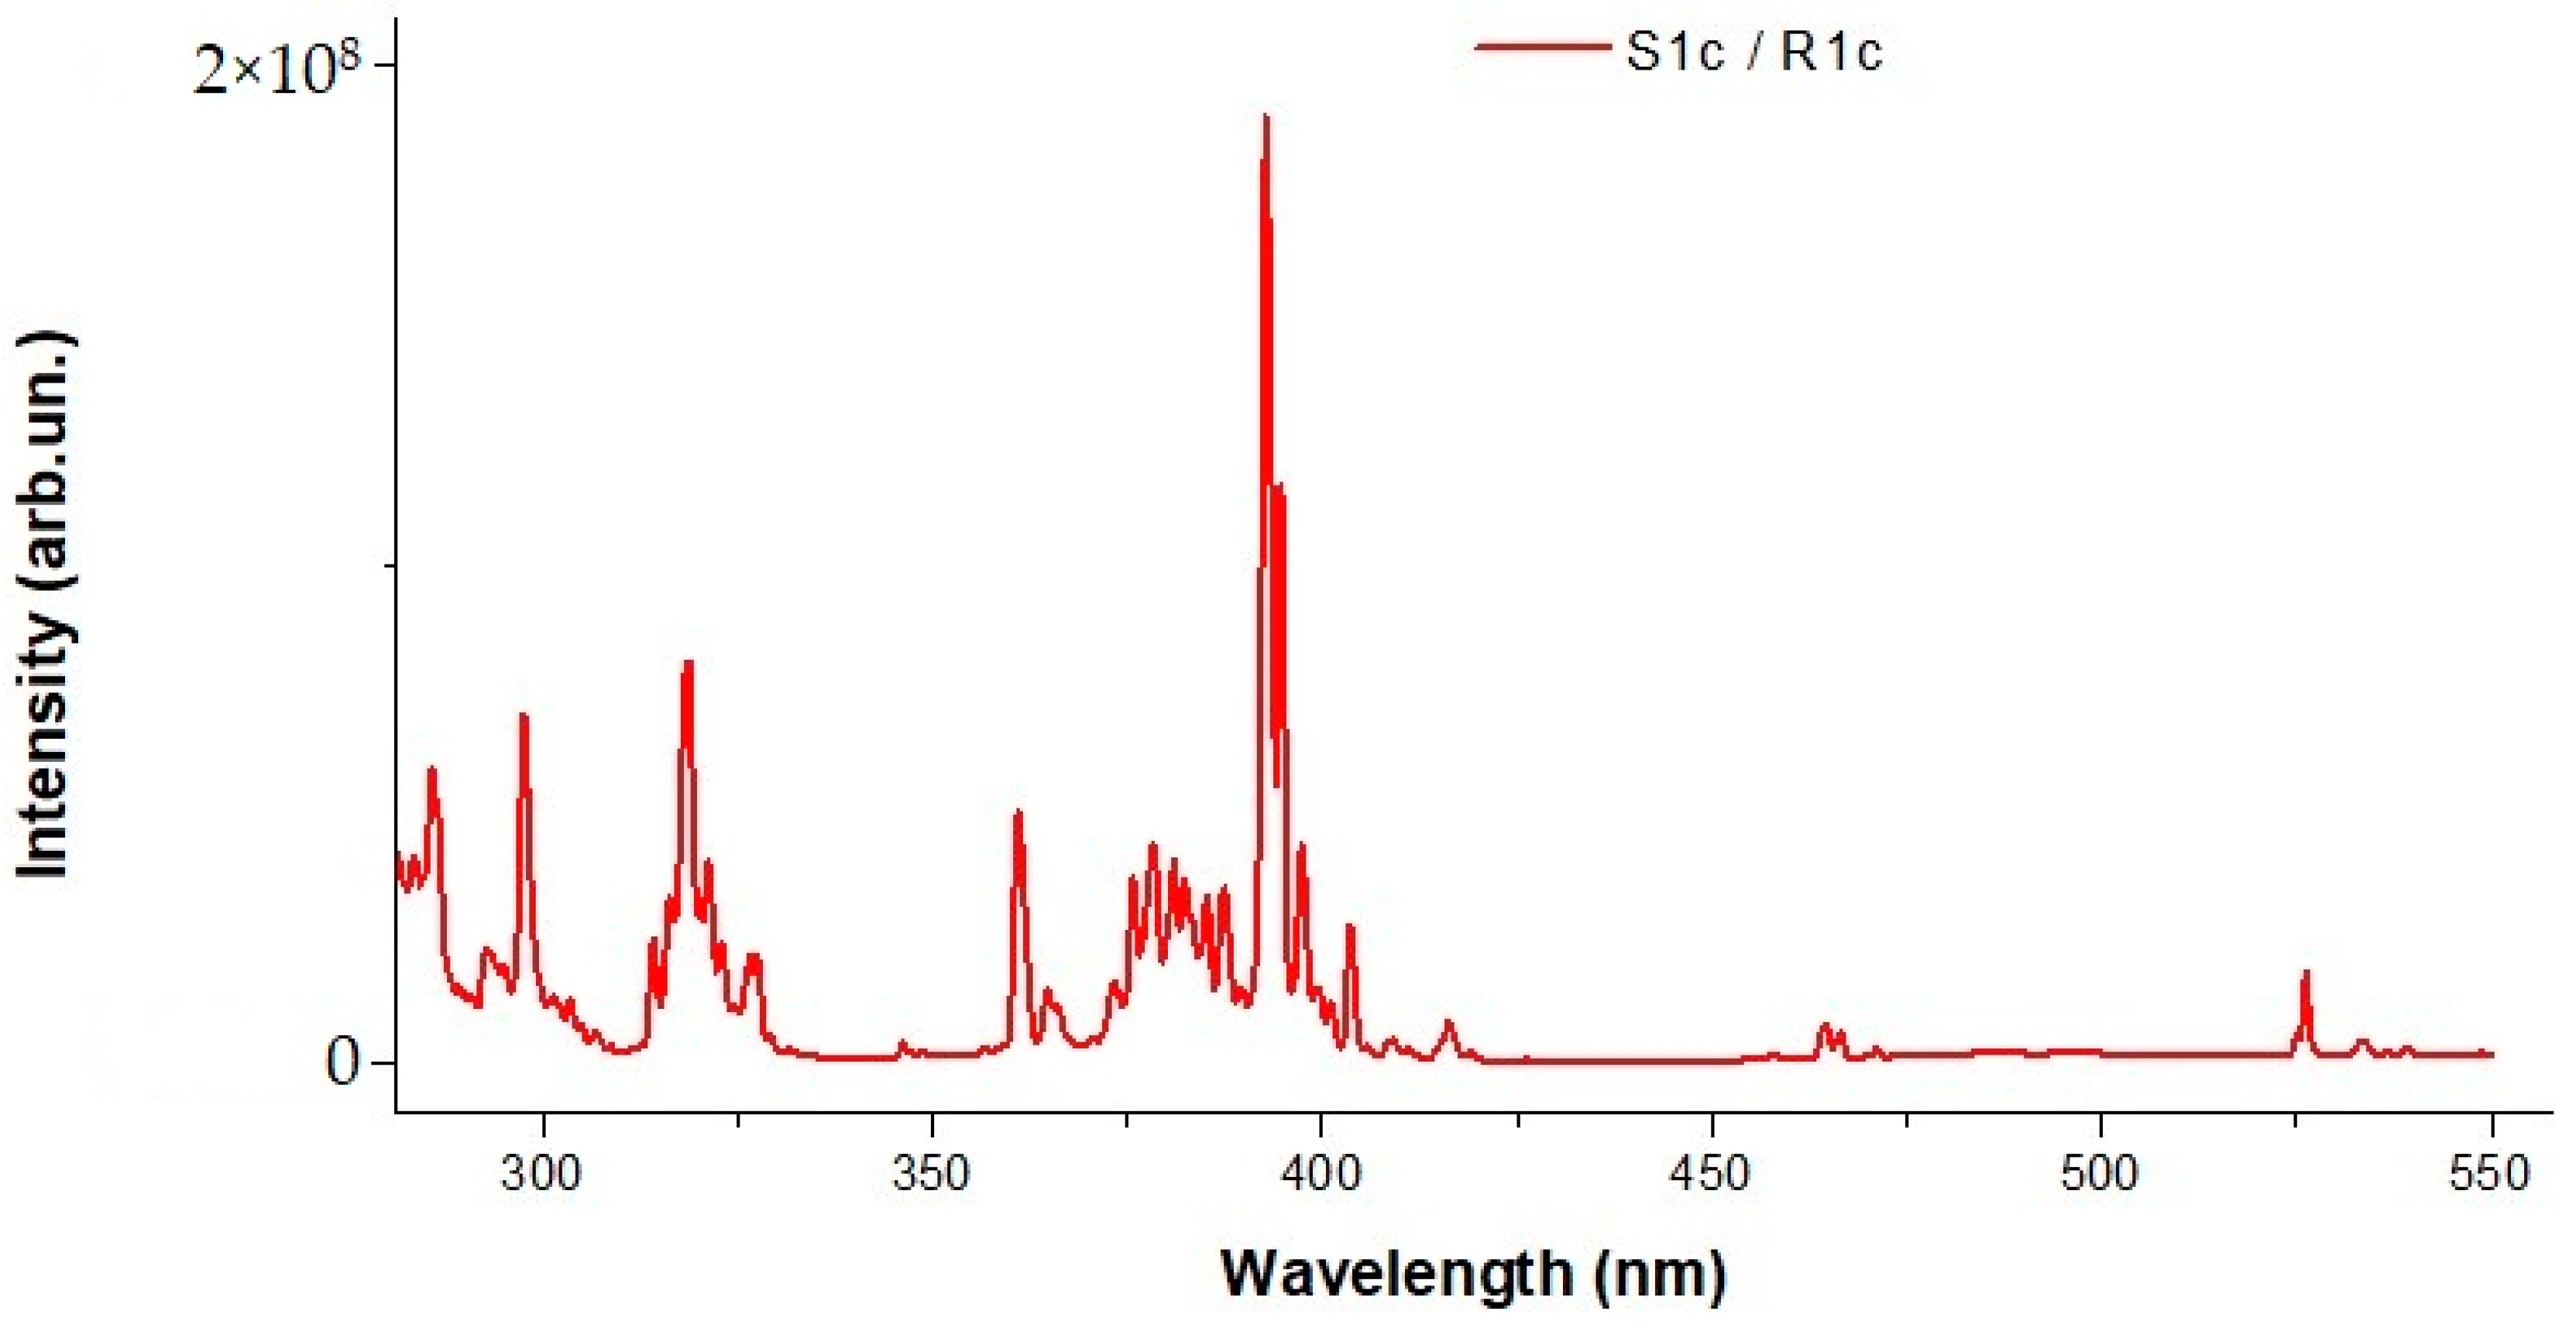
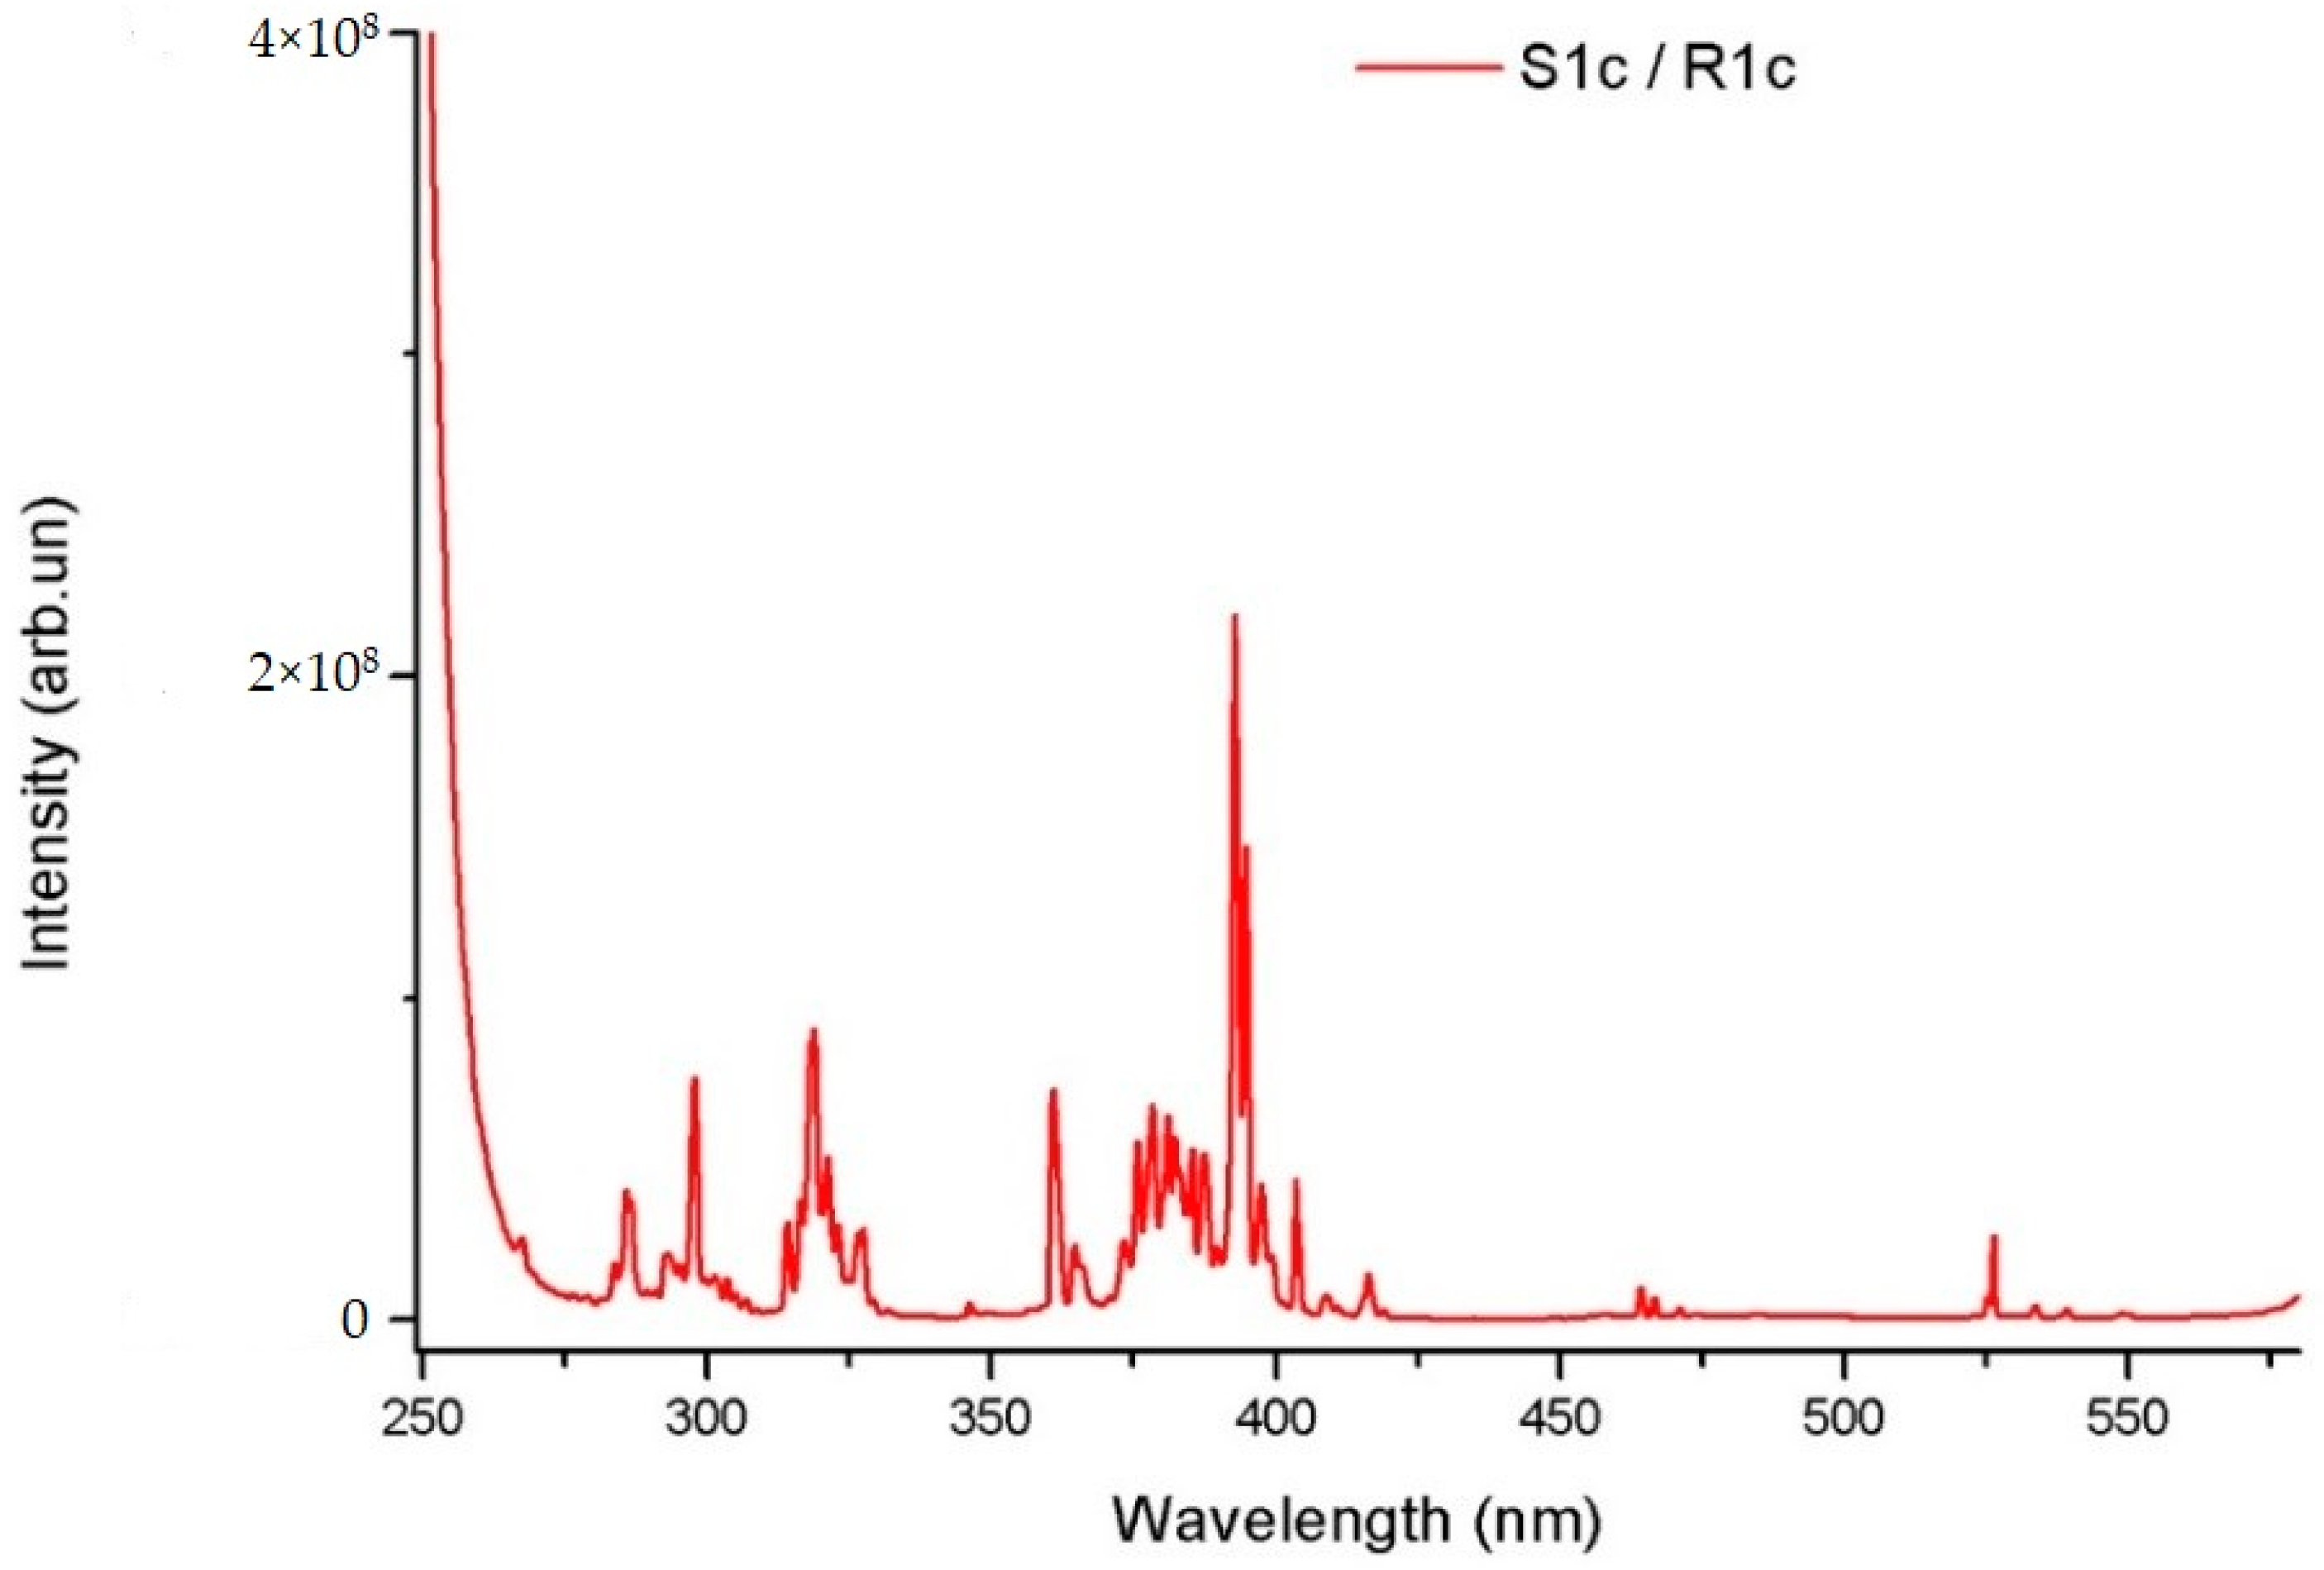
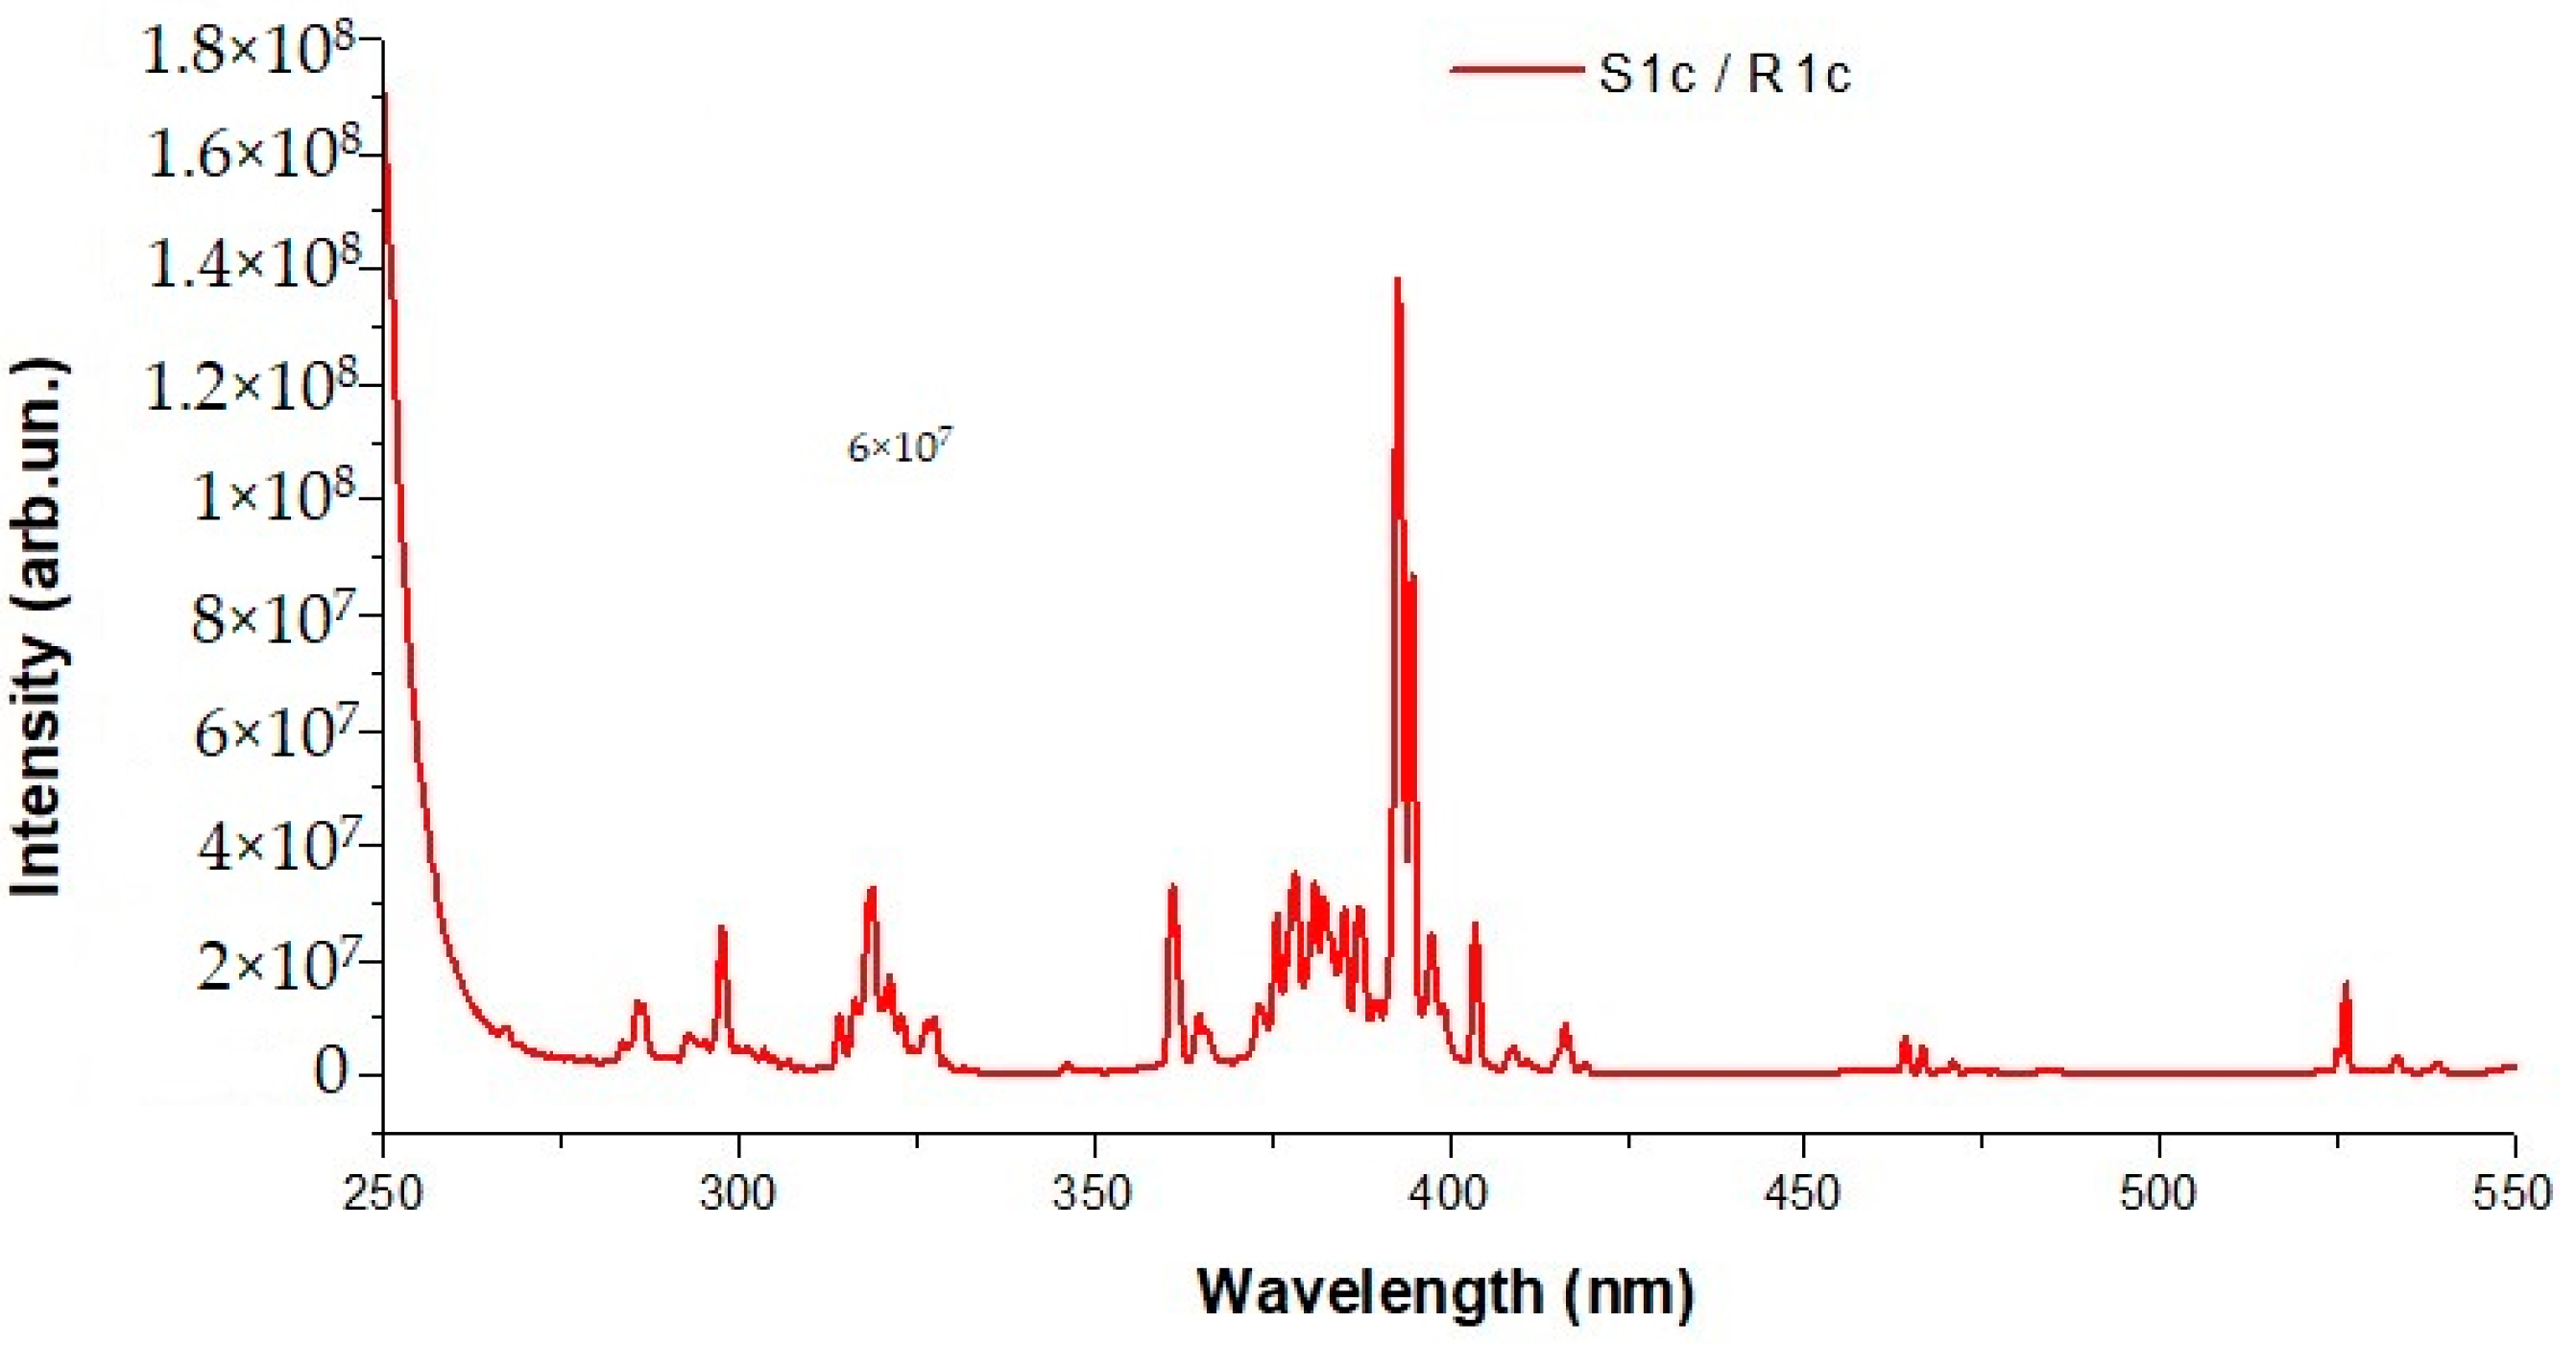
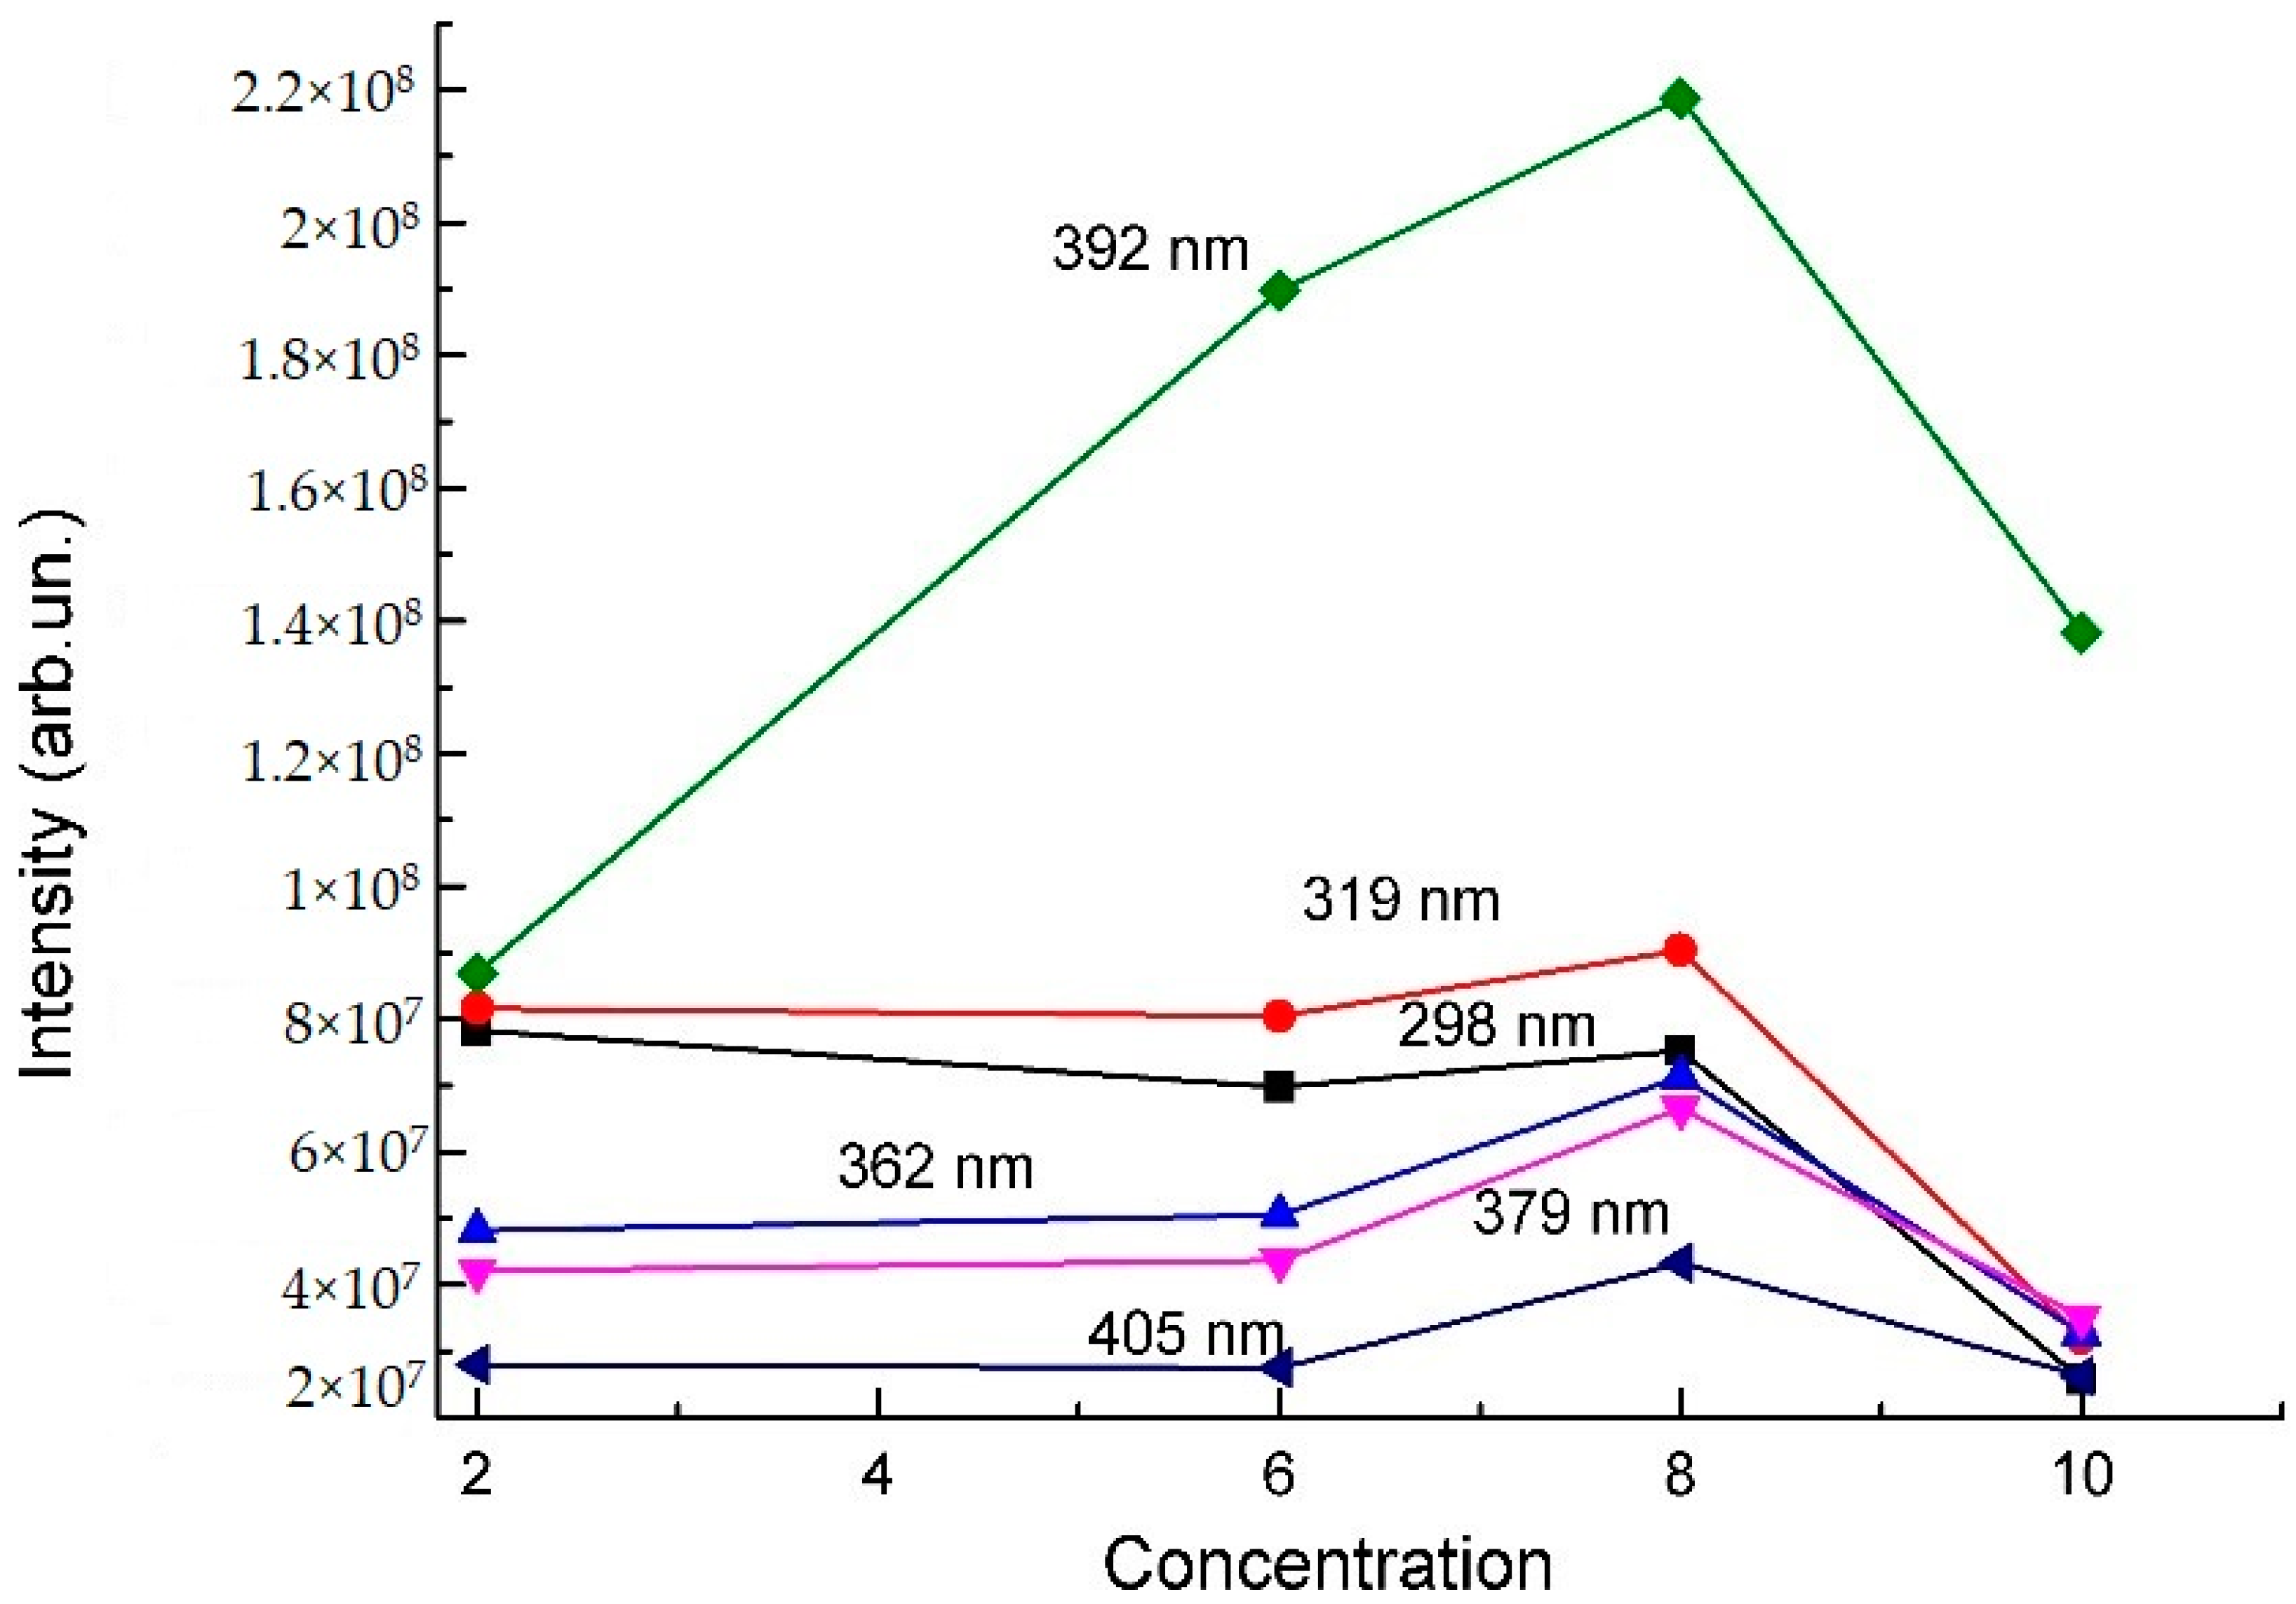
3.1. Photoluminescence Excitation Spectra

The photoluminescent characteristics of the YAG:Eu phosphors were evaluated on the basis of the emission (PL) and excitation (PLE) spectra (Figure 5, Figure 6, Figure 7 and Figure 8).
Charge transfer bands were evident up to 250 nm. We can see the charge transfer band slightly shift from around 235 nm in the 8% Eu sample to 250 nm in the 10% Eu sample. The second region between 280 and 425 nm contained several weak sharp peaks associated with the f–f electronic transitions of Eu3+ ions with maxima at 298, 319 (7F05H5–7), 362 (7F05D4), 379 (7F05G4–6), 393 (7F0,15L6), and 404 nm (7F05D3), in agreement with the literature data [14]. If we compare the main peaks, we see the pattern depicted in Figure 9.
The observed band between 298 and 405 nm is due to the f–f transitions of Eu3+ ions. As seen in Figure 9, the intensities of the PLE of all bands increased at 2 and 6% to the same level, and slightly rose at 8%, beginning to fall from 8% due to concentration quenching. The maximum at 392 nm was the peak and related to the 7F0,15L6 transition. Its intensity rose from 2 to 8%. The purity of the phases did not affect the PLE intensity, which only depended on the Eu concentration, not on the host. The other situation was observed when measuring the luminescence spectra.

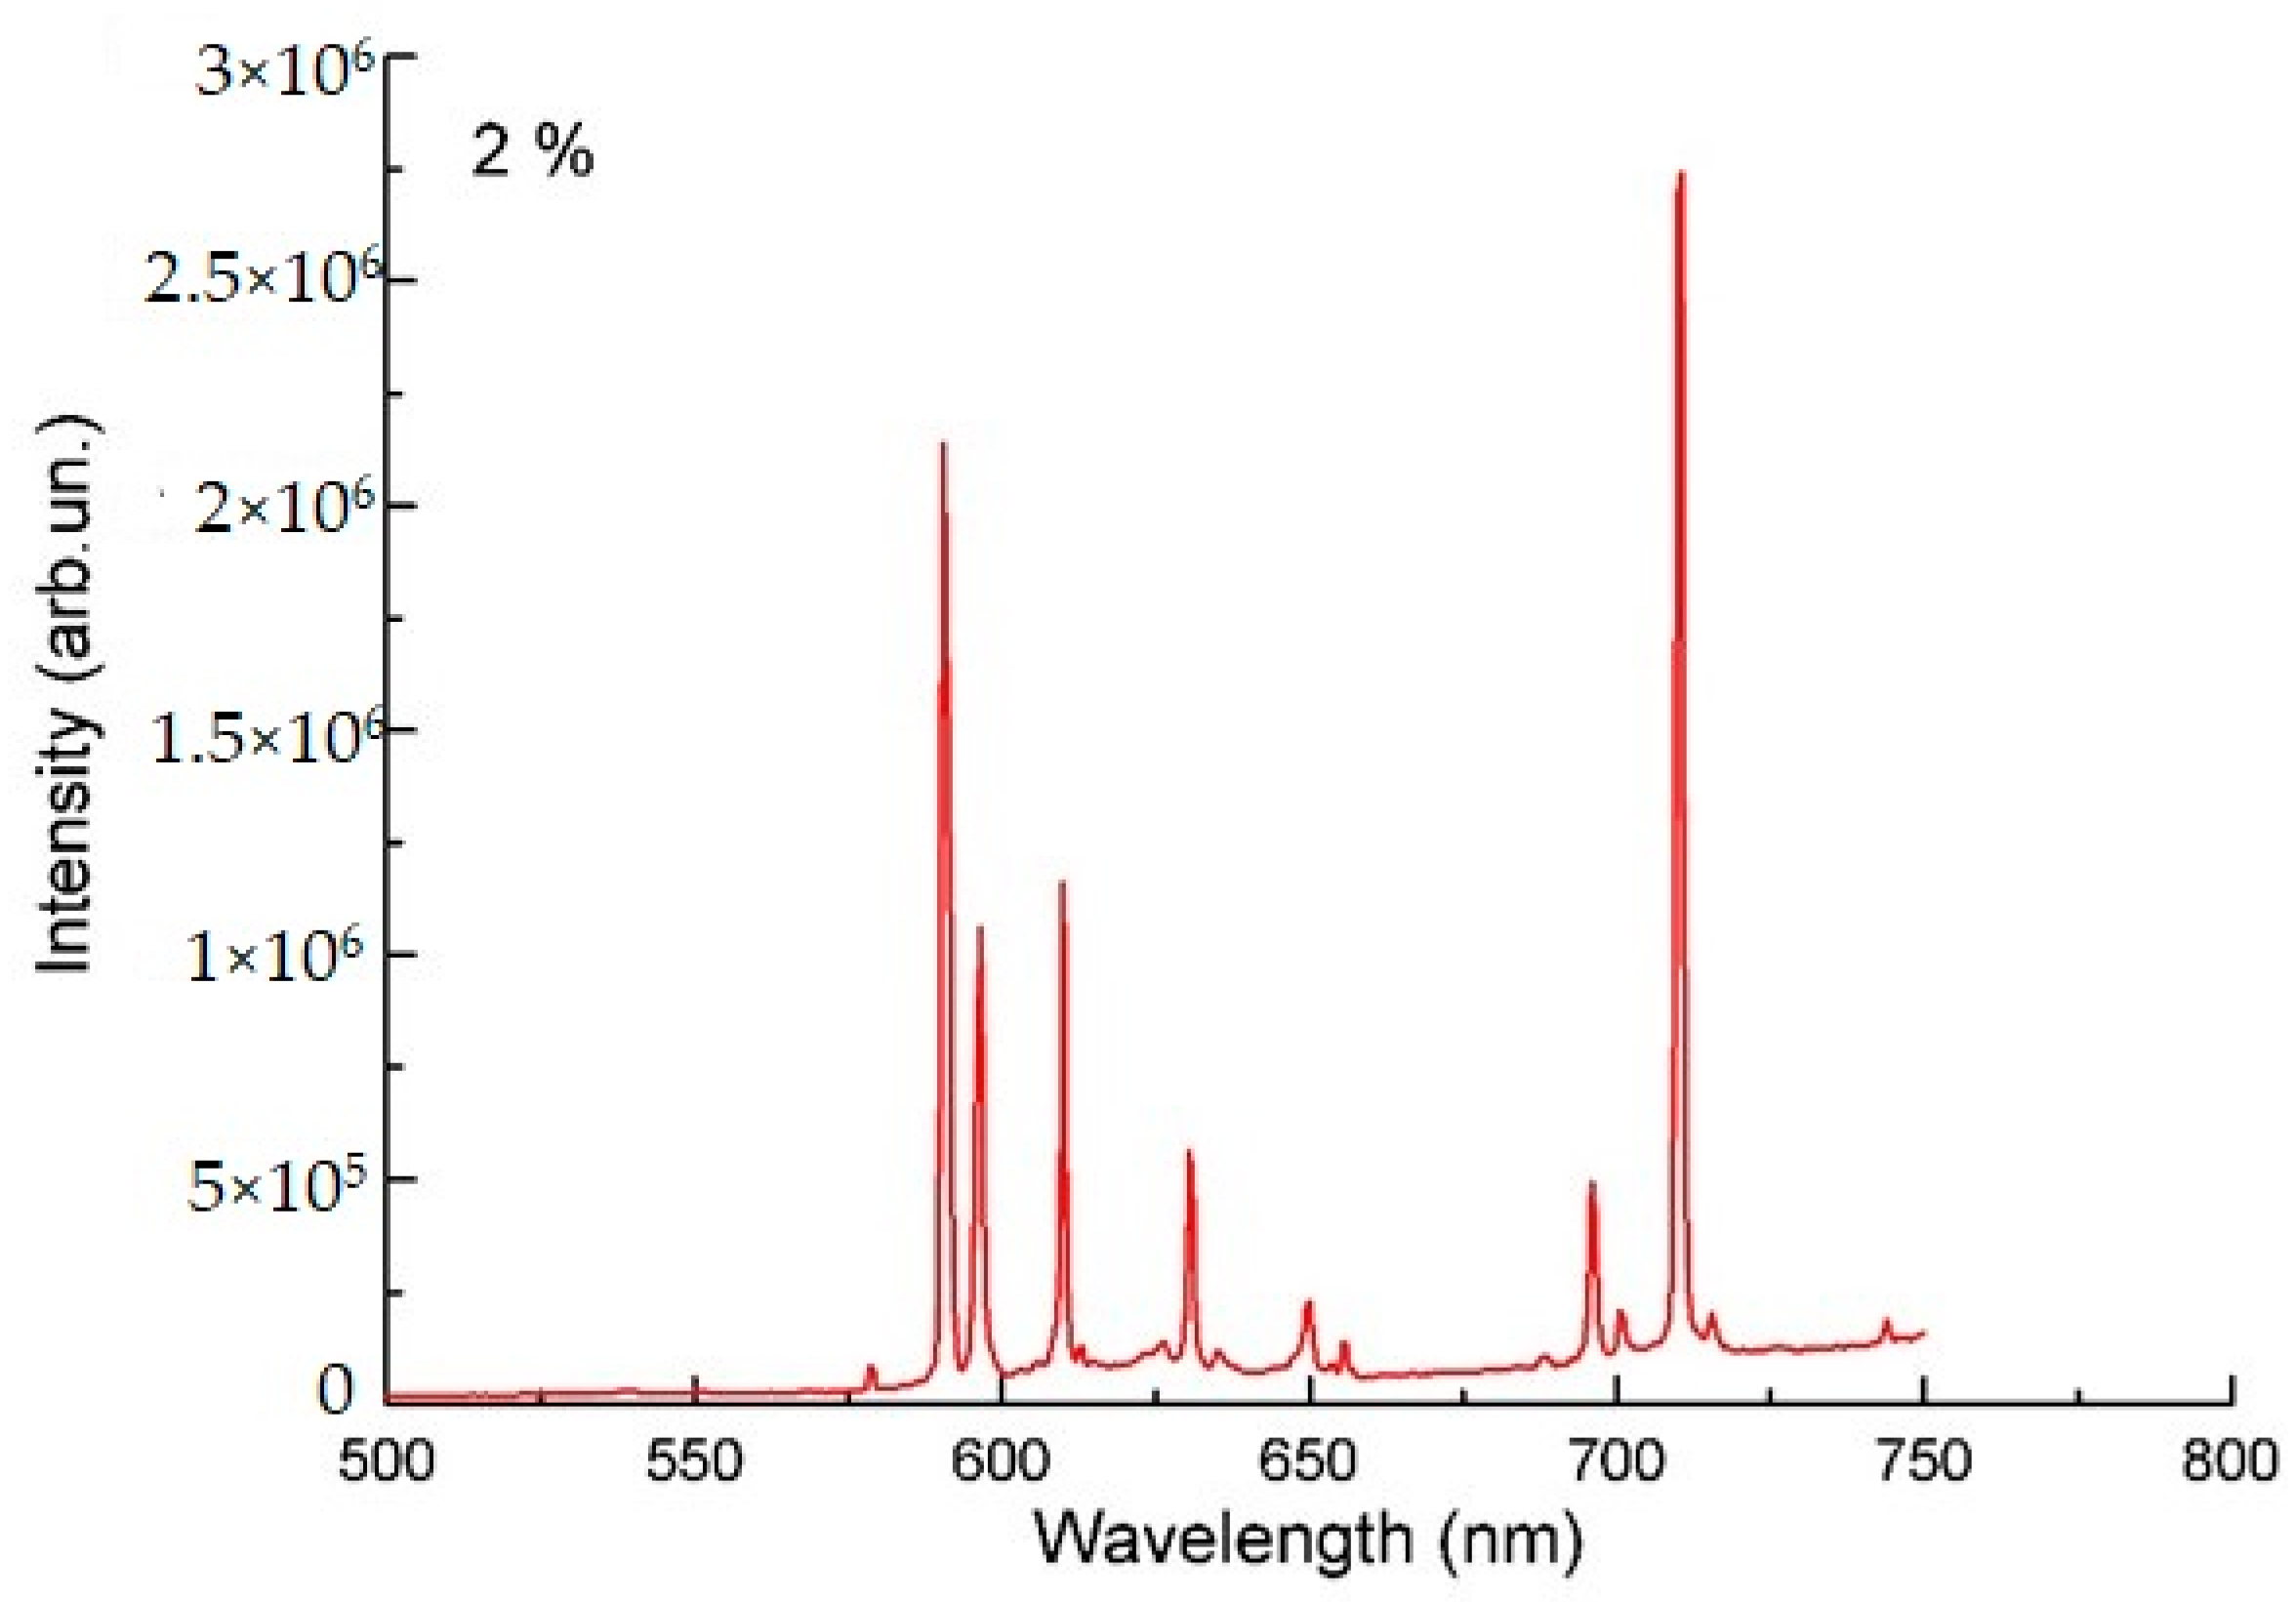
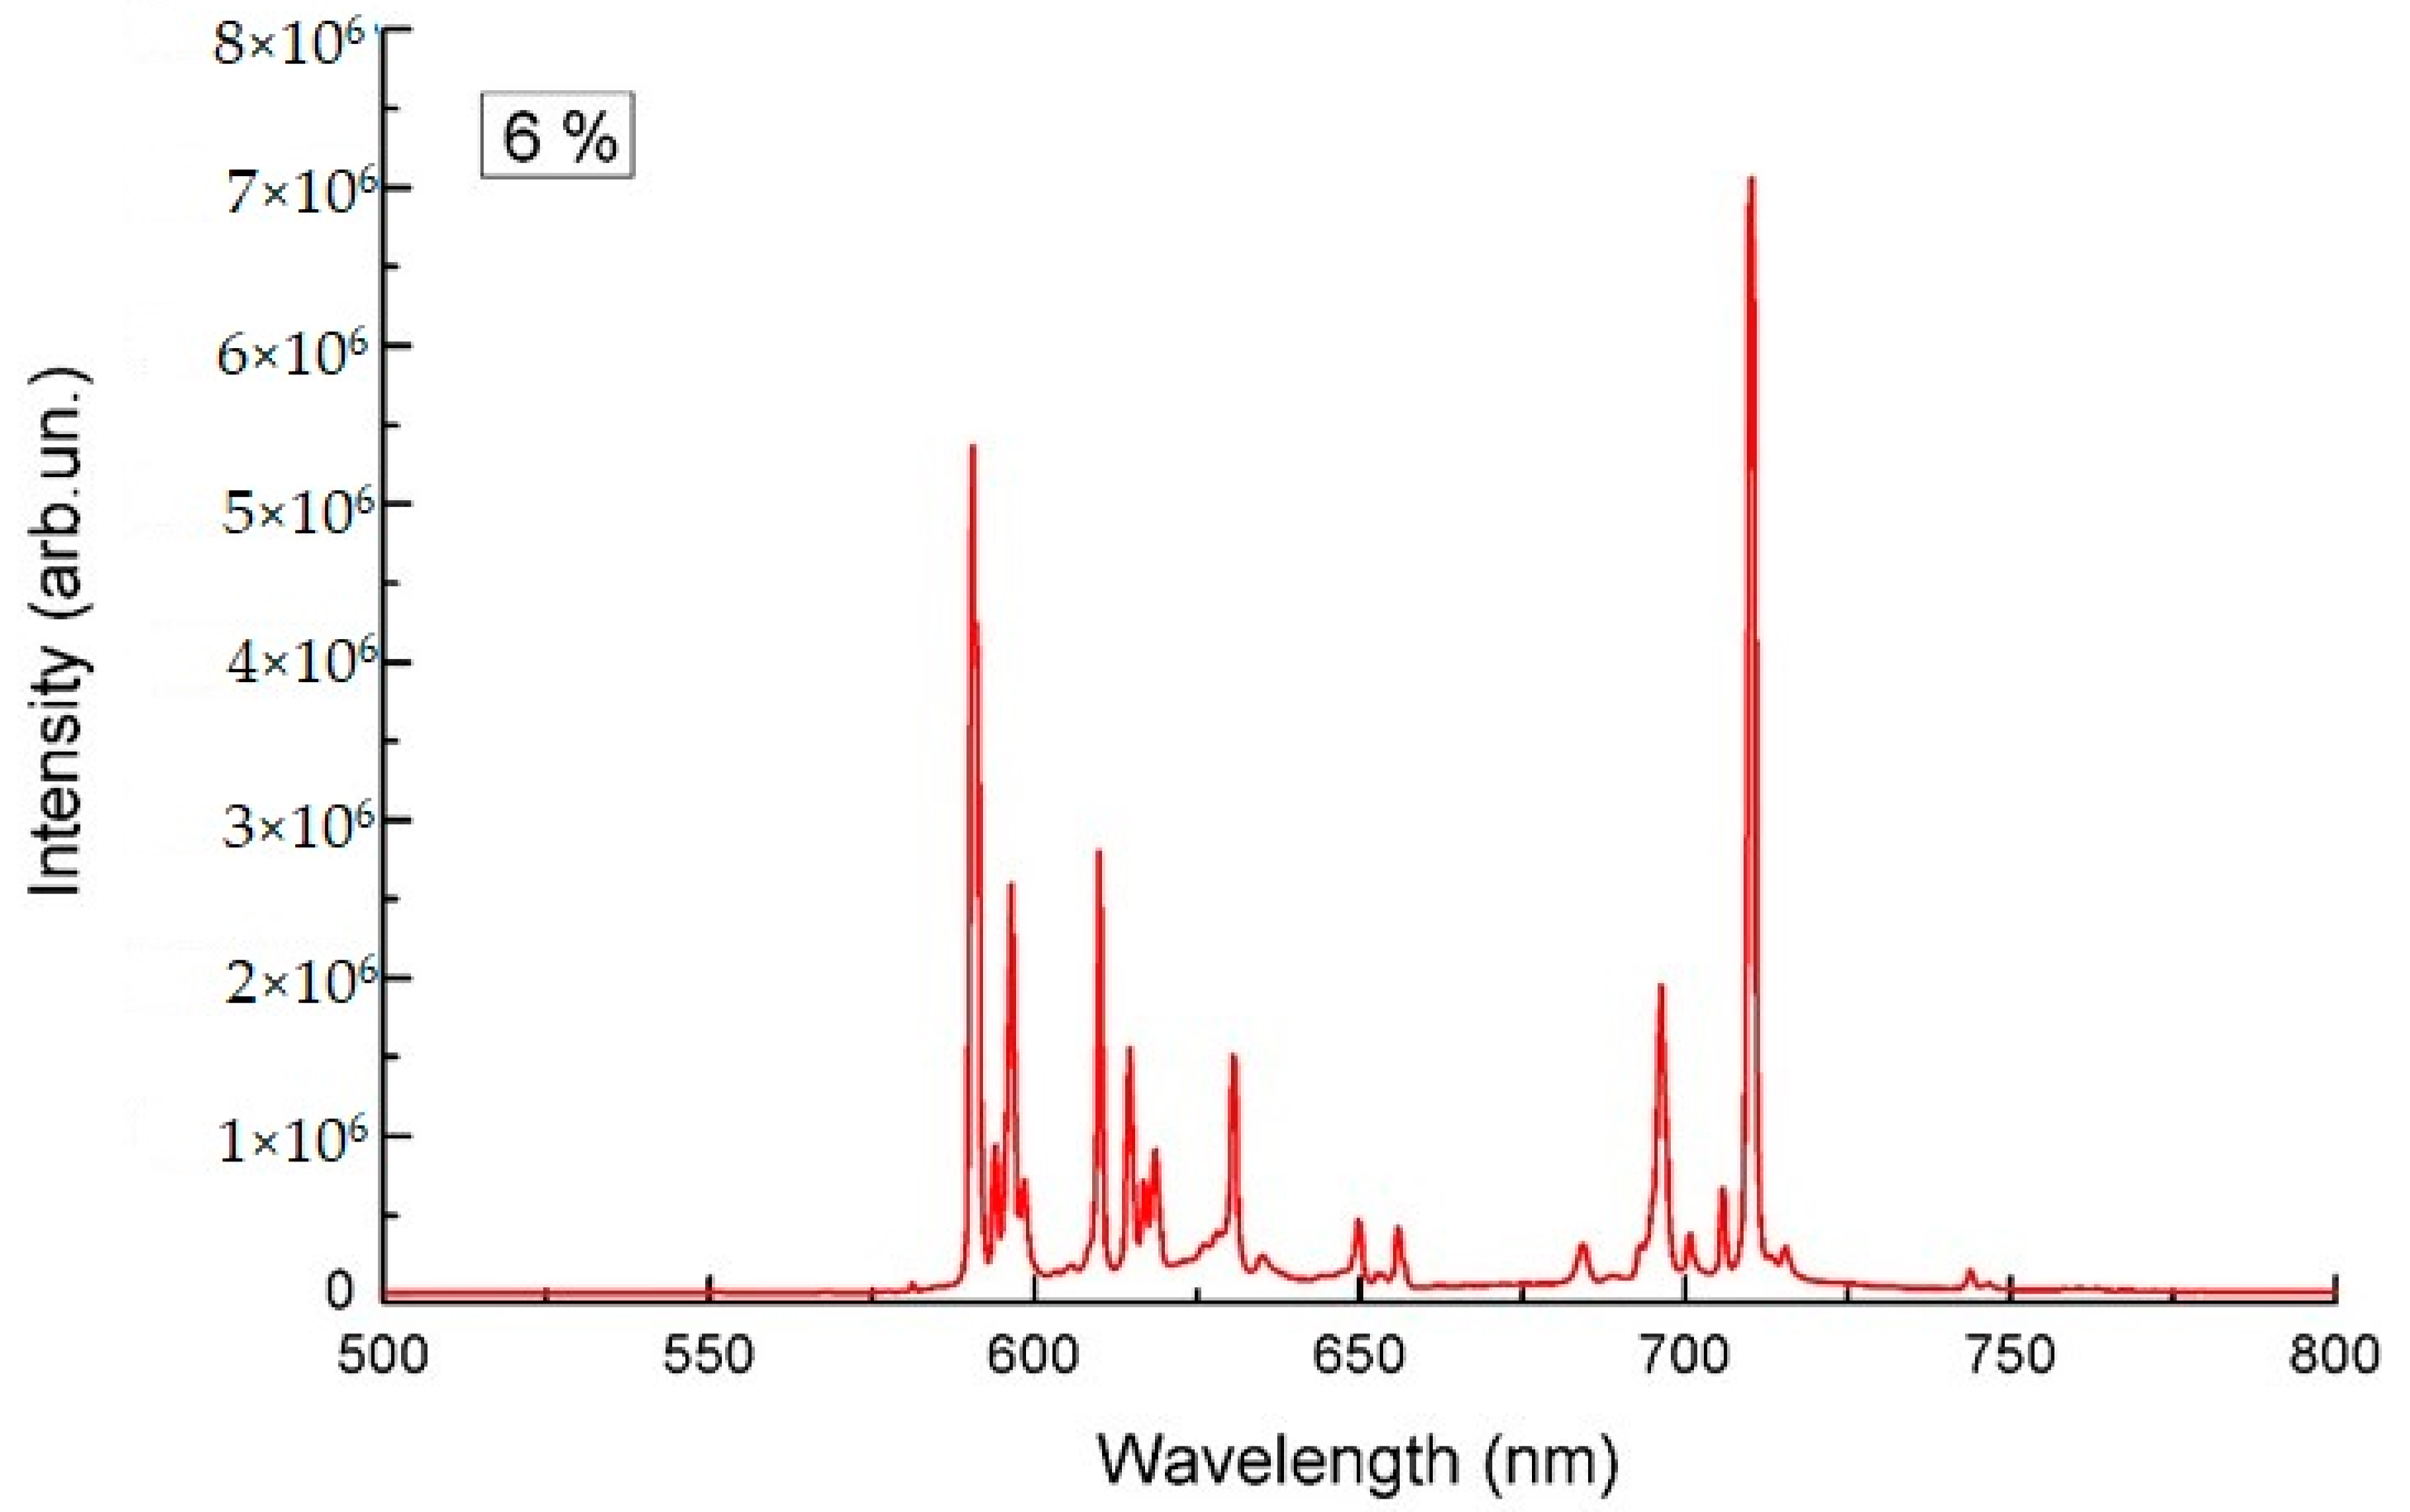
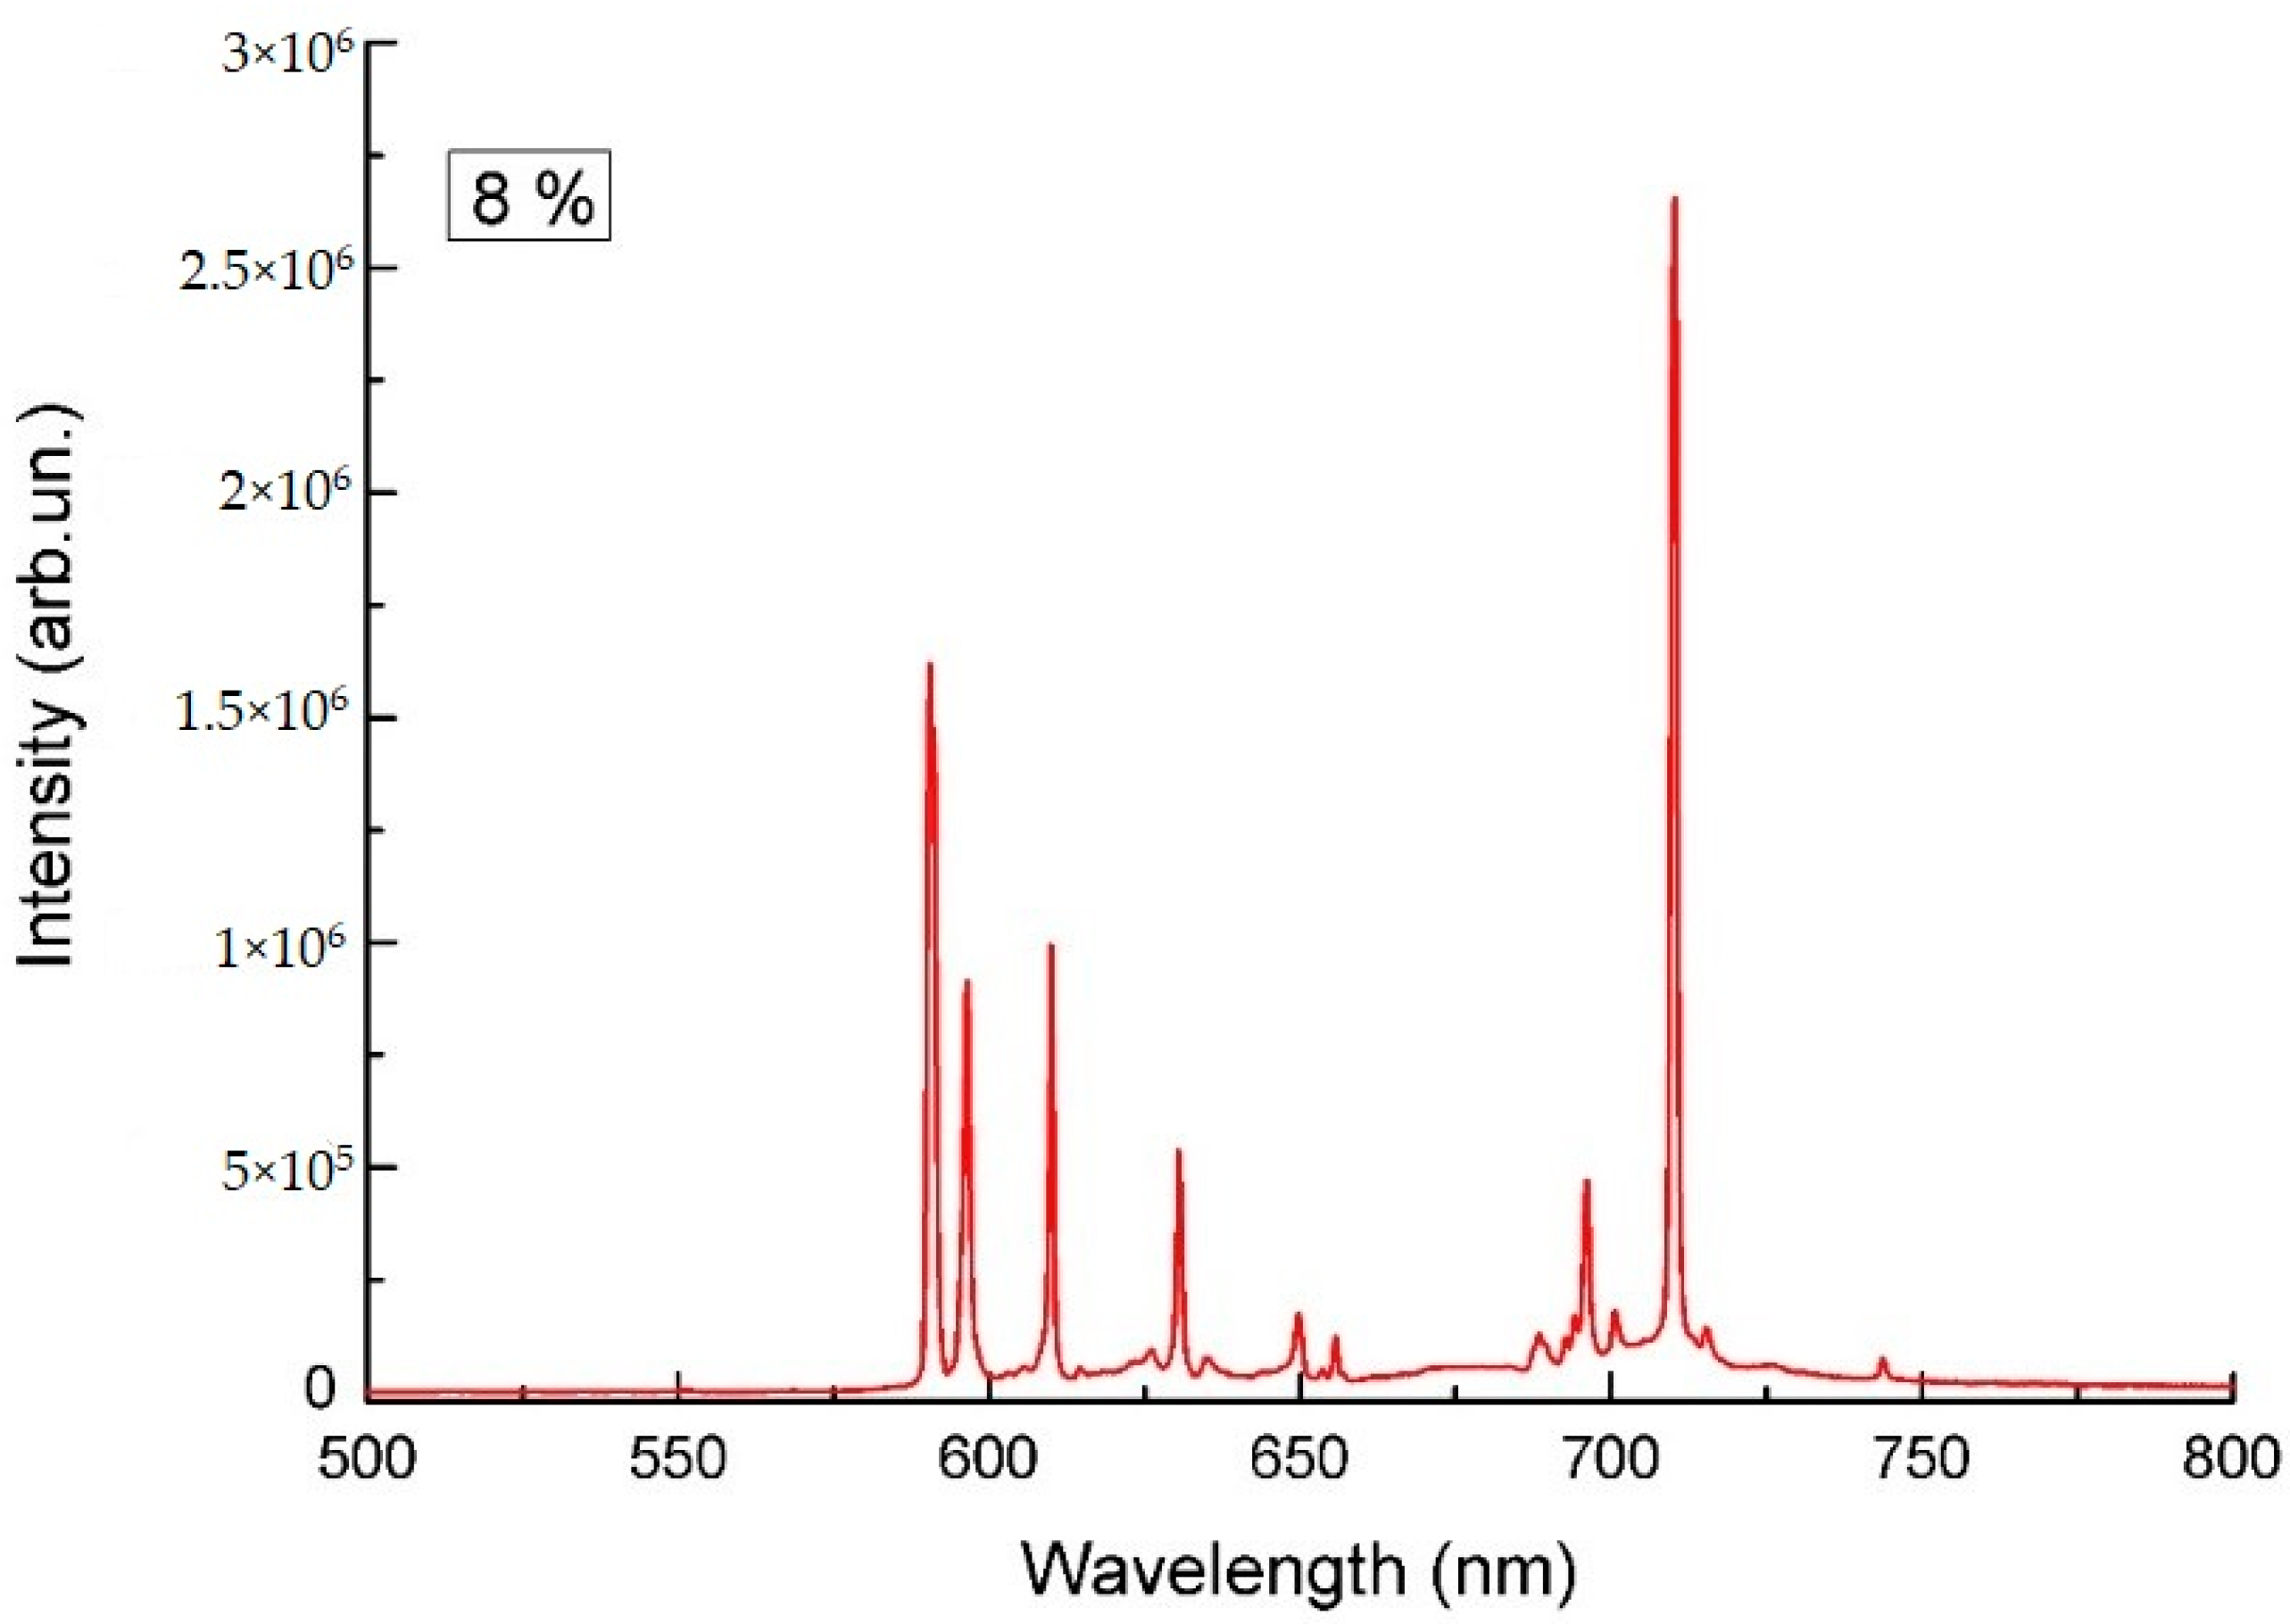
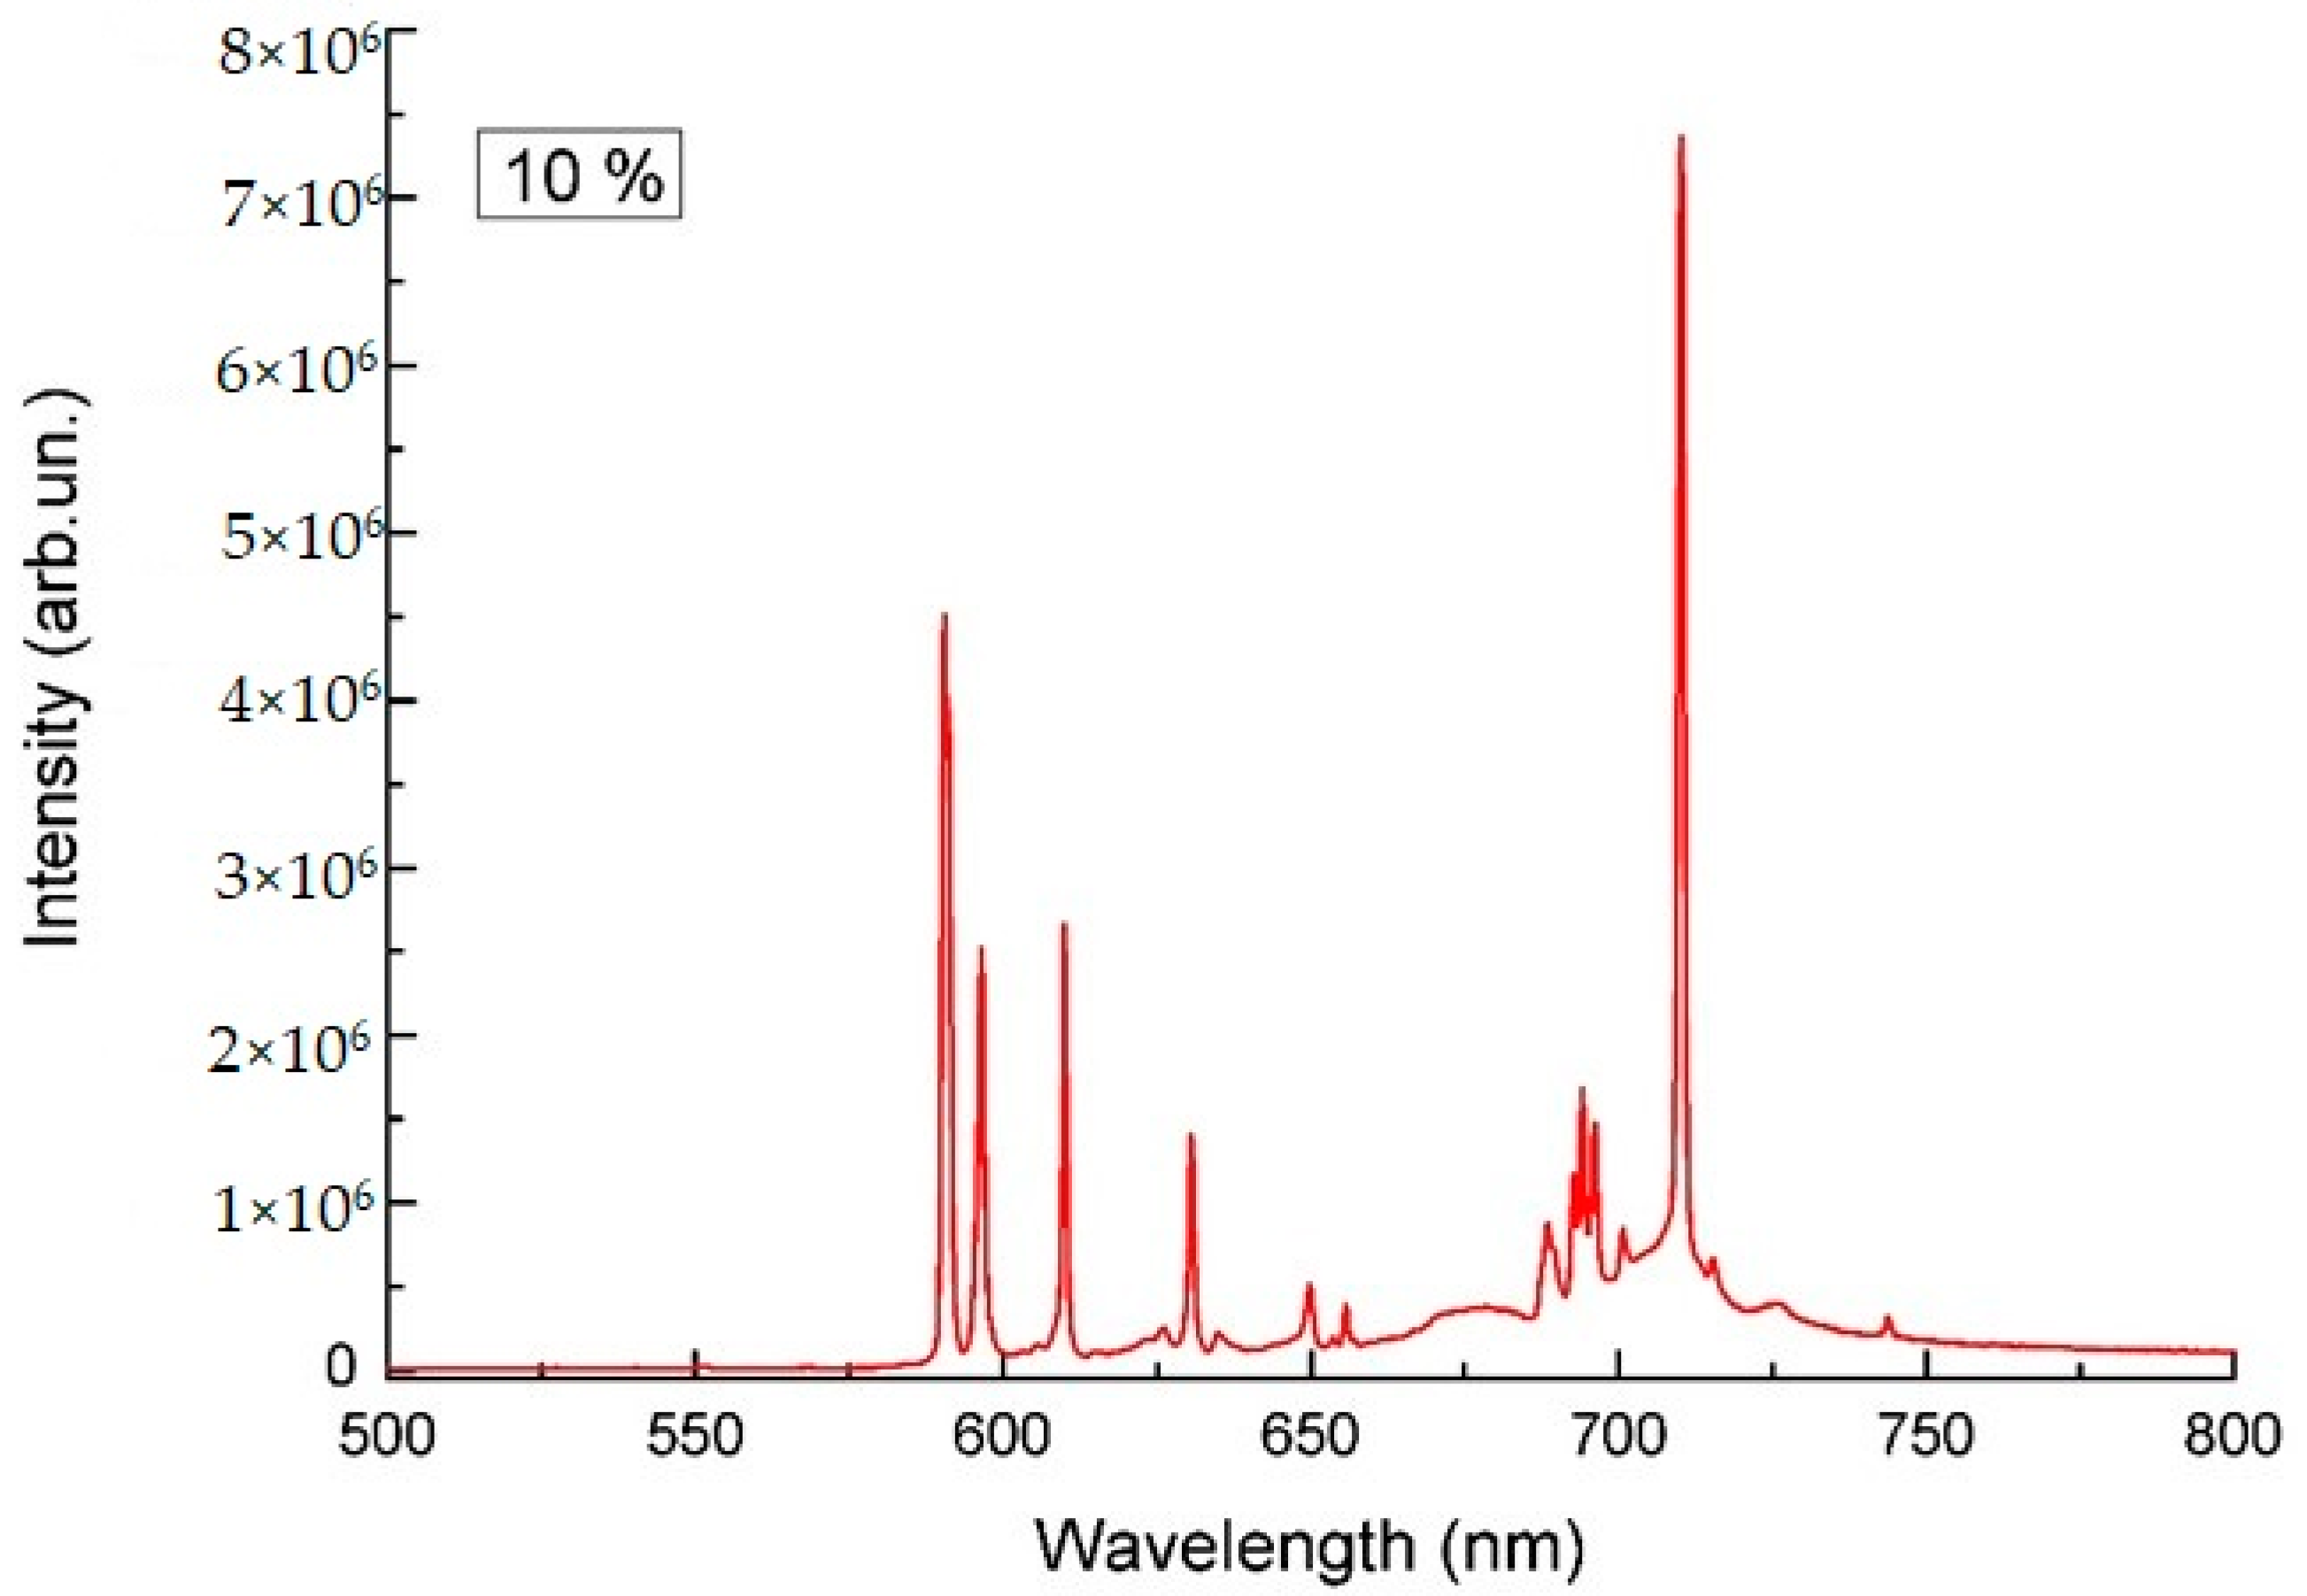
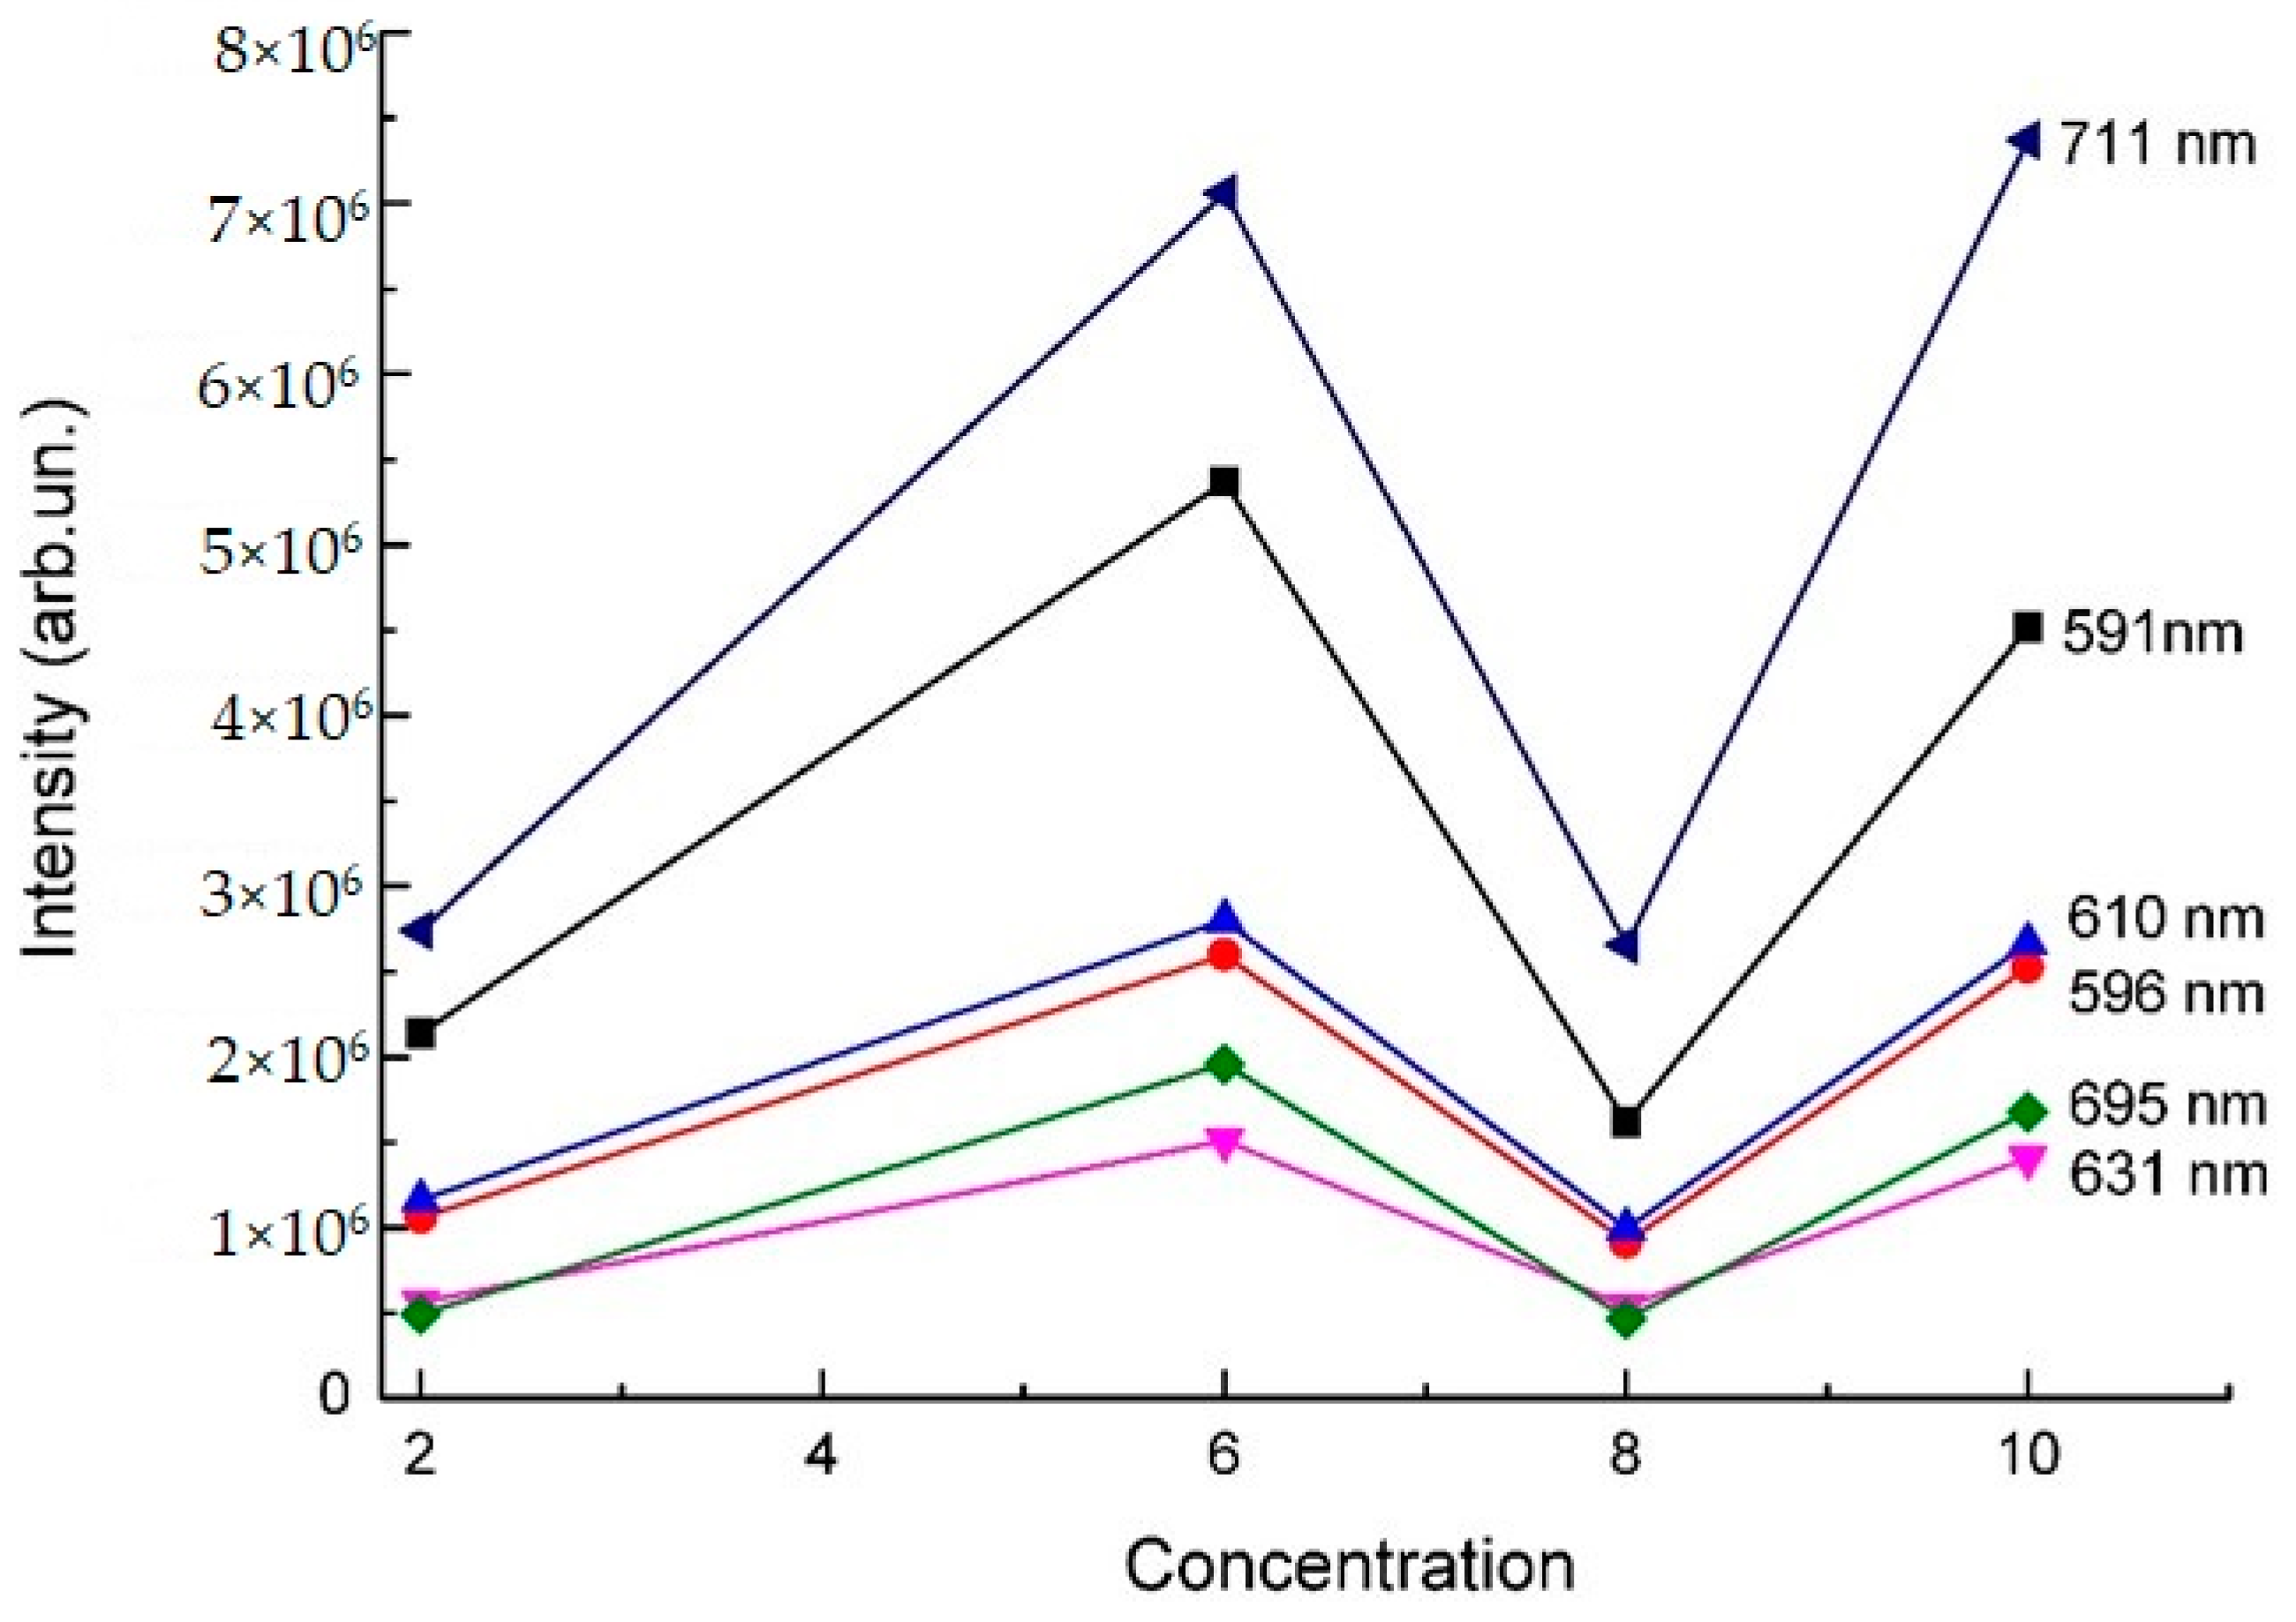
3.2. Photoluminescence Spectra

In the photoluminescence spectra of the YAG:Eu samples, five main bands at 587, 592, 611, and 631 nm were registered, associated with the 5D07FJ (J = 0, 1, 2) transitions in Eu3+ ions [15]. Two further bands were observed at 695 and 713 nm (Figure 10). The location of the PL maxima depended on the Eu sites: 592 nm corresponded to a high-symmetry site, while 611 nm corresponded to a low-symmetry site.
The ratio of the intensities of the high-symmetry ion transition band to low-symmetry ion band provides important information. With this ratio, a decrease in dopant ions tends to lead to the occupation of high-energy sites. With 2, 6, 8, and 10% Eu, the ratios were 1.84, 1.9, 1.62, and 1.7, respectively. We conclude that with an increase in the Eu concentration, the dopant ions tended to occupy high-energy sites.
The red-to-orange R/O values decreased with an increase in the activator content, indicating that the Eu ions tended to occupy high-symmetry sites. Moreover, the R/O ratio depended on the excitation wavelength.
The series of narrow lines (λ ≈ 650, 656, and 725 nm) in the pure YAG phase had the same nature as yttrium oxide. These radiations belonged to the bound YO radical within the yttrium ion. Moreover, in sample garnets doped with 8 and 10% Eu, these bands were very narrow, while in the sample doped with 6% Eu, the band at 710 nm was wider, associated with the corundum phase. Figure 10 shows the PLE spectra of YAG:Eu (2%).
In the case with an Eu concentration of 6% (Figure 11), there were a lot of low-intensity bands between 600 and 625 nm. These bands were due to the presence of a YAlO3 phase.
Eu3+ has emissions in the red 5D07F1 (625 nm) and orange 5D07F1 (580 nm) ranges; this is used in different inorganic compounds targeting white light emission [6]. In the case of 2% Eu, we can observe that the lines at 579 and 626 nm corresponded to Eu.
In the case of an Eu concentration of 6%, we observed lines between 587 and 592 nm and 611 and 635 nm due to the presence of a perovskite phase in the sample.
In the 8% Eu-doped sample (Figure 12), there was a maximum at 626 nm, corresponding to Eu, the intensity of which was higher than the 2% Eu-doped sample. Figure 13 shows the spectra of PL of 10% doped sample.
With the increase in the Eu concentration, the intensity of the 675 nm band increased, and the intensity of the 626 nm Eu band decreased compared to the 8% sample.
Subsequently, we performed an analysis of the intensity dependency of the bands on the Eu concentration (Figure 14).
When observing the intensity dependency of the main luminescence bands, the following dynamics were observed: as the Eu concentration increased from 2 to 6%, the intensities insignificantly increased; from 6 to 8%, they reached their minimum values, and they increased insignificantly at 10% Eu. Concentration quenching was observed from 6 to 8% Eu. Additionally, in the case of 10% Eu, the other radiation processes were included with the high concentration of ions and the change in the lattice constant.
In [8], the luminescent emission of YAG:Eu samples was enhanced when the Eu content increased from 1 to 7 mol%. However, these concentrations were low even when quenching did not take place. Additionally, in this work, the emission intensity of the 610 nm band increased when the Eu3+ concentration was saturated (∼5 mol% Eu) and then slowly decreased. On the other hand, the PL intensity of the orange component (592 nm) increased continuously without reaching saturation even at 7 mol% Eu [8]. If we compare the intensities at 2 and 8% Eu, a decrease in intensity is observed.
The luminescence band at 710 nm was the strongest and corresponded to the formation of complex optical centers in the corundum phase, including Eu molecular groups. The intensity of this particular band did not decrease with an increase in the Eu concentration up to 10%.
For a more detailed analysis in the Quantum expresso 2.0 program, the density of states was simulated when 2, 3, and 4 were doped with Eu ions, approximately corresponding to concentrations of 6, 8, and 10%, respectively (Figure 15, Figure 16 and Figure 17).
From the analysis of the density of states of the yttrium–aluminum garnets doped with 2, 3, and 4 Eu ions per unit cell, it can be seen that the band gap increased with the increasing doping degree. According to the DOS analysis, 4 eV corresponded to two ions, 4.2 eV for three ions, and 4.6 eV for four activator ions. The Eu occupancy levels fell at −34 eV and −13 eV when doped with two ions; the level occupancy width increased with an increasing Eu concentration. Thus, at an Eu concentration of 10%, the population width increased to 1 eV, while at 6% it was about 0.7 eV.
As the concentration increased, the band gap began to increase for 6, 8, and 10% Eu due to concentration quenching. Here, a contradiction was found with his experiment, where the luminescence intensity for all bands increased from 6 to 8% Eu. However, in [16,17,18], doping led to a decrease in the band gap.
We observed the increase in intensities of all lines with an increase in the dopant concentrations and equal intensities values for the samples with 8 and 10% Eu.
The heterogeneity of the samples decreased with the increase in the Eu concentration from 6 to 10%.
The absorption spectra of YAG:Eu at 300–600 nm are shown in Figure 18.
Two absorption bands were observed at wavelengths 375 and 400 nm. Starting from 10% Eu, the band at 400 nm began to vanish. The deepest absorption line was observed at 6% Eu. Therefore, we conclude that the maximum absorption is at 6% Eu. As is known, with an increase in the Eu concentration, quenching begins to be observed due to saturation. Additionally, in this case there were a lot of light-absorbing centers. The condition from saturation was near 6% Eu doping; therefore, the absorption at 6% Eu doping is the maximal compared with 2 and 8%.

4. Conclusions

The materials used in this research were prepared by the solid-state synthesis method in a recovery environment for graphite tiles. As can be seen from the diffraction analysis patterns, the most heterogeneous sample was the YAG:Eu (6%) sample, and the sample containing 10% Eu was the purest one.
From the photoluminescence excitation spectra, we can see that the PLE intensities of all the bands increased from 2 to 8% Eu doping before beginning to fall.
In the photoluminescence spectra of the YAG:Eu samples, five main bands at 587, 592 nm, 611, 631, and 711 nm were registered. The tendency of europium ions to occupy high-symmetry sites showed an interesting pattern—a decrease from 2 to 8% and an increase from 8 to 10%.
When observing the intensity dependency of the main luminescence bands, the following dynamics were seen. As the concentration increased from 2 to 6%, the intensities increased insignificantly; from 6 to 8%, they reached their minimum value, while an insignificant increase was seen at 10% Eu.
From the analysis of the density of states of the yttrium–aluminum garnets doped with 2, 3, and 4 Eu ions per unit cell, corresponding to approximately 6, 8, and 10%, it can be seen that the band gap increased when increasing the degree of doping. However, at low concentrations, increasing the degree of doping decreased the bandgap (up to 1–2%).

Author Contributions

Conceptualization, N.Z. and D.S.; methodology, Z.A.; software, D.S.; validation, A.Z. and K.B.; formal analysis, Z.A.; investigation, N.Z.; resources, D.S.; data curation, A.Z.; writing—original draft preparation, K.B.; writing—review and editing, N.Z.; visualization, Z.A.; supervision, N.Z.; project administration, A.Z. All authors have read and agreed to the published version of the manuscript.

Funding

This research was funded by the Ministry of Science and Higher Education of the Republic of Kazakhstan by project No. AP09057946 “Spectroscopic studies of functional materials based on perovskites and garnets doped with Ln2+, Ln3+, Ln4+”.

Institutional Review Board Statement

Not applicable.

Informed Consent Statement

Informed consent was obtained from all subjects involved in the study.

Data Availability Statement

The data presented in this study are available in this article.

Acknowledgments

The authors would like the thank Tadeusz Lesniewski and Karol Szczodrowski (University of Gdansk, Institute of Experimental Physics) for help with the experiments, XRD analysis, and discussion.

Conflicts of Interest

The authors declare no conflict of interest.

References

  1. Drabik, J.; Marciniak, L. The influence of Eu3+ concentration on the spectroscopic properties of YAG:Ti, Eu3+ nanocrystalline luminescent thermometer. J. Lumin. 2019, 208, 213–217. [Google Scholar] [CrossRef]
  2. Santos, J.C.A.; Silva, E.P.; Sampaio, D.V.; Silva, D.C.; Souza, N.R.S.; Kucera, C.; Ballato, J.; Silva, R.S. Effect of the Ce3+ concentration on laser-sintered YAG ceramics for white LEDs applications. J. Eur. Ceram. Soc. 2020, 40, 3673–3678. [Google Scholar] [CrossRef]
  3. Kolesnikov, I.E.; Tolstikova, D.V.; Kurochkin, A.V.; Manshina, A.A.; Mikhailov, M.D. Eu3+concentration effect on luminescence properties of YAG:Eu3+nanoparticles. Opt. Mater. 2014, 37, 306–310. [Google Scholar] [CrossRef]
  4. Maczka, M.; Bednarkiewicz, A.; Mendoza-Mendoza, E.; Fuentes, A.F.; Kepinski, L. Low-temperature synthesis, phonon and luminescence properties of Eu doped Y3Al5O12 (YAG) nanopowders. Mater. Chem. Phys. 2014, 143, 1039–1047. [Google Scholar] [CrossRef]
  5. Nakauchi, D.; Kawaguchi, N.; Yanagida, T. Luminescence and Scintillation Properties of Eu-doped CaAl2O4. Bulk Cryst. Sens. Mater. 2019, 31, 1249–1255. [Google Scholar]
  6. Borlafa, M.; Frankowska, M.; Kubiak, W.; Graulea, T. Strong photoluminescence emission at low dopant amount in YAG:Ce and YAG:Eu phosphors. Mater. Res. Bull. 2018, 100, 413–419. [Google Scholar] [CrossRef]
  7. Skaud, R.; Enseling, D.; Skapas, M.; Selskis, A.; Pomjakushina, E.; Jüstel, T.; Kareiva, A.; Rüegg, C. Europium—Enabled luminescent single crystal and bulk YAG and YGG for optical imaging. Opt. Mater. 2016, 60, 467–473. [Google Scholar]
  8. Muresan, L.; Popovici, E.; Perhaita, I.; Indrea, E.; Silipas, T. Effect of the europium doping on the structural and luminescent properties of yttrium aluminum garnet. Mater. Sci. Eng. B 2013, 178, 248–253. [Google Scholar] [CrossRef]
  9. Shunkeyev, K.; Tilep, A.; Sagimbaeva, S.; Ubaev, Z.; Lushchik, A. The Effect of Instability of KCl:Na Single Crystals. Crystals 2023, 13, 364. [Google Scholar] [CrossRef]
  10. Santosa, J.C.A.; Silva, E.P.; Sampaio, D.V.; Alves, Y.G.S.; Rezende, M.V.S.; Kucera, C.; Ballato, J.; Silva, R.S. Structural, microstructural, and luminescent properties of laser-sintered Eu doped YAG ceramics. Opt. Mater. 2019, 89, 334–339. [Google Scholar] [CrossRef]
  11. Potdevin, A.; Chadeyron, G.; Boyer, D.; Caillier, B.; Mahiou, R. Sol–gel based YAG:Tb3þ or Eu3þ phosphors for application in lighting sources. J. Phys. D Appl. Phys. 2005, 38, 3251–3260. [Google Scholar] [CrossRef]
  12. Ibrahim, E.; Laila, H.; Ahmed, M.; Elshafaie, A.; Samar, K.; Ahme, A. The synthesis of CuO and NiO nanoparticles by facile thermal decomposition of metal-Schiff base complexes and an examination of their electric, thermoelectric and magnetic Properties. Mater. Res. Bull. 2018, 107, 492–497. [Google Scholar] [CrossRef]
  13. Mohamed, W.; Ahmed, M. Synthesis, characterization and photocatalysis enhancement of Eu2O3-ZnO mixed oxide nanoparticles. J. Phys. Chem. Solids. 2018, 116, 375–385. [Google Scholar] [CrossRef]
  14. Song, X.; Chang, M. Rare-Earth Elements in Lighting and Optical Applications and Their Recycling. JOM 2013, 65, 1276–1282. [Google Scholar] [CrossRef]
  15. Yagoub, M.; Swarta, H.; Noto, L.; Connel, O.; Lee, M.; Coetsee, E. The effects of Eu-concentrations on the luminescent properties of SrF2: Eu nanophosphor. J. Lumin. 2014, 156, 150–156. [Google Scholar] [CrossRef]
  16. Montes, E.; Ceron, P.; Guzmán-Mendoza, J.; Falcony, C.; Angel Vallejo, M.; Antonio Sosa, M. Effect of europium concentration on the photoluminescent and thermoluminescent properties of HfO2:Eu3+ nanocrystals. Ceram. Int. 2018, 44, 8081–8086. [Google Scholar] [CrossRef]
  17. Zhao, M.; Wang, C.; Wang, Z.; Liu, Y. Theoretical and experimental research on Ce:YAG crystals for use in blue laser diode illumination. Proc. Third Int. Conf. Photonics Opt. Eng. 2019, 110521, 451–457. [Google Scholar]
  18. Zhanturina, N.; Sergeyev, D.; Aimaganbetova, Z.; Zhubaev, A.; Bizhanova, K. Structural Properties of Yttrium Aluminum Garnet, Doped with Lanthanum. Crystals 2022, 12, 1132. [Google Scholar] [CrossRef]
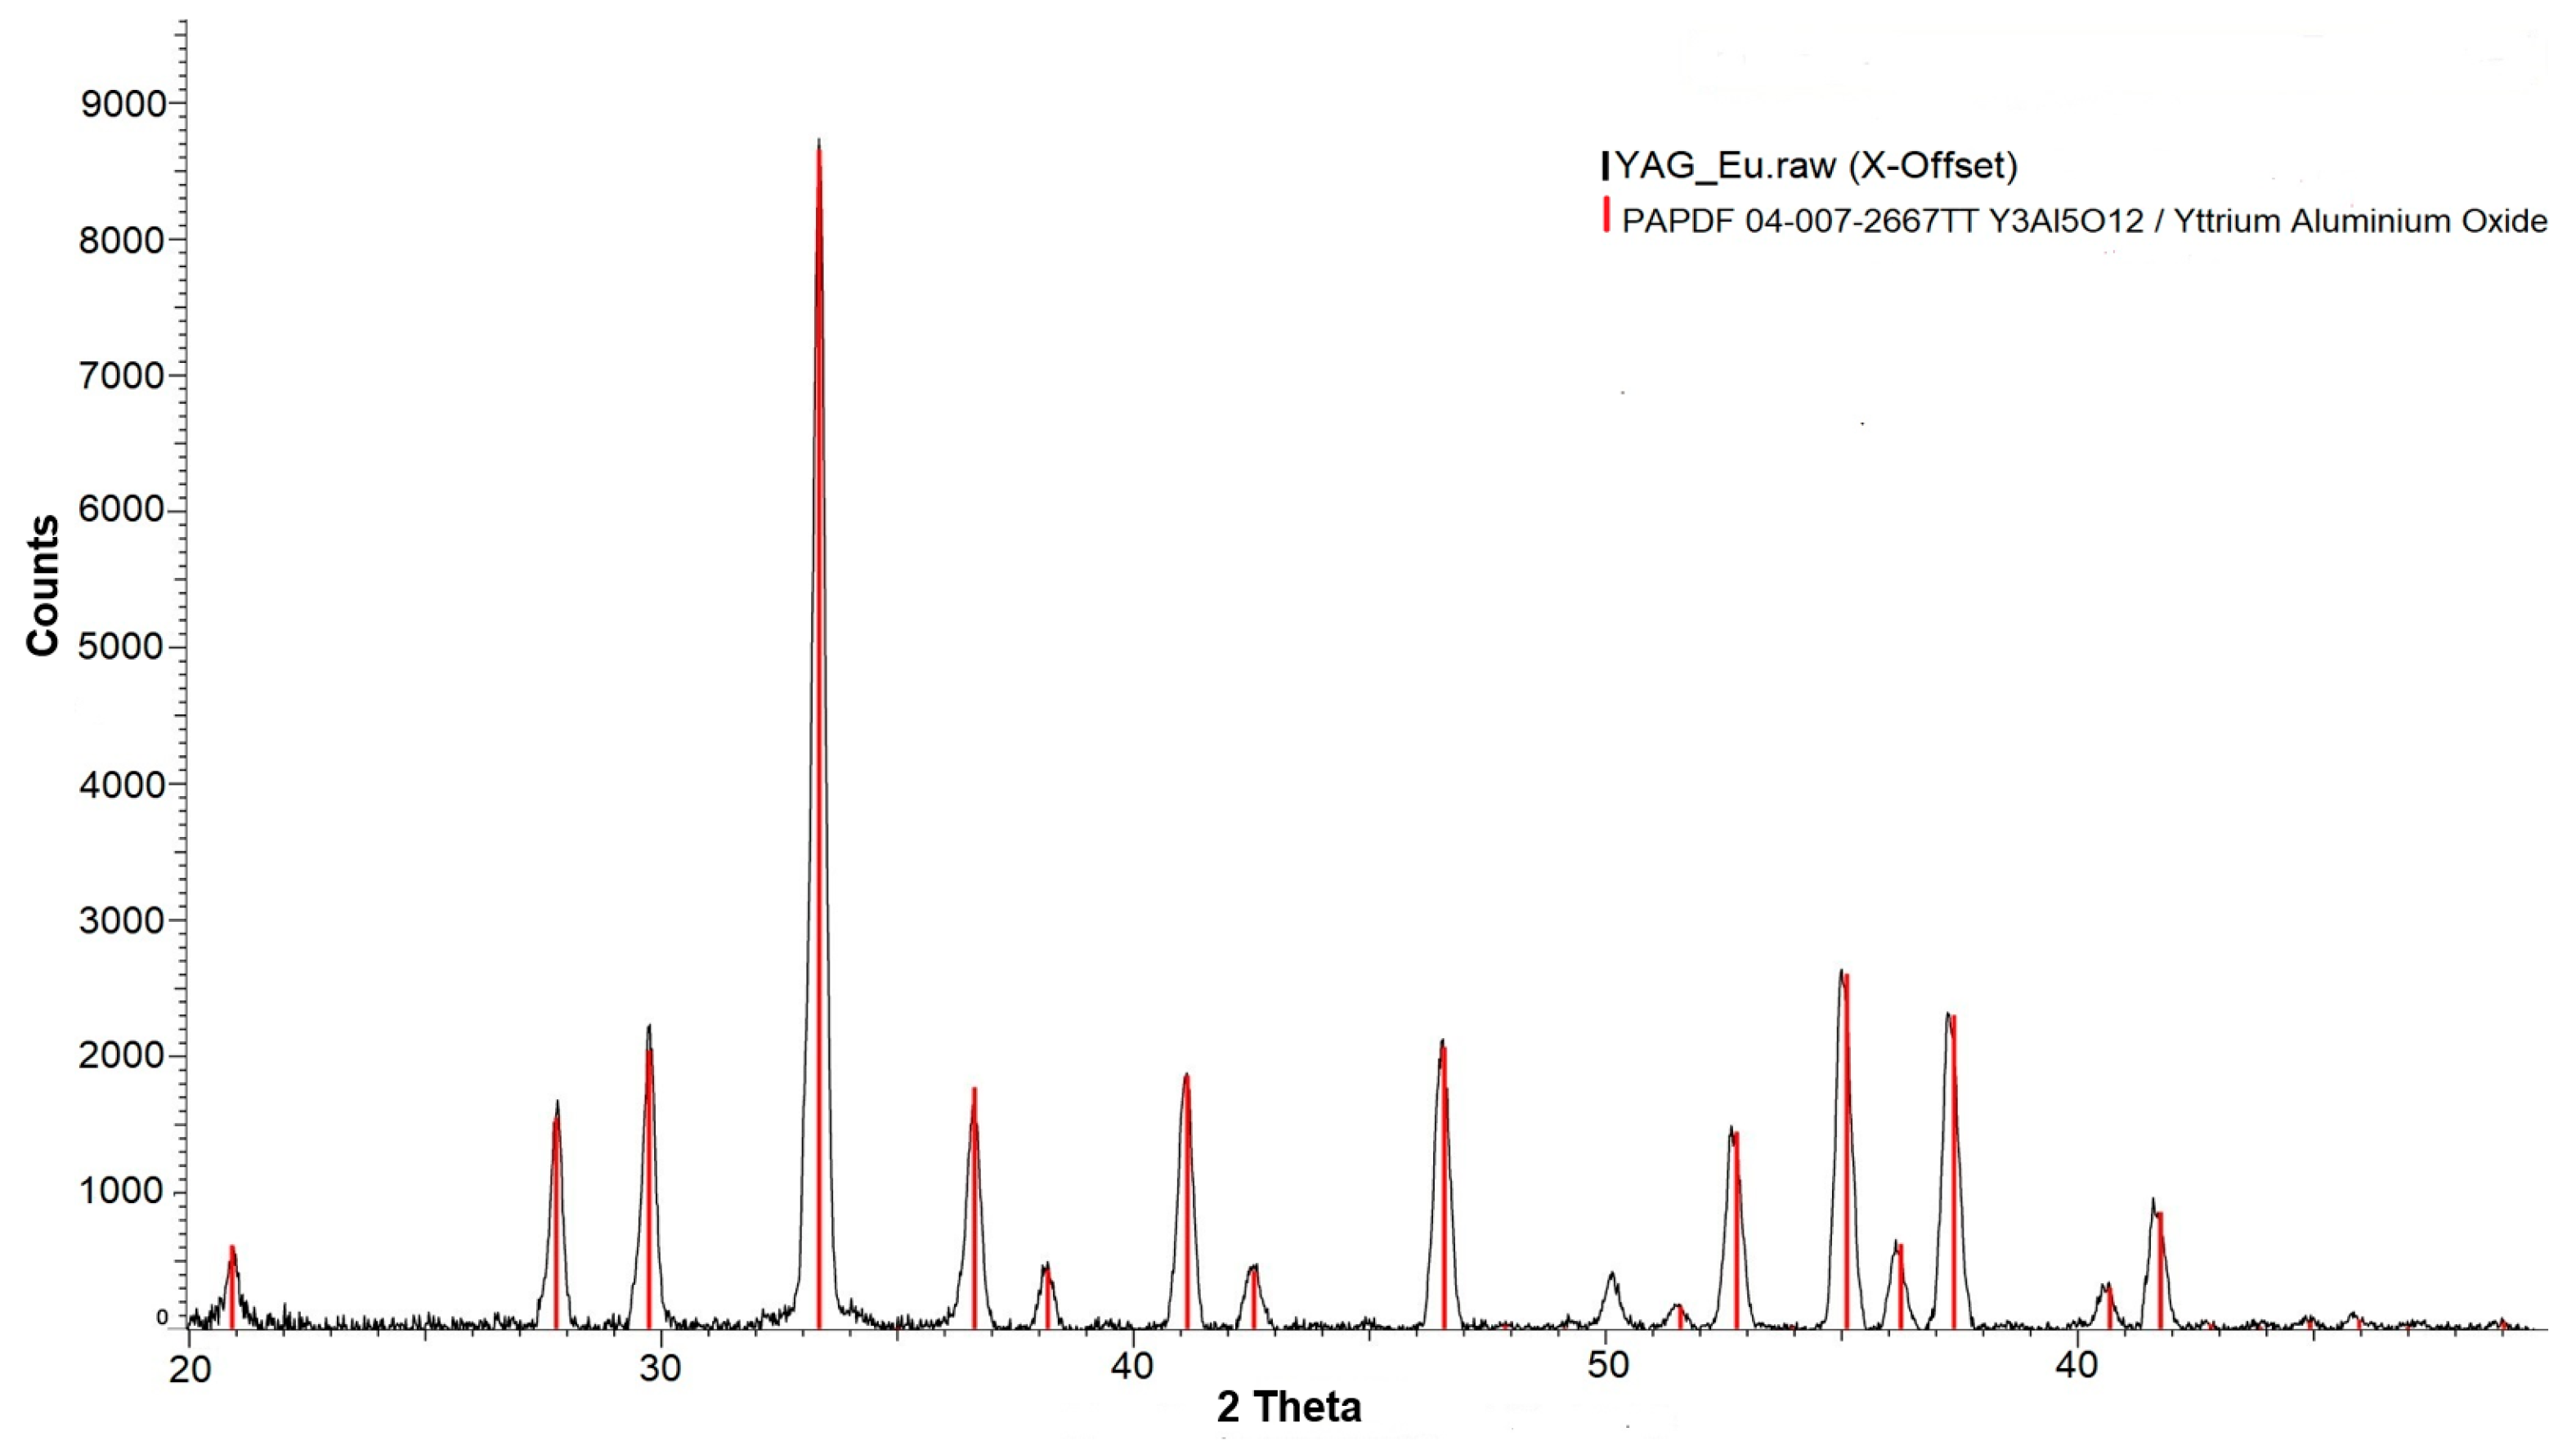
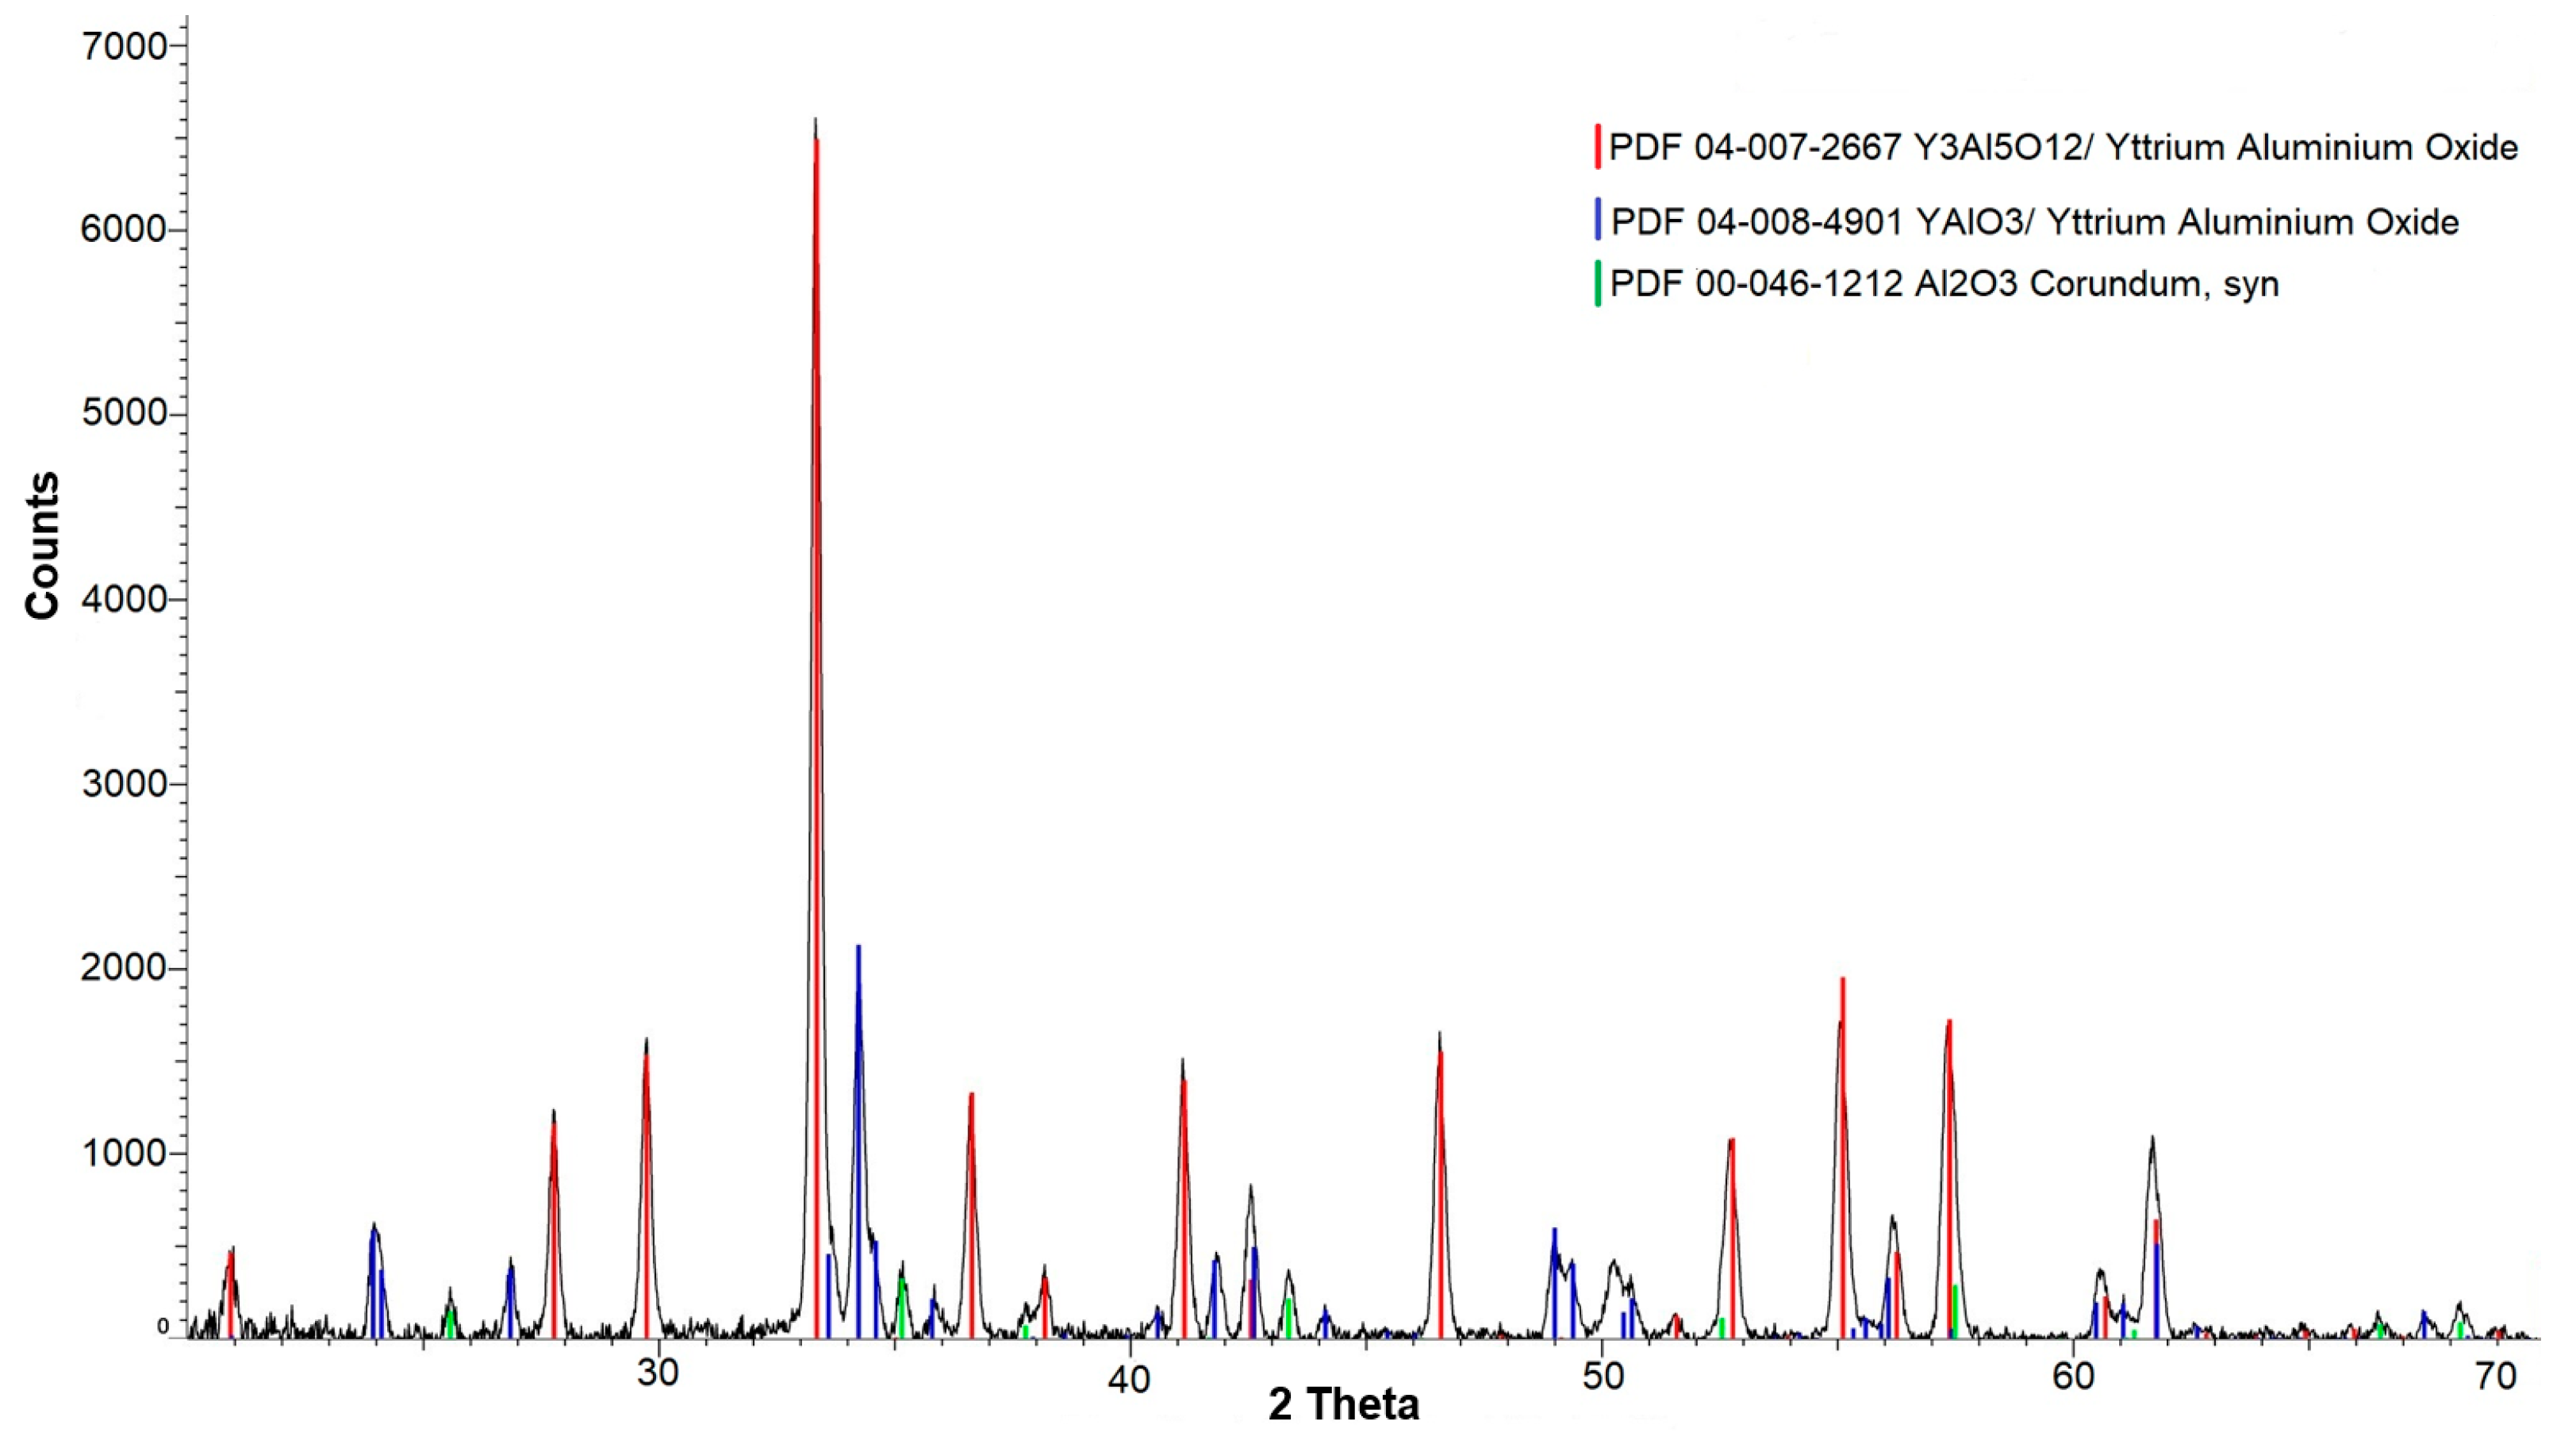
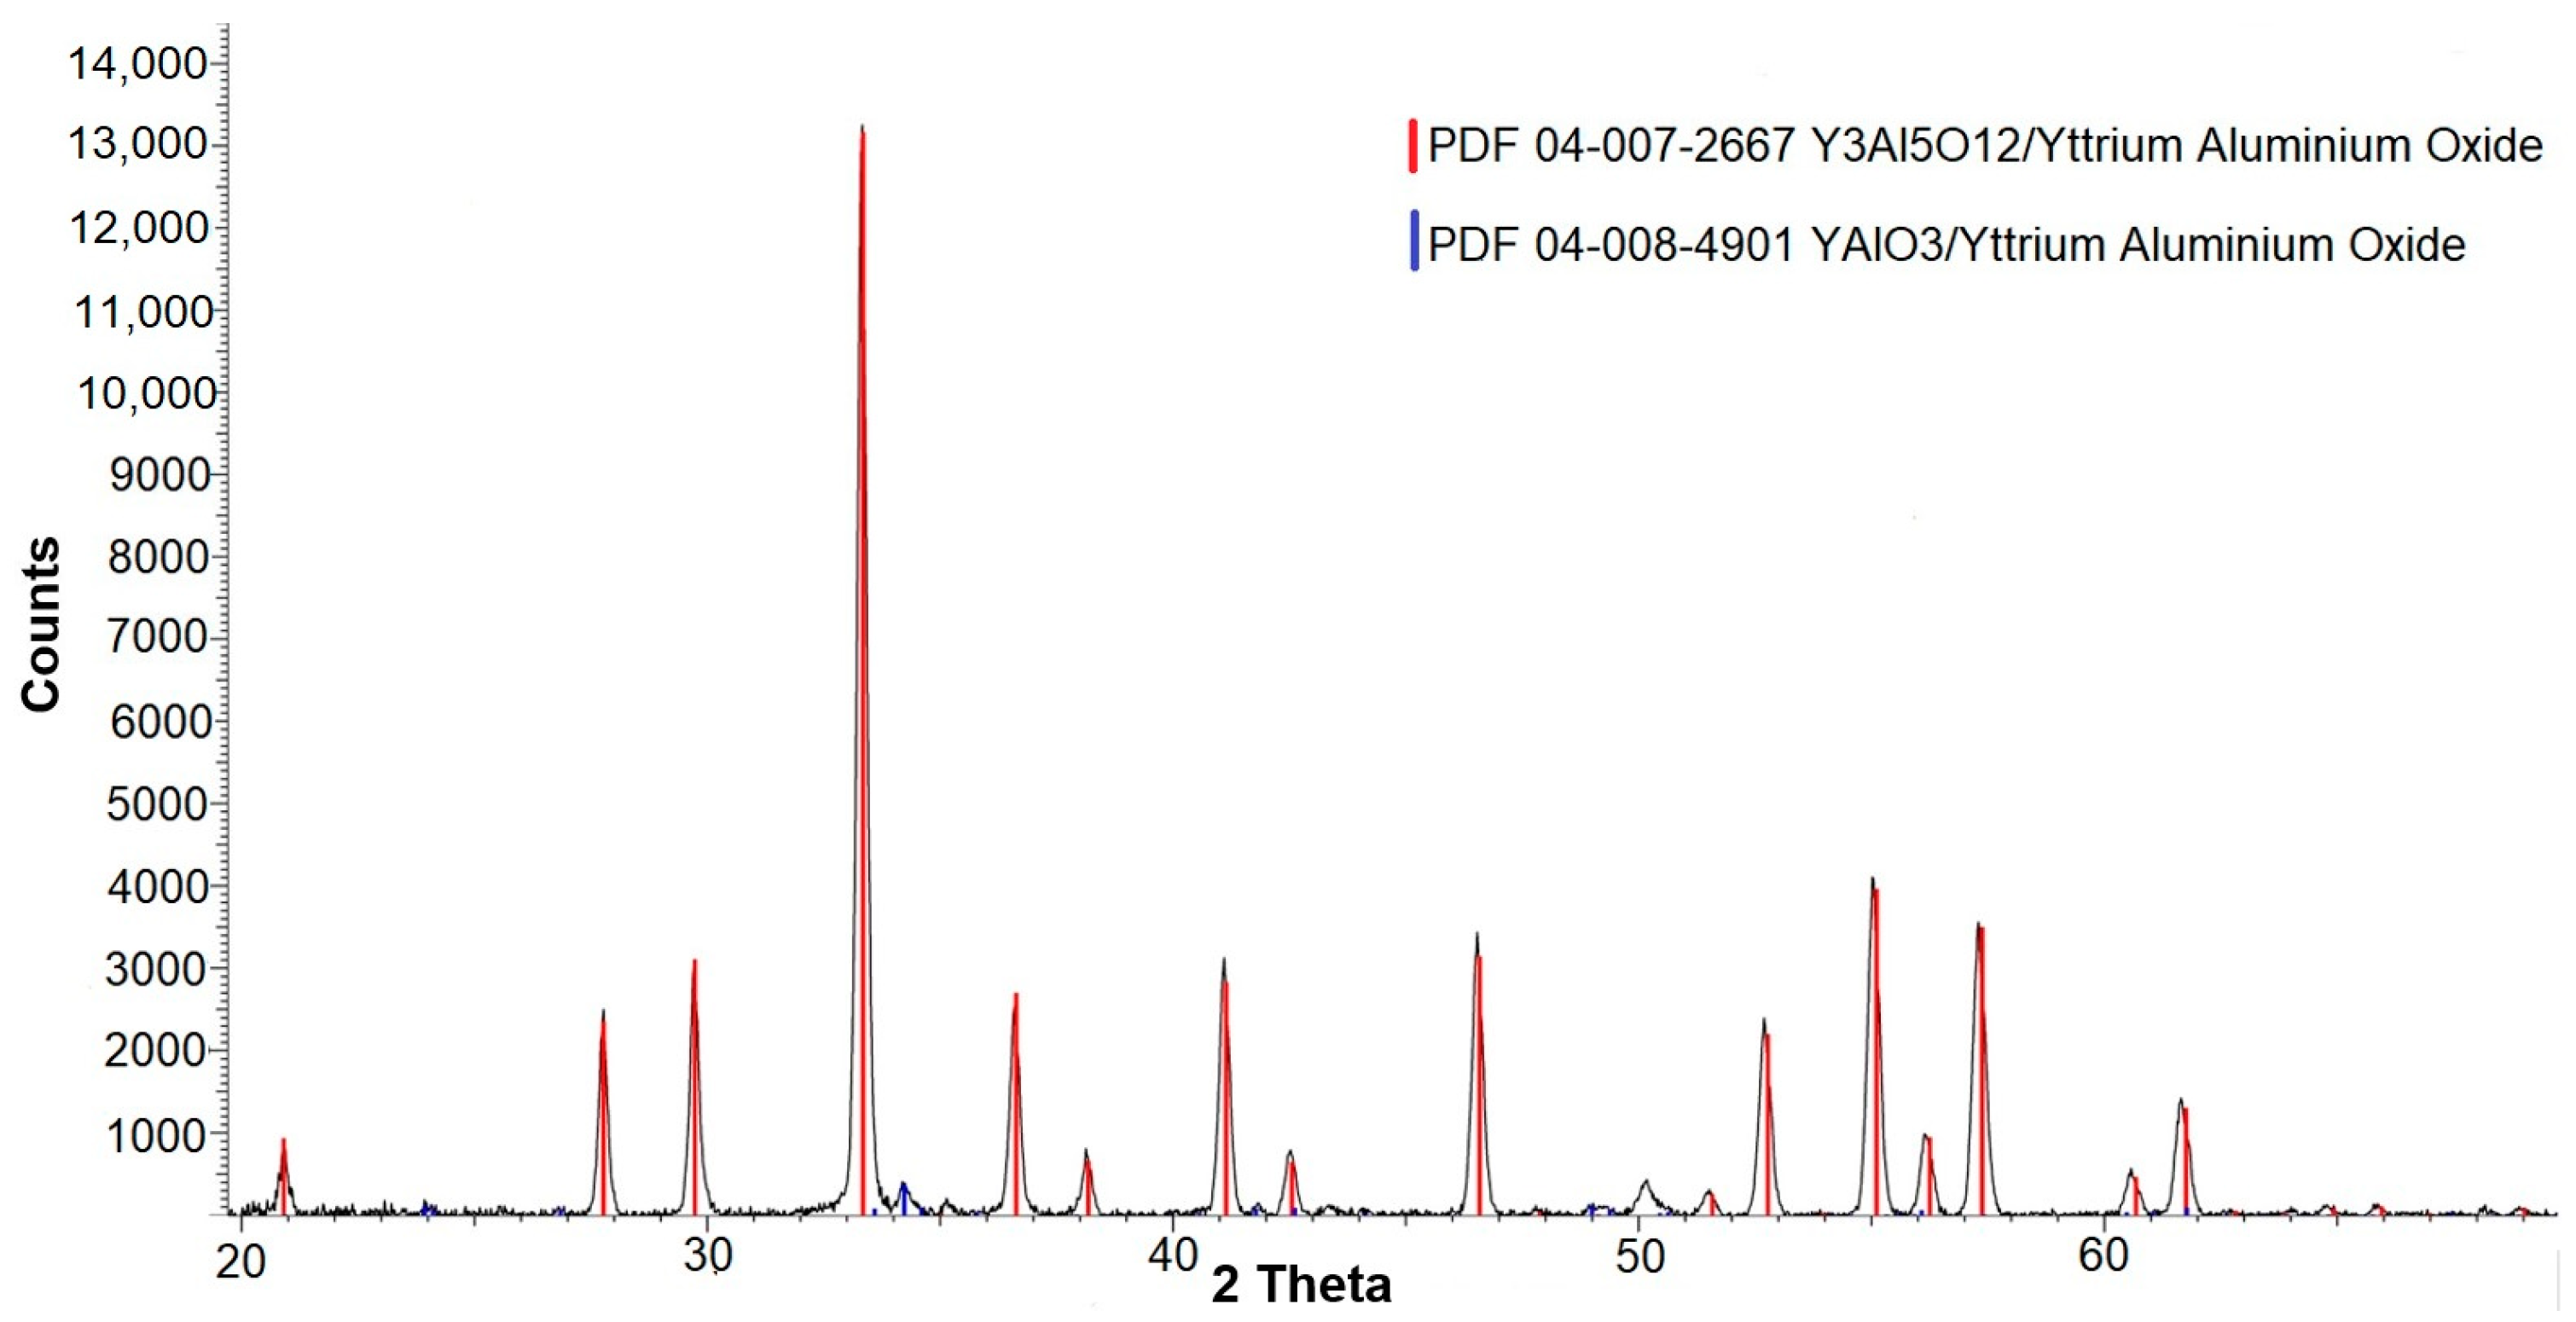
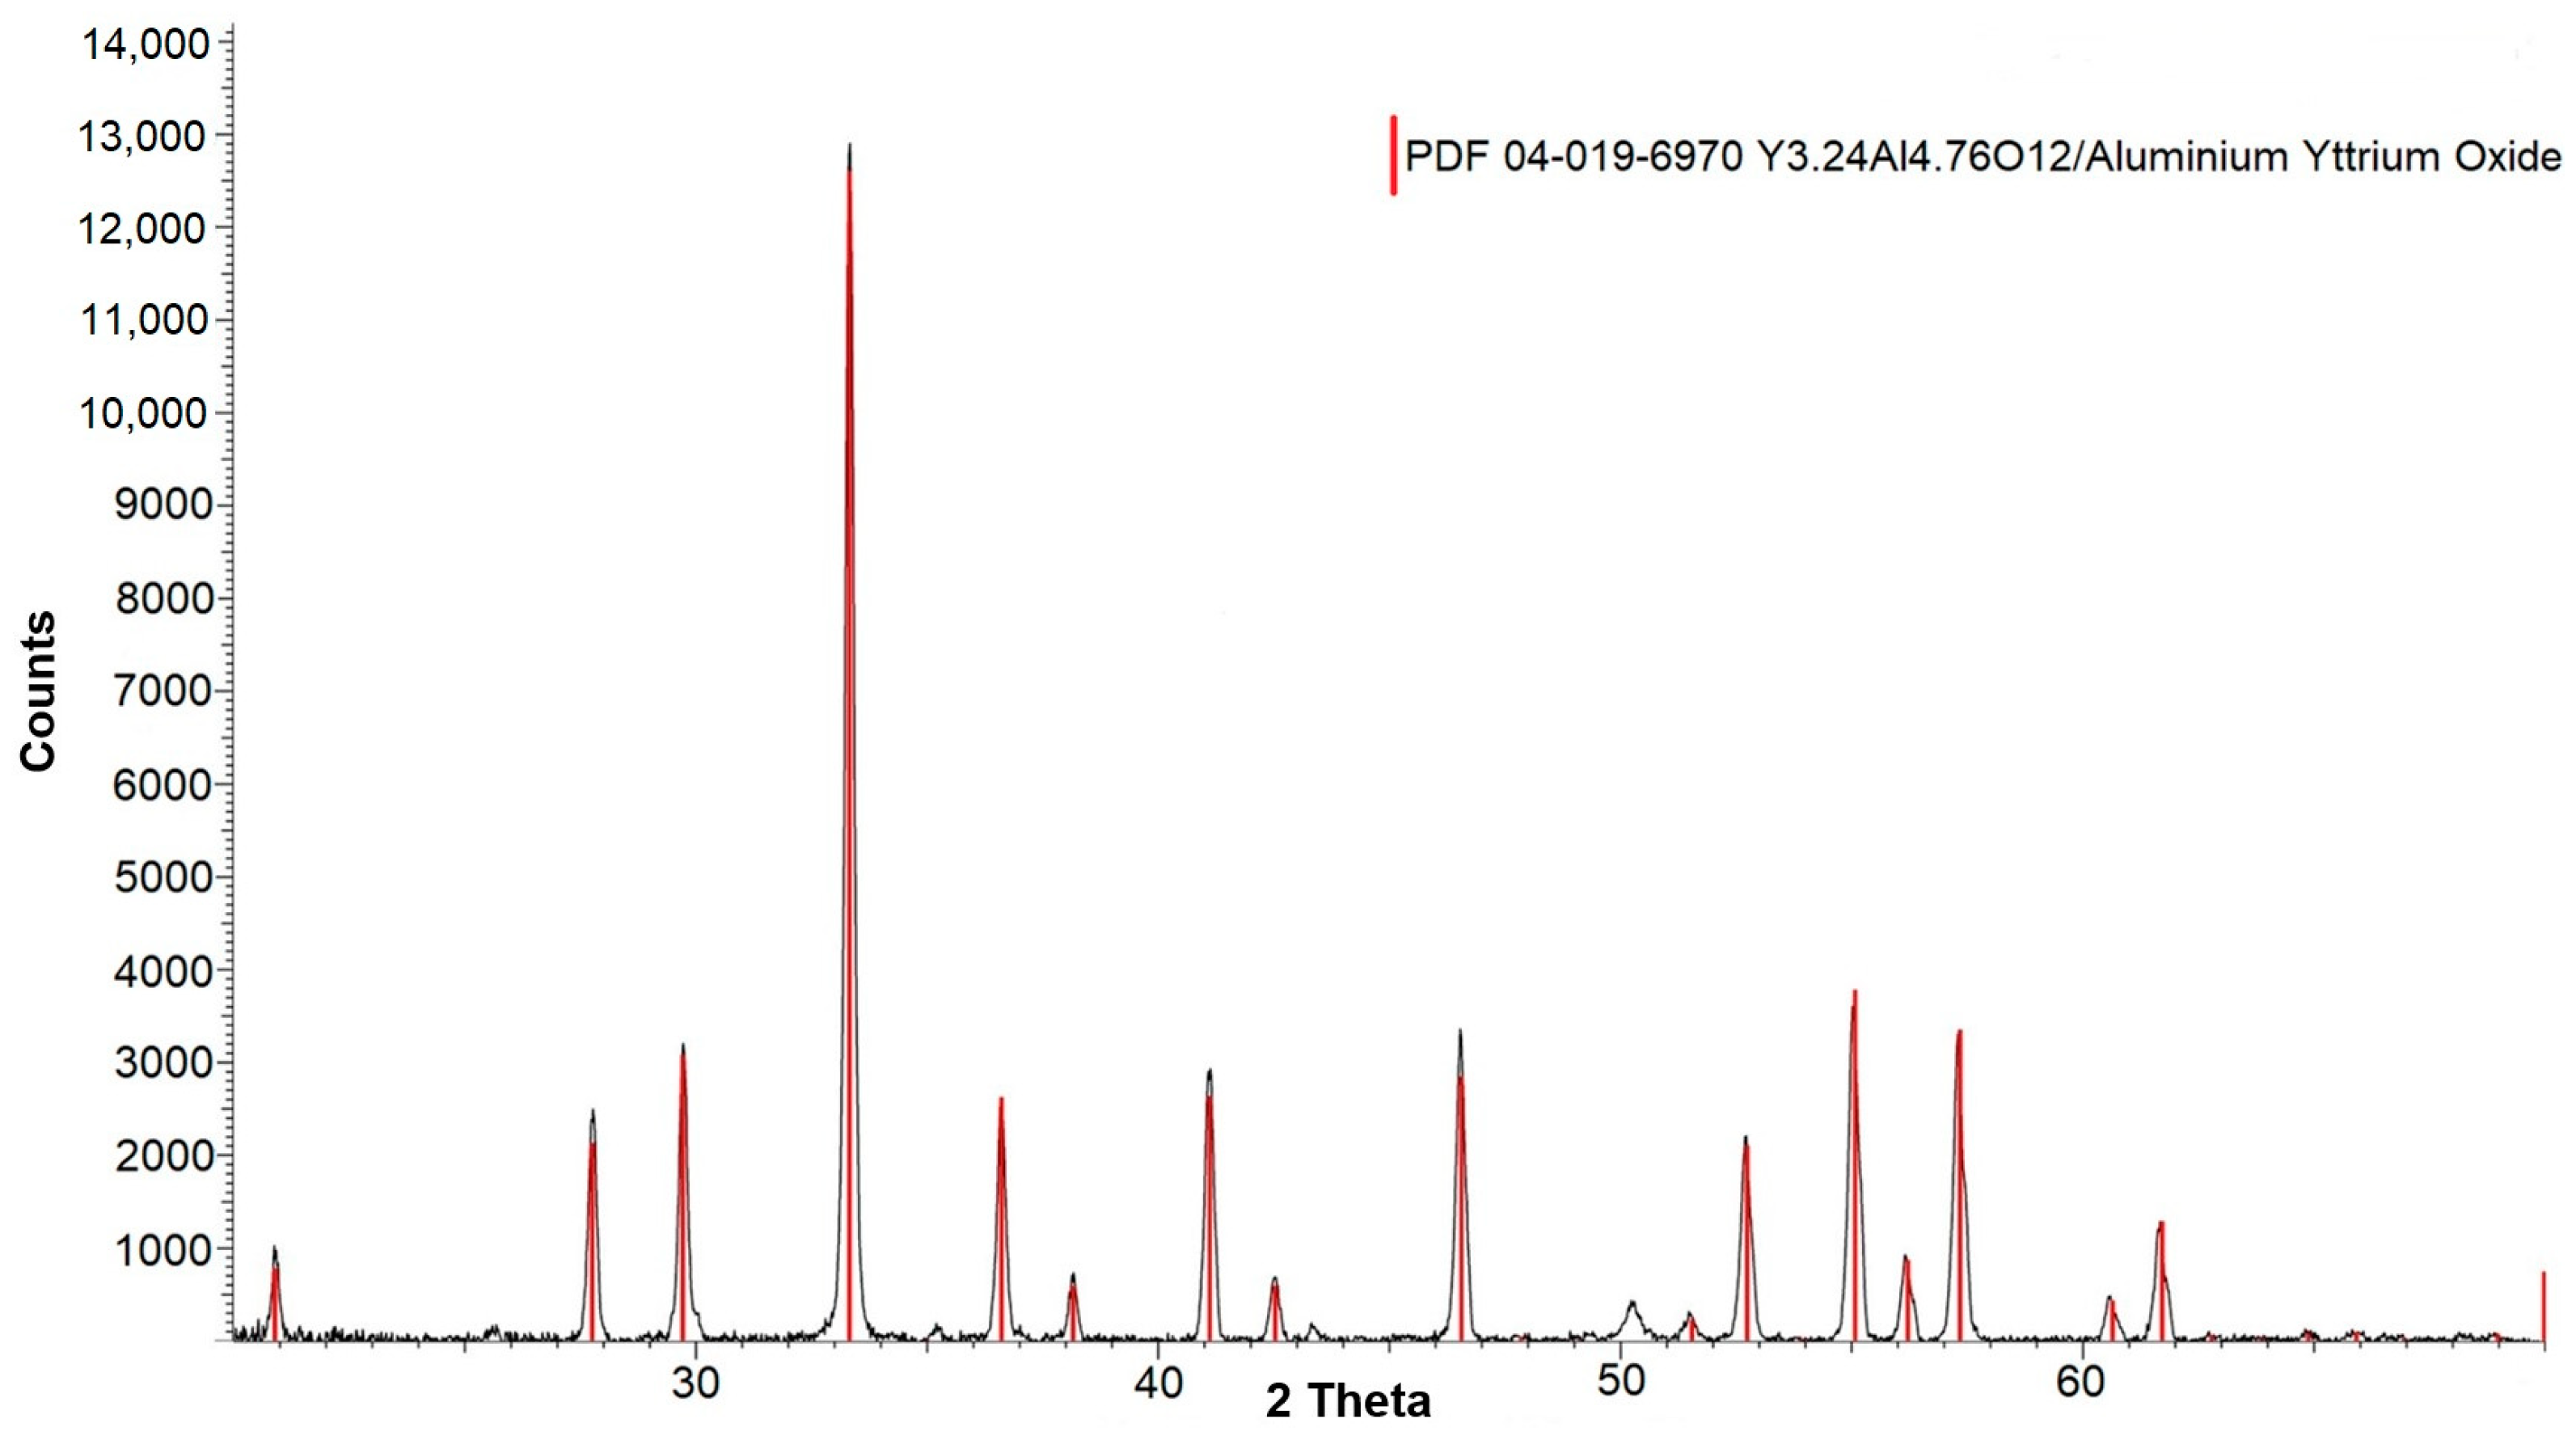
Figure 1. X-ray diffraction spectra of YAG:Eu (2%).
Crystals 13 00702 g001
Figure 2. X-ray diffraction spectra of YAG:Eu (6%). The red lines correspond to the phase of yttrium–aluminum–garnet, the blue lines correspond to yttrium–aluminum–perovskite YalO3, and the green lines correspond to the phase of corundum.
Crystals 13 00702 g002
Figure 3. X-ray diffraction spectra of YAG:Eu (8%).
Crystals 13 00702 g003
Figure 4. X-ray diffraction spectra of YAG:Eu (10%).
Crystals 13 00702 g004
Figure 5. The PLE spectra of YAG:Eu (2%).
Crystals 13 00702 g005
Figure 6. The PLE spectra of YAG:Eu (6%).
Crystals 13 00702 g006
Figure 7. The PLE spectra of YAG:Eu (8%).
Crystals 13 00702 g007
Figure 8. The PLE spectra of YAG:Eu (10%).
Crystals 13 00702 g008
Figure 9. The PLE spectra of YAG:Eu (10%). Triangle, circle, square are used for designation of the values of intensities of different bands at different concentrations.
Crystals 13 00702 g009
Figure 10. The photoluminescence spectra of YAG:Eu (2%).
Crystals 13 00702 g010
Figure 11. The photoluminescence spectra of YAG:Eu (6%).
Crystals 13 00702 g011
Figure 12. The photoluminescence spectra of YAG:Eu (8%).
Crystals 13 00702 g012
Figure 13. The photoluminescence spectra of YAG:Eu (10%).
Crystals 13 00702 g013
Figure 14. Intensity dependency of the photoluminescence spectrum on the wavelength for three samples. Triangle, circle, square are used for designation of the values of intensities of different bands at different concentrations.
Crystals 13 00702 g014
Figure 15. The density of states of YAG:Eu (two ions).
Crystals 13 00702 g015
Figure 16. The density of states of YAG:Eu (three ions).
Crystals 13 00702 g016
Figure 17. The density of states of YAG:Eu (four ions).
Crystals 13 00702 g017
Figure 18. The absorption spectra of YAG:Eu (black—6%; red—8%; green—10%).
Crystals 13 00702 g018
Table 1. The quantitative analysis of the YAG samples doped with different concentrations of europium.
SampleCrystalline Phase (%)
Y3Al5O12YalO3Corundum
Eu 2%10000
Eu 6%62.623.513.9
Eu 8%96.93.10
Eu 10%10000
Table 2. The quantitative analysis of the YAG samples doped with different concentrations of europium.
% λ 2θβd (nm)
21.5406 A33.3480.40.43
61.5406 A33.3480.350.49
81.5406 A33.3480.30.57
101.5406 A33.3270.30.57
Disclaimer/Publisher’s Note: The statements, opinions and data contained in all publications are solely those of the individual author(s) and contributor(s) and not of MDPI and/or the editor(s). MDPI and/or the editor(s) disclaim responsibility for any injury to people or property resulting from any ideas, methods, instructions or products referred to in the content.

