
Crystal Structure, Hirshfeld Surface Analysis, and Computational Study of Quinolin-8-yl 4-Chlorobenzoate: Insights from Spectroscopic, Thermal, and Antitumor Properties

Abstract
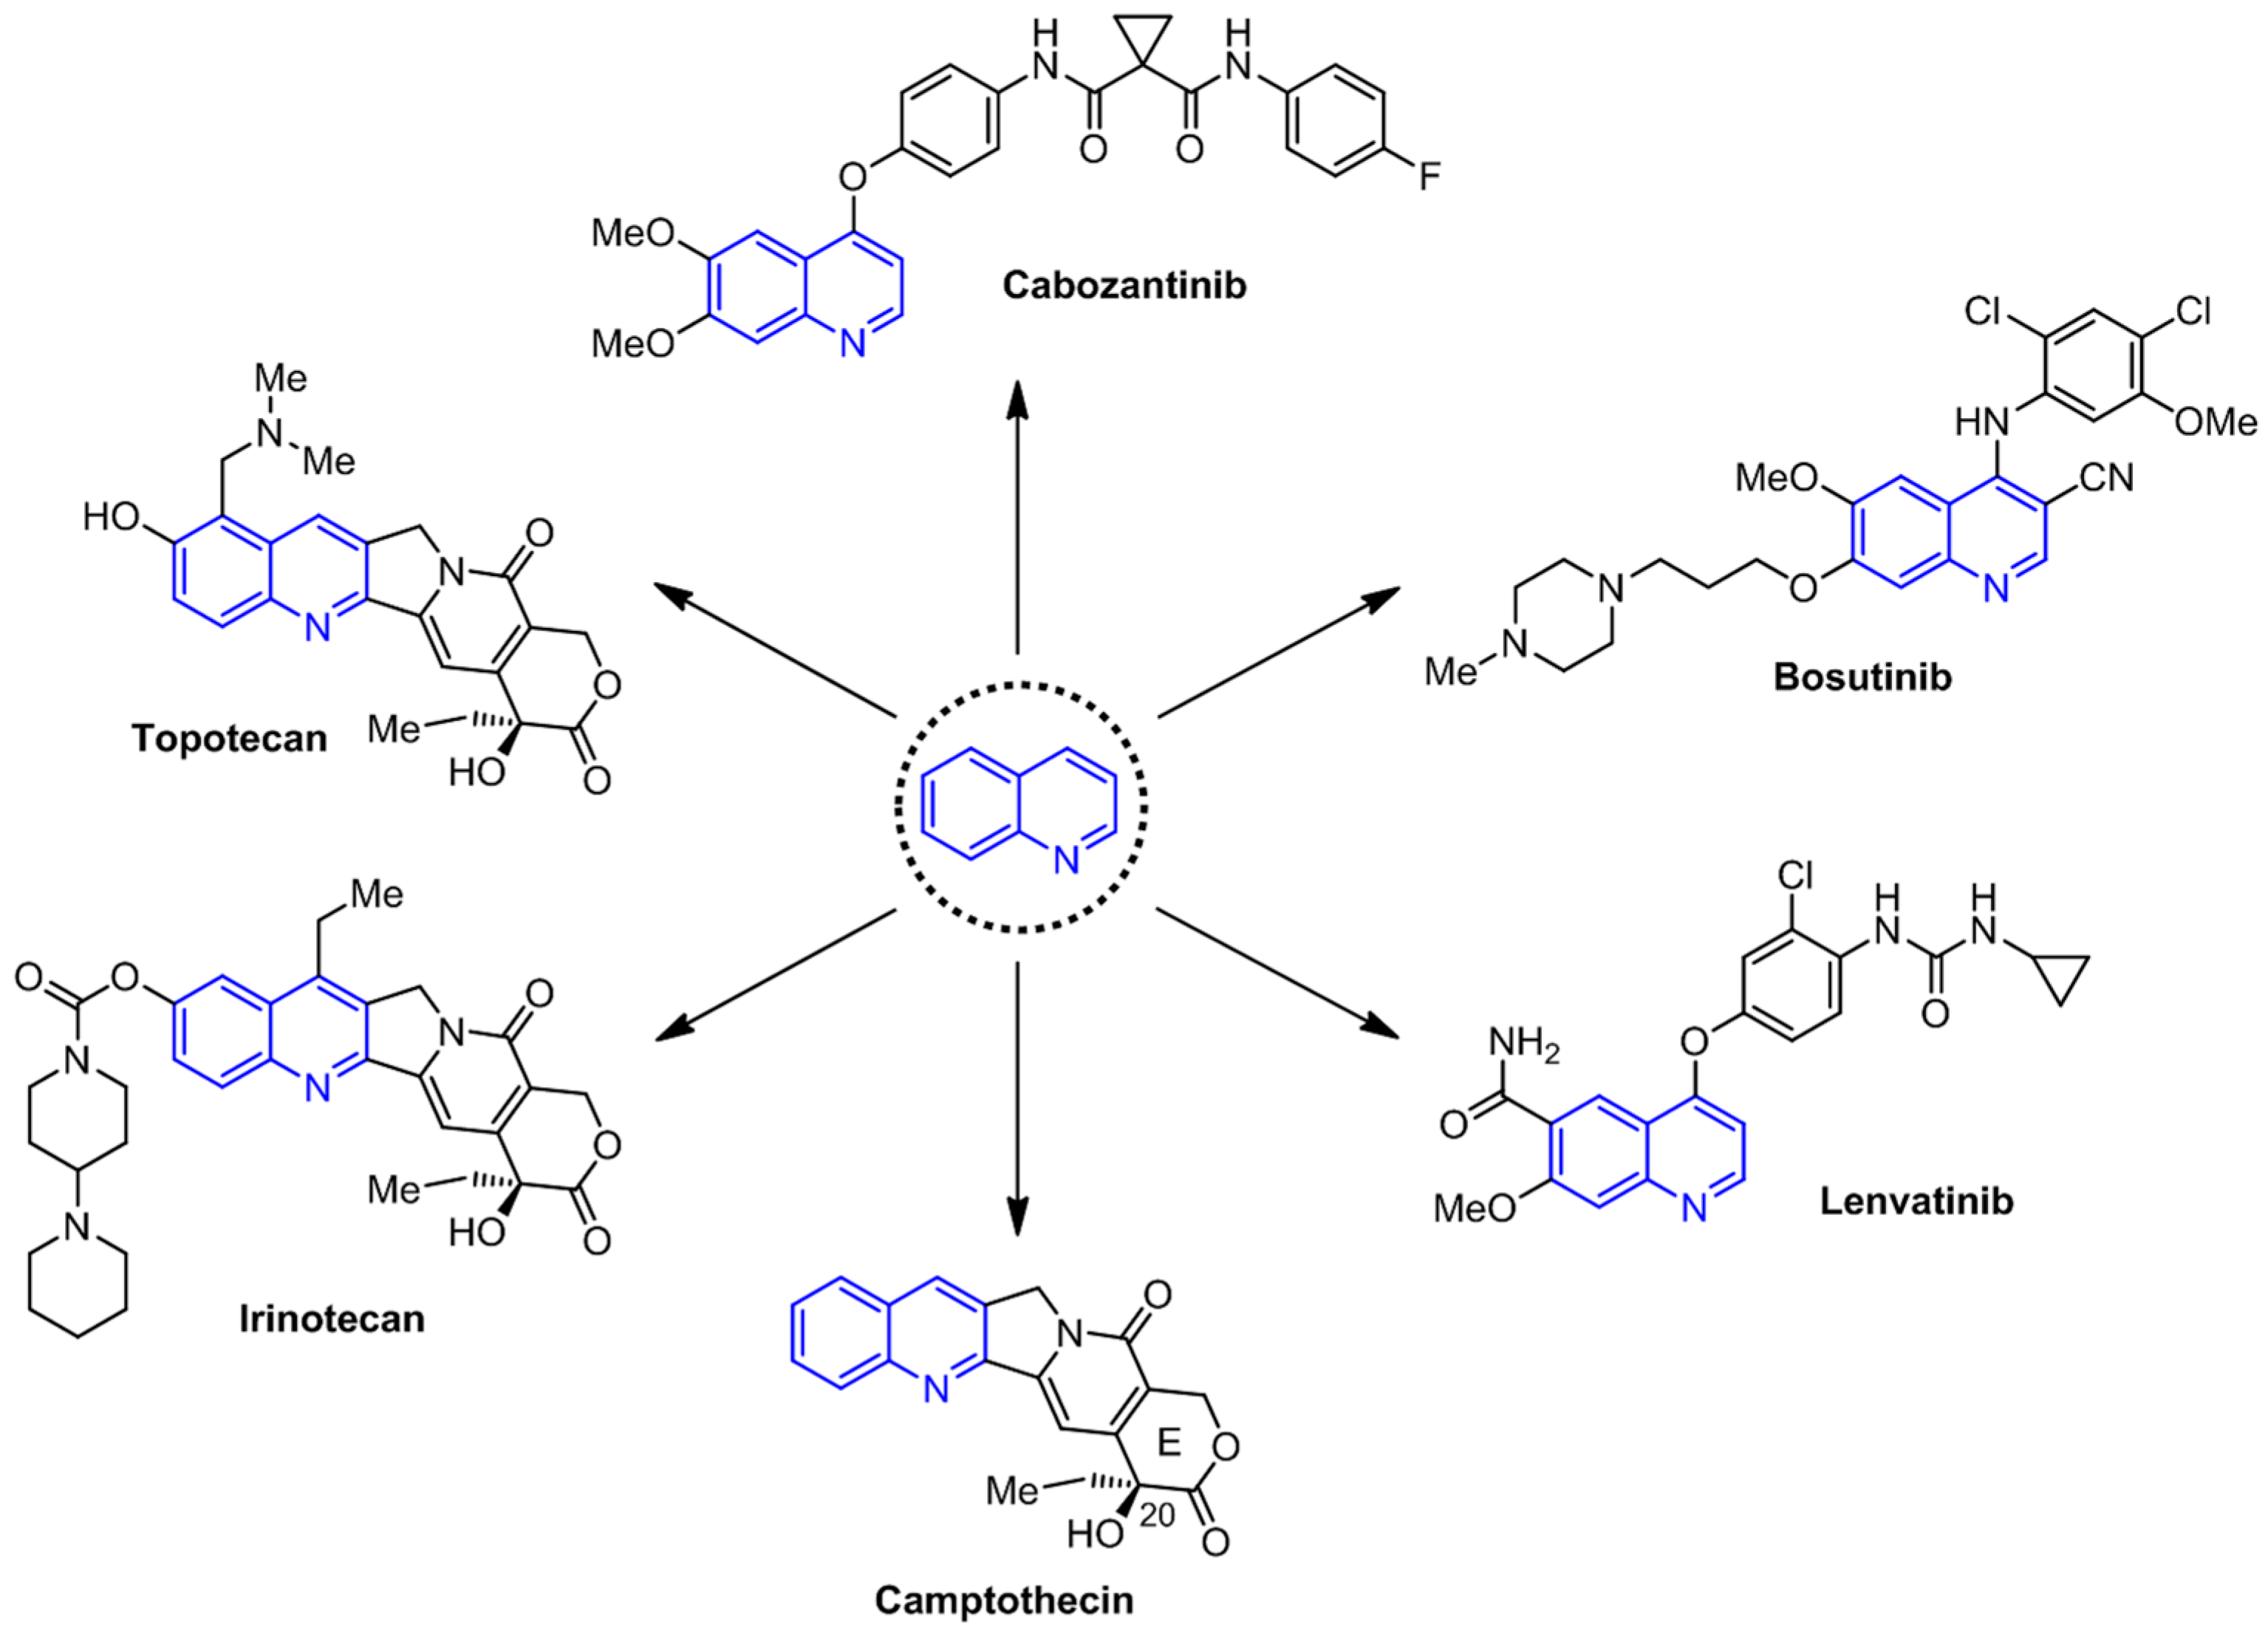
:1. Introduction
2. Materials and Methods
2.1. General Information
2.2. Synthesis of Quinolin-8-yl 4-Chlorobenzoate (3)
2.3. Refinement and Data Collection Strategy
2.4. Computational Methods
3. Results and Discussion
3.1. Chemistry
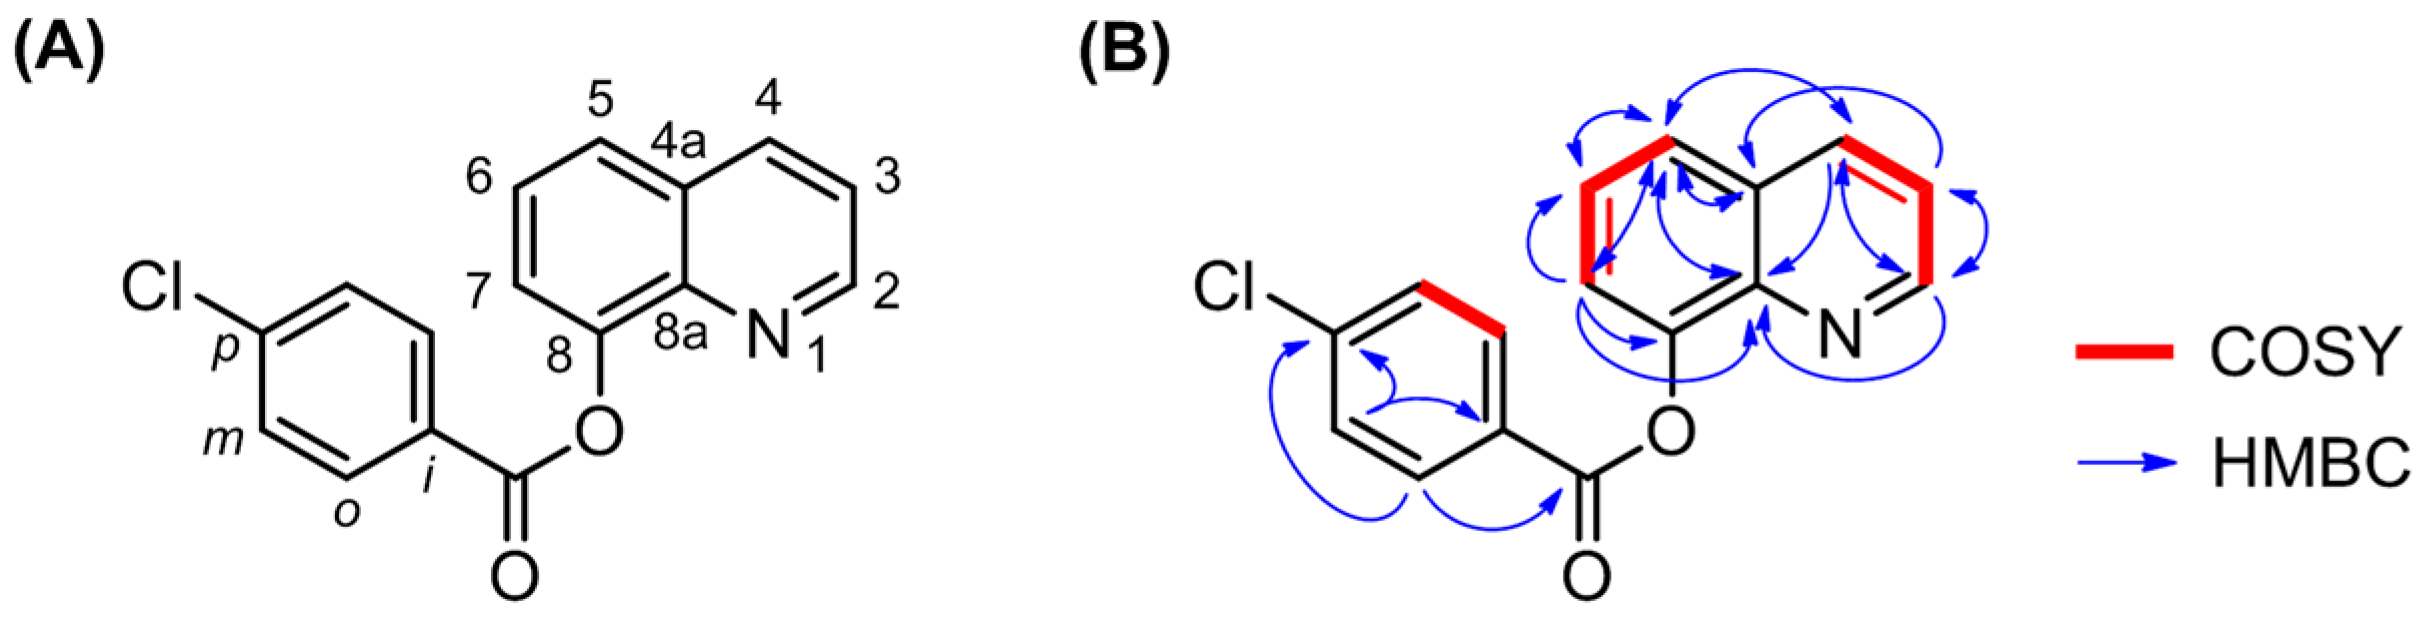
3.2. NMR Analysis
3.3. Vibrational Analysis
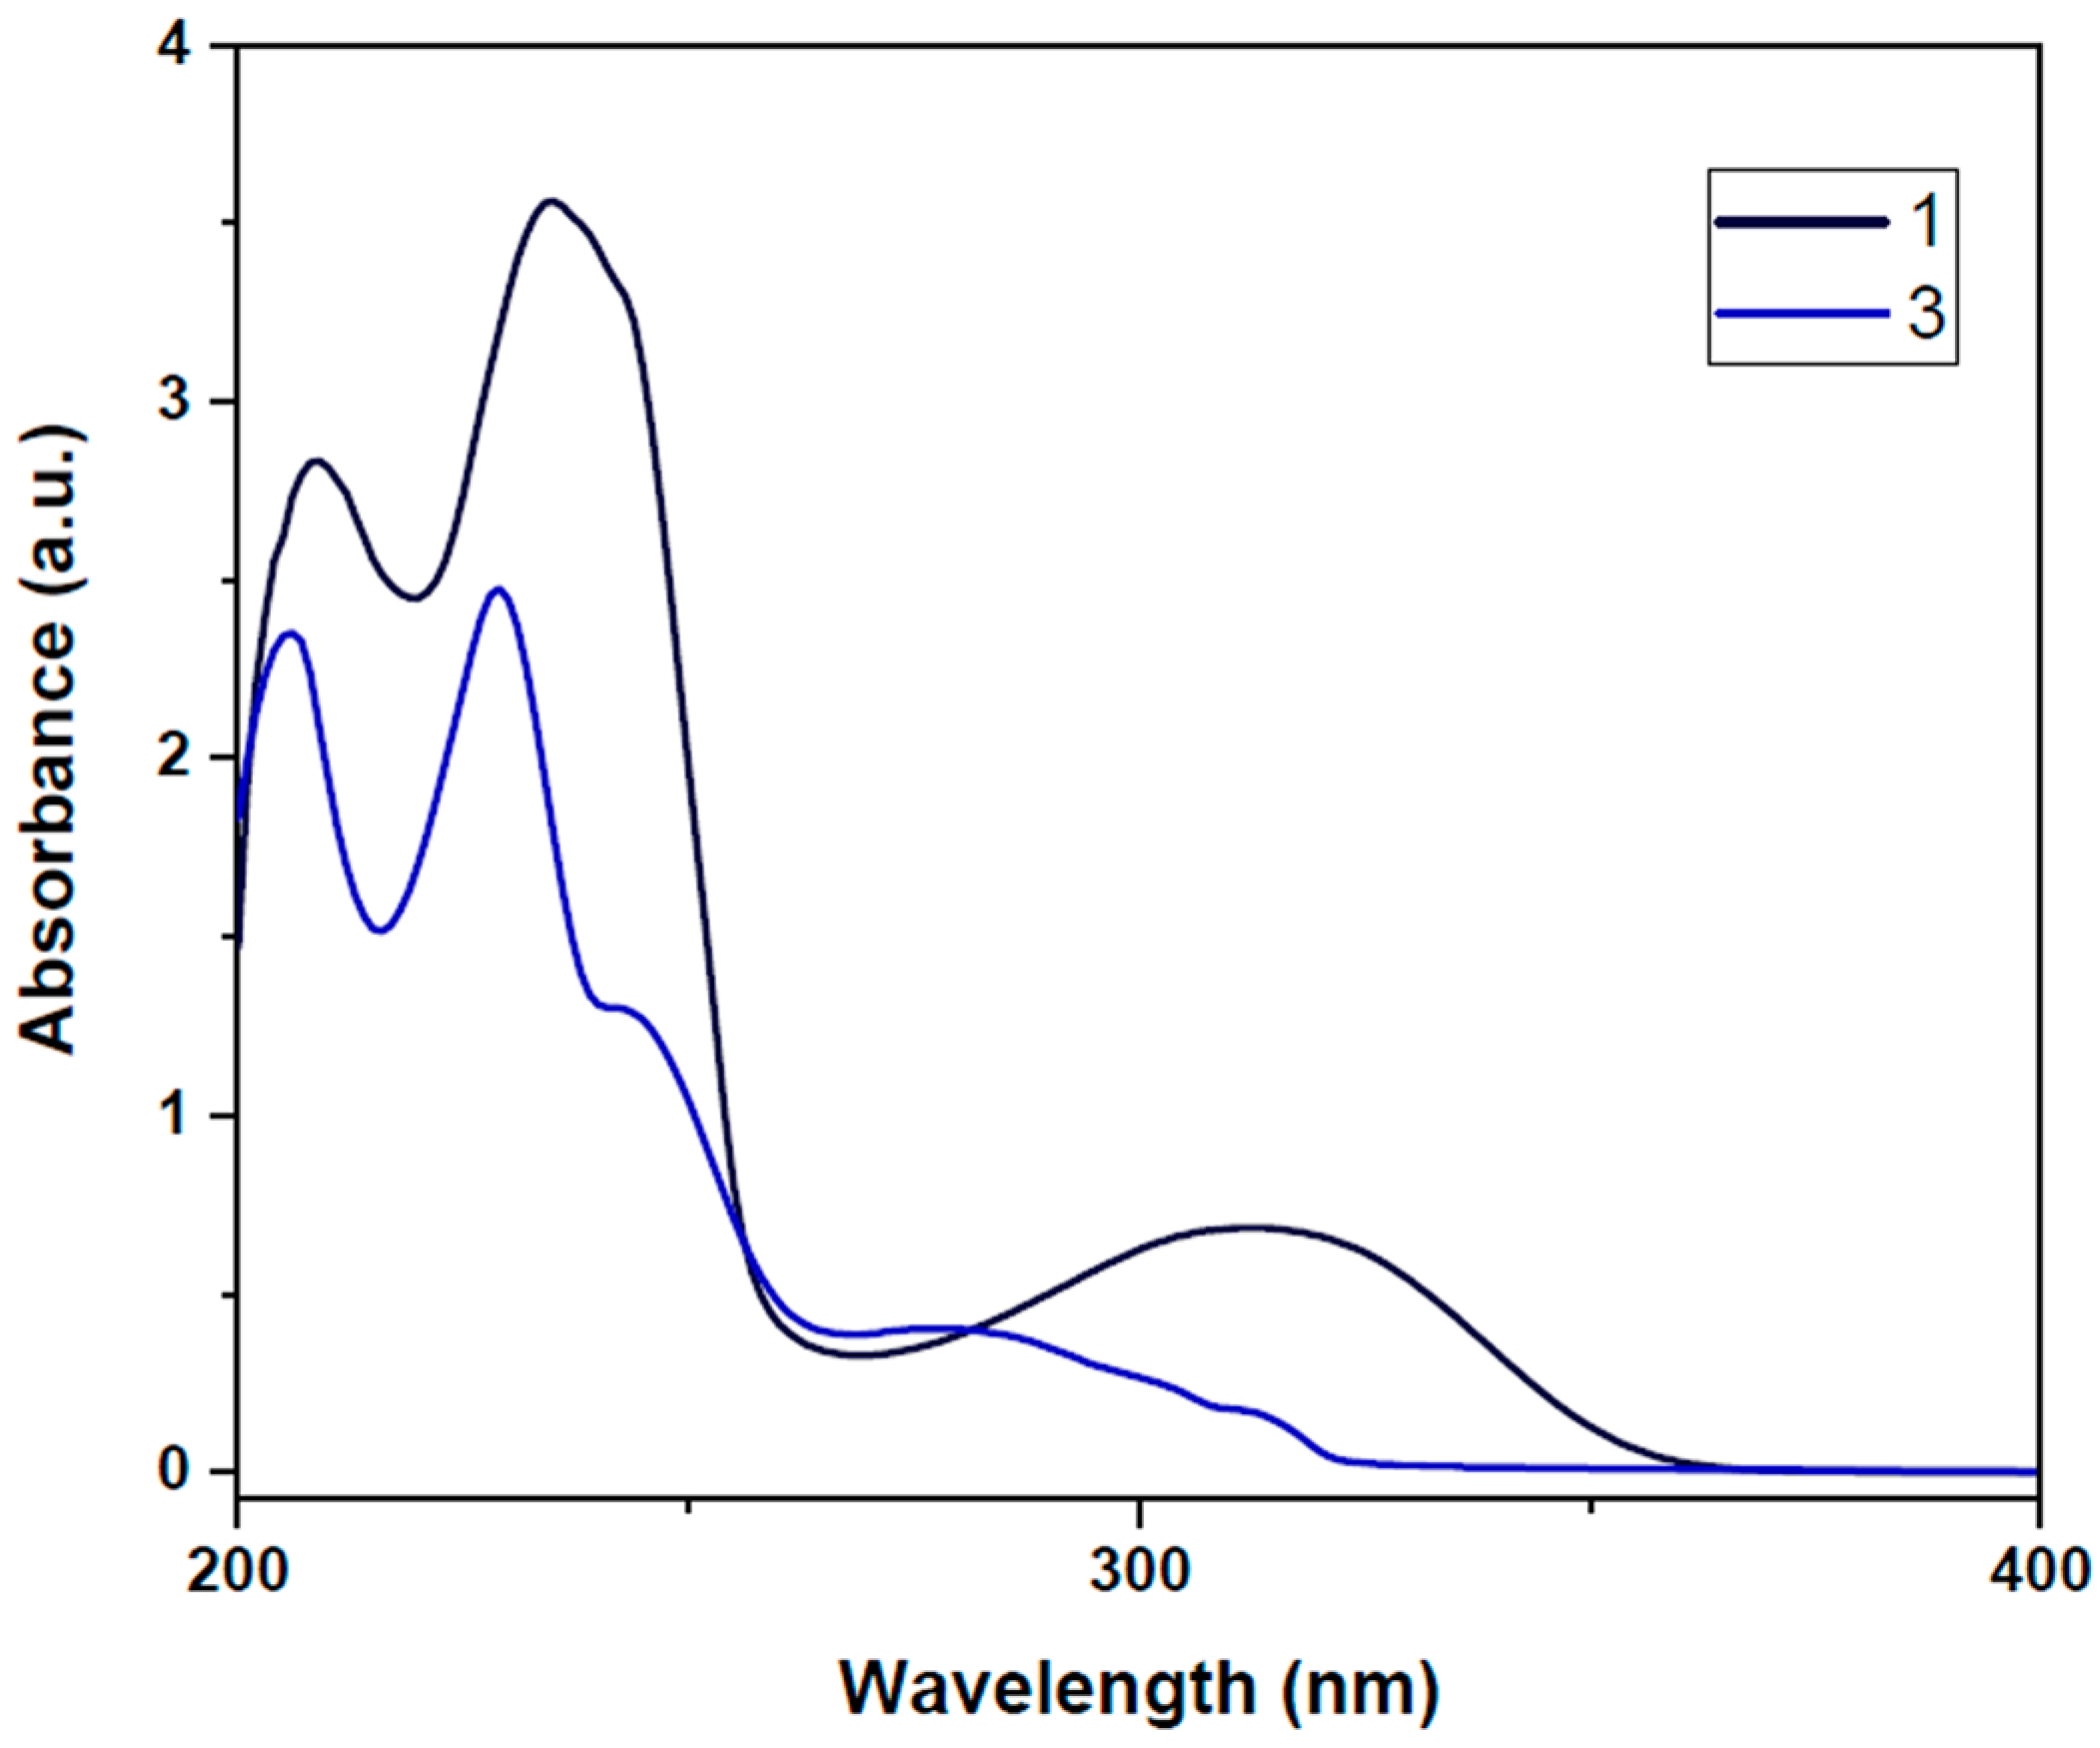
3.4. UV–Vis Analysis
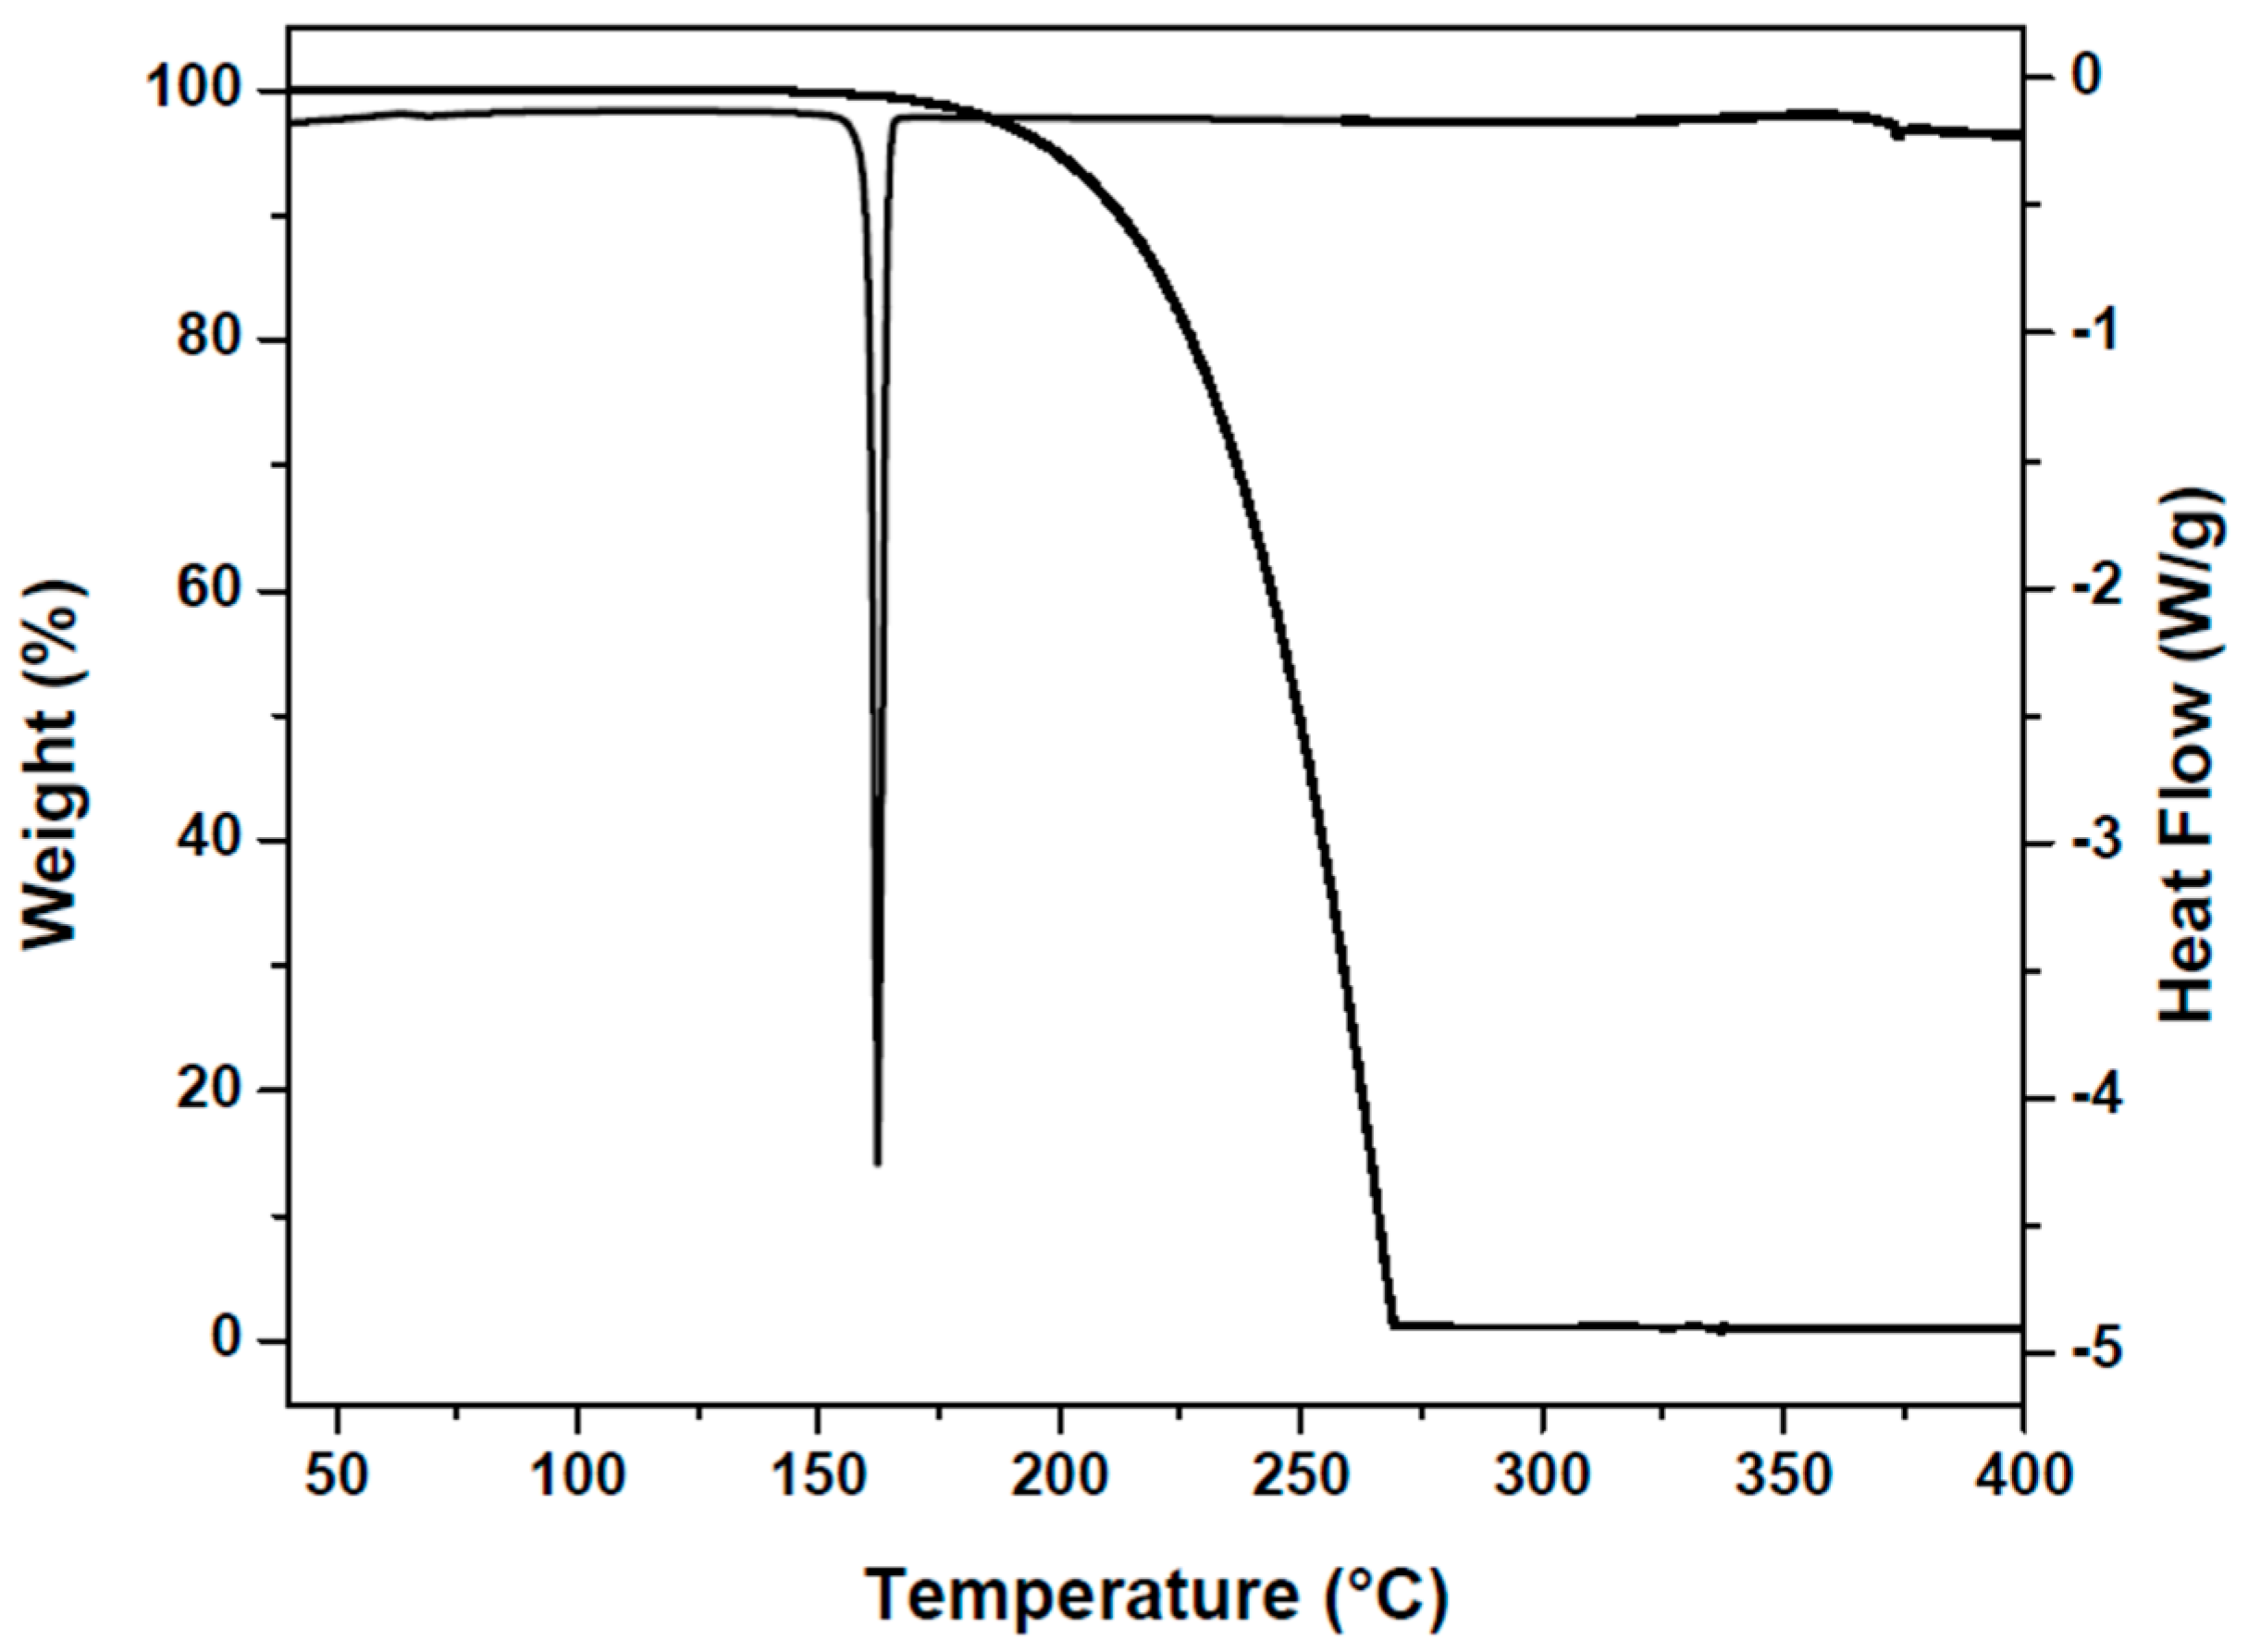
3.5. TG and DSC Analysis
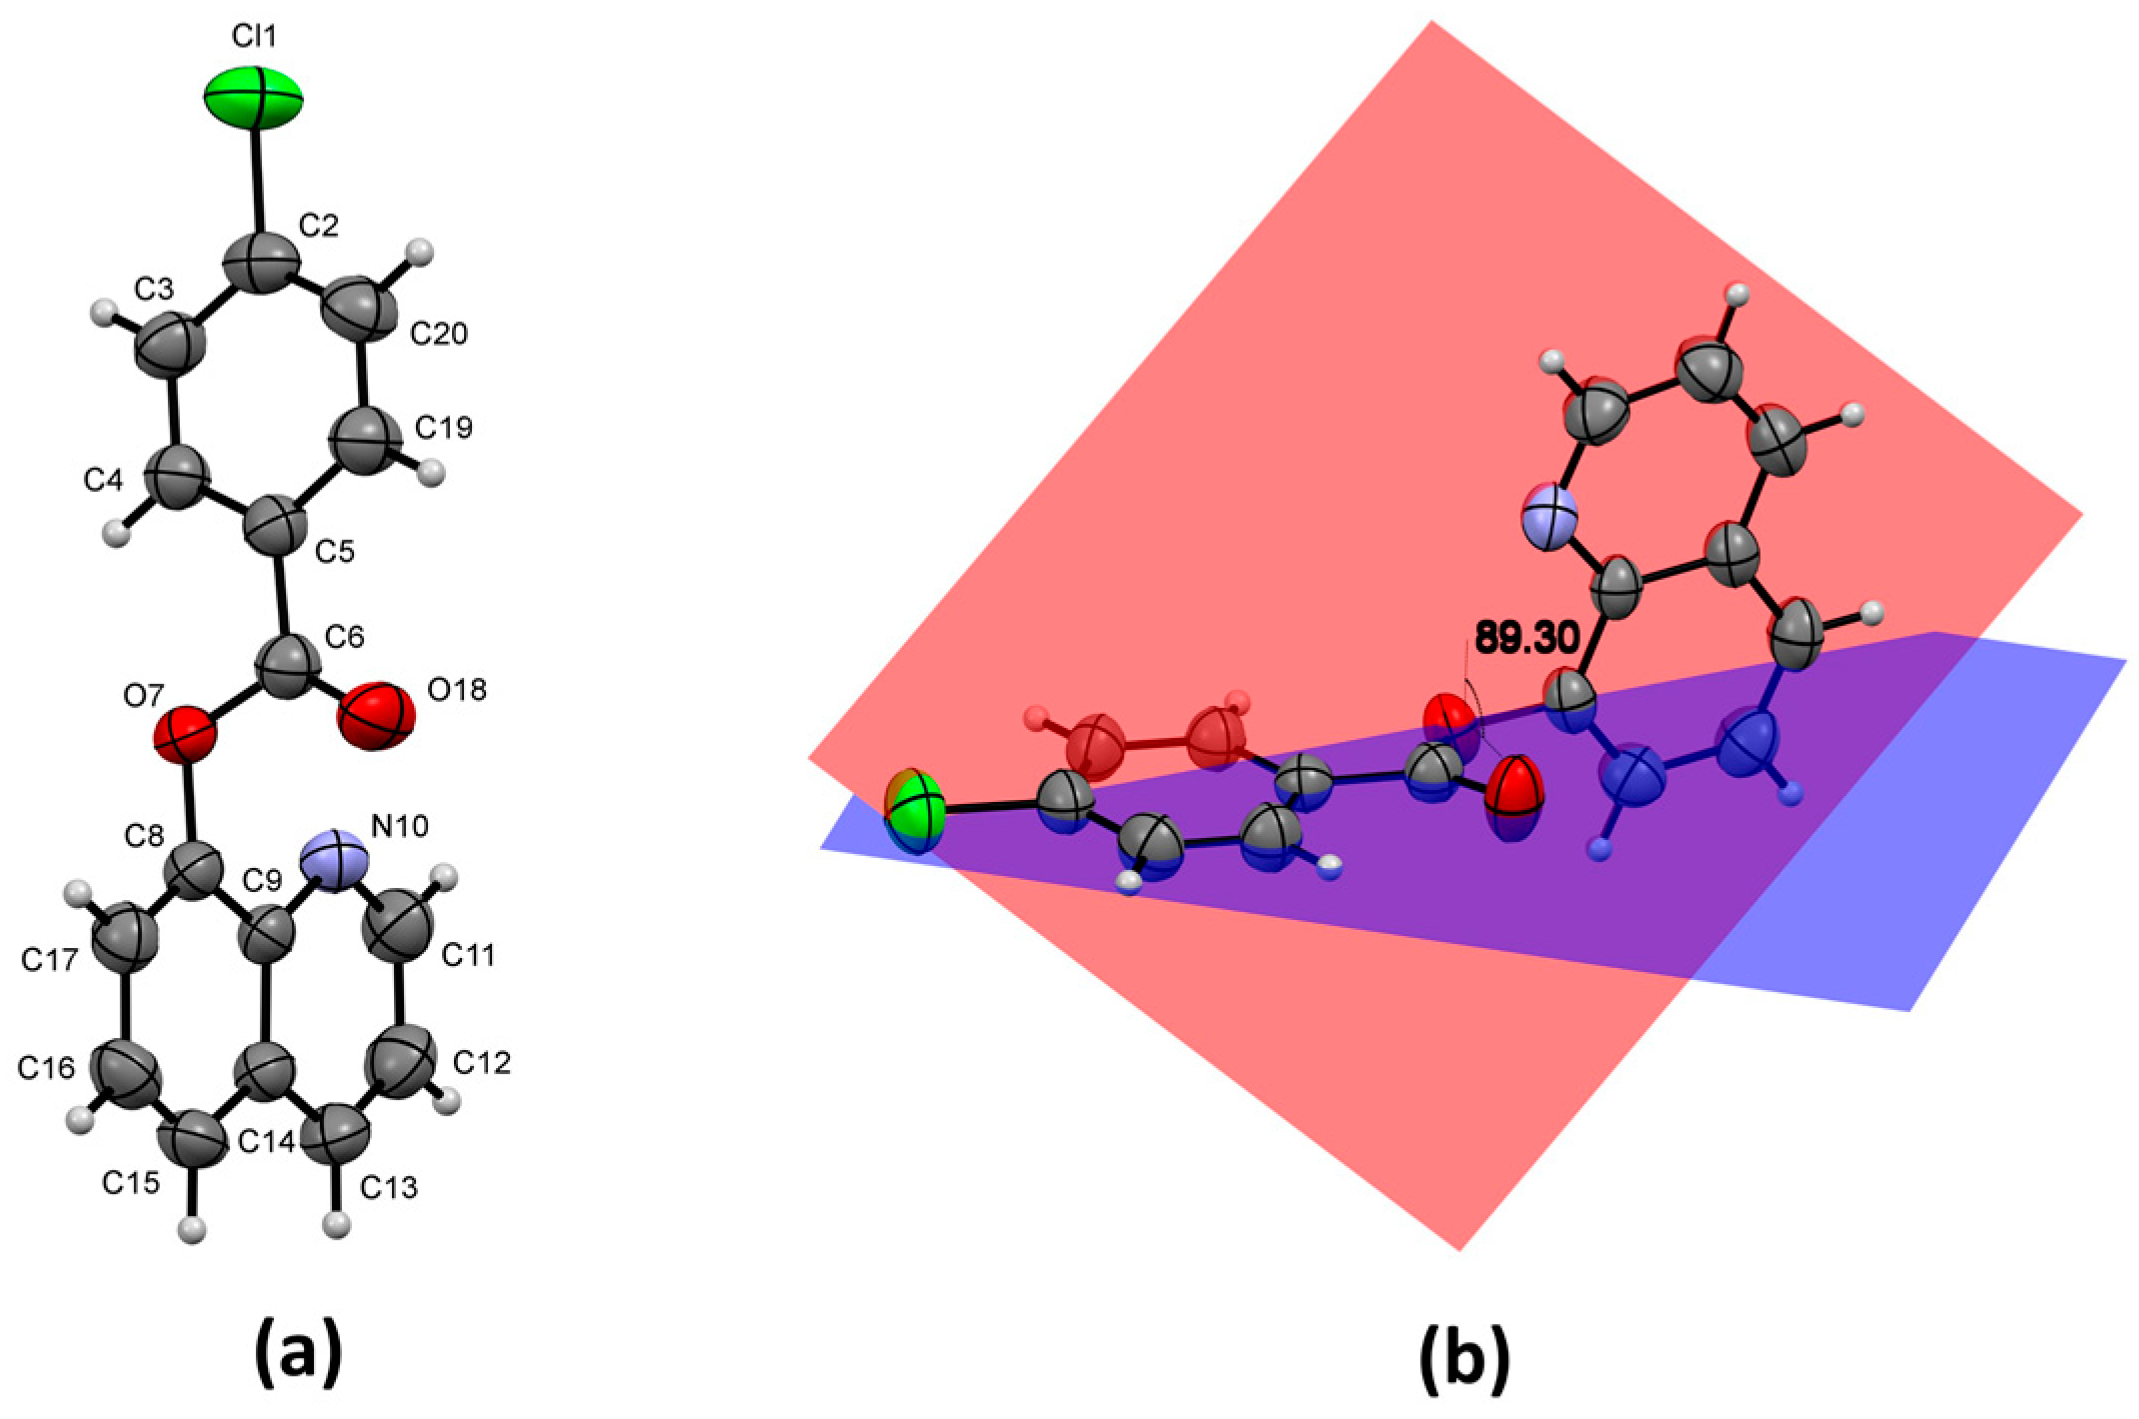
3.6. Molecular Structure
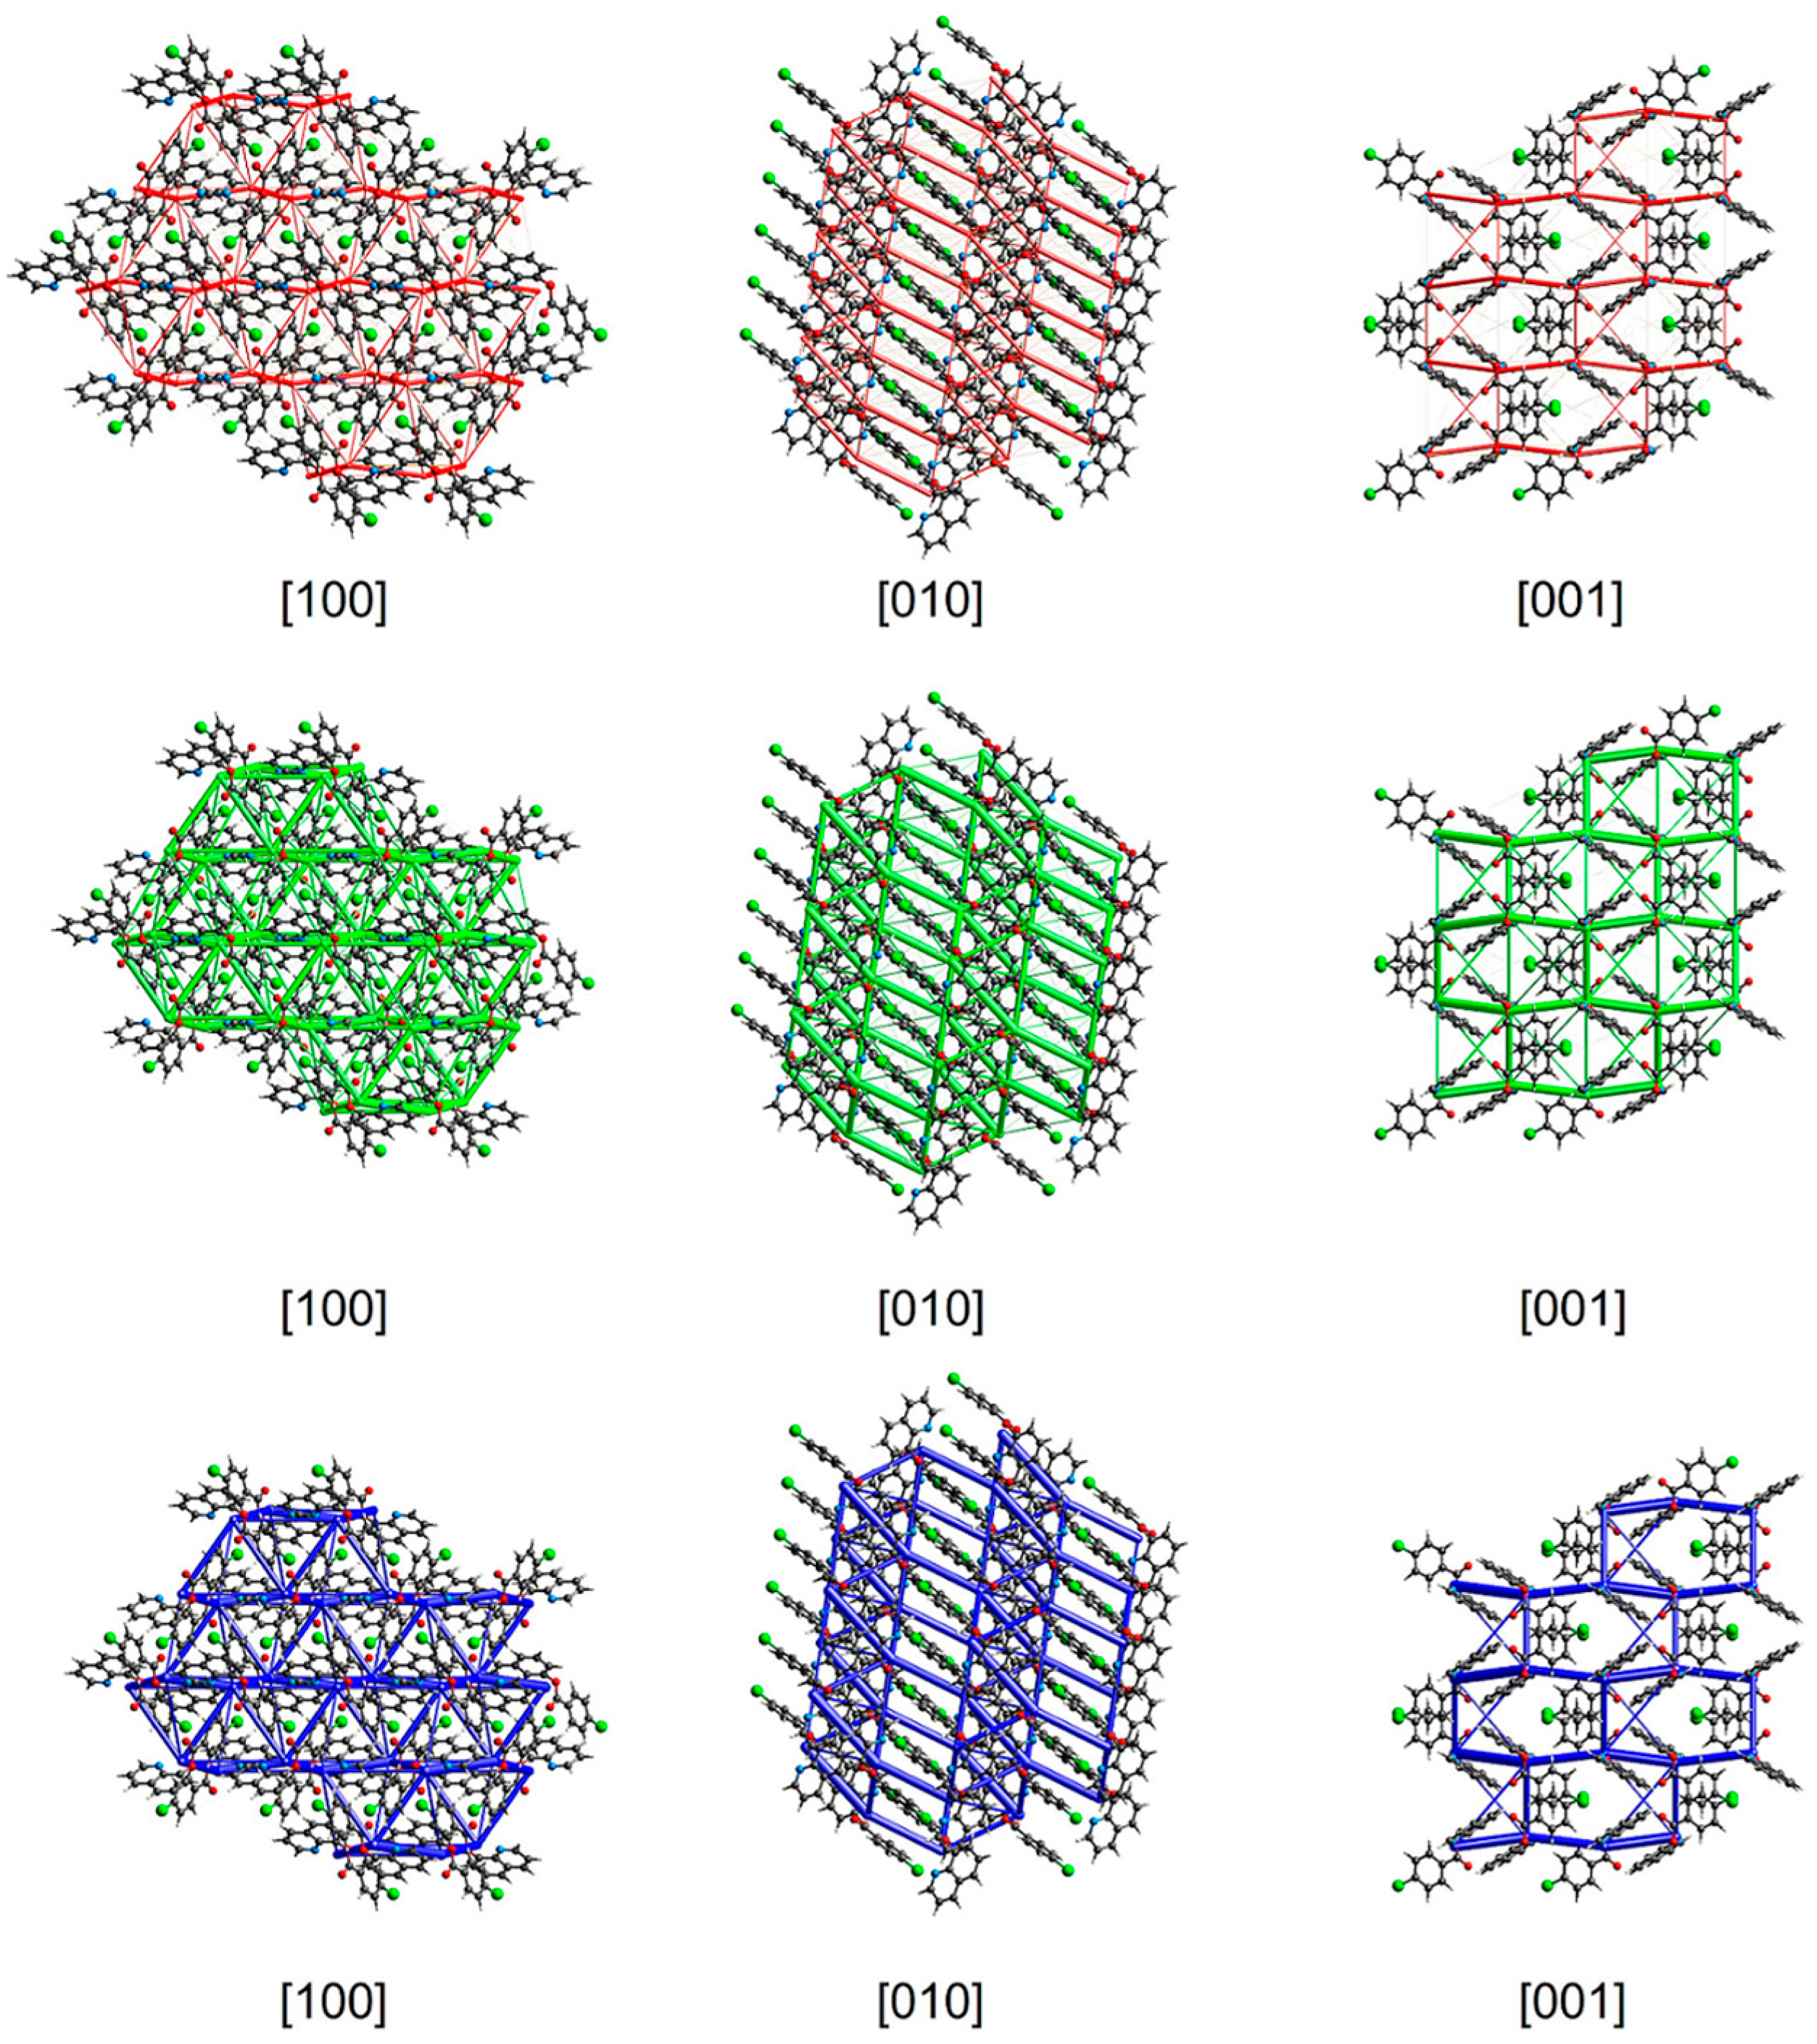
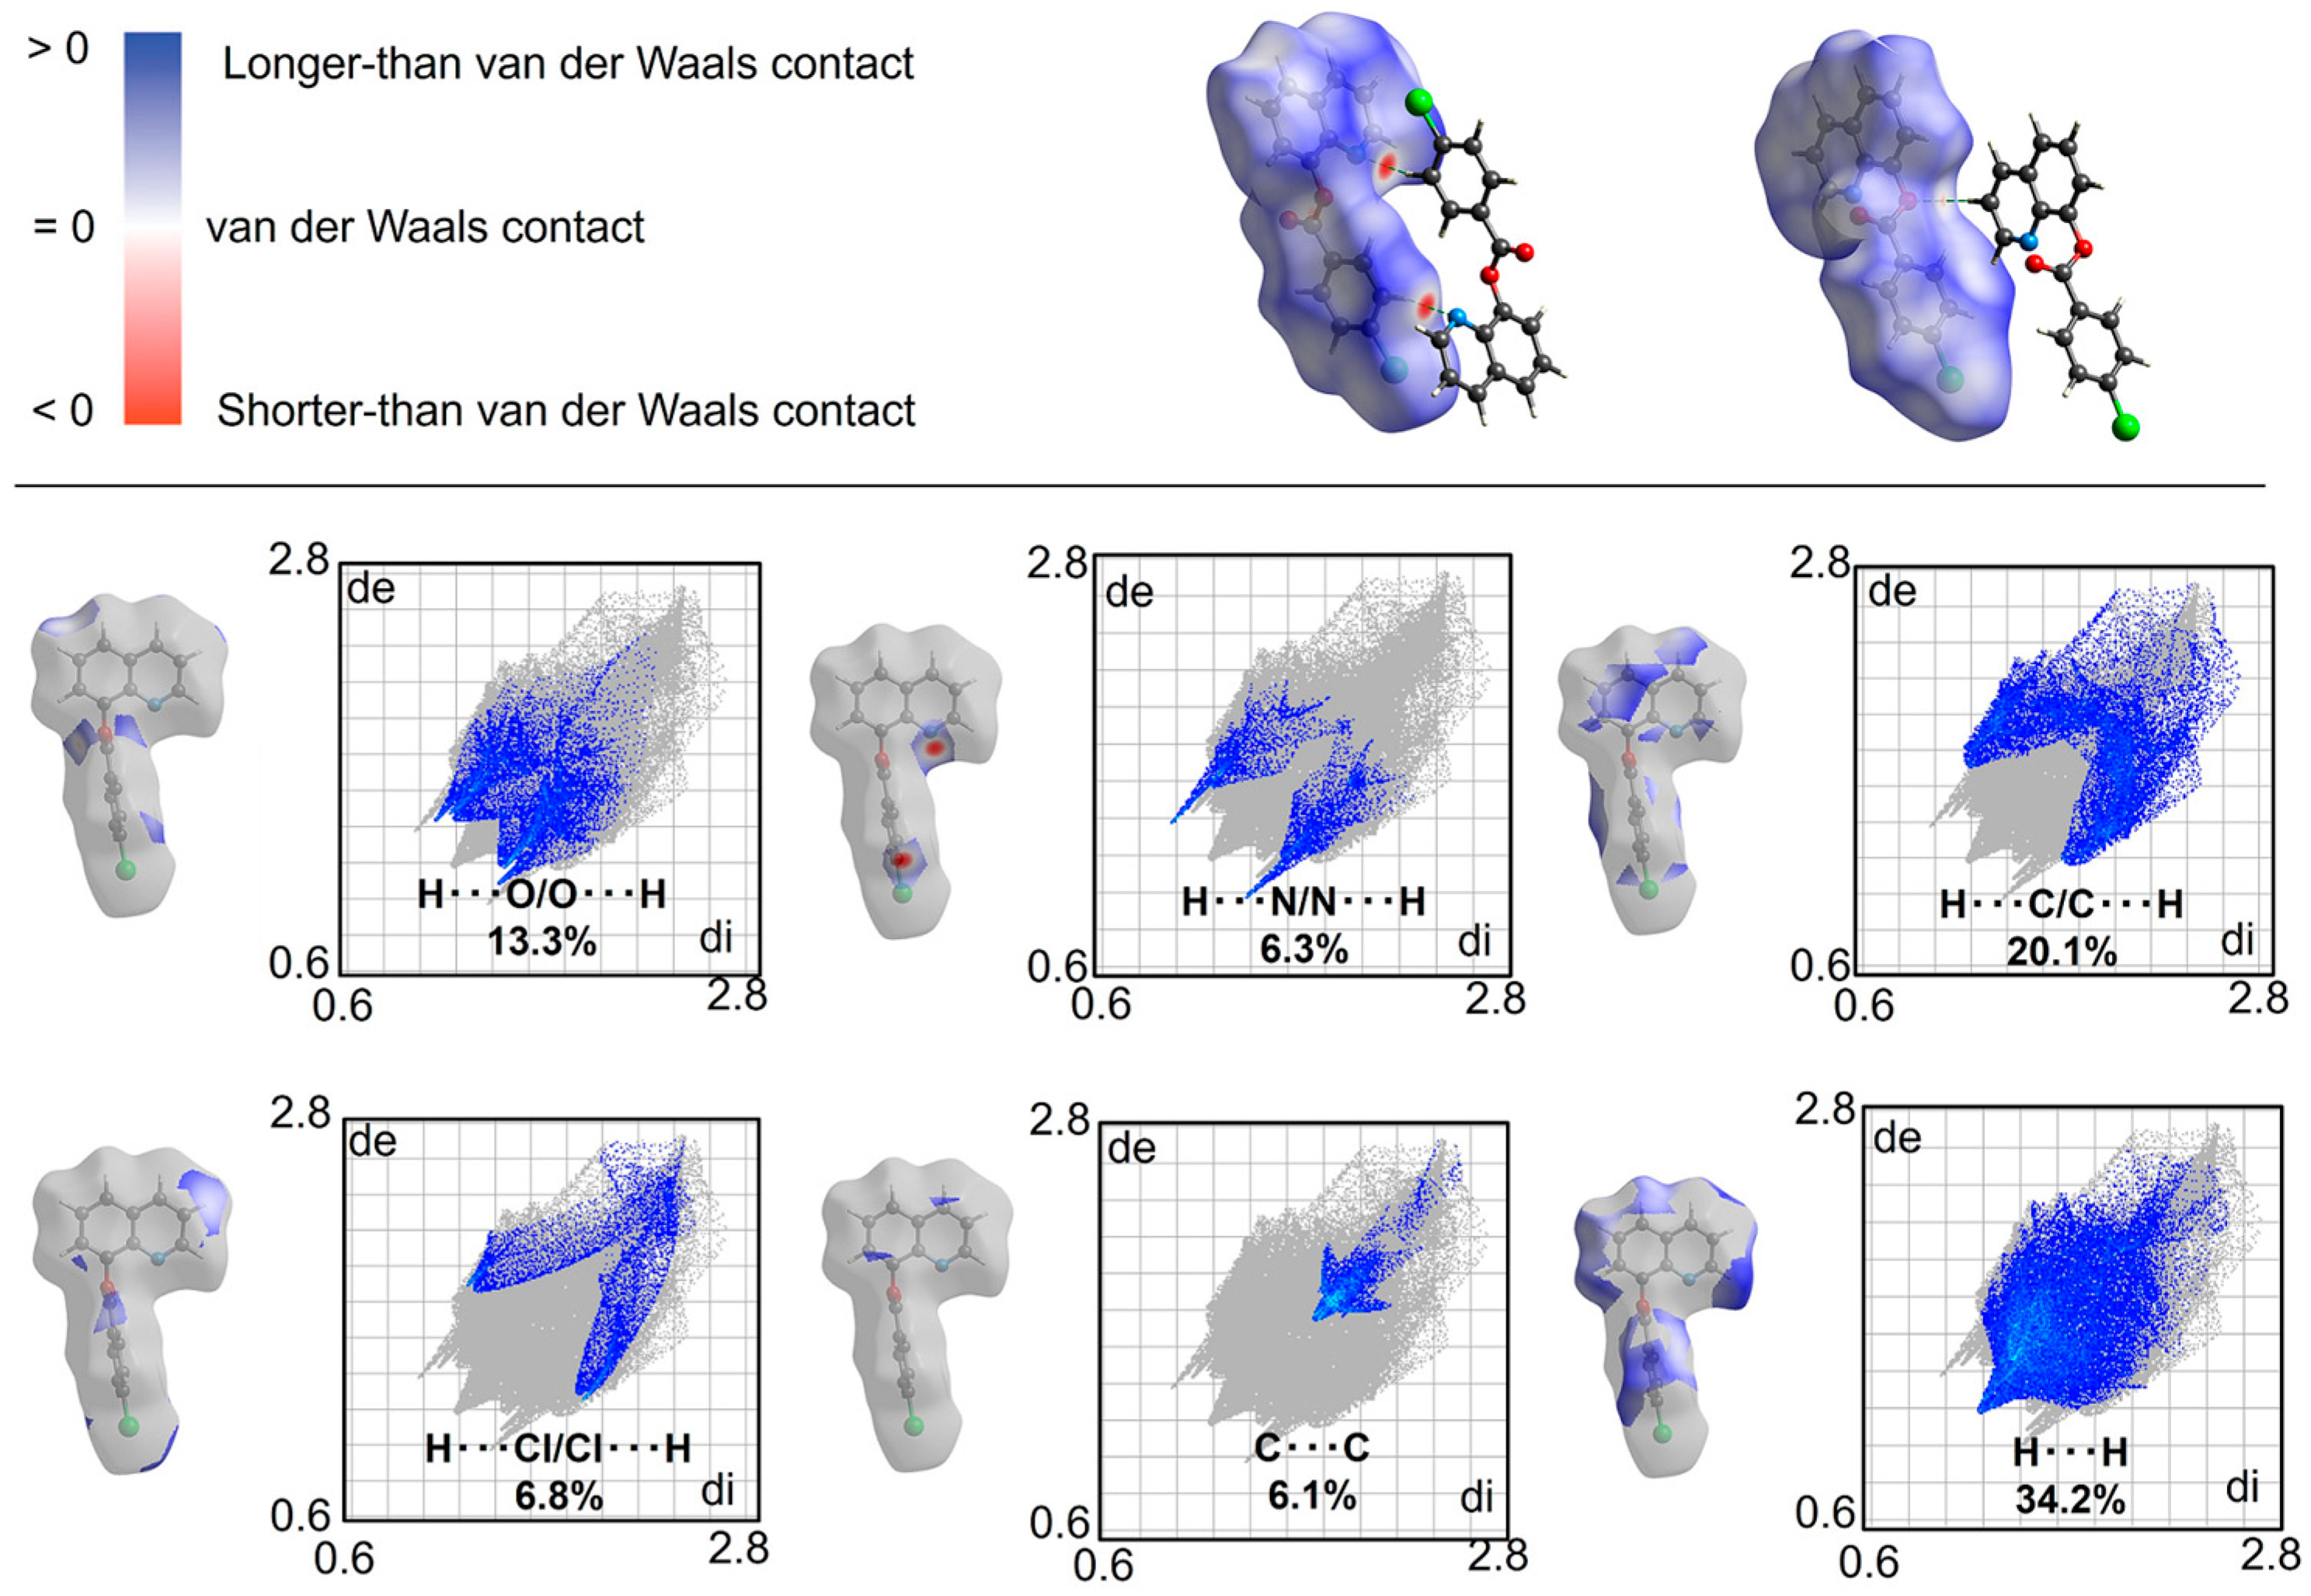
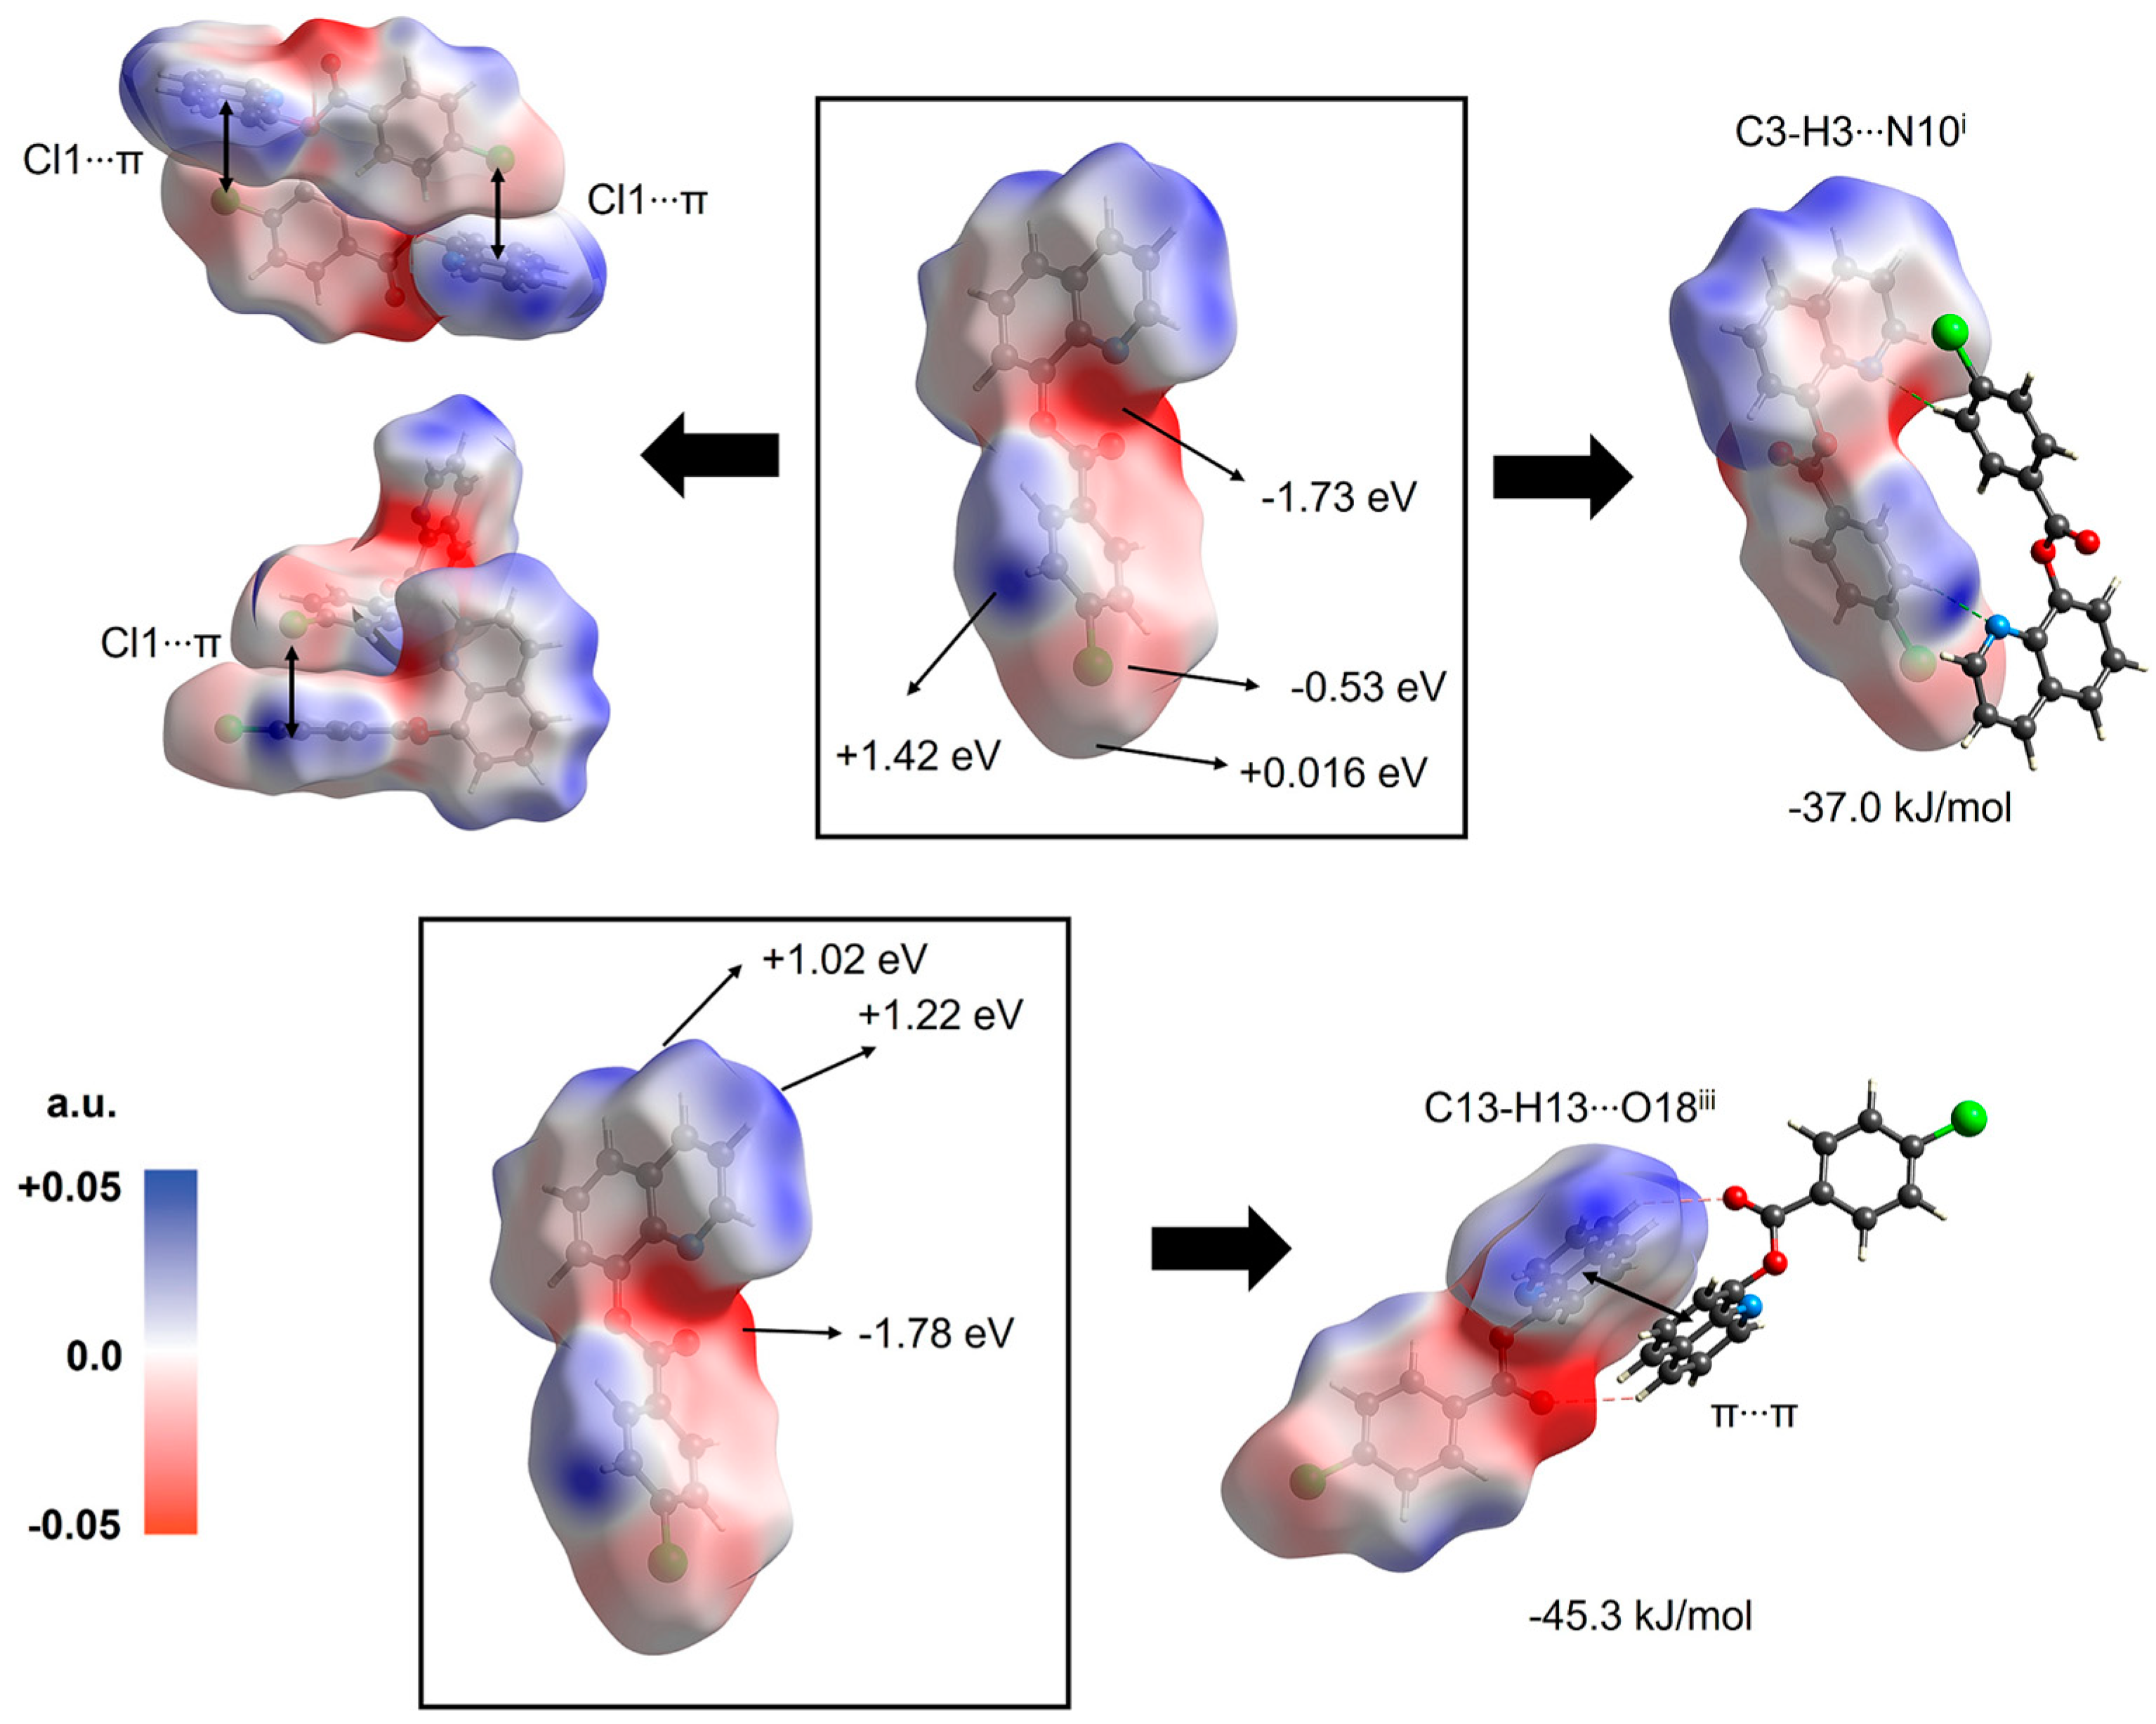
3.7. Supramolecular Structure and Computational Study
3.8. In Vitro Antitumor Studies
4. Conclusions
Supplementary Materials
Author Contributions
Funding
Data Availability Statement
Acknowledgments
Conflicts of Interest
References
- Marella, A.; Tanwar, O.P.; Saha, R.; Ali, M.R.; Srivastava, S.; Akhter, M.; Shaquiquzzaman, M.; Alam, M.M. Quinoline: A versatile heterocyclic. Saudi Pharm. J. 2013, 21, 1–12. [Google Scholar] [CrossRef]
- Insuasty, B.; Montoya, A.; Becerra, D.; Quiroga, J.; Abonia, R.; Robledo, S.; Vélez, I.D.; Upegui, Y.; Nogueras, M.; Cobo, J. Synthesis of novel analogs of 2-pyrazoline obtained from [(7-chloroquinolin-4-yl)amino]chalcones and hydrazine as potential antitumor and antimalarial agents. Eur. J. Med. Chem. 2013, 67, 252–262. [Google Scholar] [CrossRef]
- Teng, P.; Li, C.; Peng, Z.; Vanderschouw, A.M.; Nimmagadda, A.; Su, M.; Li, Y.; Sun, X.; Cai, J. Facilely accessible quinoline derivatives as potent antibacterial agents. Bioorg. Med. Chem. 2018, 26, 3573–3579. [Google Scholar] [CrossRef] [PubMed]
- Musiol, R. Quinoline-based HIV integrase inhibitors. Curr. Pharm. Des. 2013, 19, 1835–1849. [Google Scholar] [CrossRef] [PubMed]
- Vandekerckhove, S.; Tran, H.G.; Desmet, T.; D’hooghe, M. Evaluation of (4-aminobutyloxy)quinolines as a novel class of antifungal agents. Bioorg. Med. Chem. Lett. 2013, 23, 4641–4643. [Google Scholar] [CrossRef]
- Zajdel, P.; Partyka, A.; Marciniec, K.; Bojarski, A.J.; Pawlowski, M.; Wesolowska, A. Quinoline- and isoquinoline-sulfonamide analogs of aripiprazole: Novel antipsychotic agents? Future Med. Chem. 2014, 6, 57–75. [Google Scholar] [CrossRef] [PubMed]
- Ghanim, A.M.; Girgis, A.S.; Kariuki, B.M.; Samir, N.; Said, M.F.; Abdelnaser, A.; Nasr, S.; Bekheit, M.S.; Abdelhameed, M.F.; Almalki, A.J.; et al. Design and synthesis of ibuprofen-quinoline conjugates as potential anti-inflammatory and analgesic drug candidates. Bioorg. Chem. 2022, 119, 105557. [Google Scholar] [CrossRef] [PubMed]
- Jarvis, B.; Markham, A. Montelukast: A review of its therapeutic potential in persistent asthma. Drugs 2000, 59, 891–928. [Google Scholar] [CrossRef]
- Loiseau, P.M.; Balaraman, K.; Barratt, G.; Pomel, S.; Durand, R.; Frézard, F.; Figadère, B. The potential of 2-substituted quinolines as antileishmanial drug candidates. Molecules 2022, 27, 2313. [Google Scholar] [CrossRef] [PubMed]
- Muruganantham, N.; Sivakumar, R.; Anbalagan, N.; Gunasekaran, V.; Leonard, J.T. Synthesis, anticonvulsant and antihypertensive activities of 8-substituted quinoline derivatives. Biol. Pharm. Bull. 2004, 27, 1683–1687. [Google Scholar] [CrossRef]
- Afzal, O.; Kumar, S.; Haider, M.R.; Ali, M.R.; Kumar, R.; Jaggi, M.; Bawa, S. A review on anticancer potential of bioactive heterocycle quinoline. Eur. J. Med. Chem. 2015, 97, 871–910. [Google Scholar] [CrossRef]
- Musiol, R. An overview of quinoline as a privileged scaffold in cancer drug discovery. Expert Opin. Drug Discov. 2017, 12, 583–597. [Google Scholar] [CrossRef] [PubMed]
- Jain, S.; Chandra, V.; Jain, P.K.; Pathak, K.; Pathak, D.; Vaidya, A. Comprehensive review on current developments of quinoline-based anticancer agents. Arab. J. Chem. 2019, 12, 4920–4946. [Google Scholar] [CrossRef]
- Mohamed, M.F.A.; Abuo-Rahma, G.E.-D.A. Molecular targets and anticancer activity of quinoline–chalcone hybrids: Literature review. RSC Adv. 2020, 10, 31139–31155. [Google Scholar] [CrossRef] [PubMed]
- Dorababu, A. Report on recently (2017–20) designed quinoline-based human cancer cell growth inhibitors. ChemistrySelect 2020, 5, 13902–13915. [Google Scholar] [CrossRef]
- Ilakiyalakshmi, M.; Napoleon, A.A. Review on recent development of quinoline for anticancer activities. Arab. J. Chem. 2022, 15, 104168. [Google Scholar] [CrossRef]
- Bowles, D.W.; Kessler, E.R.; Jimeno, A. Multi-targeted tyrosine kinase inhibitors in clinical development: Focus on XL-184 (cabozantinib). Drugs Today 2011, 47, 857–868. [Google Scholar] [CrossRef]
- Rossari, F.; Minutolo, F.; Orciuolo, E. Past, present, and future of Bcr-Abl inhibitors: From chemical development to clinical efficacy. J. Hematol. Oncol. 2018, 11, 84. [Google Scholar] [CrossRef]
- Cabanillas, M.E.; Habra, M.A. Lenvatinib: Role in thyroid cancer and other solid tumors. Cancer Treat. Rev. 2016, 42, 47–55. [Google Scholar] [CrossRef]
- Venditto, V.J.; Simanek, E.E. Cancer therapies utilizing the camptothecins: A review of the in vivo literature. Mol. Pharm. 2010, 7, 307–349. [Google Scholar] [CrossRef]
- Oliveri, V.; Vecchio, G. 8-Hydroxyquinolines in medicinal chemistry: A structural perspective. Eur. J. Med. Chem. 2016, 120, 252–274. [Google Scholar] [CrossRef] [PubMed]
- Saadeh, H.A.; Sweidan, K.A.; Mubarak, M.S. Recent advances in the synthesis and biological activity of 8-hydroxyquinolines. Molecules 2020, 25, 4321. [Google Scholar] [CrossRef] [PubMed]
- Gupta, R.; Luxami, V.; Paul, K. Insights of 8-hydroxyquinolines: A novel target in medicinal chemistry. Bioorg. Chem. 2021, 108, 104633. [Google Scholar] [CrossRef] [PubMed]
- Jiang, H.; Taggart, J.E.; Zhang, X.; Benbrook, D.M.; Lind, S.E.; Ding, W.-D. Nitroxoline (8-hydroxy-5-nitroquinoline) is more a potent anti-cancer agent than clioquinol (5-chloro-7-iodo-8-quinoline). Cancer Lett. 2011, 312, 11–17. [Google Scholar] [CrossRef] [PubMed]
- Ding, W.-D.; Liu, B.; Vaught, J.L.; Yamauchi, H.; Lind, S.E. Anticancer activity of the antibiotic clioquinol. Cancer Res. 2005, 65, 3389–3395. [Google Scholar] [CrossRef] [PubMed]
- Joaquim, A.R.; Gionbelli, M.P.; Gosmann, G.; Meneghello Fuentefria, A.; Silva Lopes, M.; Fernandes de Andrade, S. Novel antimicrobial 8-hydroxyquinoline-based agents: Current development, structure–activity relationships, and perspectives. J. Med. Chem. 2021, 64, 16349–16379. [Google Scholar] [CrossRef] [PubMed]
- Chabukswar, A.R.; Kuchekar, B.S.; Jagdale, S.C.; Lokhande, P.D.; Chabukswar, V.V.; Shisodia, S.U.; Mahabal, R.H.; Londhe, A.M.; Ojha, N.S. Synthesis and evaluation of analgesic, anti-asthmatic activity of (E)-1-(8-hydroxyquinolin-7-yl)-3-phenylprop-2-en-1 ones. Arab. J. Chem. 2016, 9, 704–712. [Google Scholar] [CrossRef]
- Pearce, D.A.; Jotterand, N.; Carrico, I.S.; Imperiali, B. Derivatives of 8-hydroxy-2-methylquinoline are powerful prototypes for Zinc sensors in biological systems. J. Am. Chem. Soc. 2001, 123, 5160–5161. [Google Scholar] [CrossRef]
- Mameli, M.; Aragoni, M.C.; Arca, M.; Caltagirone, C.; Demartin, F.; Farruggia, G.; De Filippo, G.; Devillanova, F.A.; Garau, A.; Isaia, F.; et al. A selective, nontoxic, OFF–ON fluorescent molecular sensor based on 8-hydroxyquinoline for probing Cd2+ in living cells. Chem.–Eur. J. 2010, 16, 919–930. [Google Scholar] [CrossRef] [PubMed]
- Bell, J.; Samb, I.; Toullec, P.Y.; Mongin, O.; Blanchard-Desce, M.; Michelet, V.; Leray, I. Ultra-sensitive and selective Hg2+ chemosensors derived from substituted 8-hydroxyquinoline analogues. New J. Chem. 2014, 38, 1072–1078. [Google Scholar] [CrossRef]
- Gao, L.-B.; Kang, W.-K.; Yan, S.-H.; Yang, C.-P. Studies of substituents impact on the photophysical properties of 8-hydroxyquinoline derivatives. Heteroat. Chem. 2016, 27, 54–62. [Google Scholar] [CrossRef]
- Zhang, H.; Han, L.-F.; Zachariasse, K.A.; Jiang, Y.-B. 8-Hydroxyquinoline benzoates as highly sensitive fluorescent chemosensors for transition metal ions. Org. Lett. 2005, 7, 4217–4220. [Google Scholar] [CrossRef] [PubMed]
- Hu, S.; Jin, Y.; Liu, Y.; Ljungman, M.; Neamati, N. Synthesis and mechanistic studies of quinolin-chlorobenzothioate derivatives with proteasome inhibitory activity in pancreatic cancer cell lines. Eur. J. Med. Chem. 2018, 158, 884–895. [Google Scholar] [CrossRef]
- Maddocks, C.J.; Aathimanikandan, S.V.; Richardson, J.; Ruble, J.C. Quinolin-8-yl formate: A new option for small-scale carbonylation reactions in microwave reactors. Synlett 2020, 31, 1608–1612. [Google Scholar] [CrossRef]
- For Details of the Monowave 50 Instruments. Available online: https://www.anton-paar.com/co-es/productos/detalles/reactor-de-sintesis-monowave-50/ (accessed on 15 December 2022).
- CrysAlisPro 1.171.39.46e, Rigaku Oxford Diffraction, 2018. Available online: https://www.rigaku.com/products/crystallography/crysalis (accessed on 9 January 2023).
- Palatinus, L.; Chapuis, G. SUPERFLIP–A computer program for the solution of crystal structures by charge flipping in arbitrary dimensions. J. Appl. Crystallogr. 2007, 40, 786–790. [Google Scholar] [CrossRef]
- Sheldrick, G.M. Crystal structure refinement with SHELXL. Acta Crystallogr. Sect. C Struct. Chem. 2015, 71, 3–8. [Google Scholar] [CrossRef]
- Macrae, C.F.; Bruno, I.J.; Chisholm, J.A.; Edgington, P.R.; McCabe, P.; Pidcock, E.; Rodriguez-Monge, L.; Taylor, R.; van de Streek, J.; Wood, P.A. Mercury CSD 2.0—New features for the visualization and investigation of crystal structures. J. Appl. Crystallogr. 2008, 41, 466–470. [Google Scholar] [CrossRef]
- Spackman, M.A.; Jayatilaka, D. Hirshfeld surface analysis. CrystEngComm 2009, 11, 19–32. [Google Scholar] [CrossRef]
- Jayatilaka, D.; Grimwood, D.J.; Lee, A.; Lemay, A.; Russel, A.J.; Taylor, C.; Wolff, S.K.; Cassam-Chenai, P.; Whitton, A. TONTO–A System for Computational Chemistry. 2005. Available online: http://hirshfeldsurface.net (accessed on 9 January 2023).
- Spackman, M.A.; McKinnon, J.J.; Jayatilaka, D. Electrostatic potentials mapped on Hirshfeld surfaces provide direct insight into intermolecular interactions in crystals. CrystEngComm. 2008, 10, 377–388. [Google Scholar] [CrossRef]
- Mackenzie, C.F.; Spackman, P.R.; Jayatilaka, D.; Spackman, M.A. CrystalExplorer model energies and energy frameworks: Extension to metal coordination compounds, organic salts, solvates and open-shell systems. IUCrJ 2017, 4, 575–587. [Google Scholar] [CrossRef]
- Turner, M.J.; McKinnon, J.J.; Wolff, S.K.; Grimwood, D.J.; Spackman, P.R.; Jayatilaka, D.; Spackman, M.A. CrystalExplorer17, 2017, University of Western Australia. Available online: http://hirshfeldsurface.net/ (accessed on 9 January 2023).
- Corma, A.; Iborra, S.; Velty, A. Chemical routes for the transformation of biomass into chemicals. Chem. Rev. 2007, 107, 2411–2502. [Google Scholar] [CrossRef]
- Brown, D.G.; Boström, J. Analysis of past and present synthetic methodologies on medicinal chemistry: Where have all the new reactions gone? J. Med. Chem. 2016, 59, 4443–4458. [Google Scholar] [CrossRef] [PubMed]
- Obermayer, D.; Znidar, D.; Glotz, G.; Stadler, A.; Dallinger, D.; Kappe, C.O. Design and performance validation of a conductively heated sealed-vessel reactor for organic synthesis. J. Org. Chem. 2016, 81, 11788–11801. [Google Scholar] [CrossRef]
- Tobiszewski, M.; Namieśnik, J.; Pena-Pereira, F. Environmental risk-based ranking of solvents using the combination of a multimedia model and multi-criteria decision analysis. Green Chem. 2017, 19, 1034–1042. [Google Scholar] [CrossRef]
- Silverstein, R.M.; Webster, F.X.; Kiemle, D.J.; Bryce, D.L. Spectrometric Identification of Organic Compounds, 8th ed.; Wiley: Hoboken, NJ, USA, 2014. [Google Scholar]
- Fernandes, R.F.; Stroppa, P.H.F.; Ferreira, G.R.; da Silva, A.D.; Edwards, H.G.M.; de Oliveira, L.C.F. Vibrational spectroscopic study of some quinoline derivatives. Vib. Spectrosc. 2016, 86, 128–133. [Google Scholar] [CrossRef]
- Krishnakumar, V.; Ramasamy, R. DFT studies and vibrational spectra of isoquinoline and 8-hydroxyquinoline. Spectrochim. Acta A Mol. Biomol. Spectrosc. 2005, 61, 673–683. [Google Scholar] [CrossRef] [PubMed]
- Bahgat, K.; Ragheb, A.G. Analysis of vibrational spectra of 8-hydroxyquinoline and its 5,7-dichloro, 5,7-dibromo, 5,7-diiodo and 5,7-dinitro derivatives based on density functional theory calculations. Cent. Eur. J. Chem. 2007, 5, 201–220. [Google Scholar] [CrossRef]
- Saral, A.; Sudha, P.; Muthu, S.; Sevvanthi, S.; Sangeetha, P.; Selvakumari, S. Vibrational spectroscopy, quantum computational and molecular docking studies on 2-chloroquinoline-3-carboxaldehyde. Heliyon 2021, 7, e07529. [Google Scholar] [CrossRef]
- Castillo, J.-C.; Martínez, J.J.; Becerra, D.; Rojas, H.; Macías, M.A. Obtaining (5-formylfuran-2-yl)methyl 4-chlorobenzoate through an esterification of 5-hydroxymethylfurfural: Interesting achiral molecule crystallizing in a Sohncke P212121 space group. J. Mol. Struct. 2022, 1268, 133713. [Google Scholar] [CrossRef]
- Xiao, L.; Liu, Y.; Xiu, Q.; Zhang, L.; Guo, L.; Zhang, H.; Zhong, C. Novel polymeric metal complexes as dye sensitizers for dye-sensitized solar cells based on polythiophene containing complexes of 8-hydroxyquinoline with Zn(II), Cu(II) and Eu(III) in the side chain. Tetrahedron 2010, 66, 2835–2842. [Google Scholar] [CrossRef]
- Janghouri, M.; Amini, M.M. Effect of zinc oxide doping on electroluminescence and electrical behavior of metalloporphyrins-doped samarium complex. J. Electron. Mater. 2018, 47, 2761–2767. [Google Scholar] [CrossRef]
- Vivas-Reyes, R.; Núñez-Zarur, F.; Martínez, E. Electronic structure and reactivity analysis for a set of Zn-chelates with substituted 8-hydroxyquinoline ligands and their application in OLED. Org. Electron. 2008, 9, 625–634. [Google Scholar] [CrossRef]
- Park, Y.; Fei, X.; Yuan, Y.; Lee, S.; Hur, J.; Park, S.J.; Jung, J.-K.; Seo, S.-Y. Chemoselective acylation of 2-amino-8-quinolinol in the generation of C2-amides or C8-esters. RSC Adv. 2017, 7, 41955–41961. [Google Scholar] [CrossRef]
- Salinas-Torres, A.; Jiménez, E.; Becerra, D.; Martínez, J.J.; Rojas, H.; Castillo, J.-C.; Macías, M.A. Synthesis, anticancer evaluation, thermal and X-ray crystallographic analysis of 2-oxo-2H-chromen-7-yl 4-chlorobenzoate using a conductively heated sealed-vessel reactor. J. Mol. Struct. 2022, 1274, 134414. [Google Scholar] [CrossRef]
- García-Olave, M.; Elejalde-Cadena, N.R.; Portilla, J.; Macías, M.A. C –H ···X (X = F, Cl) and Cl···Cl halogen-mediated interactions driving the crystal packing in N-substituted 4-arylimidazoles. J. Mol. Struct. 2023, 1272, 134181. [Google Scholar] [CrossRef]
- Molina Giraldo, D.A.; Ríos Vásquez, L.A.; Toscano, R.A.; Ocampo-Cardona, R.; Gomez-Peña, J.J.; Macías, M.A. Synthesis and crystallographic study of six quaternary salts of N-halomethylated and non-N-halomethylated ammonium: Importance of C-H···X (X = F, I) and I···I−halogen interactions in the supramolecular structures. J. Mol. Struct. 2023, 1271, 133962. [Google Scholar] [CrossRef]
- Nataraj, A.; Balachandran, V.; Karthick, T. Molecular orbital studies (hardness, chemical potential, electrophilicity, and first electron excitation), vibrational investigation and theoretical NBO analysis of 2-hydroxy-5-bromobenzaldehyde by density functional method. J. Mol. Struct. 2013, 1031, 221–233. [Google Scholar] [CrossRef]
- Geerlings, P.; De Proft, F.; Langenaeker, W. Conceptual density functional theory. Chem. Rev. 2003, 103, 1793–1874. [Google Scholar] [CrossRef]
- Antonijevic, I.S.; Janjic, G.V.; Milcic, M.; Zaric, S.D. Preferred geometries and energies of sulfur−sulfur interactions in crystal structures. Cryst. Growth Des. 2016, 16, 632–639. [Google Scholar] [CrossRef]
- Politzer, P.; Abu-Awwad, F. A comparative analysis of Hartree-Fock and Kohn-Sham orbital energies. Theor. Chem. Acc. 1998, 99, 83–87. [Google Scholar] [CrossRef]
- Mulliken, R.S. A new electroaffinity scale; together with data on valence states and on valence ionization potentials and electron affinities. J. Chem. Phys. 1934, 2, 782. [Google Scholar] [CrossRef]
- Parr, R.G.; von Szentpaly, L.; Liu, S. Electrophilicity index. J. Am. Chem. Soc. 1999, 121, 1922–1924. [Google Scholar] [CrossRef]
- Serrano-Sterling, C.; Becerra, D.; Portilla, J.; Rojas, H.; Macías, M.; Castillo, J.-C. Synthesis, biological evaluation and X-ray crystallographic analysis of novel (E)-2-cyano-3-(het)arylacrylamides as potential anticancer agents. J. Mol. Struct. 2021, 1244, 130944. [Google Scholar] [CrossRef]
- Abonia, R.; Insuasty, D.; Castillo, J.; Insuasty, B.; Quiroga, J.; Nogueras, M.; Cobo, J. Synthesis of novel quinoline-2-one based chalcones of potential antitumor activity. Eur. J. Med. Chem. 2012, 57, 29–40. [Google Scholar] [CrossRef]


| Crystal Data | Compound 3 |
|---|---|
| CCDC | 2,241,325 |
| Chemical formula | C16H10ClNO2 |
| Mr | 283.70 |
| Solvent for crystallization | Methanol |
| Crystalline system, space group | Monoclinic, P21/c |
| a, b, c (Å) | 12.0532 (14), 13.3785 (17), 8.4098 (13) |
| α, β, γ (°) | 90, 98.392 (13), 90 |
| Volume, (Å3) | 1341.6 (3) |
| ρ, kg m−3 | 1.405 |
| Z | 4 |
| Temperature, (K) | 298 (2) |
| Radiation type | Mo Kα |
| μ (mm−1) | 0.28 |
| Theta range for data collection | 3.045° < 2θ < 26.368° |
| Index range | −15 ≤ h ≤ 15, −16 ≤ k ≤ 16, −10 ≤ l ≤ 10 |
| Data collection | |
| Diffractometer | SuperNova, Dual, Cu at zero, Atlas |
| Absorption correction | Multi-Scan method CrysAlis PRO 1.171.41.119a (Rigaku Oxford Diffraction, 2021) |
| Tmin, Tmax | 0.503, 1.000 |
| No. of measured, independent and observed reflections [I > 2σ(I)] | 14,107, 2744, 2176 |
| Rint | 0.050 |
| (sin θ/λ) max (Å−1) | 0.625 |
| Refinement | |
| R[F2 > 2σ(F2)], wR(F2), S | 0.045, 0.128, 1.06 |
| No. of reflections | 2744 |
| Refined parameters | 182 |
| No. of restraints | 0 |
| H-atoms treatment | H-atom parameters constrained |
| Δρmax, Δρmin (e Å−3) | 0.17, −0.37 |
 | |||
|---|---|---|---|
| Entry | Temperature (°C) | Time (min) | Yield 3 (%) c |
| 1 | 80 | 20 | 91 |
| 2 | 60 | 20 | 88 |
| 3 | 40 | 20 | 76 |
| 4 | 80 | 10 | 79 |
| 5 b | 20 | 20 | 52 |
| Number | δH (mult, J in Hz) | δC (ppm) | COSY | HMBC |
|---|---|---|---|---|
| 2 | 8.88 (dd, J = 4.0, 1.6) | 150.8 | H–3 (3J) | C–3 (2J) C–8a (3J) C–4 (3J) |
| 3 | 7.43 (dd, J = 8.2, 4.2) | 121.9 | H–2 (3J) H–4 (3J) | C–4a (3J) C–2 (2J) |
| 4 | 8.20 (dd, J = 8.4, 1.2) | 136.1 | H–3 (3J) | C–5 (3J) C–8a (3J) C–2 (3J) |
| 4a | -- | 129.7 | -- | -- |
| 5 | 7.78 (dd, J = 7.2, 2.4) | 126.3 | H–6 (3J) | C–4a (2J) C–6 (2J) C–8a (3J) C–4 (3J) C–7 (3J) |
| 6 | 7.55–7.61 (m) | 126.4 | H–5 (3J) H–7 (3J) | C–5 (2J) C–8 (3J) C–4a (3J) |
| 7 | 7.55–7.61 (m) | 121.6 | H–6 (3J) | C–6 (2J) C–8 (2J) C–8a (3J) C–5 (3J) |
| 8 | -- | 147.7 | -- | -- |
| 8a | -- | 141.4 | -- | -- |
| C=O | -- | 164.8 | -- | -- |
| i | -- | 128.1 | -- | -- |
| o | 8.29 (d, J = 8.8) | 132.1 | Hm (3J) | Cp (3J) C=O (3J) |
| m | 7.52 (d, J = 8.8) | 129.1 | Ho (3J) | Cp (2J) Ci (3J) |
| p | -- | 140.2 | -- | -- |
| Compound | λmax (nm) | ε × 104 (L·mol−1·cm−1) | Assignment |
|---|---|---|---|
| 1 | 208, 235 312 | 5.68, 7.12 1.36 | π → π* n → π* |
| 3 | 205, 229, 243 278 | 4.70, 4.96, 2.64 0.84 | π → π* n → π* |
| Compound 3 | ||||
|---|---|---|---|---|
| D-H···A | D-H | H···A | D···A | D-H···A |
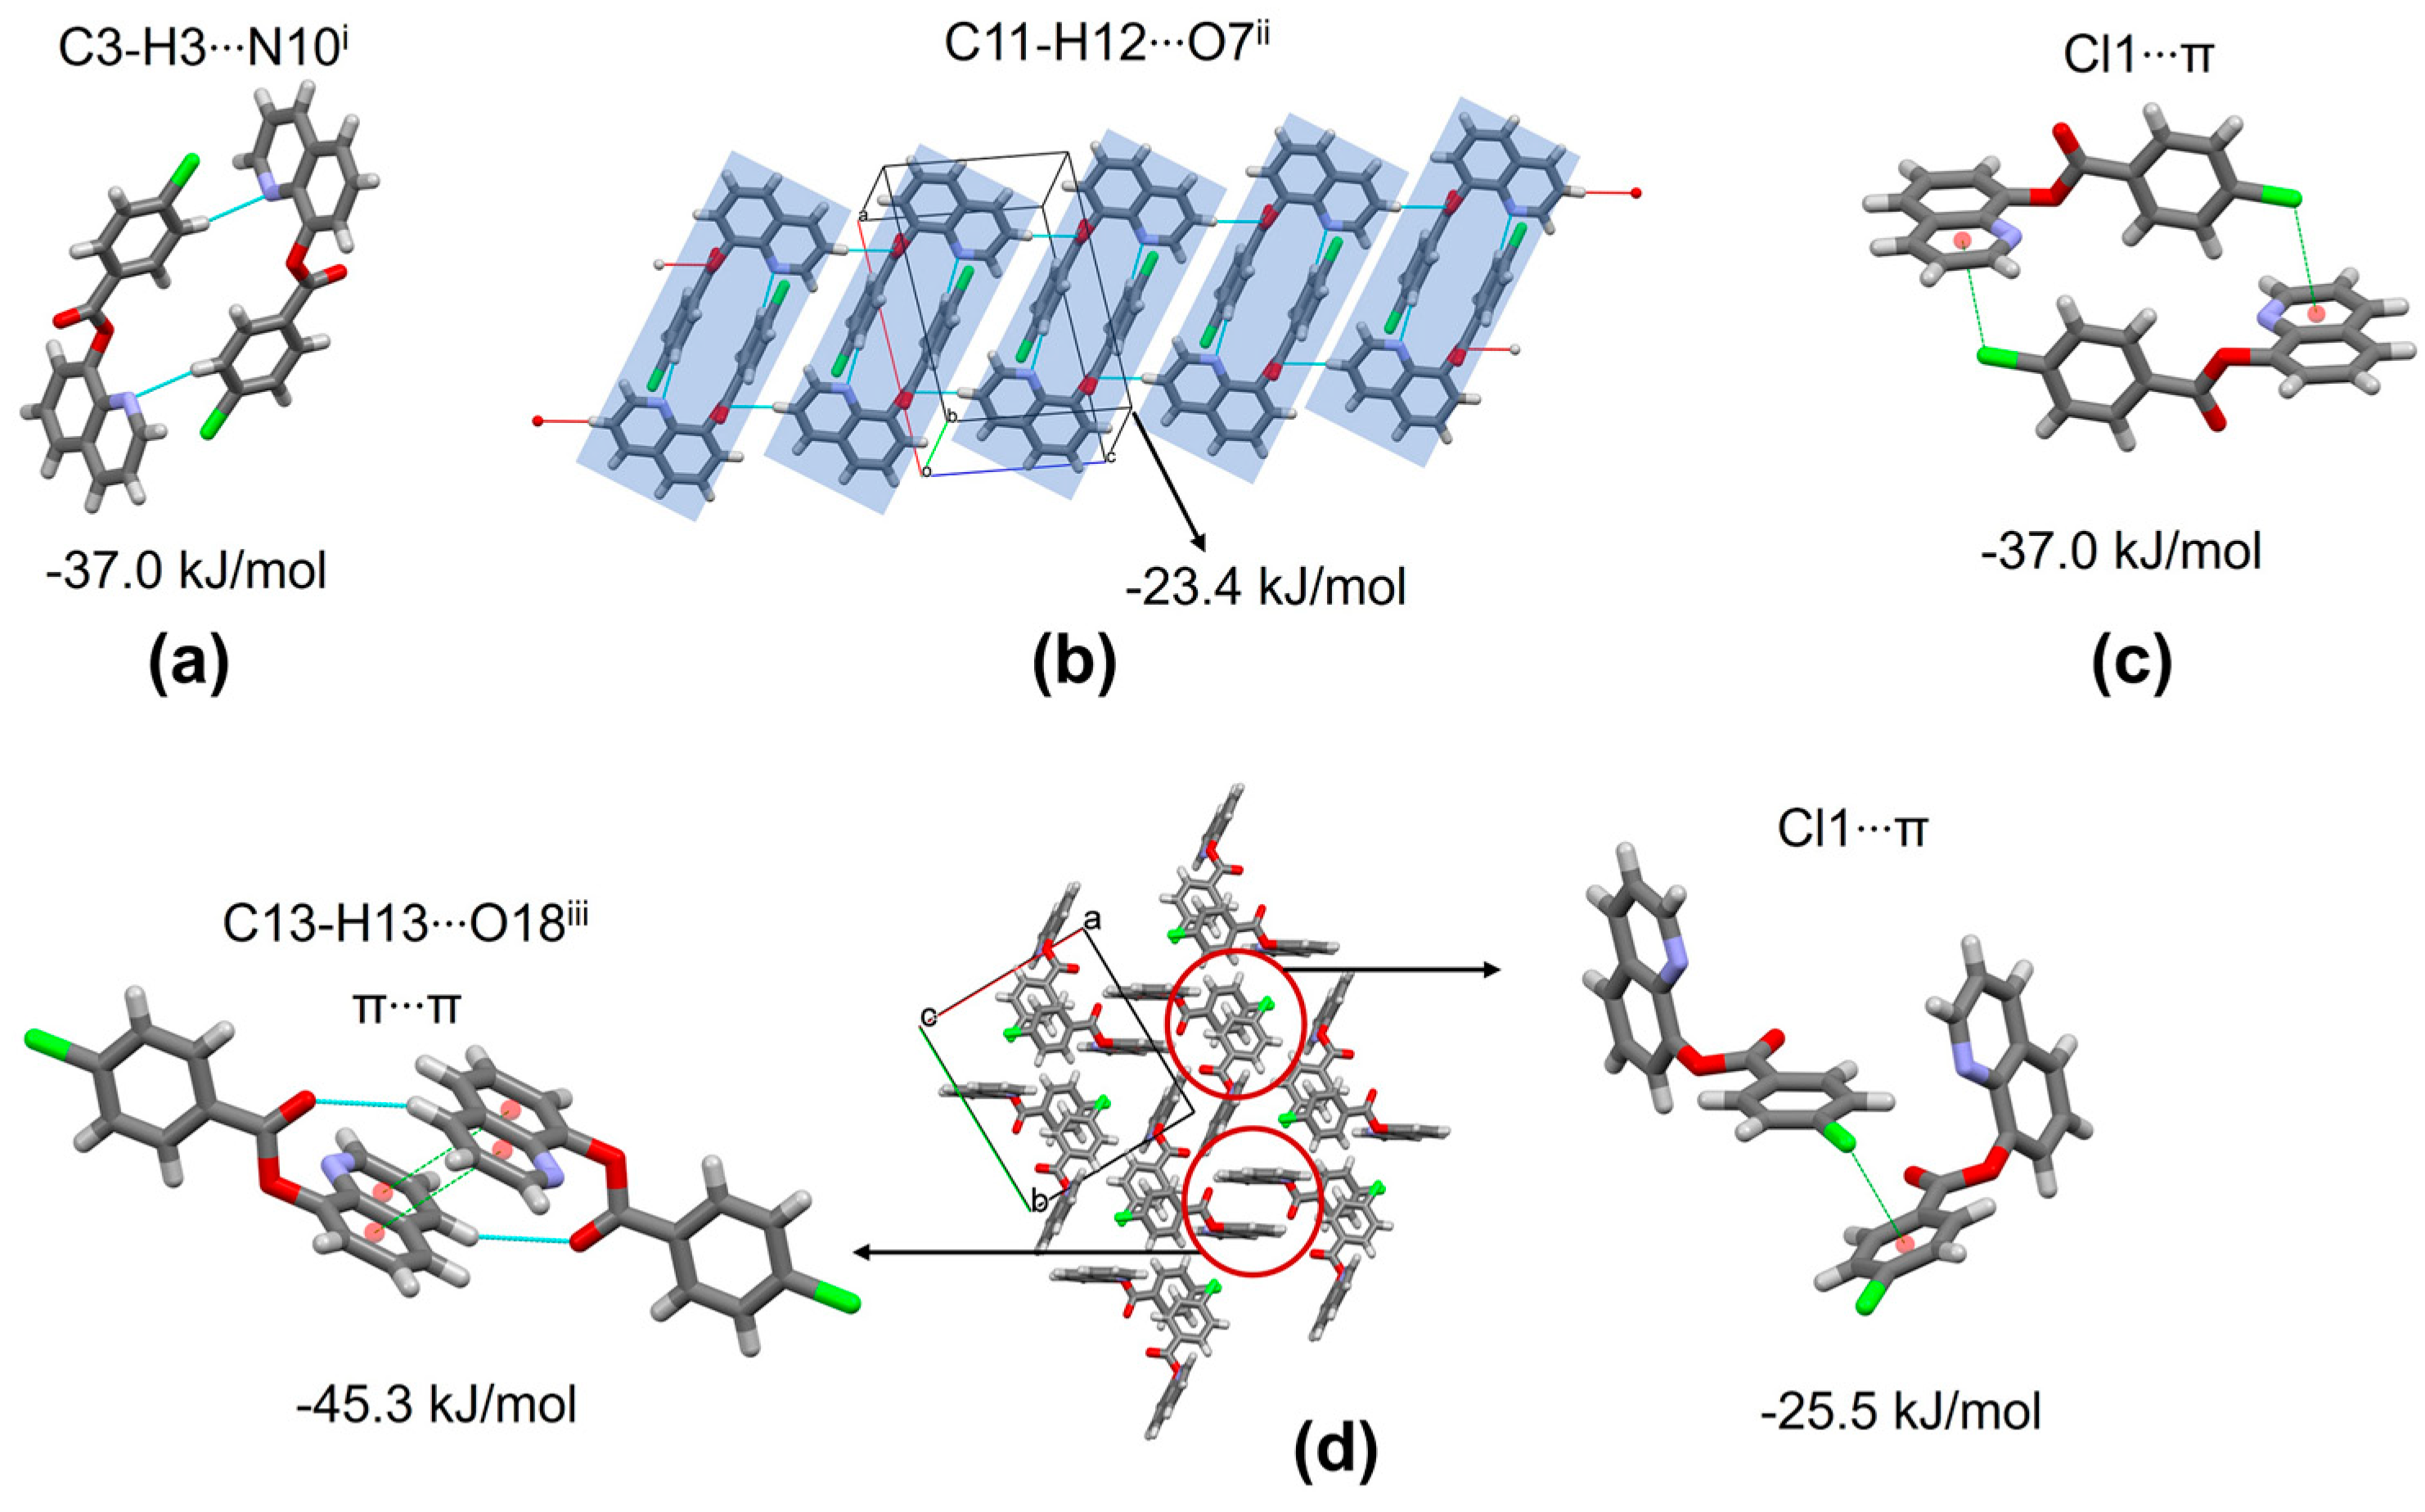
| C3-H3···N10 i | 0.93 | 2.52 | 3.431(3) | 167 |
| C11-H12···O7 ii | 0.93 | 2.69 | 3.578(3) | 161 |
| C13-H13···O18 iii | 0.93 | 2.78 | 3.587(3) | 145 |
| N | Symop/Description | R | Eele | Epol | Edis | Erep | Etot |
|---|---|---|---|---|---|---|---|
| 1 | 1 − x,1 − y,−z C-H···N, and Cl1···π | 5.62 | −20.8 | −3.7 | −41.7 | 39.0 | −37.0 |
| 1 | x,y,1 + z C-H···O | 7.40 | −7.6 | −1.8 | −21.3 | 7.3 | −23.4 |
| 2 | x,1/2 − y,−1/2 + z Cl1···π | 6.64 | −6.6 | −2.1 | −31.3 | 16.7 | −25.5 |
| 1 | 2 − x,1 − y,1 − z C-H···O and π···π | 8.78 | −17.5 | −5.1 | −44.4 | 25.4 | −45.3 |
| Parameters | Compound 3 |
|---|---|
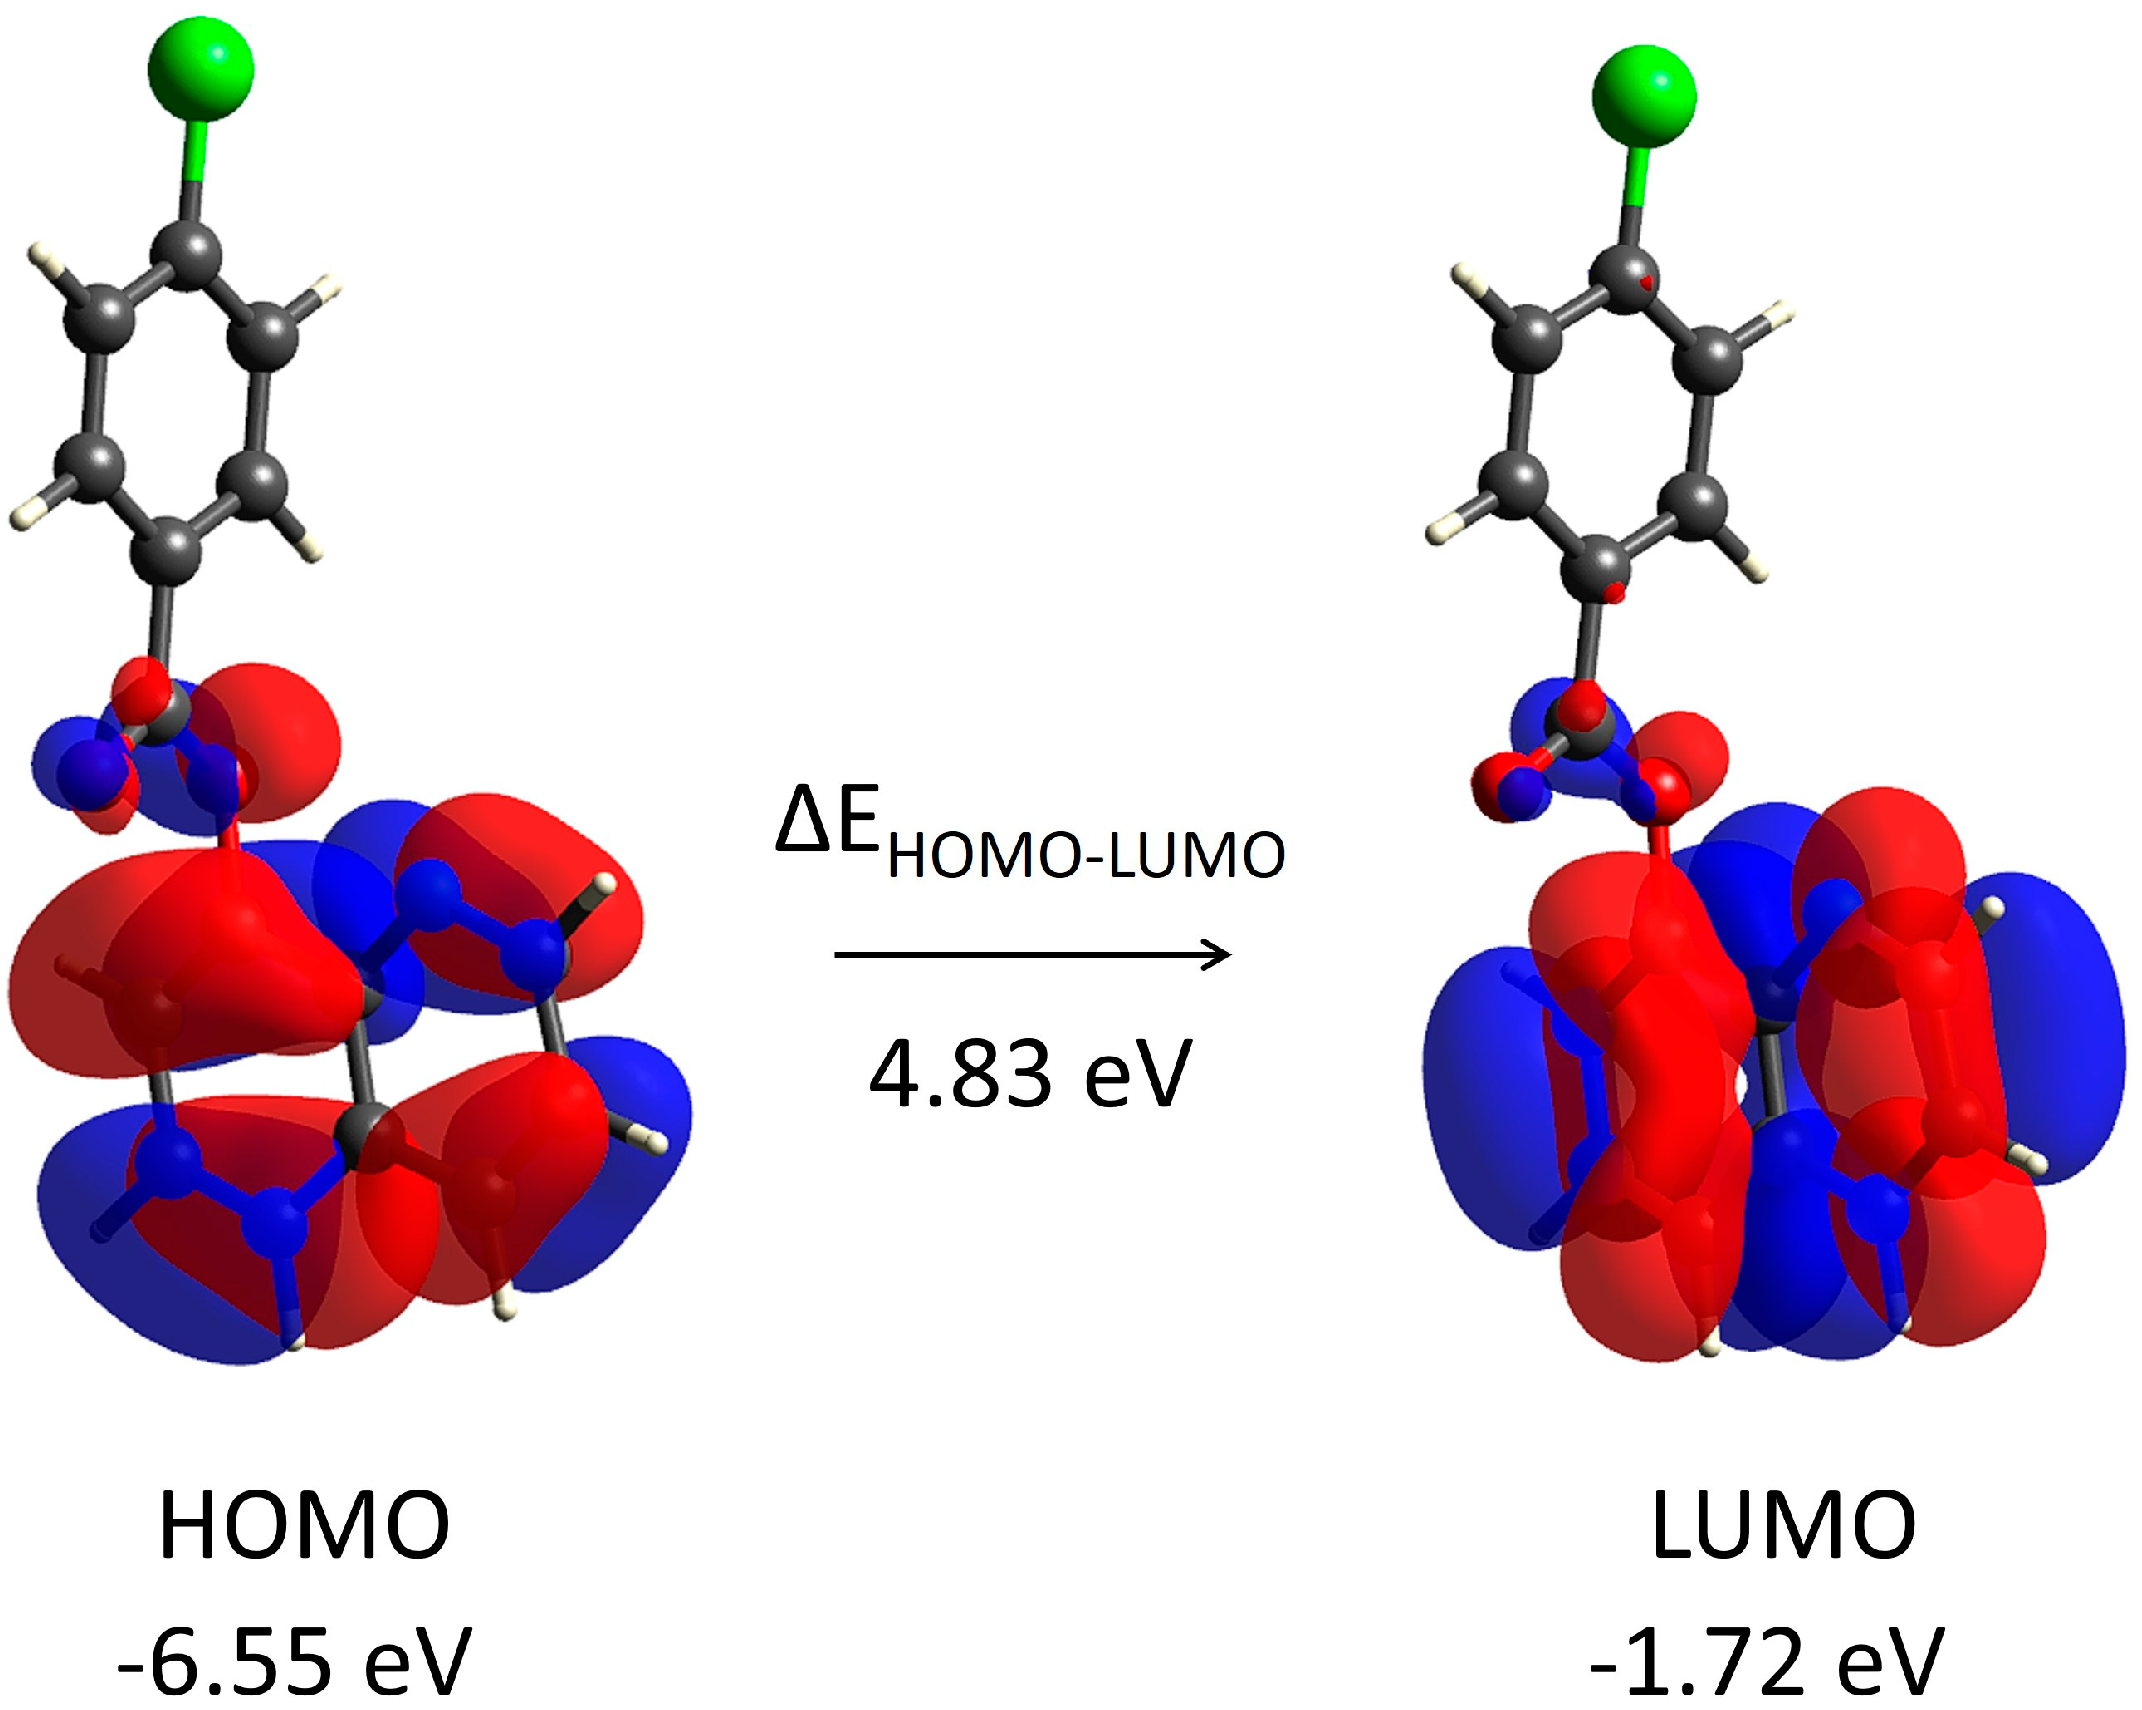
| HOMO Energy | –6.55 |
| LUMO Energy | –1.72 |
| HOMO–LUMO Energy Gap | 4.83 |
| Ionization Potential (IP) | 6.55 |
| Electron Affinity (EA) | 1.72 |
| Electrophilicity Index (ω) | 1.77 |
| Chemical Potential (μ) | –4.14 |
| Electronegativity (χ) | 4.14 |
| Hardness (η) | 4.83 |
| Mean Growth Percentage | Most Sensitive Cell Lines | Growth Inhibition Percentage (GI%) |
|---|---|---|
| 102.4 | HOP-92 (non-Small-cell lung cancer) | 6.2 |
| EKVX (non-Small-cell lung cancer) | 6.4 | |
| UO-31 (Renal cancer) | 18.1 | |
| SK-MEL-2 (Melanoma) | −13.9 | |
| OVCAR-3 (Ovarian cancer) | −15.4 | |
| BT-549 (Breast cancer) | −16.4 |
Disclaimer/Publisher’s Note: The statements, opinions and data contained in all publications are solely those of the individual author(s) and contributor(s) and not of MDPI and/or the editor(s). MDPI and/or the editor(s) disclaim responsibility for any injury to people or property resulting from any ideas, methods, instructions or products referred to in the content. |
© 2023 by the authors. Licensee MDPI, Basel, Switzerland. This article is an open access article distributed under the terms and conditions of the Creative Commons Attribution (CC BY) license (https://creativecommons.org/licenses/by/4.0/).
Share and Cite
Castillo, J.-C.; Becerra, D.; Macías, M.A. Crystal Structure, Hirshfeld Surface Analysis, and Computational Study of Quinolin-8-yl 4-Chlorobenzoate: Insights from Spectroscopic, Thermal, and Antitumor Properties. Crystals 2023, 13, 694. https://doi.org/10.3390/cryst13040694
Castillo J-C, Becerra D, Macías MA. Crystal Structure, Hirshfeld Surface Analysis, and Computational Study of Quinolin-8-yl 4-Chlorobenzoate: Insights from Spectroscopic, Thermal, and Antitumor Properties. Crystals. 2023; 13(4):694. https://doi.org/10.3390/cryst13040694
Chicago/Turabian StyleCastillo, Juan-Carlos, Diana Becerra, and Mario A. Macías. 2023. "Crystal Structure, Hirshfeld Surface Analysis, and Computational Study of Quinolin-8-yl 4-Chlorobenzoate: Insights from Spectroscopic, Thermal, and Antitumor Properties" Crystals 13, no. 4: 694. https://doi.org/10.3390/cryst13040694