

Intrafibrillar Growth of Hydroxyapatite Nanocrystals in Multiscale Collagen

1
State Key Laboratory of Silicate Materials for Architectures, Wuhan University of Technology, 122 Luoshi Road, Wuhan 430070, China
2
Hubei Longzhong Laboratory, Xiangyang 441000, China
3
State Key Laboratory of Advanced Technology for Materials Synthesis and Processing, Wuhan University of Technology, Wuhan 430070, China
4
State Key Laboratory of Precision Blasting, Jianghan University, Wuhan 430100, China
*
Authors to whom correspondence should be addressed.
Crystals 2023, 13(4), 692; https://doi.org/10.3390/cryst13040692
Submission received: 28 March 2023
/
Revised: 14 April 2023
/
Accepted: 16 April 2023
/
Published: 18 April 2023
(This article belongs to the Special Issue Biomaterials for Medical and Dental Applications)
Abstract
:Collagen fibrils hierarchically assemble from microscale to macroscale, which endows the natural composite bone with good mechanical properties and remodeling functions. Revealing the intrafibrillar growth process of hydroxyapatite nanocrystals of collagen will guide the research of bone repair or collagen-based composites. Herein, we investigated the mineralization of multiscale collagen matrices and strongly proved the intrafibrillar hydroxyapatite nanocrystals in the collagen fibrils. The hydroxyapatite nanocrystals were deposited within collagen fibrils with co-orientation along the (002) crystal plane, which is the longitude of the fibril. The whole growth process was captured by TEM to demonstrated the five stages of the intrafibrillar growth process of hydroxyapatite nanocrystals. The infiltration and transformation of amorphous calcium phosphate in isolated collagen fibrils are both demonstrated. The intrafibrillar growth process of hydroxyapatite nanocrystals in collagen film was also investigated, showing that the growth area of collagen films increased linearly with time and the growth process. By studying the in situ mineralization under different reaction conditions, the kinetic equation of the mineralized area of collagen film under each condition was obtained, and the optimal hydroxyapatite mineralized solution was proved to be a solution with polyacrylic acid of 50 μG/mL and a pH of 7.5. Our work provides more detailed information of the growth process of HAP nanocrystals during the mineralization of collagen at different scales and would contribute to future research on the formation process of more minerals in collagen.
1. Introduction
Bone is a hard tissue that has been extensively investigated due to its complicated structure and excellent mechanical properties [1,2,3]. Collagen fibrils are the framework of the bone [4]. For collagen fibrils, they are assembled by procollagen molecules in a quarter-staggered arrangement, which results in a periodic band pattern with 40 nm gap zones and 27 nm overlap zones [5]. This quarter-staggered arrangement of collagen fibrils forms the perfect confined room for hydroxyapatite (HAP) nanocrystal growth with co-alignment. During the formation process of bone, the non-collagenous proteins (NCPs) play an important role in stabilizing the amorphous calcium phosphate (ACP) and inhibiting ACP transformation to HAP [6,7]. A biocomposite fabrication strategy based on an original sol-gel (template) synthesis of the porous wollastonite containing 30 wt.% of HAP successfully fabricated nanostructured ceramic wollastonite samples [8,9]. The results are of great interest for the preparation of high-quality biomaterials for modern medicine using simple technological approaches and available raw materials. However, the NCPs are not easy to obtain, and the polyelectrolytes that own similar functions of NCPs are chosen to complete the intrafibrillar mineralization in vitro. The intrafibrillar growth of calcium carbonate [10], hydroxyapatite [4,11,12], calcium fluoride [13], and strontium carbonate [14] has been accomplished by using different polyelectrolytes.
Generally, infiltration and transformation are the two key steps to achieve intrafibrillar growth of minerals. The stabilized processors are drawn into the gap zones of fibrils, enter the collagen, and then transform to HAP nanocrystals with co-alignment [15,16]. Currently, the driving force theories for collagen mineralization include Gibbs–Donnan equilibrium [17], capillary force [4], coulombic attraction [7], and inhibitor size exclusion [18]. Though all the theories have their limitations, using the polyelectrolytes indeed completes the intrafibrillar growth of HAP nanocrystals. Tang at al. used two polyelectrolytes to prepare calcium phosphate clusters with ultra-small dimensions and achieved the remineralization of the bone [19]. Ping at al. fulfilled the intrafibrillar growth of strontium carbonate; the mineralized fibrils exhibited excellent piezoelectric properties compared with the original collagen fibrils, which indicates that the enhancement of piezoelectric properties was due to the interaction between collagen templates and intrafibrillar growth of mineral strontium carbonate nanocrystals [14]. Although adopting the polyelectrolytes could achieve the mineralization of fibrils, more methods are needed to prove the intrafibrillar growth of HAP nanocrystals. Detailed information about the intrafibrillar growth of HAP nanocrystals during the mineralization process is still insufficient. Meanwhile, the growth process of HAP nanocrystals in 2D collagen matrices such as collagen films is not well investigated.
In our work, the intrafibrillar growth of HAP nanocrystals in multiscale collagen was investigated. The intrafibrillar growth of HAP nanocrystals of collagen fibrils was fulfilled in vitro, and the intrafibrillar growth of HAP nanocrystals was certified by various methods. Five stages of the intrafibrillar growth process of HAP nanocrystals during the mineralization were captured. The infiltration process of ACP and the transformation from ACP to HAP were also demonstrated. Then, the mineralization process of larger scale collagen matrices (collagen films) was studied. The growth areas of collagen films varied linearly with time, and the growth rate of HAP nanocrystals in the collagen film depended on the concentration of PAA and the pH value of the growth solution.
2. Materials and Methods
2.1. The Growth of HAP Nanocrystals in Collagen Fibrils
The appropriate amount of collagen powder (Bovine Achilles Tendon CL, Worthington, Lakewood, NJ, USA) was weighed, immersed in acetic acid solution (0.1 M, 10 mL, Sigma Aldrich), and stirred for 24 h to fully disperse the raw collagen. The stock collagen solution (3 mg/mL) was stored at 4 °C. A small amount (2~4 μL) of the collagen solution was well dispersed on a flat substrate and dried at room temperature (25 °C).
The growth solution was prepared by slow drop mixing of 50 mL of solution A (2.7 mM CaCl2·2H2O, 10 mM HEPES buffer, and 100 μg/mL PAA) and 50 mL of solution B (2.7 mM K2HPO4·3H2O, 150 mM NaCl) through a peristaltic pump with an adding speed of 20 rpm. Polyacrylic acid (PAA, 25 wt%, Mw 240,000, Alfa Aesar, Ward Hill, MA, USA) was adopted to stabilize amorphous hydroxyapatite (ACP). HEPES buffer with 150 mM NaCl was used to maintain the pH of the mineralized solution. The collagen substrates were finally immersed in a growth solution with a pH value of 8.0 at 37 °C, and adjusted by NaOH solution. After the reaction for 24 h, the collagen substrates were washed with deionized water to clean sodium chloride crystals and then dried at 25 °C.
2.2. Morphology and Internal Structures of Collagen Fibrils with HAP Nanocrystals
Field-emission scanning electron microscopy (FE-SEM): A substrate of collagen fibrils with HAP was cut into smaller pieces. A conductive adhesive was used to stick small pieces on the sample stage, followed by vacuum plating with platinum for 80 s. A field emission scanning electron microscope (Hitachi S-4800, Tokyo, Japan) was adopted to observe the surface topography of the fibrils.
High-resolution transmission electron microscopy (HRTEM): The collagen fibrils with HAP nanocrystals were scraped from the substrate and uniformly dispersed into ethanol via a high-speed centrifuge. An appropriate amount of ethanol solution containing collagen fibrils with HAP was dropped on TEM grids and ethanol was evaporated completely at 25 °C. Ultrathin sections of the collagen fibrils with HAP were prepared by an ultramicrotome (Leica EMUC7, Wetzlar, Germany), and the ultrathin-sectioned slices were deposited on the TEM grids. The morphology and internal structures of collagen fibrils with HAP were observed using high-resolution transmission electron microscopy (Talos F200S, Waltham, MA, USA).
2.3. Composition Analysis of Collagen Fibrils with HAP Nanocrystals
X-ray diffraction (XRD, D8 Advance, Karlsruhe, Germany) and Raman spectrums (SENTERRA, Karlsruhe, Germany) were adopted to certify the component of the fibrils. HRTEM (Talos F200S, Waltham, MA, USA) was also used for selected area electron diffraction (SAED) patterns and energy-dispersive spectroscopy (EDS) mapping.
2.4. The Growth of HAP Nanocrystals in Collagen Films
The cover glasses (24 cm × 24 cm) were washed with deionized water and ethanol alternately six times. Forty microliters of collagen solution (3 mg mL−1) were evenly coated on the cover glasses and dried at 25 °C. The collagen-coated films were immersed in HAP a growth solution. After the reaction, the collagen films were washed with deionized water.
2.5. The Growth Process of HAP Nanocrystals in Collagen Films In Situ
Optical microscopy (Keyence VHX-5000, Osaka, Japan) was adopted to investigate the growth process of HAP in films. The collagen-coated cover glasses were placed in a plastic Petri dish containing HAP growth solution of different conditions. A transparent alumina glass heating plate was put under the Petri dish to maintain the reaction temperature at 37 °C. An appropriate area with HAP of collagen film was chosen to monitor the growth process under 400× magnification. The images were captured after 120 min, 150 min, 180 min, and 210 min. The size of the areas was measured by a Nano Measurer.
2.6. The Growth Process of HAP Nanocrystals in Collagen Films in Different Conditions
Collagen films were placed in the plastic Petri dishes containing HAP growth solution of different concentrations of PAA and different pH values. The PAA concentration of the HAP growth solution was set to 50 μg/mL, 100 μg/mL, and 150 μg/mL, respectively. In each concentration of PAA, four pH values were set to investigate the influence of weak acid growth solution (pH 6.5), neutral growth solution (pH 7.0), and weak basic growth solution (pH 7.5, pH 8.0) on the growth rate of HAP nanocrystals in collagen films. The reaction time was set at 24 h for a more convenient measurement of the growth rate in different conditions. Then, the growth area of each collagen film was calculated by Image J.
3. Results and Discussion
3.1. The Certification of Intrafibrillar Growth of HAP Nanocrystals
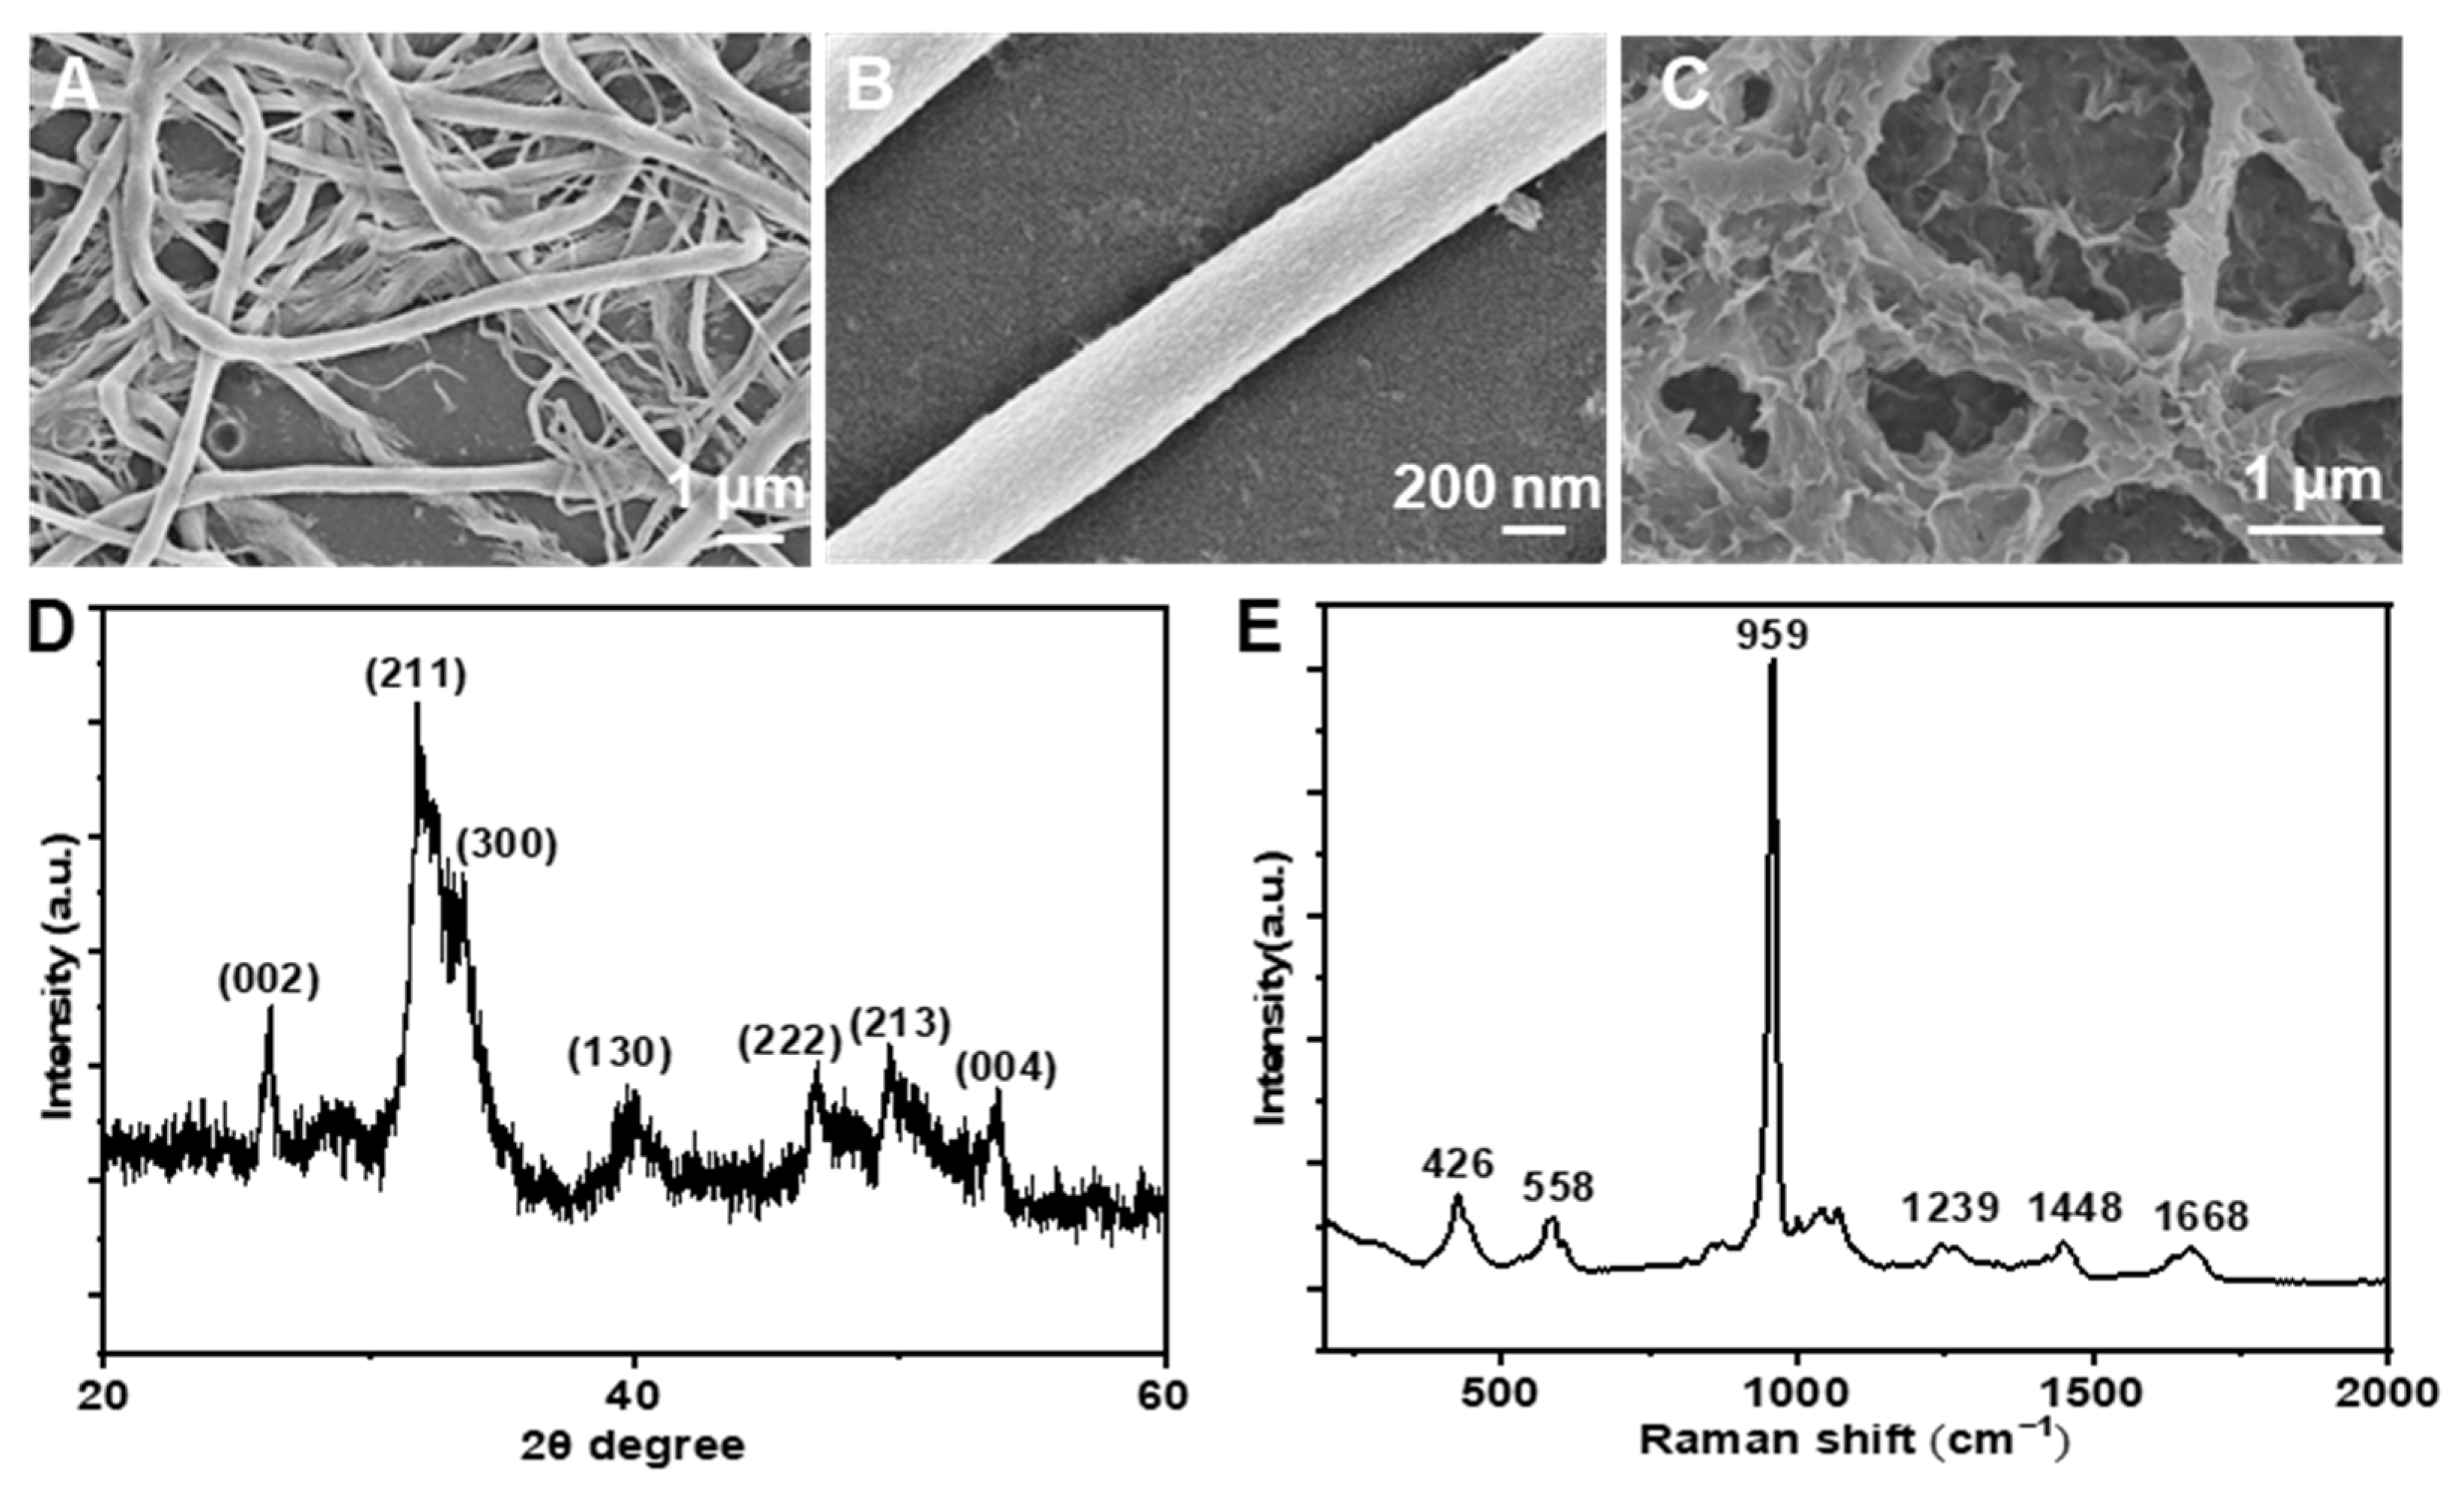
The collagen fibrils solution was dispersed on a glass coverslip and then immersed in the 2.7 mM hydroxyapatite (HAP) growth solution at pH 8.0. For the original collagen fibrils, the 67 nm characteristic periodic bands with 27 nm overlap zone and 40 nm gap zone were seen clearly (Figure S1 see Supplementary Materials). After the growth of 24 h, the characteristic periodic bands of the original fibrils disappeared for the intrafibrillar growth of HAP nanocrystals (Figure 1A). High magnification of the SEM image (Figure 1B) showed that no nanocrystals were on the surface of fibrils, and the fibrils had an increase in diameter and stronger three-dimensional sense than original fibrils. When no PAA was added to the growth solution, irregular extrafibrillar HAP formed on the surface of collagen fibrils (Figure 1C). Without the PAA, the liquid precursors would not have been formed through the PILP process [10,20], and HAP could only crystallize on the surface of collagen fibrils.
An XRD pattern and Raman spectrum were adopted to confirm the composition of the fibrils. The XRD pattern of the mineralized collagen shows seven peaks at around 26.2°, 32.0°, 33.5°, 40.0°, 46.9°, 49.7°, and 53.7°, which could be assigned to the (002), (211), (300), (130), (222), (231) and (004) crystal planes of the HAP phase (PDF#09-0432). The Raman spectrum (Figure 1E) shows the coexistence of HAP crystals and collagen fibrils. The peak located at 426 cm−1 is the symmetric bending vibration of PO43−, the peak located at 558 cm−1 is the asymmetric bending vibration of PO43−, and the peak located at 959 cm−1 is the symmetric stretching vibration of PO43−. The bands at 1239 cm−1 and 1668 cm−1 belong to the amide I and III of amino acids in collagen fibrils.
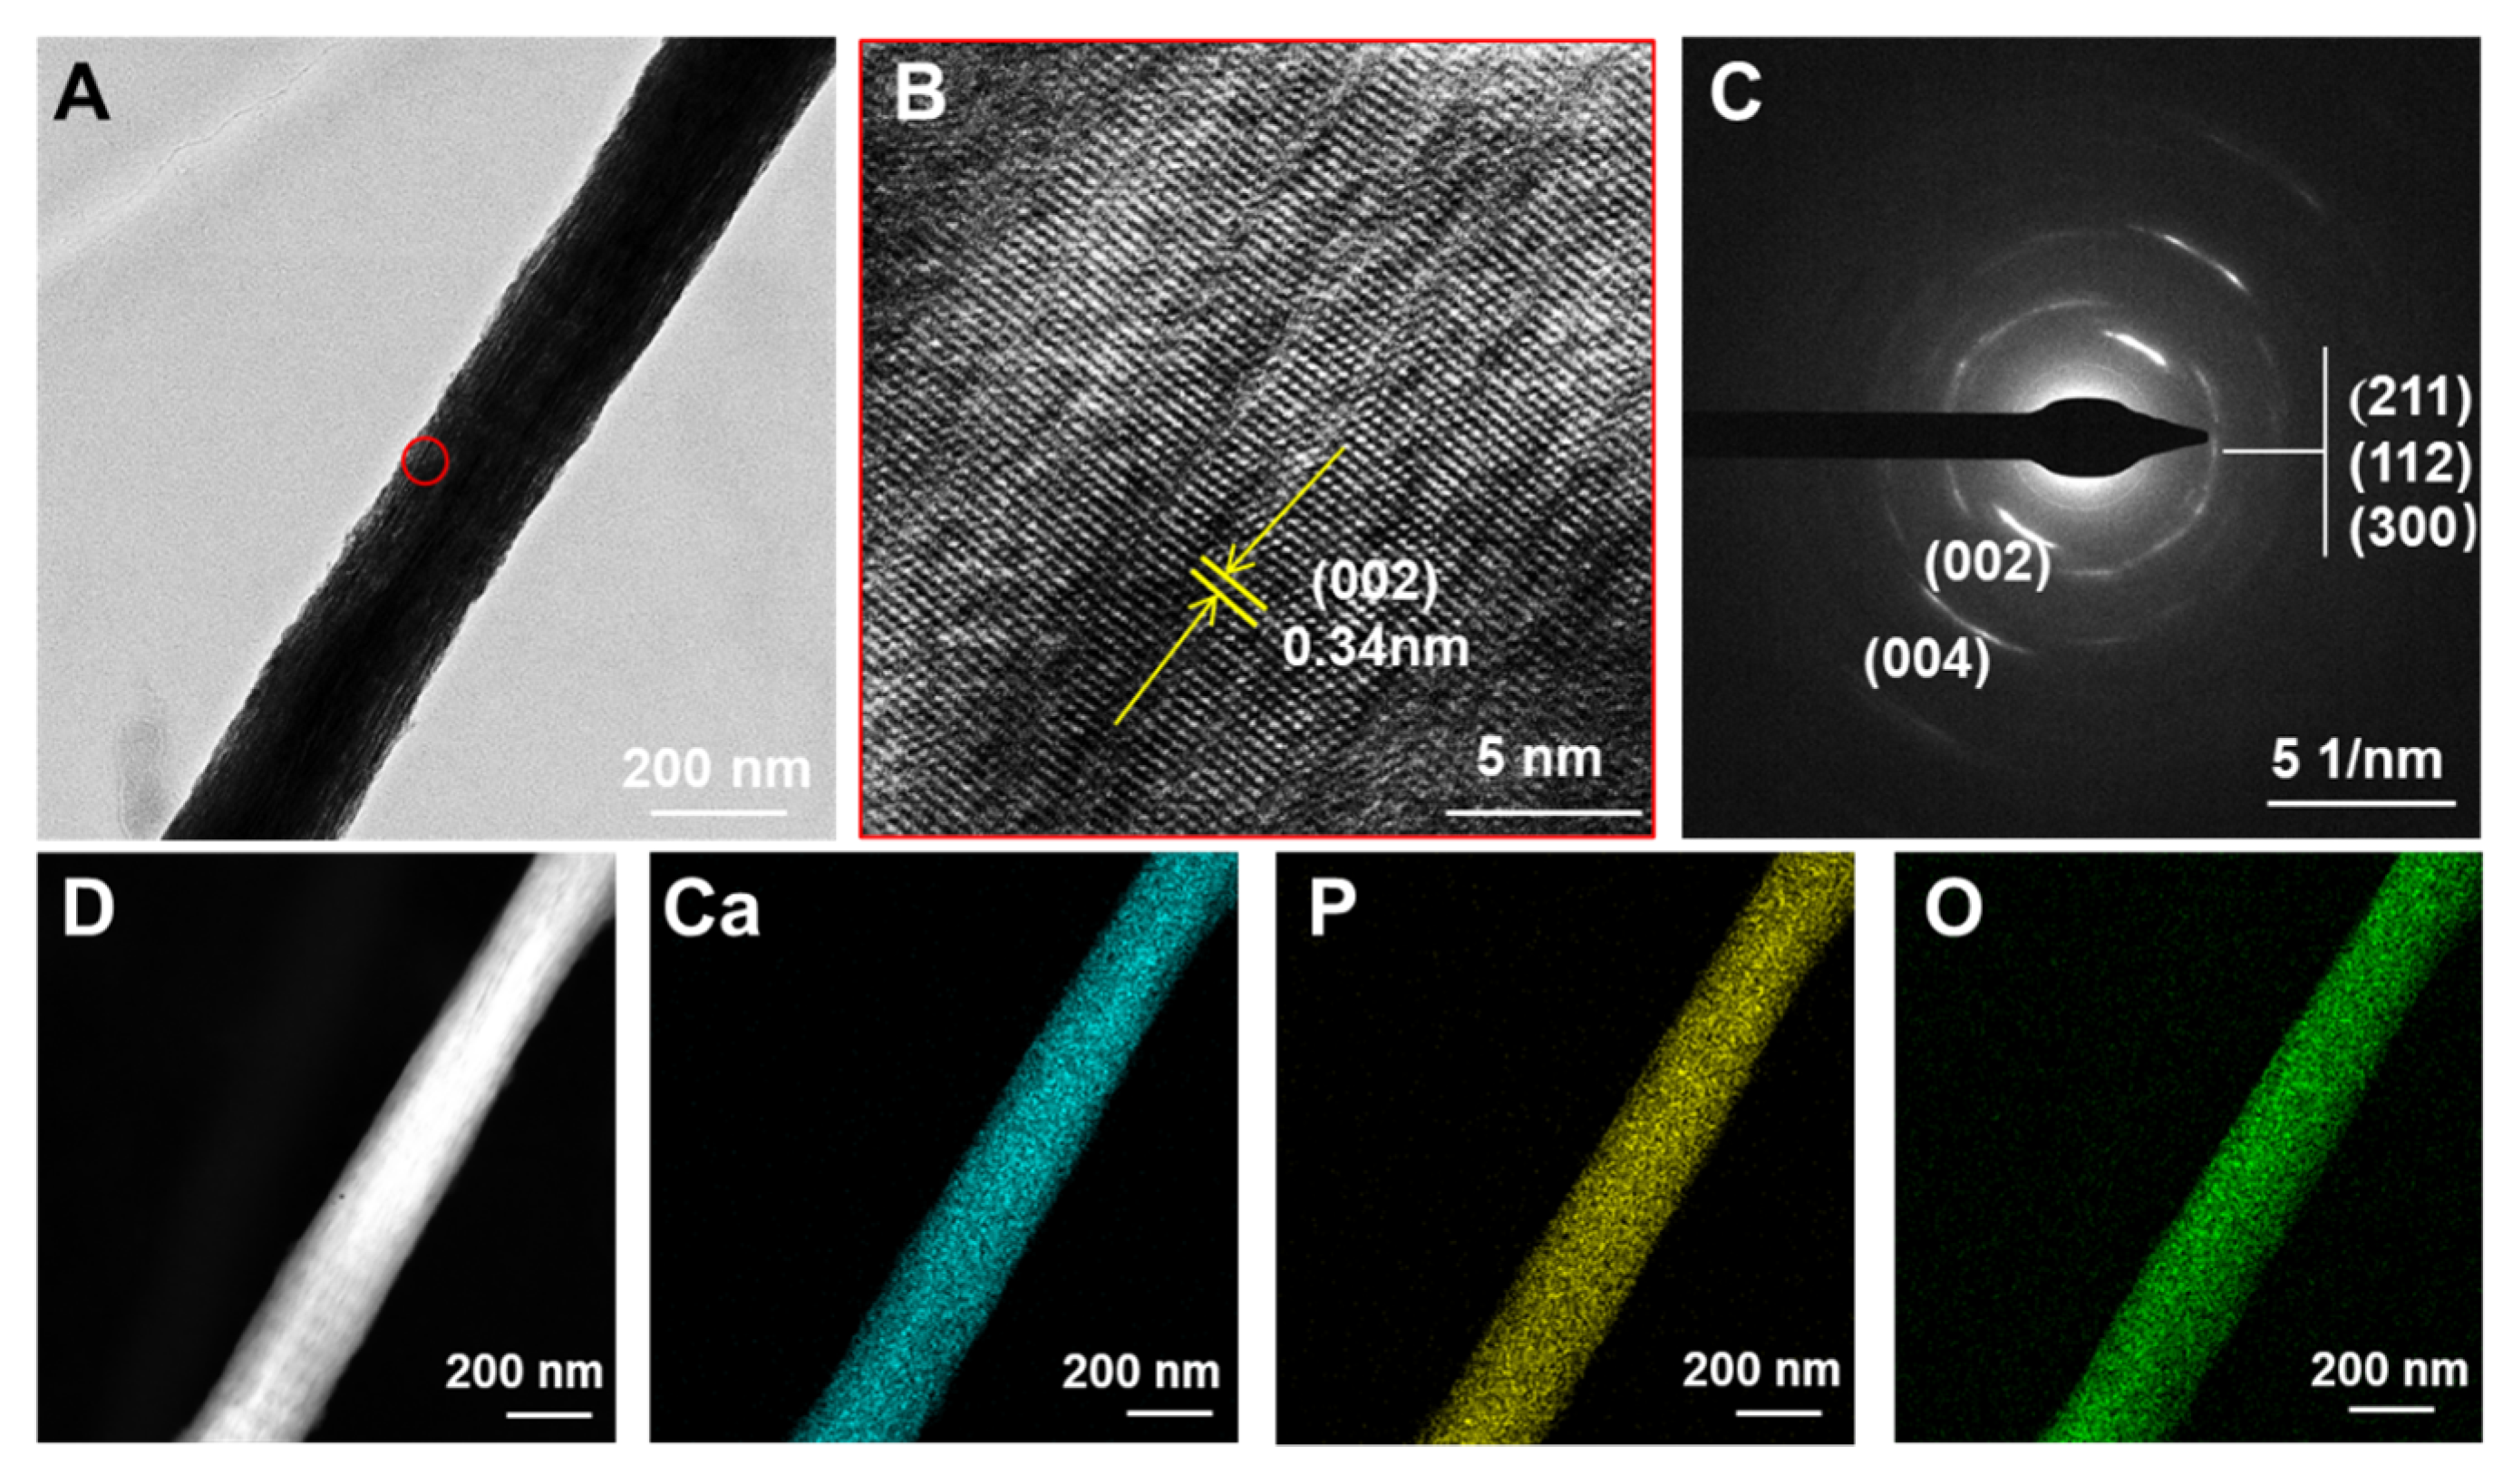
TEM characterization was adopted to investigate the detailed structures and HAP nanocrystal orientation of the fibrils. Figure 2A shows a fibril with intrafibrillar HAP nanocrystals; the fibril was dense and the typical periodic pattern disappeared. The coherent lattice fringes of HRTEM (Figure 2B) indicate the co-oriented arrangement of intrafibrillar HAP nanocrystals. The interplanar distance is 0.34 nm, corresponding to the (002) crystal plane of HAP nanocrystals. The single-crystal-like SAED pattern (Figure 2C) further exhibits the crystalline orientation of intrafibrillar HAP nanocrystals along the longitudinal axis of fibril following the (002) direction, because of the ordered confined spaces within the collagen fibril. Energy dispersive spectroscopy (EDS) mapping (Figure 2D) shows the homogeneous distribution of Ca (blue), P (yellow), and O (green) elements of a mineralized collagen fibril, which proved the HAP nanocrystals were only formed inside collagen and the intrafibrillar growth of HAP nanocrystals was completed.
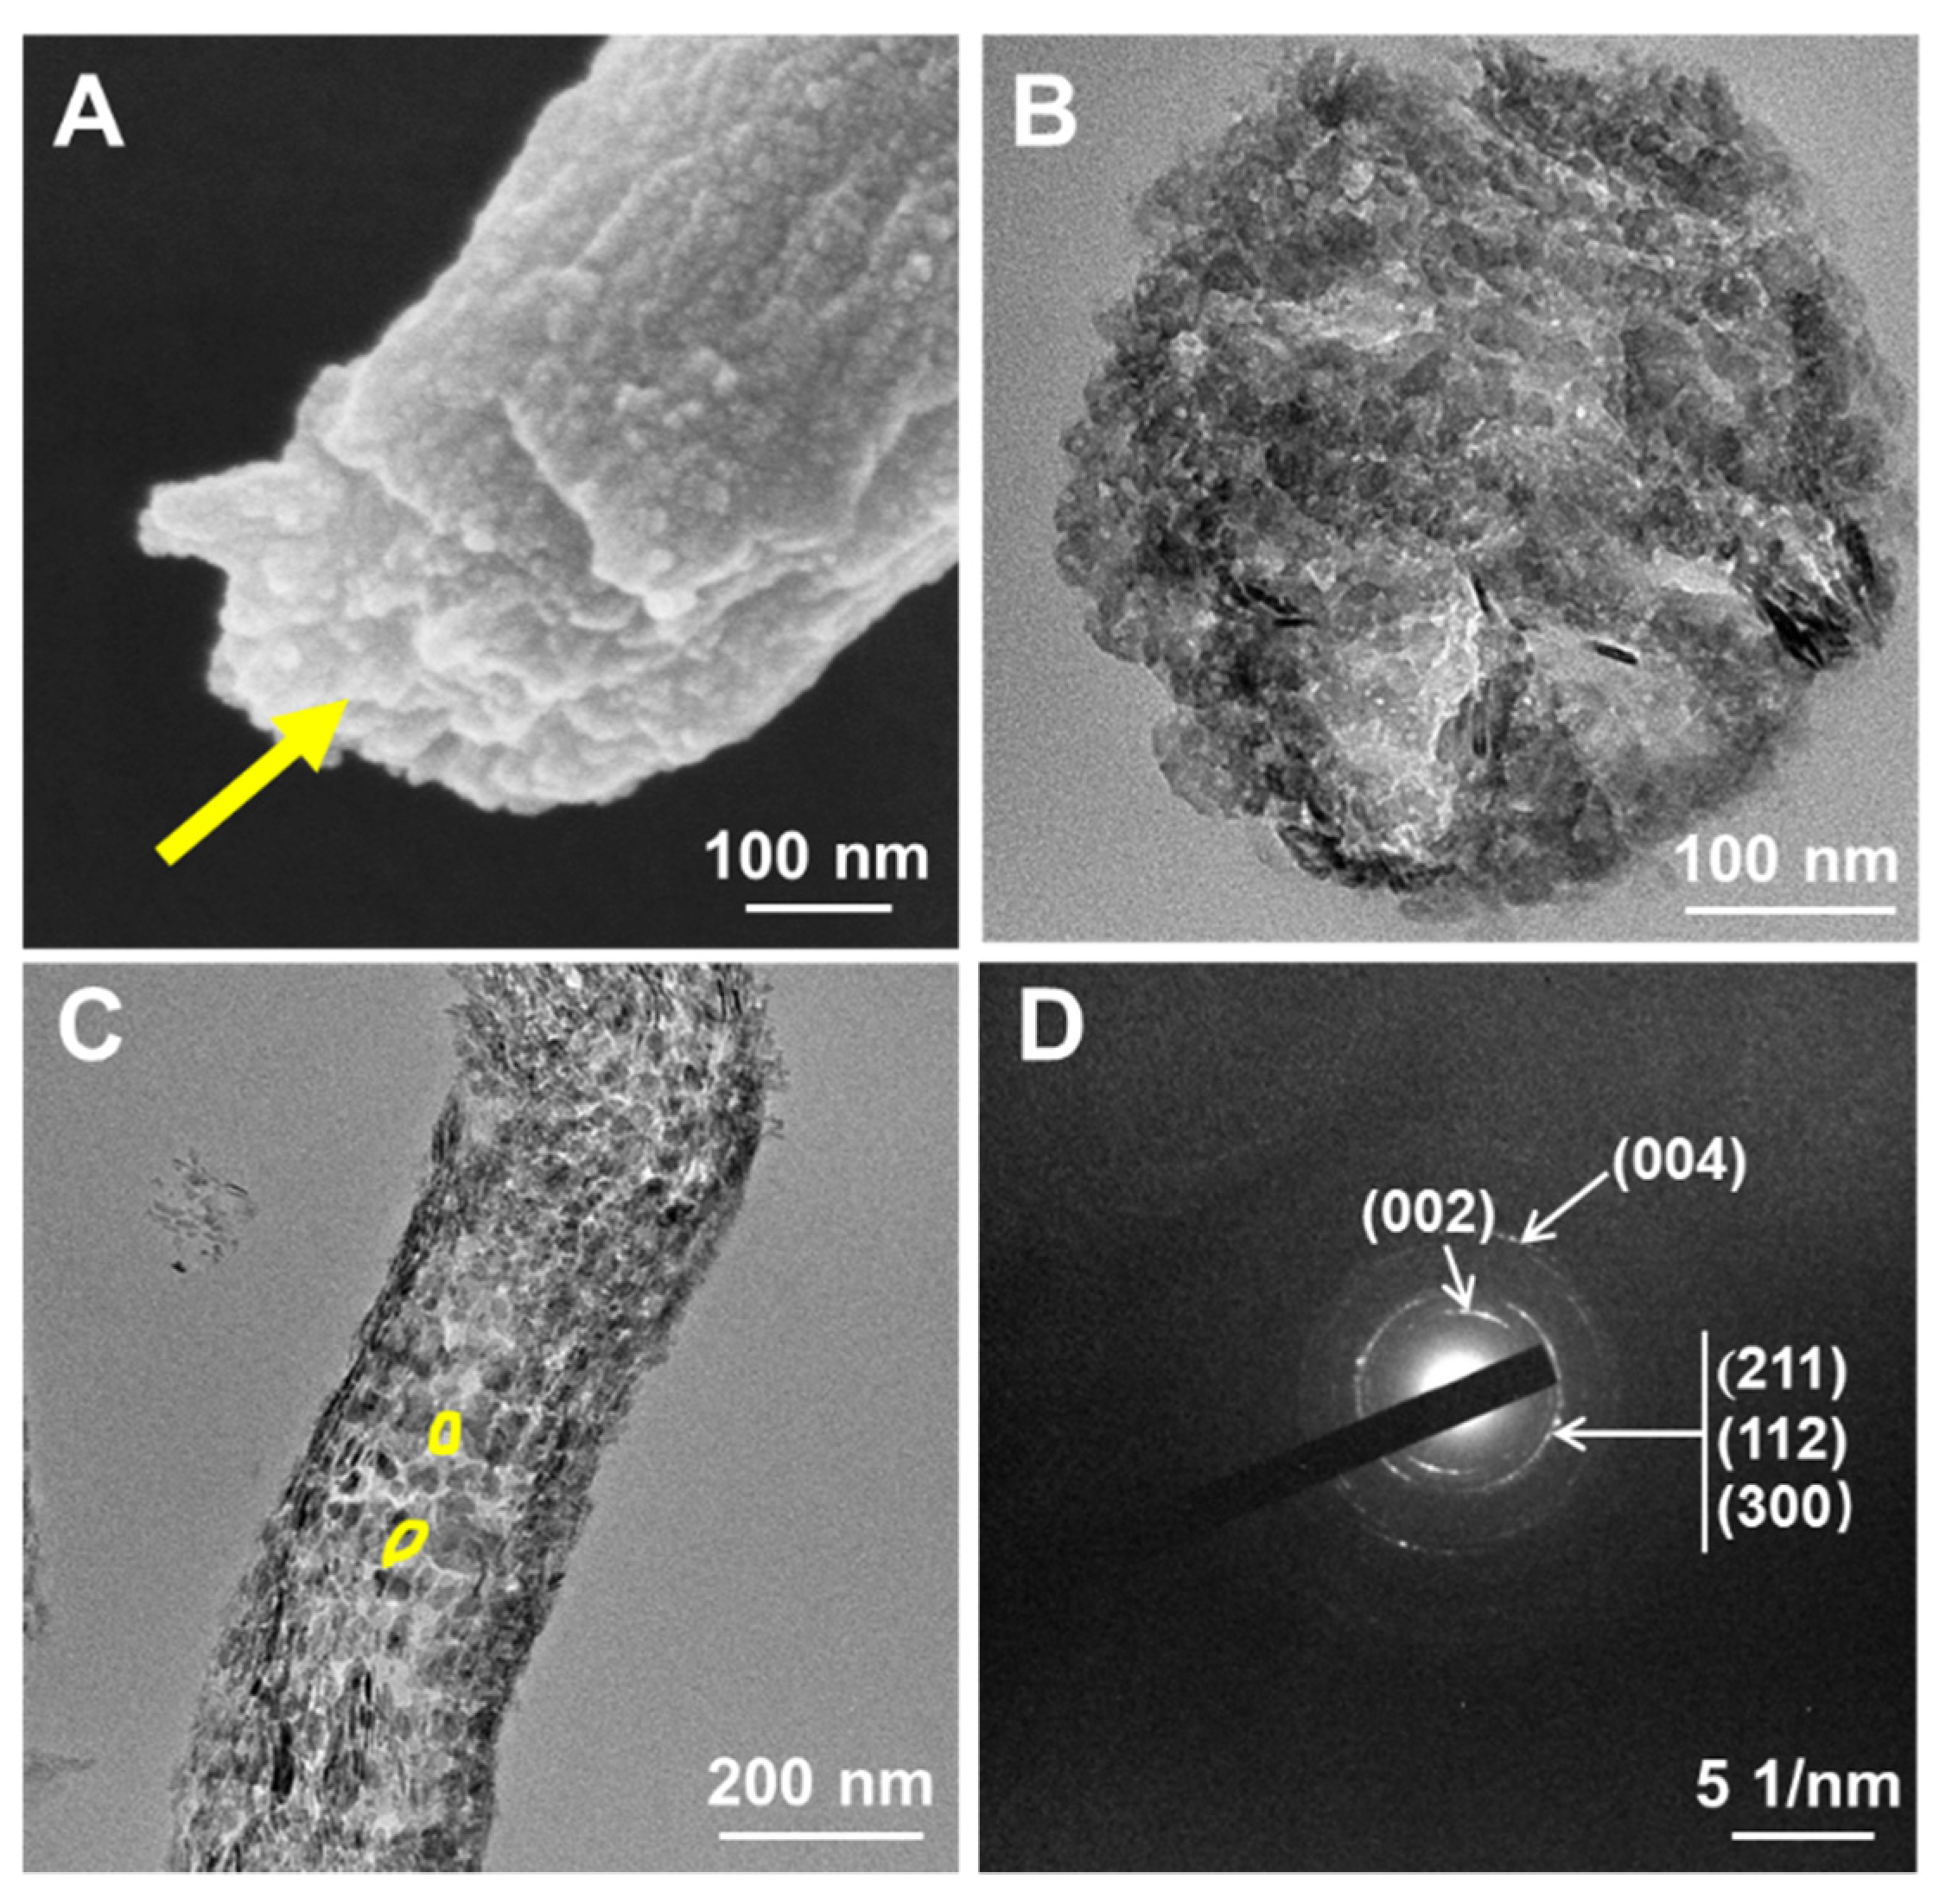
In previous studies, many scientists used SEM to observe the morphology and SAED to analyse the HAP orientation to certify the intrafibrillar mineralization of collagen fibrils. However, these are not direct methods, and in some cases, using these methods to characterize extrafibrillar mineralization might obtain similar results. Therefore, the most direct method for proving the intrafibrillar growth of HAP nanocrystals is to expose the HAP nanocrystals inside collagen fibrils. The SEM image presents the fracture tip of a collagen fibril, which shows that the regularly arranged intrafibrillar HAP nanocrystals were formed inside the collagen fibril (yellow arrow in Figure 3A). The microtome slice was adopted to further reveal the inner structure of collagen fibrils. The longitudinal section of a fibril (Figure 3C) specifically exhibits the densified arrangement of HAP nanocrystals inside the fibril. The morphology of HAP nanocrystals inside a fibril is platelet-like and with 30-50 nm width (marked with yellow circles in Figure 3C), which is analogous to those in bone [21]. The SAED of the HAP nanocrystals in a longitudinal section of mineralized fibrils (Figure 3D) shows that the HAP nanocrystal growth direction is still along the (002) crystal plane because of the confined space of the collagen fibril. The cross-section of a fibril (Figure 3B) further demonstrates the occupation of HAP nanocrystals inside the collagen fibril.
3.2. The Intrafibrillar Growth Process of HAP Nanocrystals
The whole growth process, especially the evolution process of ACP inside fibrils, was captured by TEM.
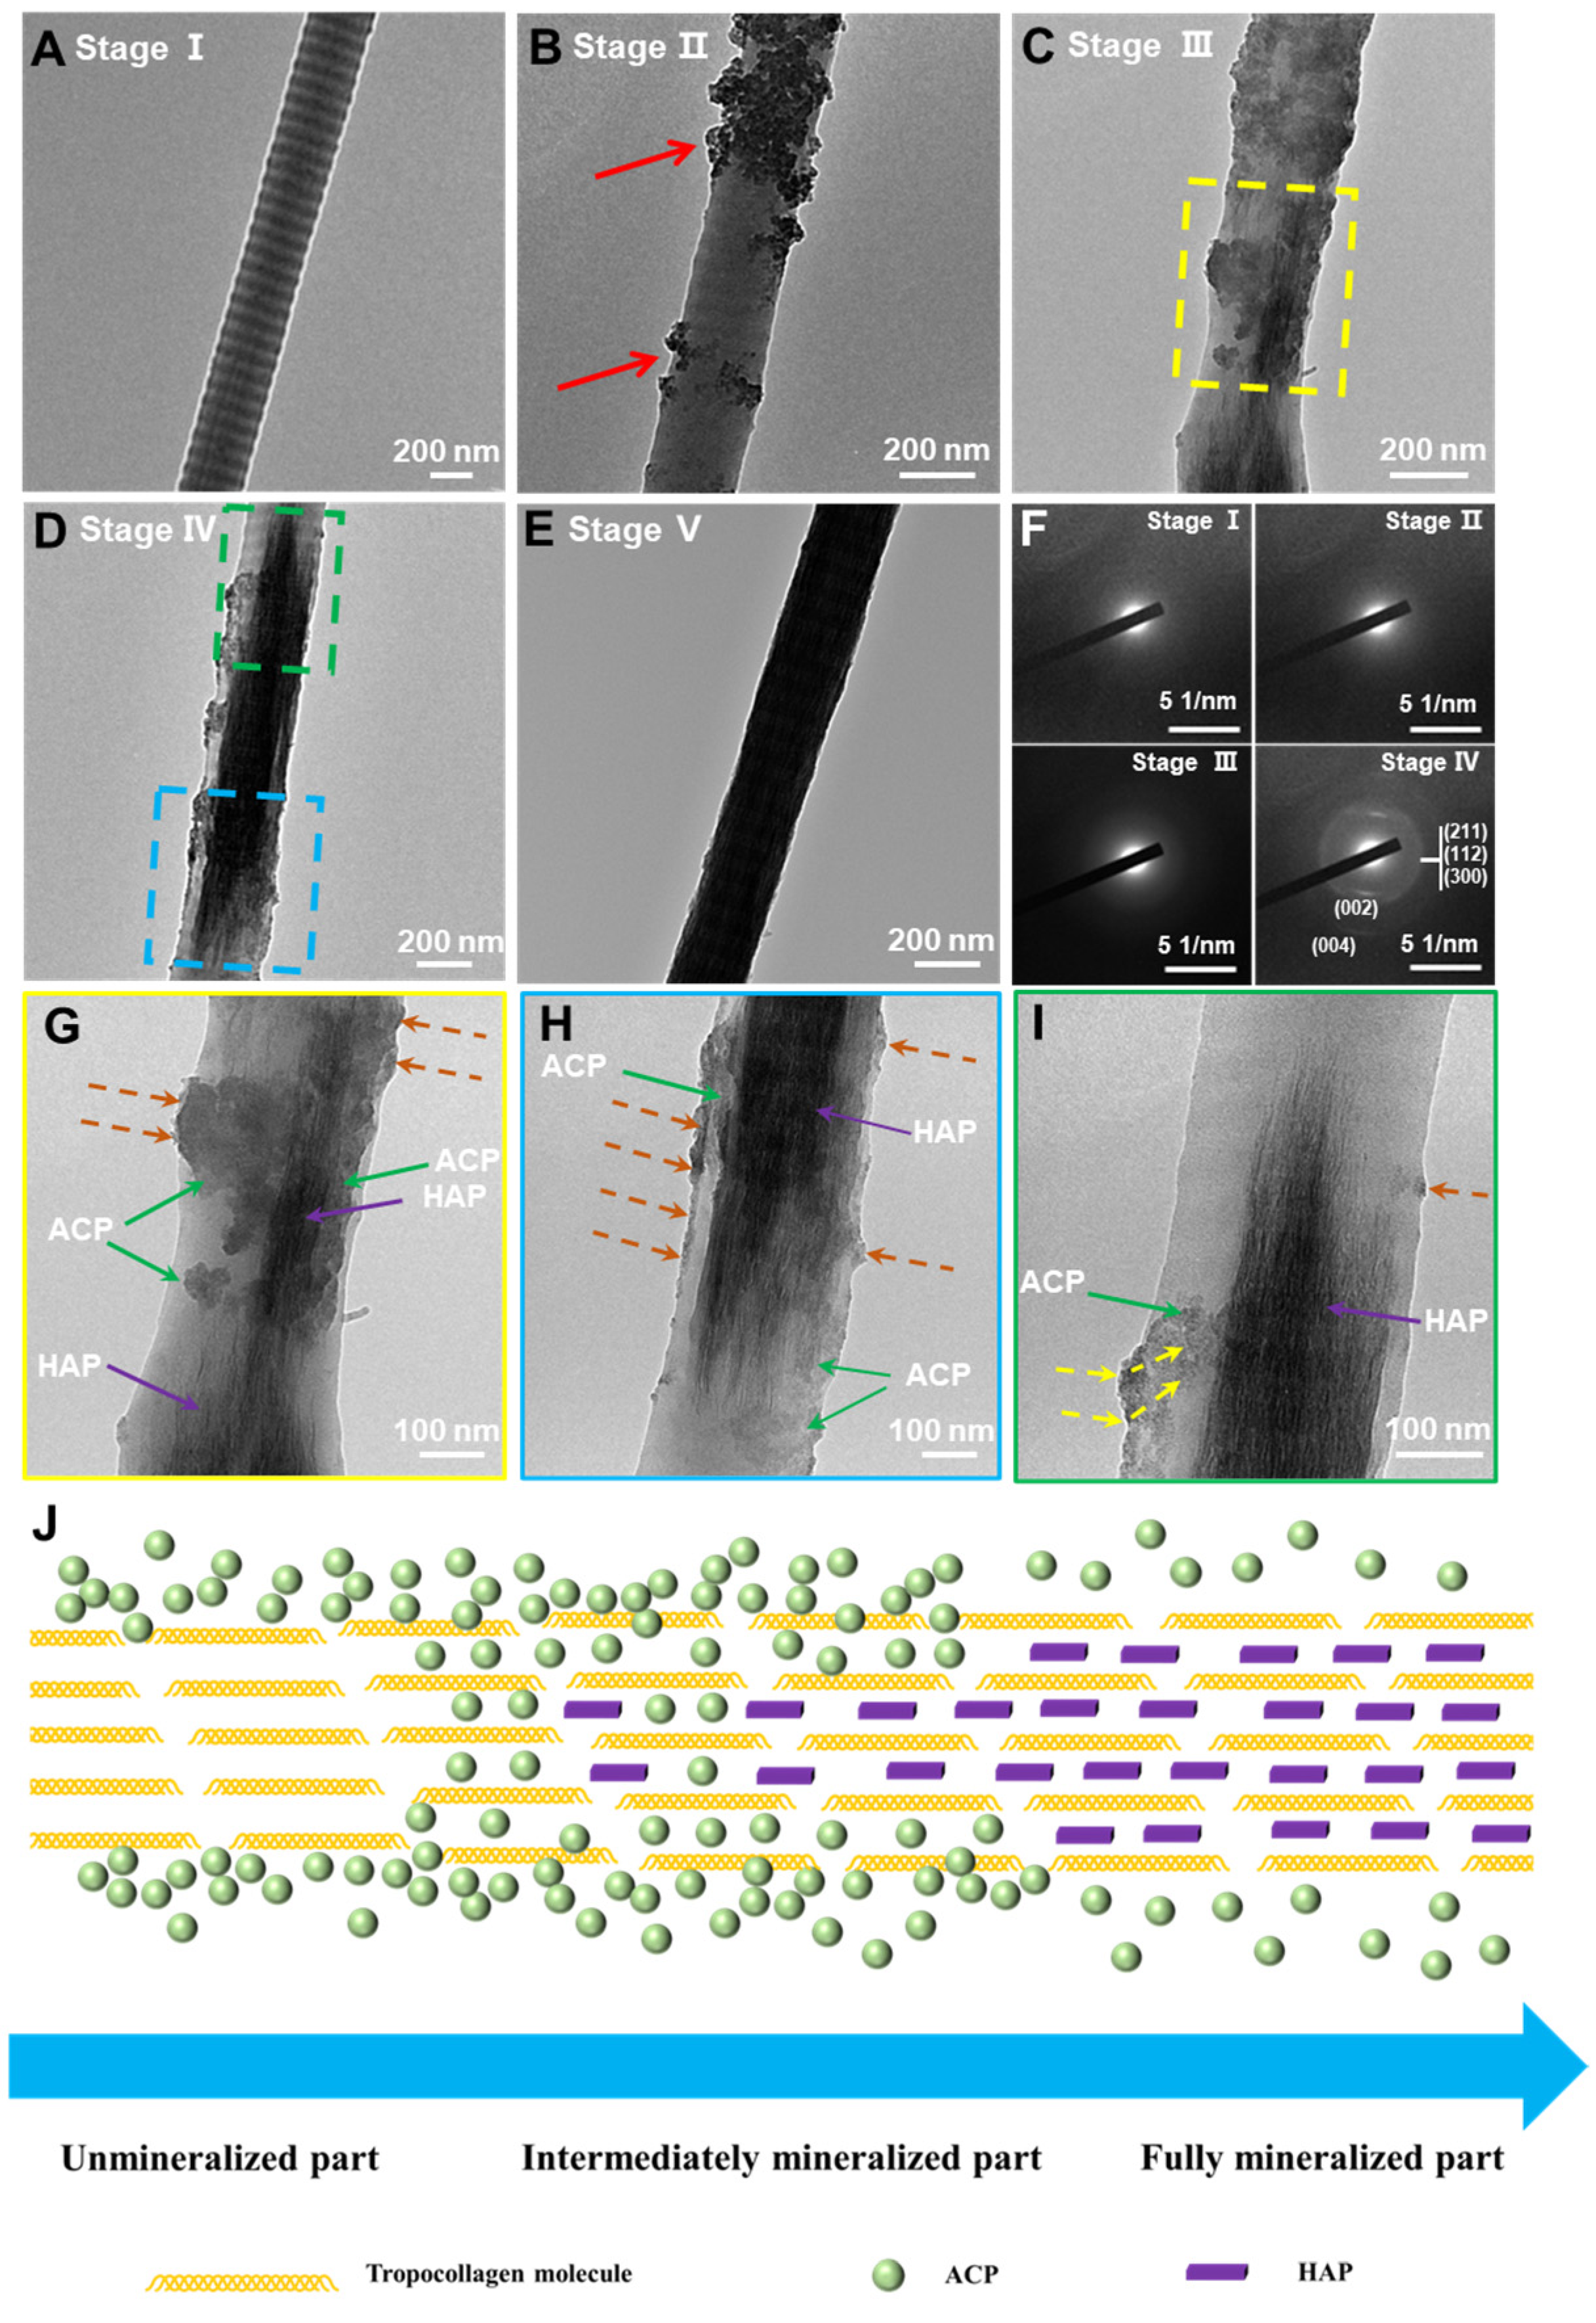
Briefly, the intrafibrillar growth process of HAP nanocrystals can be divided into five stages. In stage I, the collage fibrils are original. Figure 4A exhibits the characteristic periodic bands of 67 nm containing 40 nm gap zones and 27 nm overlap zones in the original fibril. In stage II, many nanoscale aggregates (red arrows) were absorbed on the surface of collagen fibril (Figure 4B). The corresponding SAED pattern in Figure 4F confirms the non-crystalline nature of these aggregates, which indicates these aggregates are amorphous hydroxyapatite (ACP). These ACP aggregates were formed by PAA through the polymer-induced liquid precursor (PILP) process [10,20]. In stage II, ACP aggregates almost existed on the surface of the collagen fibril. No ACP aggregates are observed inside the collagen.
Figure 4C shows the growth process of HAP nanocrystals in fibrils in stage III. The corresponding SAED pattern in Figure 4F exhibits no obvious diffraction spots, which proves most aggregates were still amorphous in stage III. Taking a thorough view of the yellow dotted area in Figure 4C, the high magnification TEM image of this area is shown in Figure 4G. In this area, the ACP aggregates adsorbed on the collagen fibril began to infiltrate into the collagen fibril because of the capillary [4] or Gibbs—Donnan equilibrium effect [17] (orange arrows in Figure 4G), and plenty of ACP aggregates appeared inside the collagen fibril (green arrows in Figure 4G). These ACP aggregates did not crystallize to HAP as soon as they infiltrated into collagen fibrils, but they stayed amorphous inside collagen fibrils for a while. Notably, in the middle area of the collagen fibrils, some HAP was observed (purple arrow in Figure 4G), and the adjacent area was still occupied by ACP aggregates. It is demonstrated that some ACP aggregates inside collagen fibrils gradually transformed into HAP in stage III. When the growth process of HAP nanocrystals in fibrils reached stage IV, most spaces of collagen fibril were occupied with HAP nanocrystals (Figure 4D). The SAED pattern of stage IV in Figure 4F shows that the HAP nanocrystals are co-aligned.
High-magnification TEM images of the green dotted box area and blue dotted box area in Figure 4D are shown in Figure 4H and Figure 4I, respectively. In Figure 4H, most of the space in the middle of the collagen fibril was filled with HAP nanocrystals (purple arrow in Figure 4H). However, a small amount of the remaining space close to the surface of the fibril was occupied with ACP (green arrows in Figure 4H). Some ACP aggregates were still adsorbed on the collagen fibril and prepared to infiltrate into collagen to provide sufficient sources for the growth of HAP nanocrystals (orange arrows in Figure 4H). Figure 4I shows good fluidity of ACP aggregates that spread in the space of fibril, with the direction of ACP infiltration and diffusion indicated by the yellow arrows in Figure 4I. When all the space of collagen fibrils was occupied by HAP, the growth process of HAP in fibrils came to the final stage, V, and the collagen fibril was full of HAP (Figure 4E).
The growth process of HAP nanocrystals in collagen fibrils can be summarized by the schematic diagram in Figure 4J: ACP aggregates stabilized by PAA were first adsorbed on the surface of collagen fibrils. Then, ACP aggregates began to infiltrate into fibrils and filled the space in the collagen fibril. The process of infiltration was continuous until all the space in collagen fibrils was filled with HAP nanocrystals. The ACP aggregates did not crystallize at once after infiltration, but remained amorphous inside collagen for a while, which shows that ACP aggregates possessed good liquidity and spread inside the space of the collagen fibril. The process of transformation from ACP to HAP is sequential, usually beginning at the middle space of the collagen fibril.
3.3. The Intrafibrillar Growth Process of HAP Nanocrystals in Collagen Films
To better investigate the growth of HAP nanocrystals in collagen at multiple scales, we chose to study the growth process of HAP nanocrystals in 2D collagen matrices (collagen films). The collagen films assembled by fibrils were immersed in an HAP growth solution. Optical images and SEM were used to show the morphology of the films with HAP nanocrystals. Figure 5A,B show the tremendous dots that appeared on the partial collagen film. Some dots were independent, and the others were in contact with each other. Taking a close view of these dots, Figure 5C exhibits the SEM image of an isolated dot. The dot is composed of random interweaved fibrils with HAP nanocrystals. On the edge of this area (Figure 5D), the original fibrils were stretched because of the intrafibrillar growth of HAP. Figure 5E,F are the optical image and SEM image of the whole film with HAP nanocrystals, respectively. The optical image shows that the whole collagen film with HAP nanocrystals is compact. The SEM image further certifies the intrafibrillar growth of HAP in films.
Investigating the growth process of HAP nanocrystals in collagen films would provide more information on 2D structure. Therefore, the optical microscope was adopted to monitor the growth process of HAP nanocrystals in collagen films. To investigate the change of the areas of films with HAP nanocrystals over the reaction time, the areas were statistically calculated from the same view. In Figure 6A, the size of areas increased gradually depending on time (orange arrows). New born areas (yellow arrows) were observed when extending the reaction time. Furthermore, as the size of the area increased, they contacted each other, the boundary disappeared, and the larger areas formed (green arrows). Therefore, the growth process of HAP nanocrystals in collagen film can be summarized as small areas growing and combining to form larger areas, finally achieving the growth of HAP nanocrystals in the whole collagen film.
The effect of different conditions of growth solution on 2D mineralization is rarely mentioned. By in situ monitoring of the mineralization process of collagen films in different conditions of growth solutions (PAA 50 μg/mL, pH 7.5, PAA 100 μg/mL pH 8.0, and PAA 100 μg/mL pH 7.5), the sizes of mineralized areas after mineralization for 120 min, 150 min, 180 min, and 210 min were obtained (Figures S2–S4).
Based on the collected data, the size of mineralized areas increased linearly over time (Figure 6B). The relationship between mineralized areas and time can use the linear fitting function, R-R0 = kt, to represent a change of mineralized areas with time, where R is the final radius, and R0 represents the initial radius. The kinetic rate is obtained by linear fitting and represents the growth speed of mineralized areas, and t is the reaction time. The function obtained by linear fitting gives the growth speeds, which are 0.25 ± 0.01 μm min−1 (PAA 50 μg/mL, pH 7.5), 0.19 ± 0.01 μm min−1 (PAA100 μg/mL, pH 8.0) and 0.16 ± 0.01 μm min−1 (PAA 100 μg/mL, pH 7.5), respectively (Figure 6C). Therefore, the mineralized area depends on the concentration of PAA and pH values of the growth solution. Increasing the concentration of PAA will decrease the growth speed, while raising the pH value will accelerate the growth speed.
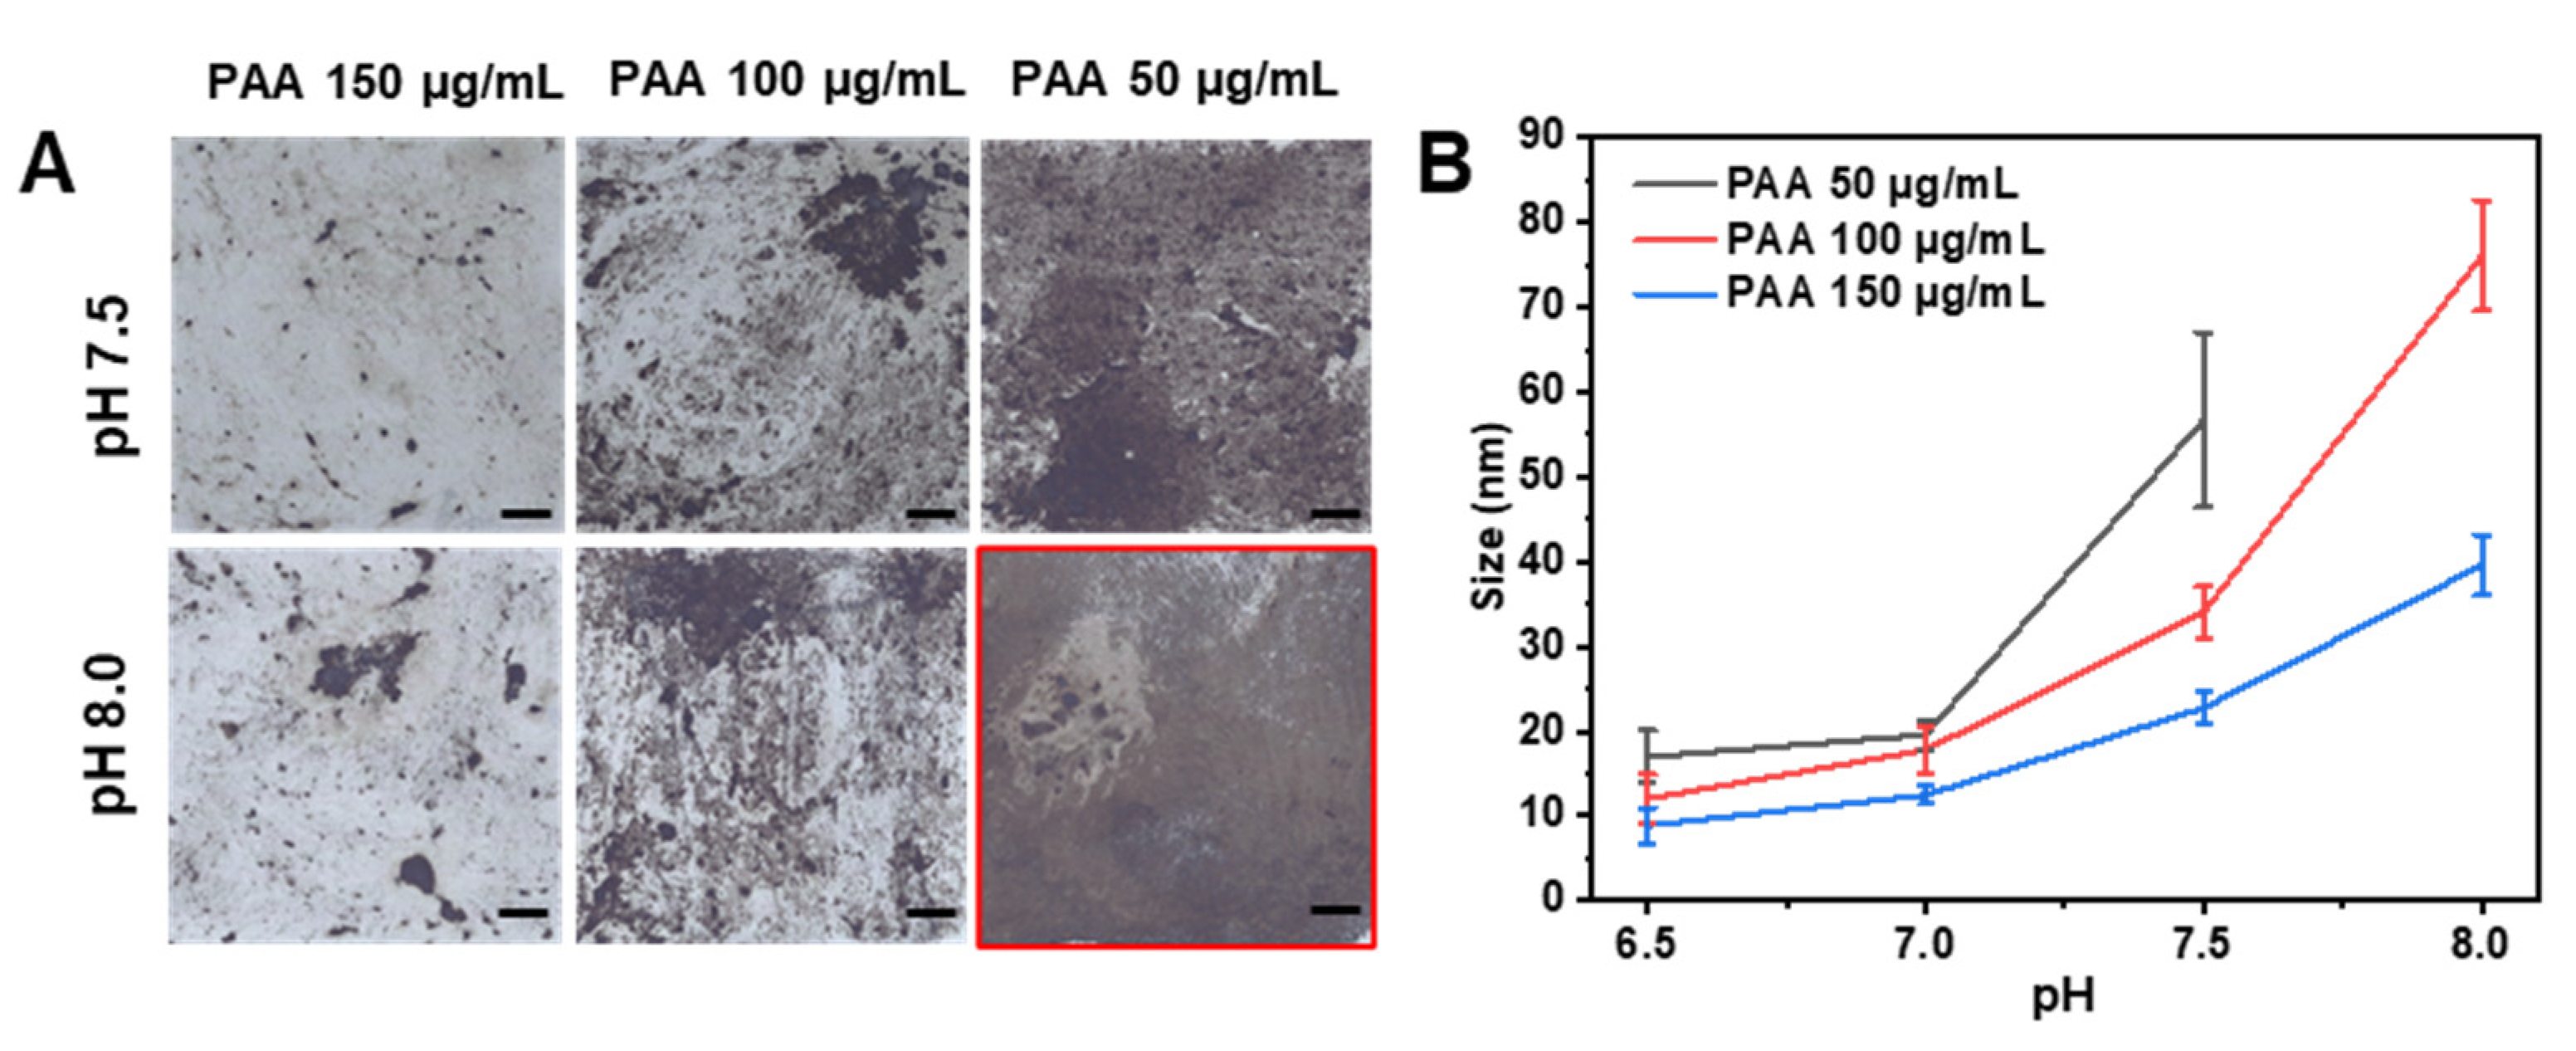
Previous, plenty of works focused on the influence of molecular weight and the concentration of polyelectrolytes on the growth of HAP in collagen matrices [22,23,24]. We found that pH value also dramatically influences the growth rate of HAP in collagen films. In our system, the concentration of PAA was set to 50 μg/mL, 100 μg/mL, and 150 μg/mL, respectively. In each concentration of PAA, four pH values were set to investigate the influence of weak acid growth solution (pH 6.5), neutral growth solution (pH 7.0), and weak basic growth solution (pH 7.5 and pH 8.0) on the growth rate of HAP in collagen films. The reaction time was set at 24 h for a more convenient measurement of the area of collagen films with HAP nanocrystals in different conditions. Figure 7A exhibits the collagen films with different areas in different solution conditions. The sizes of the precursors in different conditions are shown in Figure 7B. Increasing the pH value will rise the average size of the precursor to the same concentration of PAA, while raising the concentration of PAA will reduce the average size at the same pH value. Figure S6 shows that the zeta potential of precursors is all around -20 mV; the growth rate of HAP in films could not be determined by the surface charges of the solution.
Table 1 records the percentage of the area (%) of collagen films with HAP nanocrystals after the 24 h reaction. When intrafibrillar growth of HAP in collagen films was achieved, increasing the concentration of PAA led to the reduction of the area with HAP nanocrystals. That is because the high concentration of PAA leads to the isolated existence of ACP and no preferred aggregation of ACP [25]. In our previous research on the intrafibrillar growth process of HAP, we found that significant aggregation of ACP takes place on the surface of collagen fibrils, which facilitates the infiltration process (Figure 4B). However, when these ACPs become isolated, no preferred aggregation of ACP exists on the surface of collagen fibrils and inhibits the infiltration process. Therefore, an overly high concentration of PAA results in more isolated ACP, which diminishes the growth rate of HAP in collagen films.
For the result that weak acid and neutral growth solution both do not achieve the mineralization of the collagen films regardless of the concentration of PAA, one reasonable explanation for this is that in our system, the ratio value of the concentration of PAA versus calcium and phosphate concentrations is too high. The ACP remains almost isolated in weak acid and neutral mineralizing solutions. Therefore, no preferred aggregation of ACP exists on collagen fibrils, which inhibits the infiltration process of ACP [25]. When keeping the concentration of PAA constant, increasing the pH value will accelerate the rate of growth. That is because raising the pH value of the growth solution will lead to an increase in the size of ACP (Figure 7B), which reduces the content of the isolated ACP and causes more aggregation of ACP on the collagen fibrils. This will contribute to the infiltration process and accelerate the rate of intrafibrillar growth of HAP. However, an overly high pH value will lead to rapid crystallization of HAP and result in a large amount of precipitation in the growth solution, which leads to the extrafibrillar growth of HAP on the surface of collagen films. It is a good explanation for the occurrence of extrafibrillar growth of HAP when the growth solution contains 50 μg/mL PAA and pH is at 8.0 (Figure S7). Hence, the proper pH value can accelerate the mineralization rate. In our system, the growth solution contains 50 μg/mL, and a pH of 7.5 is the best condition which generates the fastest growth of HAP in the collagen film.
4. Conclusions
In summary, we investigated the growth of hydroxyapatite nanocrystals by using polyacrylic acid as a non-collagen analog to carry out the in vitro multi-scale mineralization of 1D collagen fibrils and 2D collagen films. The results by using 1D collagen fibrils as matrices strongly showed the intrafibrillar growth of HAP. TEM characterization showed the co-oriented arrangement of intrafibrillar HAP nanocrystals with an interplanar distance of 0.34 nm and an orientation along the longitudinal axis of the fibril. In addition, the evolution process of HAP nanocrystals in collagen fibrils and detailed information were confirmed by TEM, showing five stages of mineralization: original collagen fibril; ACPs absorb on collagen; ACPs infiltrate collagen fibril and begin to transform into HAP; plenty of HAP is formed inside collagen fibril; collagen fibril with the full growth of HAP nanocrystals. Then, the growth of HAP nanocrystals was extended from collagen fibrils to larger scale collagen films. The small areas of mineralized HAP nanocrystals grew and combined to form larger areas, finally achieving the growth of HAP nanocrystals through the whole film. The change of areas varied linearly with time. In addition, the concentration of PAA and pH value of the solution influenced the growth rate of HAP nanocrystals in collagen films.
Supplementary Materials
The following supporting information can be downloaded at: https://www.mdpi.com/article/10.3390/cryst13040692/s1. Figure S1: The original collagen fibril. Figures S2–S4: Monitoring of areas with HAP of film in the growth solution of different conditions. Figure S5: The collagen films reacted in the solution of different conditions. Figure S6: Zeta potential of precursors in different growth solutions. Figure S7: The extrafibrillar growth of HAP of the films in a growth solution of 50 μg/mL PAA, pH 8. Tables S1–S3: The size (μm) of selected areas of film in Figures S2 and S3, respectively. Table S4: The growth area ratio of each specimen in Figure S5.
Author Contributions
Funding acquisition, Z.F.; Investigation, B.X. and H.P.; Methodology, B.X., Y.L. and H.P.; Project administration, Z.F.; Supervision, Z.F. and K.W.; Writing—original draft, B.X.; Writing—review & editing, K.W. All authors have read and agreed to the published version of the manuscript.
Funding
This work was financially supported by the National Key Research and Development Program of China (2021YFA0715700), the National Natural Science Foundation of China (51832003), the financial support from the State Key Laboratory of Materials Processing and Die & Mould Technology (P2023-007), the Hubei Provincial Nature Science Foundation of China (2022CFB311), and the Fundamental Research Funds for the Central Universities (WUT: 2022IVA091).
Data Availability Statement
The data supporting the findings of this study are available within the article and the supplementary files, or from the corresponding author upon reasonable request.
Acknowledgments
This work was financially supported by the National Key Research and Development Program of China (2021YFA0715700) and the National Natural Science Foundation of China (51832003). Kun Wang appreciates the support of the State Key Laboratory of Materials Processing and Die & Mould Technology (P2023-007), Huazhong University of Science and Technology. Hang Ping also acknowledges support by the Hubei Provincial Nature Science Foundation of China (2022CFB311), by the Fundamental Research Funds for the Central Universities (WUT: 2022IVA091).
Conflicts of Interest
The authors declare no conflict of interest.
References
- Peterlik, H.; Roschger, P.; Klaushofer, K.; Fratzl, P. From brittle to ductile fracture of bone. Nat. Mater. 2006, 5, 52–55. [Google Scholar] [CrossRef]
- Mayer, G. Rigid biological systems as models for synthetic composites. Science 2005, 310, 1144–1147. [Google Scholar] [CrossRef]
- Currey, J.D. Materials science—Hierarchies in biomineral structures. Science 2005, 309, 253–254. [Google Scholar] [CrossRef]
- Olszta, M.J.; Cheng, X.G.; Jee, S.S.; Kumar, R.; Kim, Y.Y.; Kaufman, M.J.; Douglas, E.P.; Gower, L.B. Bone structure and formation: A new perspective. Mater. Sci. Eng. R-Rep. 2007, 58, 77–116. [Google Scholar] [CrossRef]
- Fratzl, P. Collagen: Structure and Mechanics, an Introduction. In Collagen: Structure and Mechanics; Fratzl, P., Ed.; Springer: Boston, MA, USA, 2008; pp. 1–13. [Google Scholar] [CrossRef]
- Monzur, M. Mechanism of Bone Mineralization. Cold Spring Harb. Perspect. Med. 2018, 8, a031229. [Google Scholar]
- Nudelman, F.F.; Pieterse, K.K.; George, A.; Bomans, P.P.; Friedrich, H.H.; Brylka, L.L.; Hilbers, P.P.; Sommerdijk, N.A.N. The role of collagen in bone apatite formation in the presence of hydroxyapatite nucleation inhibitors. Nat. Mater. 2010, 9, 1004–1009. [Google Scholar] [CrossRef]
- Papynov, E.K.; Shichalin, O.O.; Apanasevich, V.I.; Afonin, I.S.; Evdokimov, I.O.; Mayorov, V.Y.; Portnyagin, A.S.; Agafonova, I.G.; Skurikhina, Y.E.; Medkov, M.A. Synthetic CaSiO3 sol-gel powder and SPS ceramic derivatives: “In vivo” toxicity assessment. Prog. Nat. Sci. Mater. Int. 2019, 29, 569–575. [Google Scholar] [CrossRef]
- Papynov, E.K.; Shichalin, O.O.; Apanasevich, V.I.; Portnyagin, A.S.; Yu, M.V.; Yu, B.I.; Merkulov, E.B.; Kaidalova, T.A.; Modin, E.B.; Afonin, I.S.; et al. Sol-gel (template) synthesis of osteoplastic CaSiO3/HAp powder biocomposite: “In vitro” and “in vivo” biocompatibility assessment. Powder Technol. 2020, 367, 762–773. [Google Scholar] [CrossRef]
- Olszta, M.J.; Douglas, E.P.; Gower, L.B. Intrafibrillar mineralization of collagen using a liquid-phase mineral precursor. In Proceedings of the Symposium on Materials Inspired by Biology held at the MRS Spring Meeting, San Francisco, CA, USA, 21–25 April 2003; pp. 127–134. [Google Scholar]
- Deshpande, A.S.; Beniash, E. Bioinspired synthesis of mineralized collagen fibrils. Cryst. Growth Des. 2008, 8, 3084–3090. [Google Scholar] [CrossRef] [PubMed]
- Ping, H.; Xie, H.; Su, B.L.; Cheng, Y.B.; Wang, W.M.; Wang, H.; Wang, Y.C.; Zhang, J.Y.; Zhang, F.; Fu, Z.Y. Organized intrafibrillar mineralization, directed by a rationally designed multi-functional protein. J. Mat. Chem. B 2015, 3, 4496–4502. [Google Scholar] [CrossRef] [PubMed]
- Fang, W.; Ping, H.; Wagermaier, W.; Jin, S.; Amini, S.; Fratzl, P.; Sha, G.; Xia, F.; Wu, J.; Xie, H.; et al. Rapid collagen-directed mineralization of calcium fluoride nanocrystals with periodically patterned nanostructures. Nanoscale 2021, 13, 8293–8303. [Google Scholar] [CrossRef] [PubMed]
- Fang, W.; Ping, H.; Li, X.; Liu, X.; Wan, F.; Tu, B.; Xie, H.; O’Reilly, P.; Wang, H.; Wang, W.; et al. Oriented Strontium Carbonate Nanocrystals within Collagen Films for Flexible Piezoelectric Sensors. Adv. Funct. Mater. 2021, 31, 2105806. [Google Scholar] [CrossRef]
- Cölfen, H. A crystal-clear view. Nat. Mater. 2010, 9, 960–961. [Google Scholar] [CrossRef]
- Dey, A.; Bomans, P.H.H.; Muller, F.A.; Will, J.; Frederik, P.M.; de With, G.; Sommerdijk, N. The role of prenucleation clusters in surface-induced calcium phosphate crystallization. Nat. Mater. 2010, 9, 1010–1014. [Google Scholar] [CrossRef]
- Niu, L.-n.; Jee, S.E.; Jiao, K.; Tonggu, L.; Li, M.; Wang, L.; Yang, Y.-d.; Bian, J.-h.; Breschi, L.; Jang, S.S.; et al. Collagen intrafibrillar mineralization as a result of the balance between osmotic equilibrium and electroneutrality. Nat. Mater. 2017, 16, 370–378. [Google Scholar] [CrossRef]
- Price, P.A.; Toroian, D.; Lim, J.E. Mineralization by Inhibitor Exclusion the Calcification of Collagen with Fetuin. J. Biol. Chem. 2009, 284, 17092–17101. [Google Scholar] [CrossRef]
- Yao, S.S.; Lin, X.F.; Xu, Y.F.; Chen, Y.W.; Qiu, P.C.; Shao, C.Y.; Jin, B.; Mu, Z.; Sommerdijk, N.; Tang, R.K. Osteoporotic Bone Recovery by a Highly Bone-Inductive Calcium Phosphate Polymer-Induced Liquid-Precursor. Adv. Sci. 2019, 6, 10. [Google Scholar] [CrossRef] [PubMed]
- Olszta, M.J.; Douglas, E.P.; Gower, L.B. Scanning electron microscopic analysis of the mineralization of type I collagen via a polymer-induced liquid-precursor (PILP) process. Calcif. Tissue Int. 2003, 72, 583–591. [Google Scholar] [CrossRef] [PubMed]
- Weiner, S.; Price, P.A. Disaggregation of bone into crystals. Calcif. Tissue Int. 1986, 39, 365–375. [Google Scholar] [CrossRef]
- Nudelman, F.; Bomans, P.H.H.; George, A.; de With, G.; Sommerdijk, N. The role of the amorphous phase on the biomimetic mineralization of collagen. Faraday Discuss. 2012, 159, 357–370. [Google Scholar] [CrossRef]
- Qi, Y.P.; Ye, Z.; Fok, A.; Holmes, B.N.; Espanol, M.; Ginebra, M.P.; Aparicio, C. Effects of Molecular Weight and Concentration of Poly(Acrylic Acid) on Biomimetic Mineralization of Collagen. ACS Biomater. Sci. Eng. 2018, 4, 2758–2766. [Google Scholar] [CrossRef] [PubMed]
- Wang, R.X.; Guo, J.X.; Lin, X.X.; Chen, S.P.; Mai, S. Influence of molecular weight and concentration of carboxymethyl chitosan on biomimetic mineralization of collagen. RSC Adv. 2020, 10, 12970–12981. [Google Scholar] [CrossRef] [PubMed]
- Wang, J.M.; Chen, Y.; Li, L.; Sun, J.; Gu, X.H.; Xu, X.R.; Pan, H.H.; Tang, R.K. Remineralization of dentin collagen by meta-stabilized amorphous calcium phosphate. Crystengcomm 2013, 15, 6151–6158. [Google Scholar] [CrossRef]
Figure 1.
Morphology and composition of the collagen fibrils with intrafibrillar HAP nanocrystals. (A) Low magnification SEM image of fibrils. (B) High magnification SEM image of a fibril. (C) The extrafibrillar HAP on the surface of collagen fibrils. (D) XRD of the fibrils. (E) Raman spectrum of the fibrils.

Figure 2.
HAP nanocrystal orientation and composition of a single collagen fibril with intrafibrillar HAP nanocrystals: (A) TEM of the fibril. (B) HRTEM of the red area in (A). (C) SAED of the fibril, and (D) EDS mapping of the fibril.
Figure 2.
HAP nanocrystal orientation and composition of a single collagen fibril with intrafibrillar HAP nanocrystals: (A) TEM of the fibril. (B) HRTEM of the red area in (A). (C) SAED of the fibril, and (D) EDS mapping of the fibril.

Figure 3.
Internal characterization of the collagen fibril with intrafibrillar HAP nanocrystals: (A) SEM image of fracture of the fibril (HAP nanocrystals were marked with the yellow arrow). (B) TEM image of cross-section of the fibril. (C) TEM image of longitudinal section of the fibril (HAP nanocrystals were marked with yellow circles), and (D) SAED image of longitudinal section of the collagen fibril.

Figure 4.
The process of intrafibrillar growth of HAP nanocrystals. (A–E) Five stages (I–V) of the growth of HAP nanocrystals in a collagen fibril (A) Stage I: Original collagen fibril. (B) Stage II: ACPs (marked with red arrows) absorb on collagen. (C) Stage III: ACPs infiltrate the collagen fibril and begin to transform into HAP. (D) Stage IV: Plenty of HAP is formed inside the collagen fibril. (E) Stage V: The collagen fibril with the full growth of HAP nanocrystals. (F) SAED patterns of stages I–IV. (G) High-magnification image of the yellow dotted box in (B). (H,I) High-magnification images of green dotted box area and blue dotted box area in (D), respectively. The orange arrows in (G,H,I) indicates the ACPs on the surface of collagen fibrils (J) Schematic diagram of the process of growth of HAP nanocrystals in fibrils.

Figure 5.
Partially and fully growth collagen films. (A) Optical image of partially growth collagen film. (B) SEM image of the partially growth collagen film. (C) SEM image of an isolated growth area. (D) SEM image of the edge of the isolated area. (E) Optical image of the full growth film. (F) SEM image of the full growth collagen film.

Figure 6.
The growth process of HAP nanocrystals in collagen films. (A) In situ monitoring of the growth process of HAP nanocrystals in collagen films in the growth solution (PAA 50 μg/mL pH 7.5). Images were taken at 120 min, 150 min, 180 min, and 210 min, respectively, from left to right (scale bar, 20 μm). (B) Size of areas over reaction time in different conditions of growth solution. (C) The growth speed of areas in different conditions of growth solution.

Figure 7.
Collagen films in different conditions of growth solution. (A) Collagen films with HAP nanocrystals in different conditions of the solution, and the species of extrafibrillar growth of HAP is marked with red dox (scale bar, 2 mm). (B) Sizes of precursors in different conditions when the solution is in the condition of PAA 50 μg/mL, pH 8.0. The precipitate of HAP will form rapidly and size data cannot be obtained.


Table 1.
The percentage of the area (%) with intrafibrillar HAP nanocrystals of collagen films in different conditions. “EX-growth” means the extrafibrillar growth of HAP.
Table 1.
The percentage of the area (%) with intrafibrillar HAP nanocrystals of collagen films in different conditions. “EX-growth” means the extrafibrillar growth of HAP.
| pH Value | PAA | ||
|---|---|---|---|
| 50 μg/mL | 100 μg/mL | 150 μg/mL | |
| 6.5 | No growth | No growth | No growth |
| 7.0 | No growth | No growth | No growth |
| 7.5 | 77.5 ± 4.3% | 30.6 ± 7.7% | 7.3 ± 1.2% |
| 8.0 | EX-growth | 51.8 ± 6.7% | 13.3 ± 2.6% |
Disclaimer/Publisher’s Note: The statements, opinions and data contained in all publications are solely those of the individual author(s) and contributor(s) and not of MDPI and/or the editor(s). MDPI and/or the editor(s) disclaim responsibility for any injury to people or property resulting from any ideas, methods, instructions or products referred to in the content. |
© 2023 by the authors. Licensee MDPI, Basel, Switzerland. This article is an open access article distributed under the terms and conditions of the Creative Commons Attribution (CC BY) license (https://creativecommons.org/licenses/by/4.0/).
Share and Cite
MDPI and ACS Style
Xue, B.; Li, Y.; Fu, Z.; Ping, H.; Wang, K. Intrafibrillar Growth of Hydroxyapatite Nanocrystals in Multiscale Collagen. Crystals 2023, 13, 692. https://doi.org/10.3390/cryst13040692
AMA Style
Xue B, Li Y, Fu Z, Ping H, Wang K. Intrafibrillar Growth of Hydroxyapatite Nanocrystals in Multiscale Collagen. Crystals. 2023; 13(4):692. https://doi.org/10.3390/cryst13040692
Chicago/Turabian StyleXue, Bingyu, Yidi Li, Zhengyi Fu, Hang Ping, and Kun Wang. 2023. "Intrafibrillar Growth of Hydroxyapatite Nanocrystals in Multiscale Collagen" Crystals 13, no. 4: 692. https://doi.org/10.3390/cryst13040692
Note that from the first issue of 2016, this journal uses article numbers instead of page numbers. See further details here.