
Crystallographic and TEM Features of a TBC/Ti2AlC MAX Phase Interface after 1300 °C Burner Rig Oxidation

Abstract
:1. Introduction
2. Materials and Methods
3. Results
3.1. FIB I) YSZ-Coated, Front Side
3.1.1. Overview
3.1.2. Microstructures
3.2. FIB II) Uncoated, Backside
3.2.1. Overview
3.2.2. Microstructures, FIB II—Back
4. Discussion
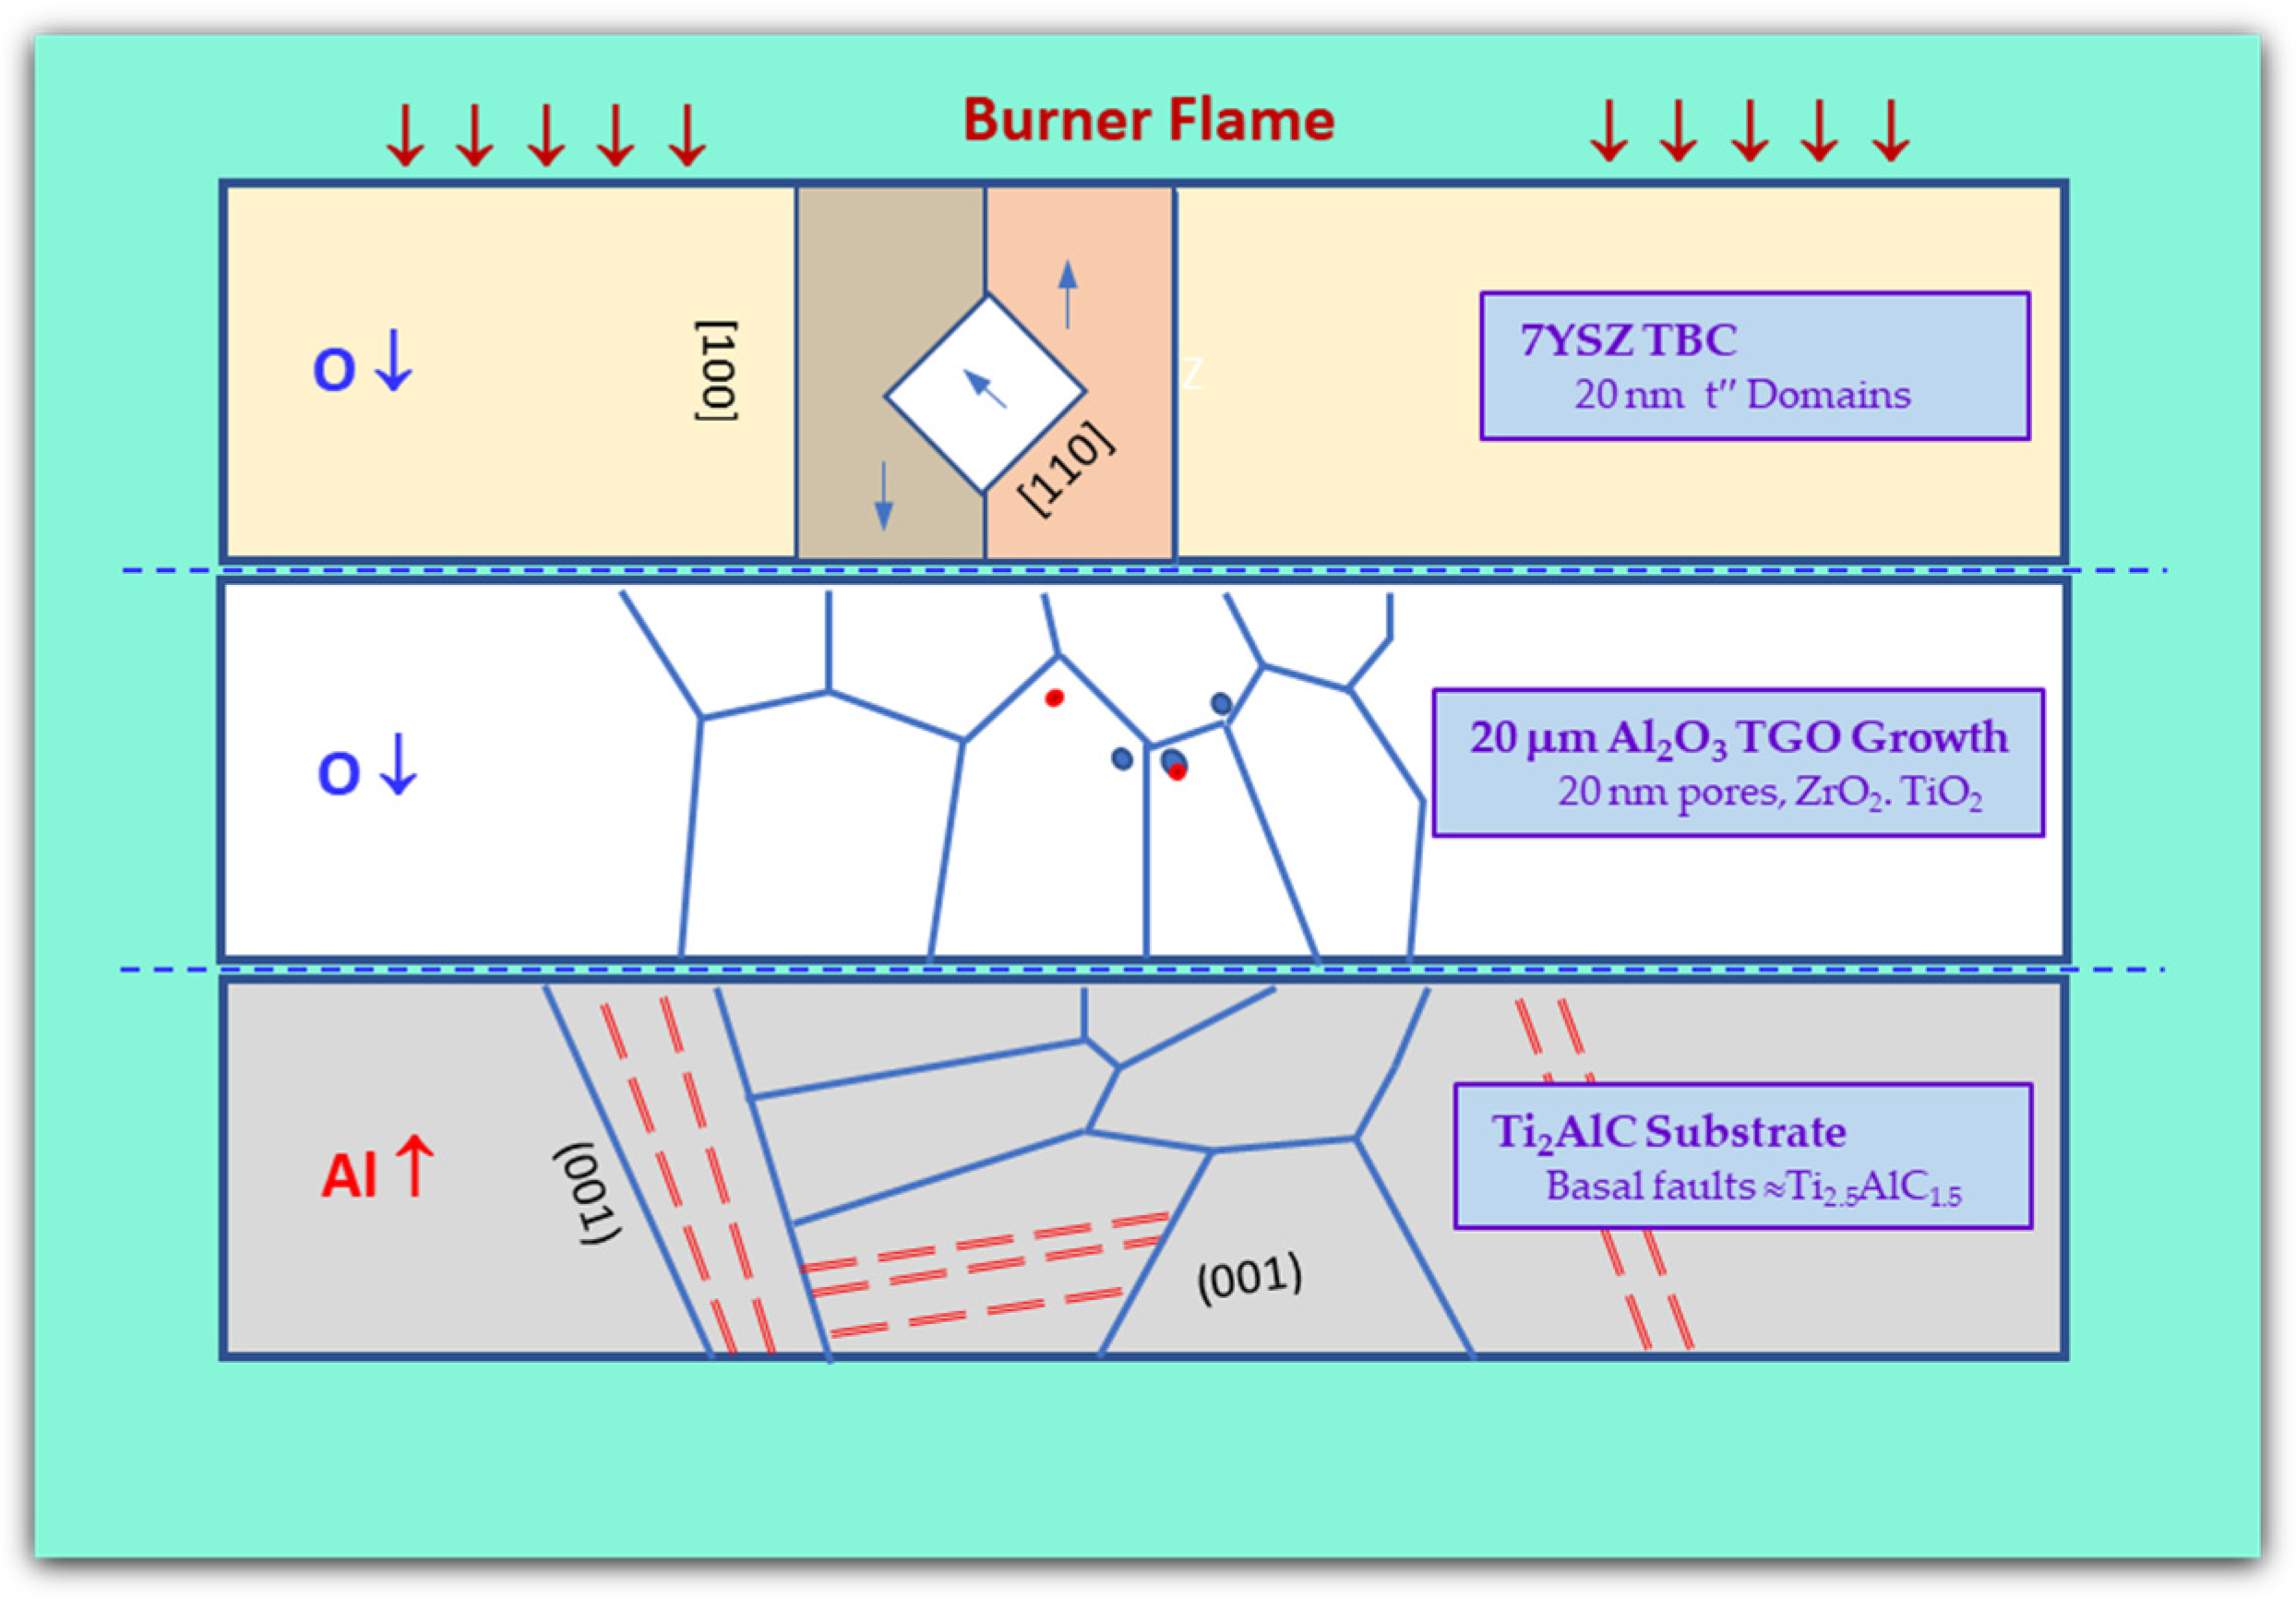
4.1. PS-PVD YSZ TBC
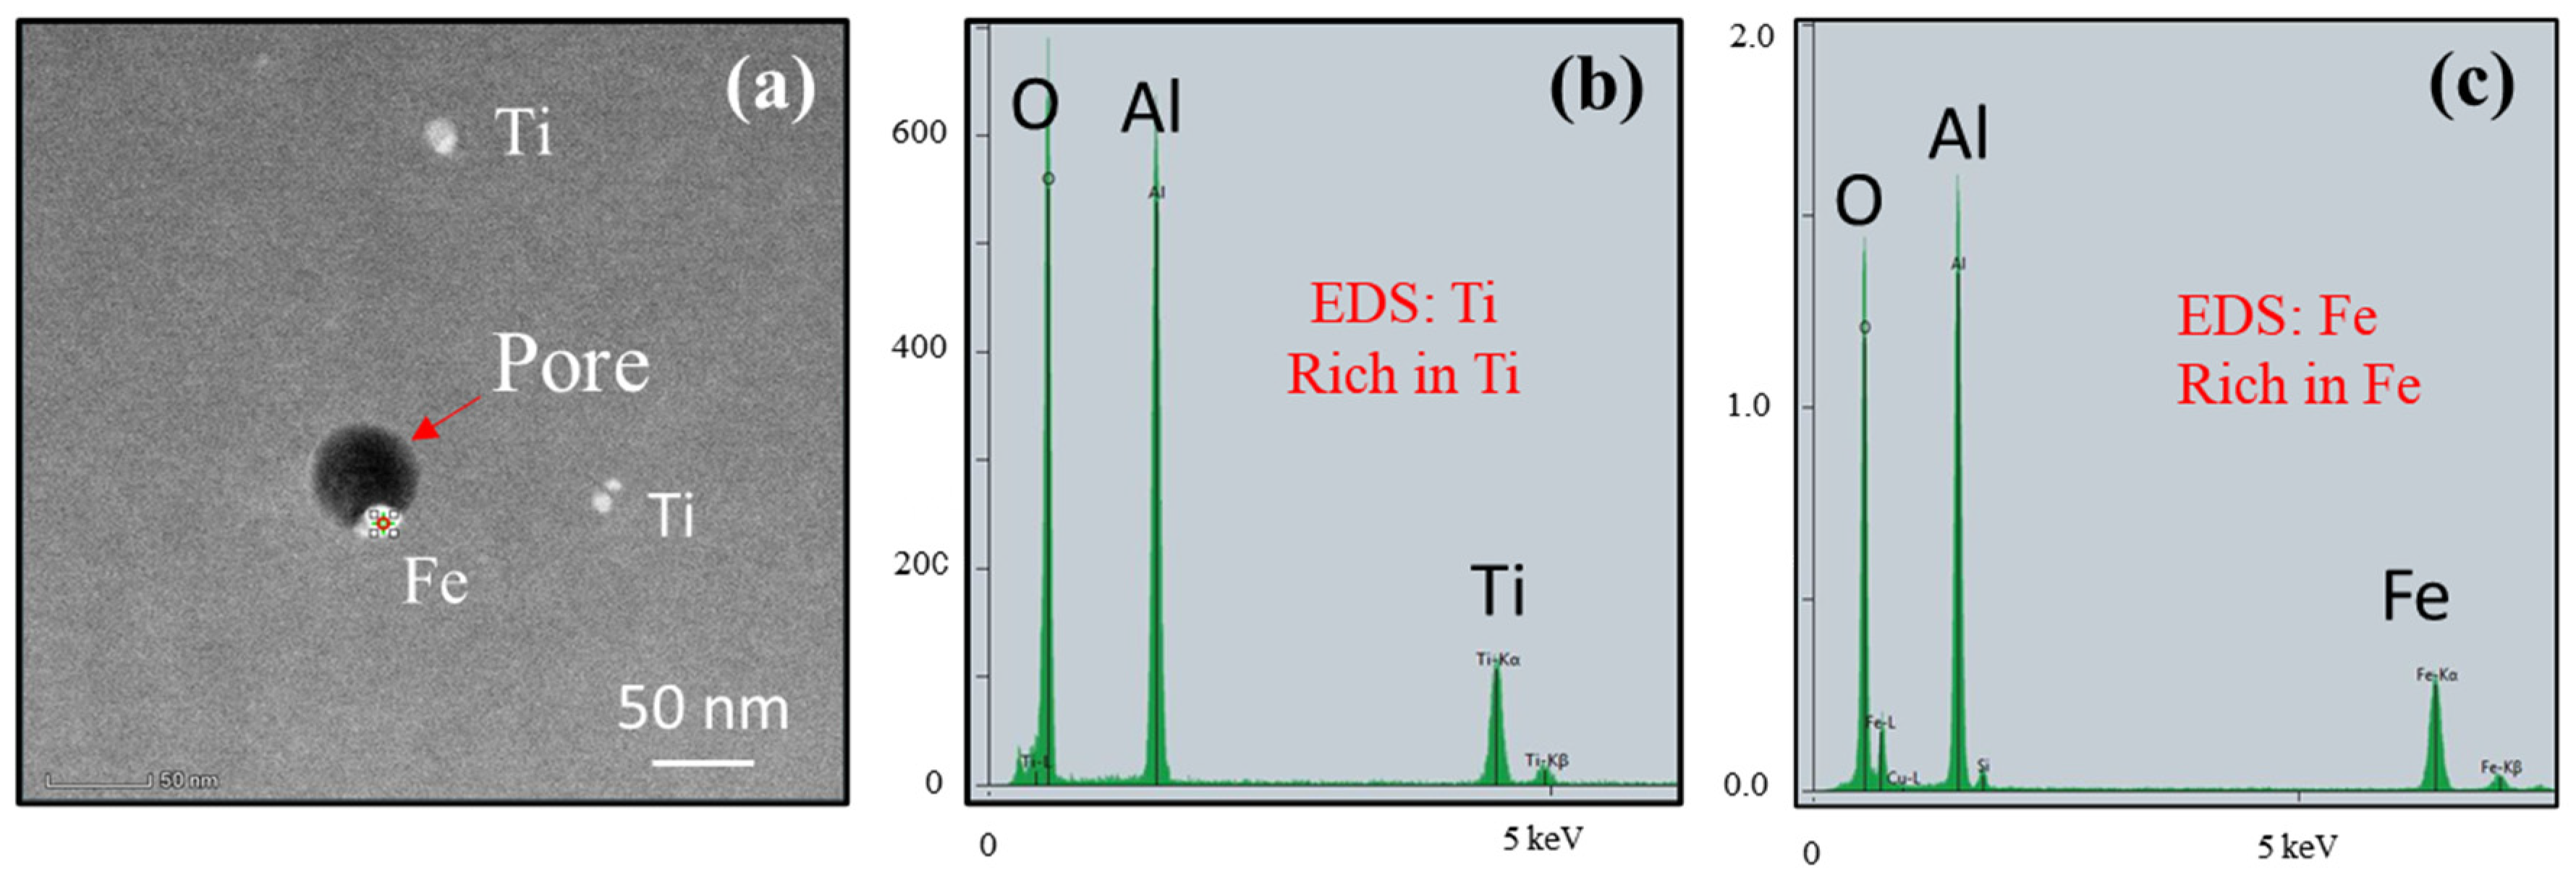
4.2. Al2O3 TGO
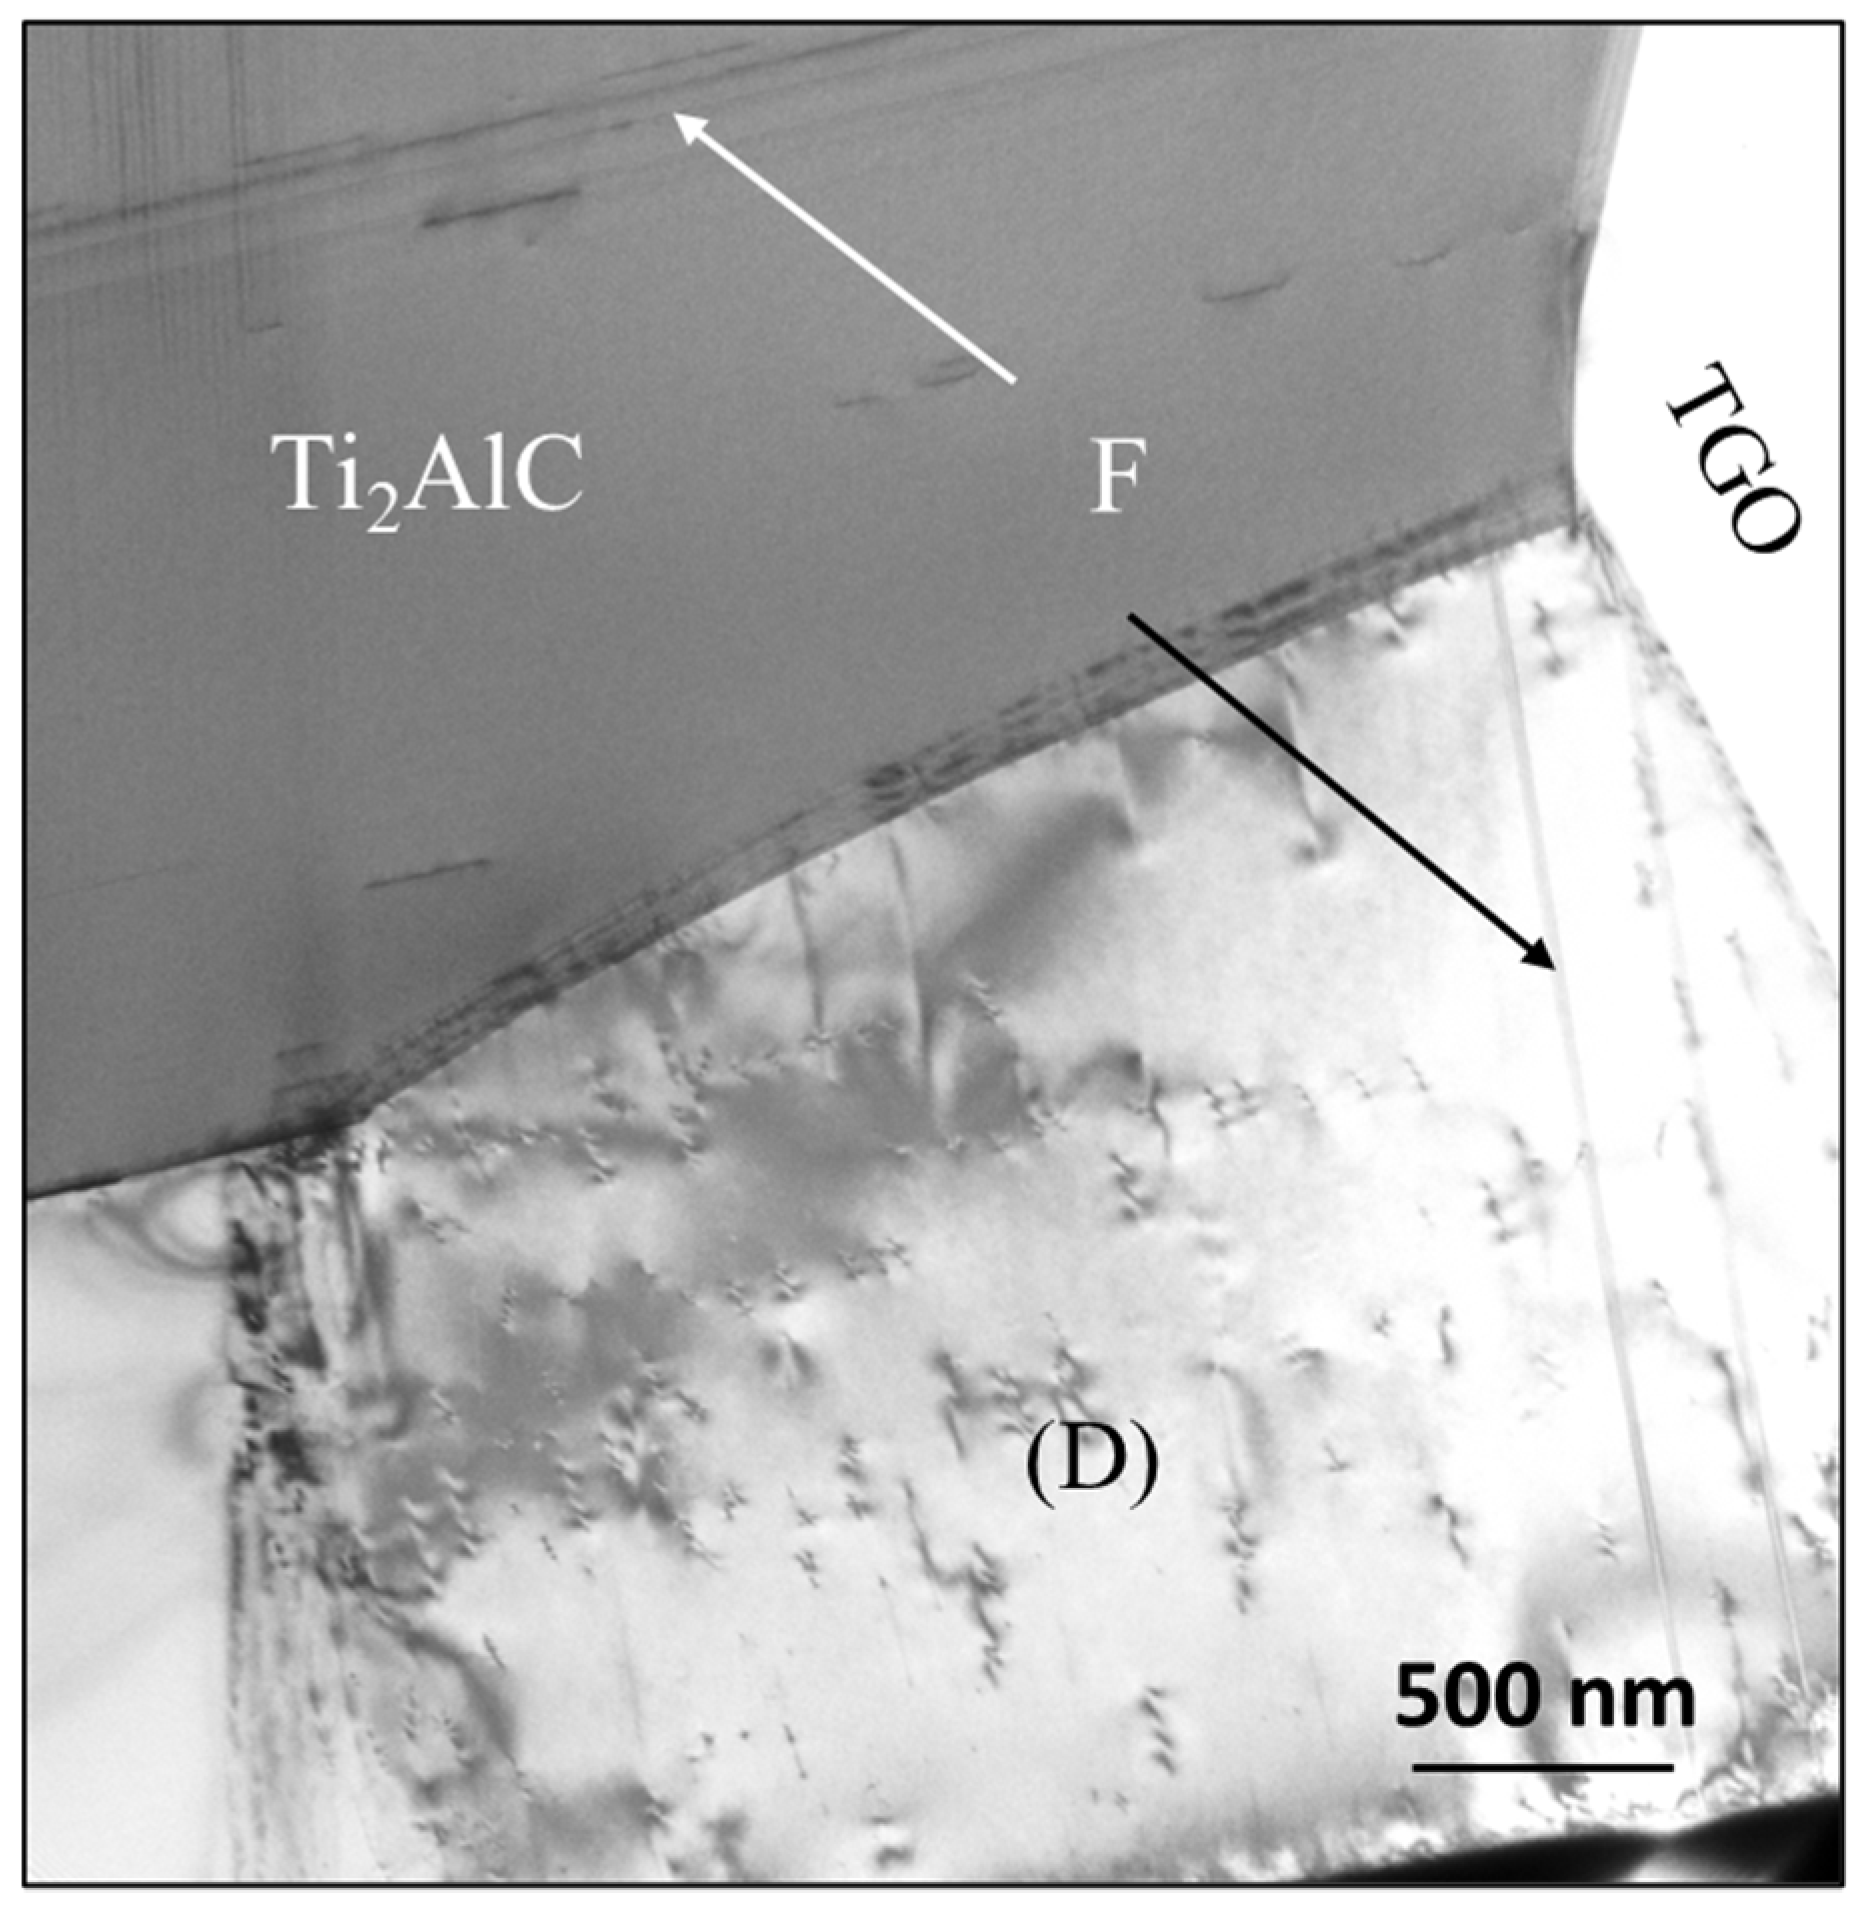
4.3. Ti2AlC Substrate
5. Summary
Author Contributions
Funding
Data Availability Statement
Acknowledgments
Conflicts of Interest
References
- Darolia, R. Thermal barrier coatings technology: Critical review, progress update, remaining challenges and prospects. Int. Mater. Rev. 2013, 58, 315–348. [Google Scholar] [CrossRef]
- Pint, B.A.; Wright, I.G.; Brindley, W.J. Evaluation of Thermal Barrier Coating Systems on Novel Substrates. J. Therm. Spray Technol. 2000, 9, 198–203. [Google Scholar] [CrossRef]
- Smialek, J.L.; Harder, B.J.; Garg, A. Oxidative durability of TBCs on Ti2AlC MAX phase substrates. Surf. Coat. Technol. 2016, 285, 77–86. [Google Scholar] [CrossRef]
- Gonzalez-Julian, J.; Go, T.; Mack, D.E.; Vaßen, R. Thermal cycling testing of TBCs on Cr2AlC MAX phase substrates. Surf. Coat. Technol. 2018, 340, 17–24. [Google Scholar] [CrossRef]
- Smialek, J.L.; Cuy, M.D.; Harder, B.J.; Garg, A.; Rogers, R.B. Durability of YSZ coated Ti2AlC in 1300 °C high velocity burner rig tests. J. Am. Ceram. Soc. 2020, 103, 7014–7030. [Google Scholar] [CrossRef]
- Gonzalez-Julian, J.; Mauer, G.; Sebold, D.; Mack, D.E.; Vassen, R. Cr2AlC MAX phase as bond coat for thermal barrier coatings: Processing, testing under thermal gradient loading, and future challenges. J. Am. Ceram. Soc. 2020, 103, 2362–2375. [Google Scholar] [CrossRef]
- Smialek, J. L Compiled furnace cyclic lives of EB-PVD thermal barrier coatings. Surf. Coat. Technol. 2015, 276, 31–38. [Google Scholar] [CrossRef]
- Smialek, J.L.; Cuy, M.D.; Harder, B.J.; Garg, A.; Rogers, R.B. Durability of YSZ Coated Ti2AlC in 1300 °C Mach 0.3 Burner Rig Tests; NASA Technical Memorandum NASA/TM-2020-220380; NASA: Washington, DC, USA, 2020. Available online: https://ntrs.nasa.gov/citations/20200001406 (accessed on 10 April 2023).
- Virkar, A.V.; Matsumoto, R.L.K. Ferroelastic Domain Switching as a Toughening Mechanism in Tetragonal Zirconia. J. Am. Ceram. Soc. 1986, 69, C224–C226. [Google Scholar] [CrossRef]
- Srinivasen, G.; Jeu, J.F.; Kuo, S.Y.; Virkar, A.V. Ferroelastic Domain Switching in Polydomain Tetragonal Zirconia Single Crystals. J. Am. Ceram. Soc. 1989, 72, 2098–2103. [Google Scholar] [CrossRef]
- Miller, R.A.; Smialek, J.L.; Garlick, R.G. Phase stability in plasma-sprayed, partially stabilized zirconia-yttria. Sci. Technol. Zirconia 1981, 3, 241–253. [Google Scholar]
- Radovic, M.; Barsoum, M.W. MAX phases: Bridging the gap between metals and ceramics. Am. Ceram. Soc. Bull. 2013, 92, 20–27. [Google Scholar]
- Barsoum, M.W.; El-raghy, T. The MAX Phases: Unique New Carbide and Nitride Materials. Am. Sci. 2001, 89, 334–343. [Google Scholar] [CrossRef]
- Witz, G.; Shklover, V.; Steurer, W.; Bachegowda, S.; Bossmann, H.P. Phase evolution in yttria-stabilized zirconia thermal barrier coatings studied by rietveld refinement of X-ray powder diffraction patterns. J. Am. Ceram. Soc. 2007, 90, 2935–2940. [Google Scholar] [CrossRef]
- Azzopardi, A.; Mevrel, R.; Saint-Ramond, B.; Olson, E.; Stiller, K. Influence of aging on structure and thermal conductivity of Y-PSZ and Y-FSZ EB-PVD coatings. Surf. Coat. Technol. 2004, 177, 131–139. [Google Scholar] [CrossRef]
- Yashima, M.; Kakihana, M.; Yoshimura, M. Metastable-stable phase diagrams in the zirconia-containing systems utilized in solid-oxide fuel cell applcation. Solid State Ion. 1996, 86, 1131–1149. [Google Scholar] [CrossRef]
- Xu, L.; Zhu, D.; Liu, Y.; Suzuki, T.S.; Kim, B.; Sakka, Y.; Grasso, S.; Hu, C. Effect of texture on oxidation resistance of Ti3AlC2. J. Eur. Ceram. Soc. 2018, 38, 3417–3423. [Google Scholar] [CrossRef]
- Li, X.; Xie, X.; Gonzalez-Julian, J.; Malzbender, J.; Yang, R. Mechanical and oxidation behavior of textured Ti2AlC and Ti3AlC2 MAX phase materials. J. Eur. Ceram. Soc. 2020, 40, 5258–5271. [Google Scholar] [CrossRef]
- Li, X.; Xie, X.; Gonzalez-Julian, J.; Yang, R.; Schwaiger, R. Oxidation and creep behavior of textured Ti2AlC and Ti3AlC2. J. Eur. Ceram. Soc. 2022, 42, 364–375. [Google Scholar] [CrossRef]
- He, G.; Zhang, X.; Wang, W.; Ma, K.; Zuo, J.; Li, M.; Liu, C.; Xu, J. Anisotropy oxidation behavior and mechanism of textured Ti3(Si,Al)C2 ceramic. Nat. Mater. Degrad. 2023, 3, 19. [Google Scholar] [CrossRef]
- Sun, Z.M. Progress in research and development on MAX phases: A family of layered ternary compounds. Int. Mater. Rev. 2011, 56, 143–166. [Google Scholar] [CrossRef]


| wt. % | YO1.5 % | |||||||
|---|---|---|---|---|---|---|---|---|
| °C | Hours | t′ | t | c | m | t′ | t | c |
| (a) as deposited | 88.0 | 7.5 | 3.7 | 8.0 | 5.0 | 10.7 | ||
| 1100 | 850 | 48.4 | 39.5 | 12.1 | 7.0 | 5.3 | 13.8 | |
| 1200 | 1000 | 27.1 | 49.2 | 23.7 | 7.1 | 3.4 | 15.8 | |
| 1300 | 1000 | 0.0 | 35.9 | 37.4 | 26.7 | 4.6 | 15.3 | |
| (b) 926 | 0.17 | 67.9 | 27.9 | 3.0 | 9.8 | 13.5 | ||
| 1200 | 500 | 0.0 | 31.2 | 64.0 | 3.7 | 14.7 | ||
| 1300 | 500 | 0.0 | 11.3 | 86.0 | 0.5 | 3 | 9.4 | |
Disclaimer/Publisher’s Note: The statements, opinions and data contained in all publications are solely those of the individual author(s) and contributor(s) and not of MDPI and/or the editor(s). MDPI and/or the editor(s) disclaim responsibility for any injury to people or property resulting from any ideas, methods, instructions or products referred to in the content. |
© 2023 by the authors. Licensee MDPI, Basel, Switzerland. This article is an open access article distributed under the terms and conditions of the Creative Commons Attribution (CC BY) license (https://creativecommons.org/licenses/by/4.0/).
Share and Cite
Smialek, J.L.; Garg, A.; Harder, B.J.; Cuy, M.D. Crystallographic and TEM Features of a TBC/Ti2AlC MAX Phase Interface after 1300 °C Burner Rig Oxidation. Crystals 2023, 13, 691. https://doi.org/10.3390/cryst13040691
Smialek JL, Garg A, Harder BJ, Cuy MD. Crystallographic and TEM Features of a TBC/Ti2AlC MAX Phase Interface after 1300 °C Burner Rig Oxidation. Crystals. 2023; 13(4):691. https://doi.org/10.3390/cryst13040691
Chicago/Turabian StyleSmialek, James L., Anita Garg, Bryan J. Harder, and Michael D. Cuy. 2023. "Crystallographic and TEM Features of a TBC/Ti2AlC MAX Phase Interface after 1300 °C Burner Rig Oxidation" Crystals 13, no. 4: 691. https://doi.org/10.3390/cryst13040691