Article

Influence of Strain Amplitude on Low-Cycle Fatigue Behaviors of a Fourth-Generation Ni-Based Single-Crystal Superalloy at 980 °C

1
Institute of Superalloys Science and Technology, School of Materials Science and Engineering, Zhejiang University, Hangzhou 310027, China
2
State Key Laboratory of Silicon Materials, School of Materials Science and Engineering, Zhejiang University, Hangzhou 310027, China
*
Authors to whom correspondence should be addressed.
Crystals 2023, 13(4), 686; https://doi.org/10.3390/cryst13040686
Submission received: 27 March 2023 / Revised: 8 April 2023 / Accepted: 15 April 2023 / Published: 17 April 2023
(This article belongs to the Special Issue Experiments and Simulations of Superalloys)

Abstract

:
Total strain-control, low-cycle fatigue experiments of a fourth-generation Ni-based single-crystal superalloy were performed at 980 °C. Scanning electron microscopy and transmission electron microscopy are employed to determine fracture morphologies and dislocation characteristics of the samples. As the strain amplitude increased from 0.6 to 1.0%, the cyclic stress and plastic strain per cycle increased, the cyclic lifetime decreased, more interfacial dislocation networks were formed, and the formation rate accelerated. Cyclic hardening is associated with the reaction of accumulated dislocations and dislocation networks, which hinder the movement of dislocations. The presence of interfacial dislocations reduces the lattice mismatch between the γ and γ′ phases, and the presence of dislocation networks that absorb mobile dislocations results in cyclic softening. At a strain amplitude of 1.0%, the reaction of a high density of dislocations results in initial cyclic hardening, and the dislocation cutting into the γ′ phase is one of the reasons for cyclic softening. The crack initiation site changed from a near-surface defect to a surface defect when the strain amplitude increased from 0.6 to 0.8 to 1.0%. The number of secondary cracks initiated from the micropores decreased during the growth stage as the strain amplitude increased.

1. Introduction

Nickel (Ni)-based single-crystal (SC) superalloys are widely used as high-temperature structural materials in aircraft and advanced gas engines because of their high operating temperatures and excellent mechanical properties [1,2,3]. The microstructure of SCs comprise two phases: (1) ordered intermetallic γ′ phase with an L12 structure coherently embedded in a disordered solid-solution and (2) γ matrix phase with a face-centered cubic structure. Owing to the reasonable ratio of elements and the heat-treatment process, the γ′ phase is composed of cuboidal particles with a volume fraction of up to 70%, and its strength can increase with an increase in temperature, such that the superalloys exhibit excellent mechanical properties and high resistance to fatigue and creep at elevated temperatures [4,5,6].
Gas turbines operate at high alternating loads for long periods on account of startup and shutdown, resulting in fatigue damage. In recent decades, there has been growing interest in the low-cycle fatigue (LCF) behavior of Ni-based SC superalloys, which has led to extensive research in this area. LCF damage mainly occurs in the lower region of the blade body and blade root, where there is a large stress concentration, with the service temperature ranging from 700 to 1000 °C [7,8,9,10]. Due to the complex structure of turbine blades, there are evident strain deformation variances in different areas. Strain amplitude is a crucial factor that dominates the LCF mechanism of a blade. Previous studies have confirmed that with increasing strain amplitude, the responses of cyclic stress, dislocation type, and microscopic deformation behavior change significantly, and the lifetime and design of alloys are affected by the deformation and damage behavior of alloys in different regions [6,11,12,13]. Cyclic stress responses include cyclic hardening, cyclic softening, and cyclic stabilization, which indicate that, under a constant strain amplitude, the stress amplitude increases, decreases, and basically remains unchanged with an increase in cycles, respectively. Cyclic hardening is mainly related to an increase in dislocation density [14,15], dislocation entanglement [16,17], and the existence of dislocation networks [18] and stacking faults (SFs) [9] reduce the mobility of dislocations in the channels at high temperatures. Cyclic softening is mainly related to the dislocation shearing of γ′ phases [18,19], interface mismatch reduction [20], and γ′ phase rafting [21,22]. However, dislocation density reduction arises due to dislocation annihilation [18] and dislocation network formation [21] at high temperatures. Cyclic stabilization occurs when the hardening and softening effects are in equilibrium [15,23]. At high-strain amplitudes, cracks mainly originate in the micropores near the surface, whereas, at low-strain amplitudes, oxidation significantly affects crack initiation [24]. Wang [9,12] reported that at a strain amplitude (Δεt/2) range of 0.5–0.7% at 980 °C, the dislocations are more likely to form dislocation networks at the interface, and, under 1.0% strain, the shearing of the γ′ phase by SFs becomes the predominant deformation mechanism. Rafting of the γ′ phase occurs under a low-strain amplitude at high temperatures, with dislocation networks tending to be generated at the rafting interface [25]. Previous research [26] has indicated that dislocation climbing is the basic condition for the formation of dislocation networks and is faster under a high-strain amplitude [11], demonstrating that a high-strain amplitude is likely to be more conducive to the formation of dislocation networks. Studies on LCF have primarily focused on first- to third-generation single crystals, with fourth-generation single crystals barely studied, especially the effects of strain amplitude on the cyclic stress response and microstructures at high temperatures.
The addition of rhenium (Re) and ruthenium (Ru) to fourth-generation single-crystal superalloys affects the generation of interface dislocation networks, rafting of the γ′ phase, and dislocation shearing of the γ′ phase [27,28,29,30], which influences the cyclic stress response and fatigue deformation. In this study, a set of LCF tests were performed at 980 °C on a fourth-generation single-crystal superalloy under varying strain amplitudes to understand the effects of strain amplitude on cyclic stress response and deformation mechanisms.

2. Materials and Methods

The material used in this study was a test bar made of a fourth-generation Ni-based monocrystalline superalloy. Its chemical composition is summarized in Table 1.
The crystal orientations of the cast rods were determined through X-ray diffraction. The loading direction was designed to be parallel to the [001] crystal orientation of the alloy with an angle orientation deviation within 10°. Conventional three-step heat procedures were performed to process the casting material, including a high-temperature solid solution treatment (1340 °C), followed by a two-stage ageing treatment at relatively low temperatures in argon and vacuum (1100 and 870 °C, respectively). Air cooling was performed after each heat treatment. LCF specimens (76 mm in length and 5.5 mm in gauge diameter) were machined and polished from fully heat-treated SC bars.
All LCF tests were conducted using an MTS servo machine (MTS-100kN-10, MTS, Eden Prairie, MN, USA) in the air at 980 °C under fully reversed (R = −1) total strain control. The strain amplitudes were 0.6, 0.8, and 1.0%, and a triangular waveform with a constant strain rate of 5 × 10⁻³ s−1 was used. After the fatigue tests, the surface morphologies, crack initiation, and crack propagation of the specimens were observed using a scanning electron microscope (SEM, FEI Quanta 650, FEI, Portland, OR, USA). The chemical compositions of the oxides were determined through energy-dispersive X-ray spectroscopy (EDS, Oxford, UK) under SEM. Microstructural observations of the specimens after fracturing were performed using a transmission electron microscope (TEM; FEI Tecnai F20 S-TWIN, FEI, Portland, OR, USA) operating at 200 kV. The TEM observations were performed on thin {001} foils.
To better observe the morphology of the dislocation, the transmitted sample was cut at the working section 5 mm away from the fracture (perpendicular to the axial), with the thickness of the slice approximately 550 μm. Thereafter, manual grinding was performed below 50 μm and pressed into thin foils of 3 mm in diameter. The thin foils were prepared through double-jet thinning in Tenupol 5 (Struers, Denmark) at 15 V and −30 °C. The electrolyte comprised 70, 23, and 7% vol of methanol, n-butanol, and perchloric acid, respectively. Meanwhile, the evolution of γ and γ′ morphologies in the longitudinal sections of 3 mm from the fracture surface was observed via SEM. The sample was mechanically polished and chemically etched in a solution composed of 10 mL HF + 20 mL HNO3 + 30 mL C3H8O3.

3. Results

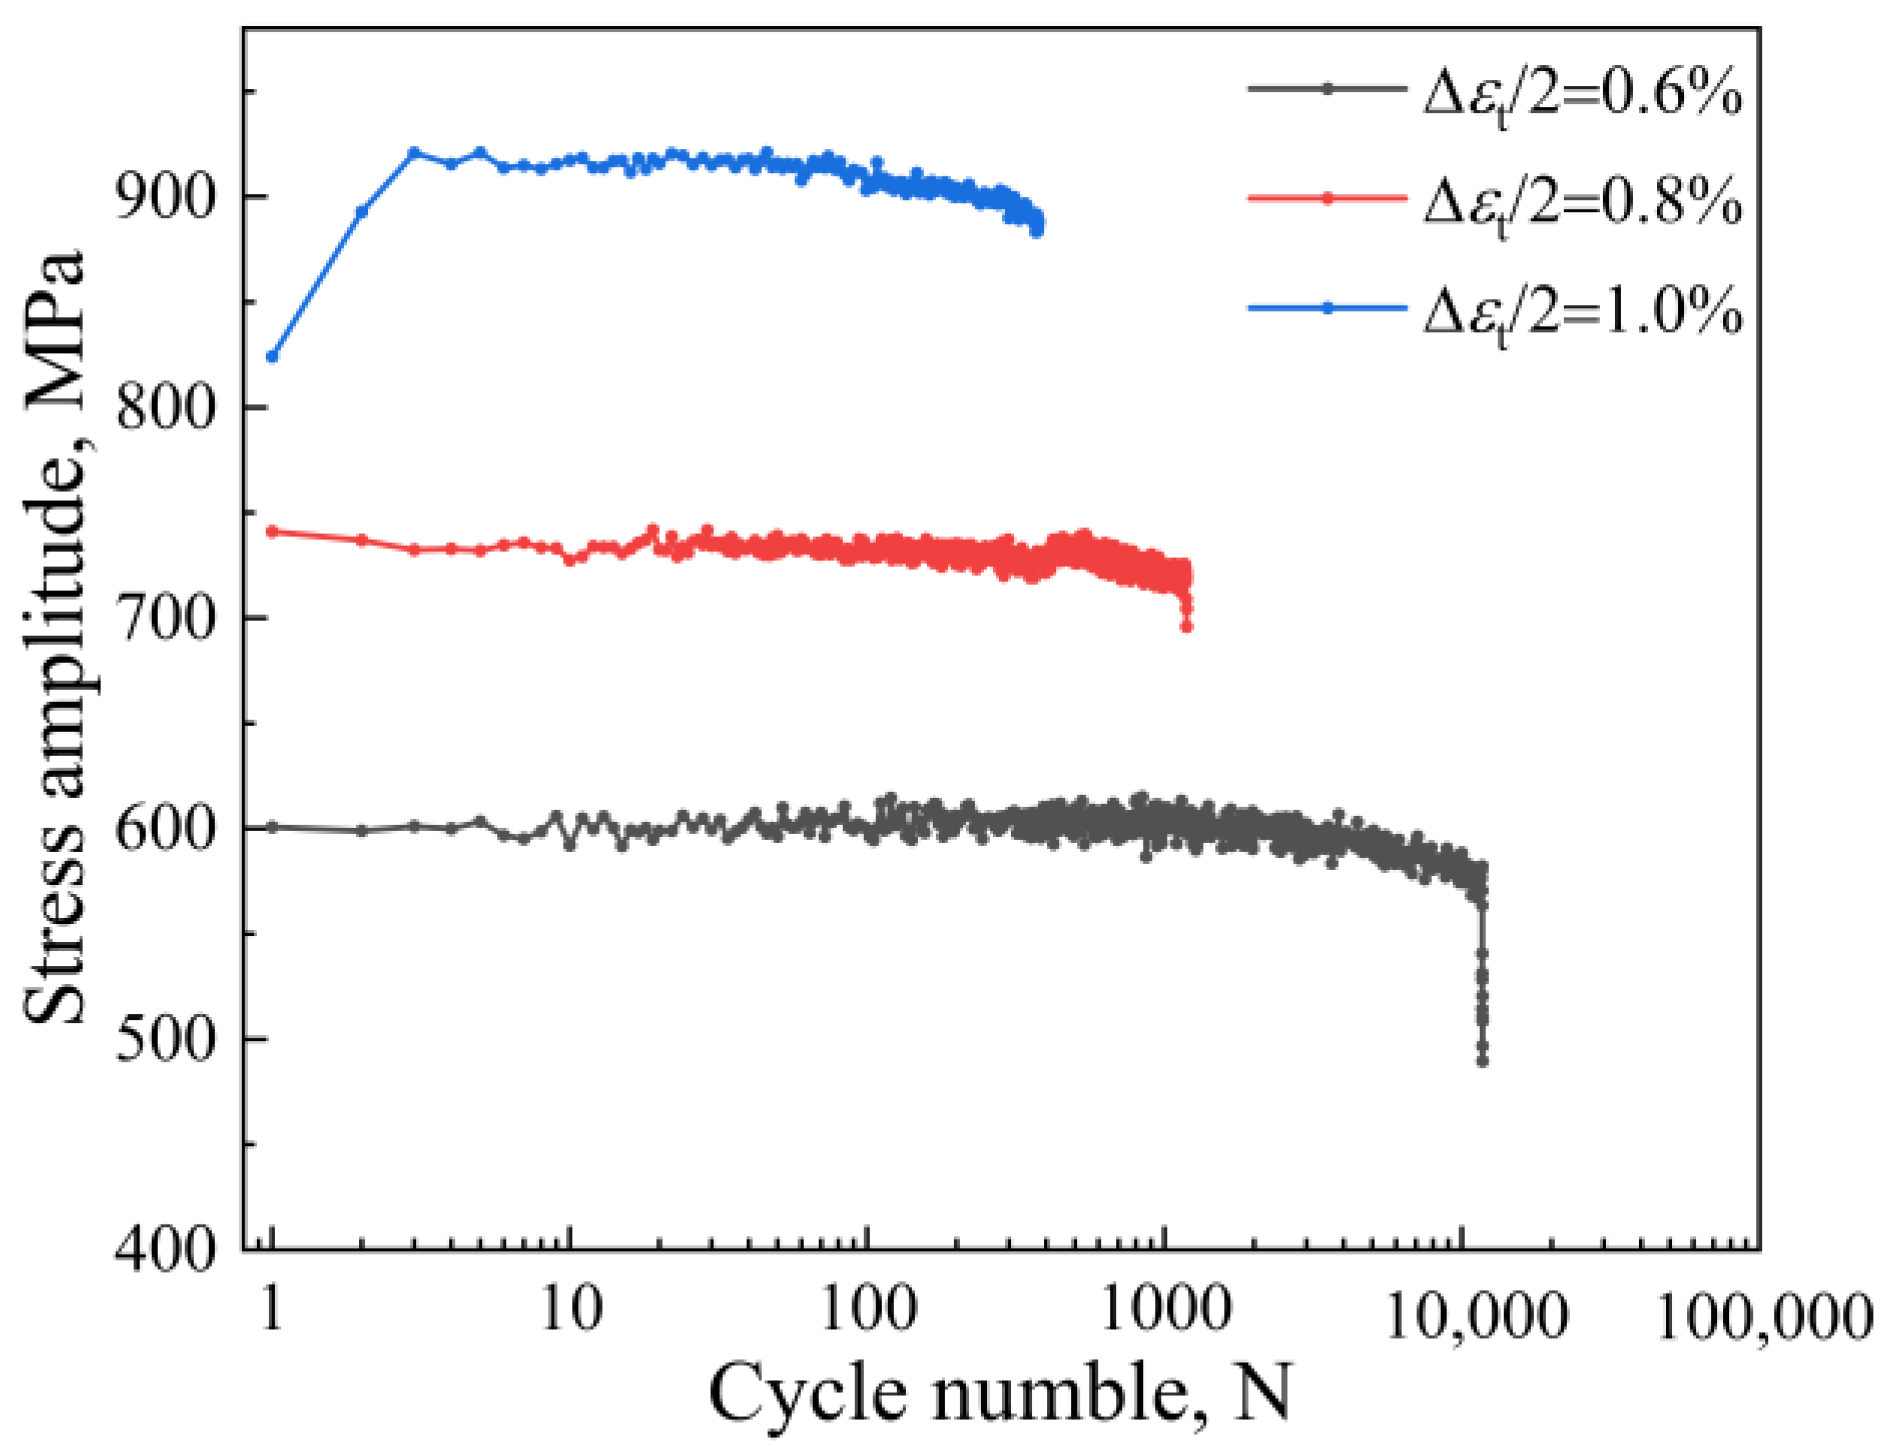
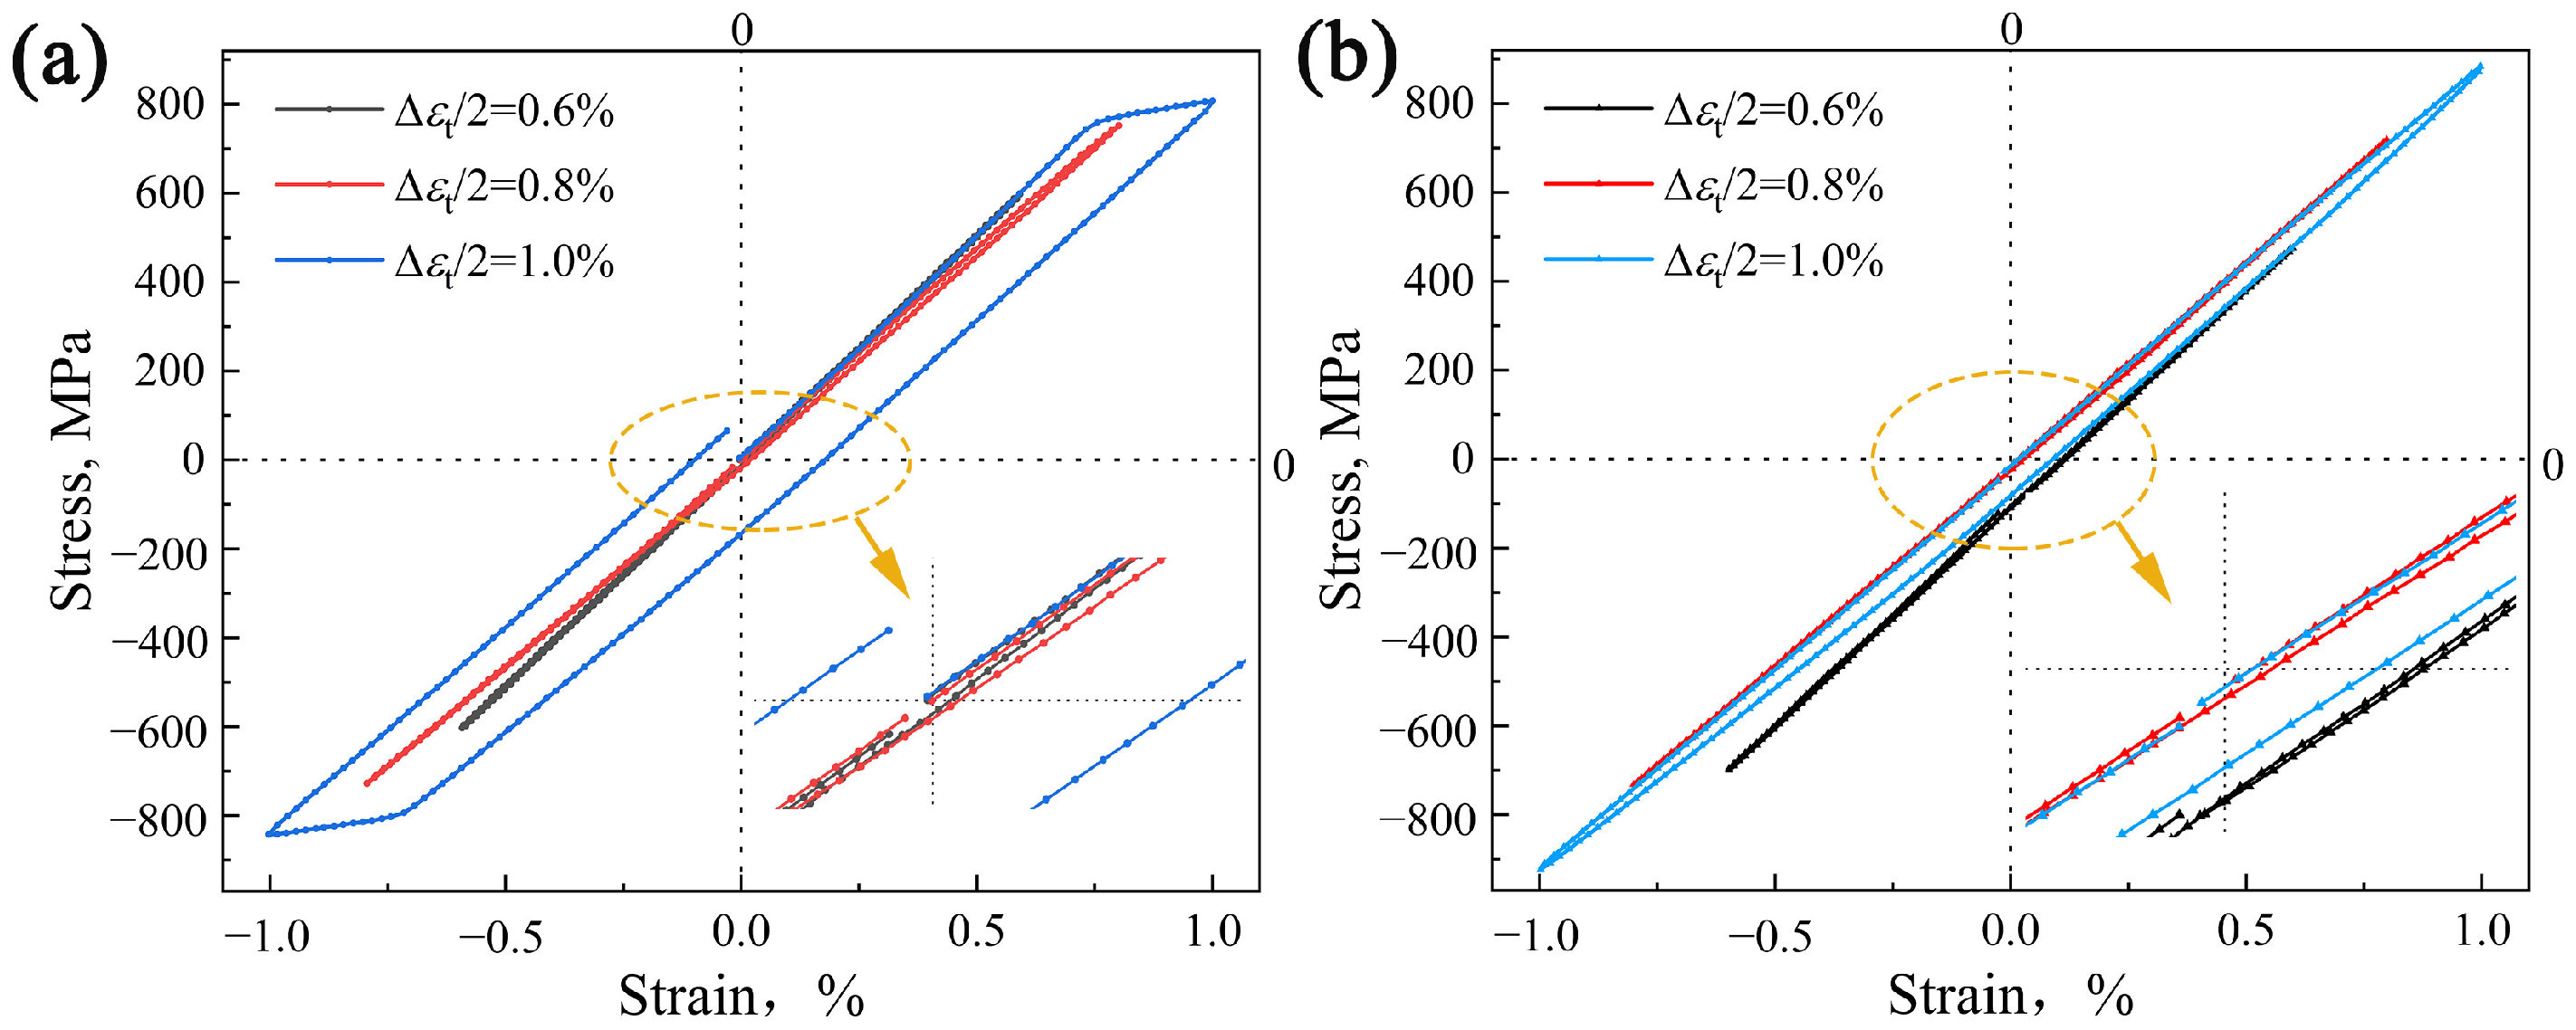
3.1. Cyclic Stress Response

Figure 1 illustrates the cyclic stress response curves of the alloys tested at 980 °C under different strain amplitudes. As the strain amplitude increased, the cyclic stress of the alloy also increased; hence, the fatigue lifetime gradually decreased. The cyclic stress response also indicates the cyclic hardening/softening of the alloy associated with the structural changes occurring during fatigue. Cyclic hardening/softening curves were constructed by plotting the stress amplitude (Δσt/2) vs. the logarithm of the number of cycles to failure (N). For Δεt/2 values of 0.6 and 0.8%, the alloys exhibited fairly constant stress amplitudes from the beginning of the tests. Thereafter, they exhibited cyclic stability for approximately a few hundred cycles, followed by gradual softening. Finally, near the end of the test, the stress decreased rapidly, resulting in the onset and rapid propagation of fatigue cracks. With an increase of Δεt/2 to 1.0%, the alloy initially exhibited fast cyclic hardening, followed by cyclic stability. Subsequently, gradual softening and stress reduction occurred, similar to the Δεt/2 values of 0.6 and 0.8%, respectively.
The hysteresis loops at Δεt/2 values ranging from 0.6 to 1.0% in the first and second half-life cycles are shown in Figure 2a,b, respectively. The central area of the hysteresis loop is wrapped by a yellow curve, as shown in the lower right part of Figure 2. The area of the hysteresis loops indicates the plastic strain energy, and the plastic strain range is characterized by the width of the hysteresis loop [31] when the stress is 0 MPa. The size of the width demonstrates the ability of the alloy to resist plastic deformation during the cyclic fatigue test; the larger the width, the smaller the ability of the alloy to resist plastic deformation [32]. In the first cycle, the obtained plastic strain ranges were 0.016, 0.019, and 0.277% when Δεt/2 values were 0.6, 0.8, and 1.0%, respectively; in the half-life cycle, the obtained results were 0.006, 0.012, and 0.073%, respectively. Cyclic deformations at half-life are generally considered stable. With the stability of the cyclic deformation, the value decreased, particularly under a strain amplitude of 1.0%. At Δεt/2 = 0.6%, the plastic strain was negligible. When the strain amplitude increased to 0.8%, the plastic strain increased slightly. Thus, it was demonstrated that, as the strain amplitude increased to 1.0%, the plastic strain increased significantly.

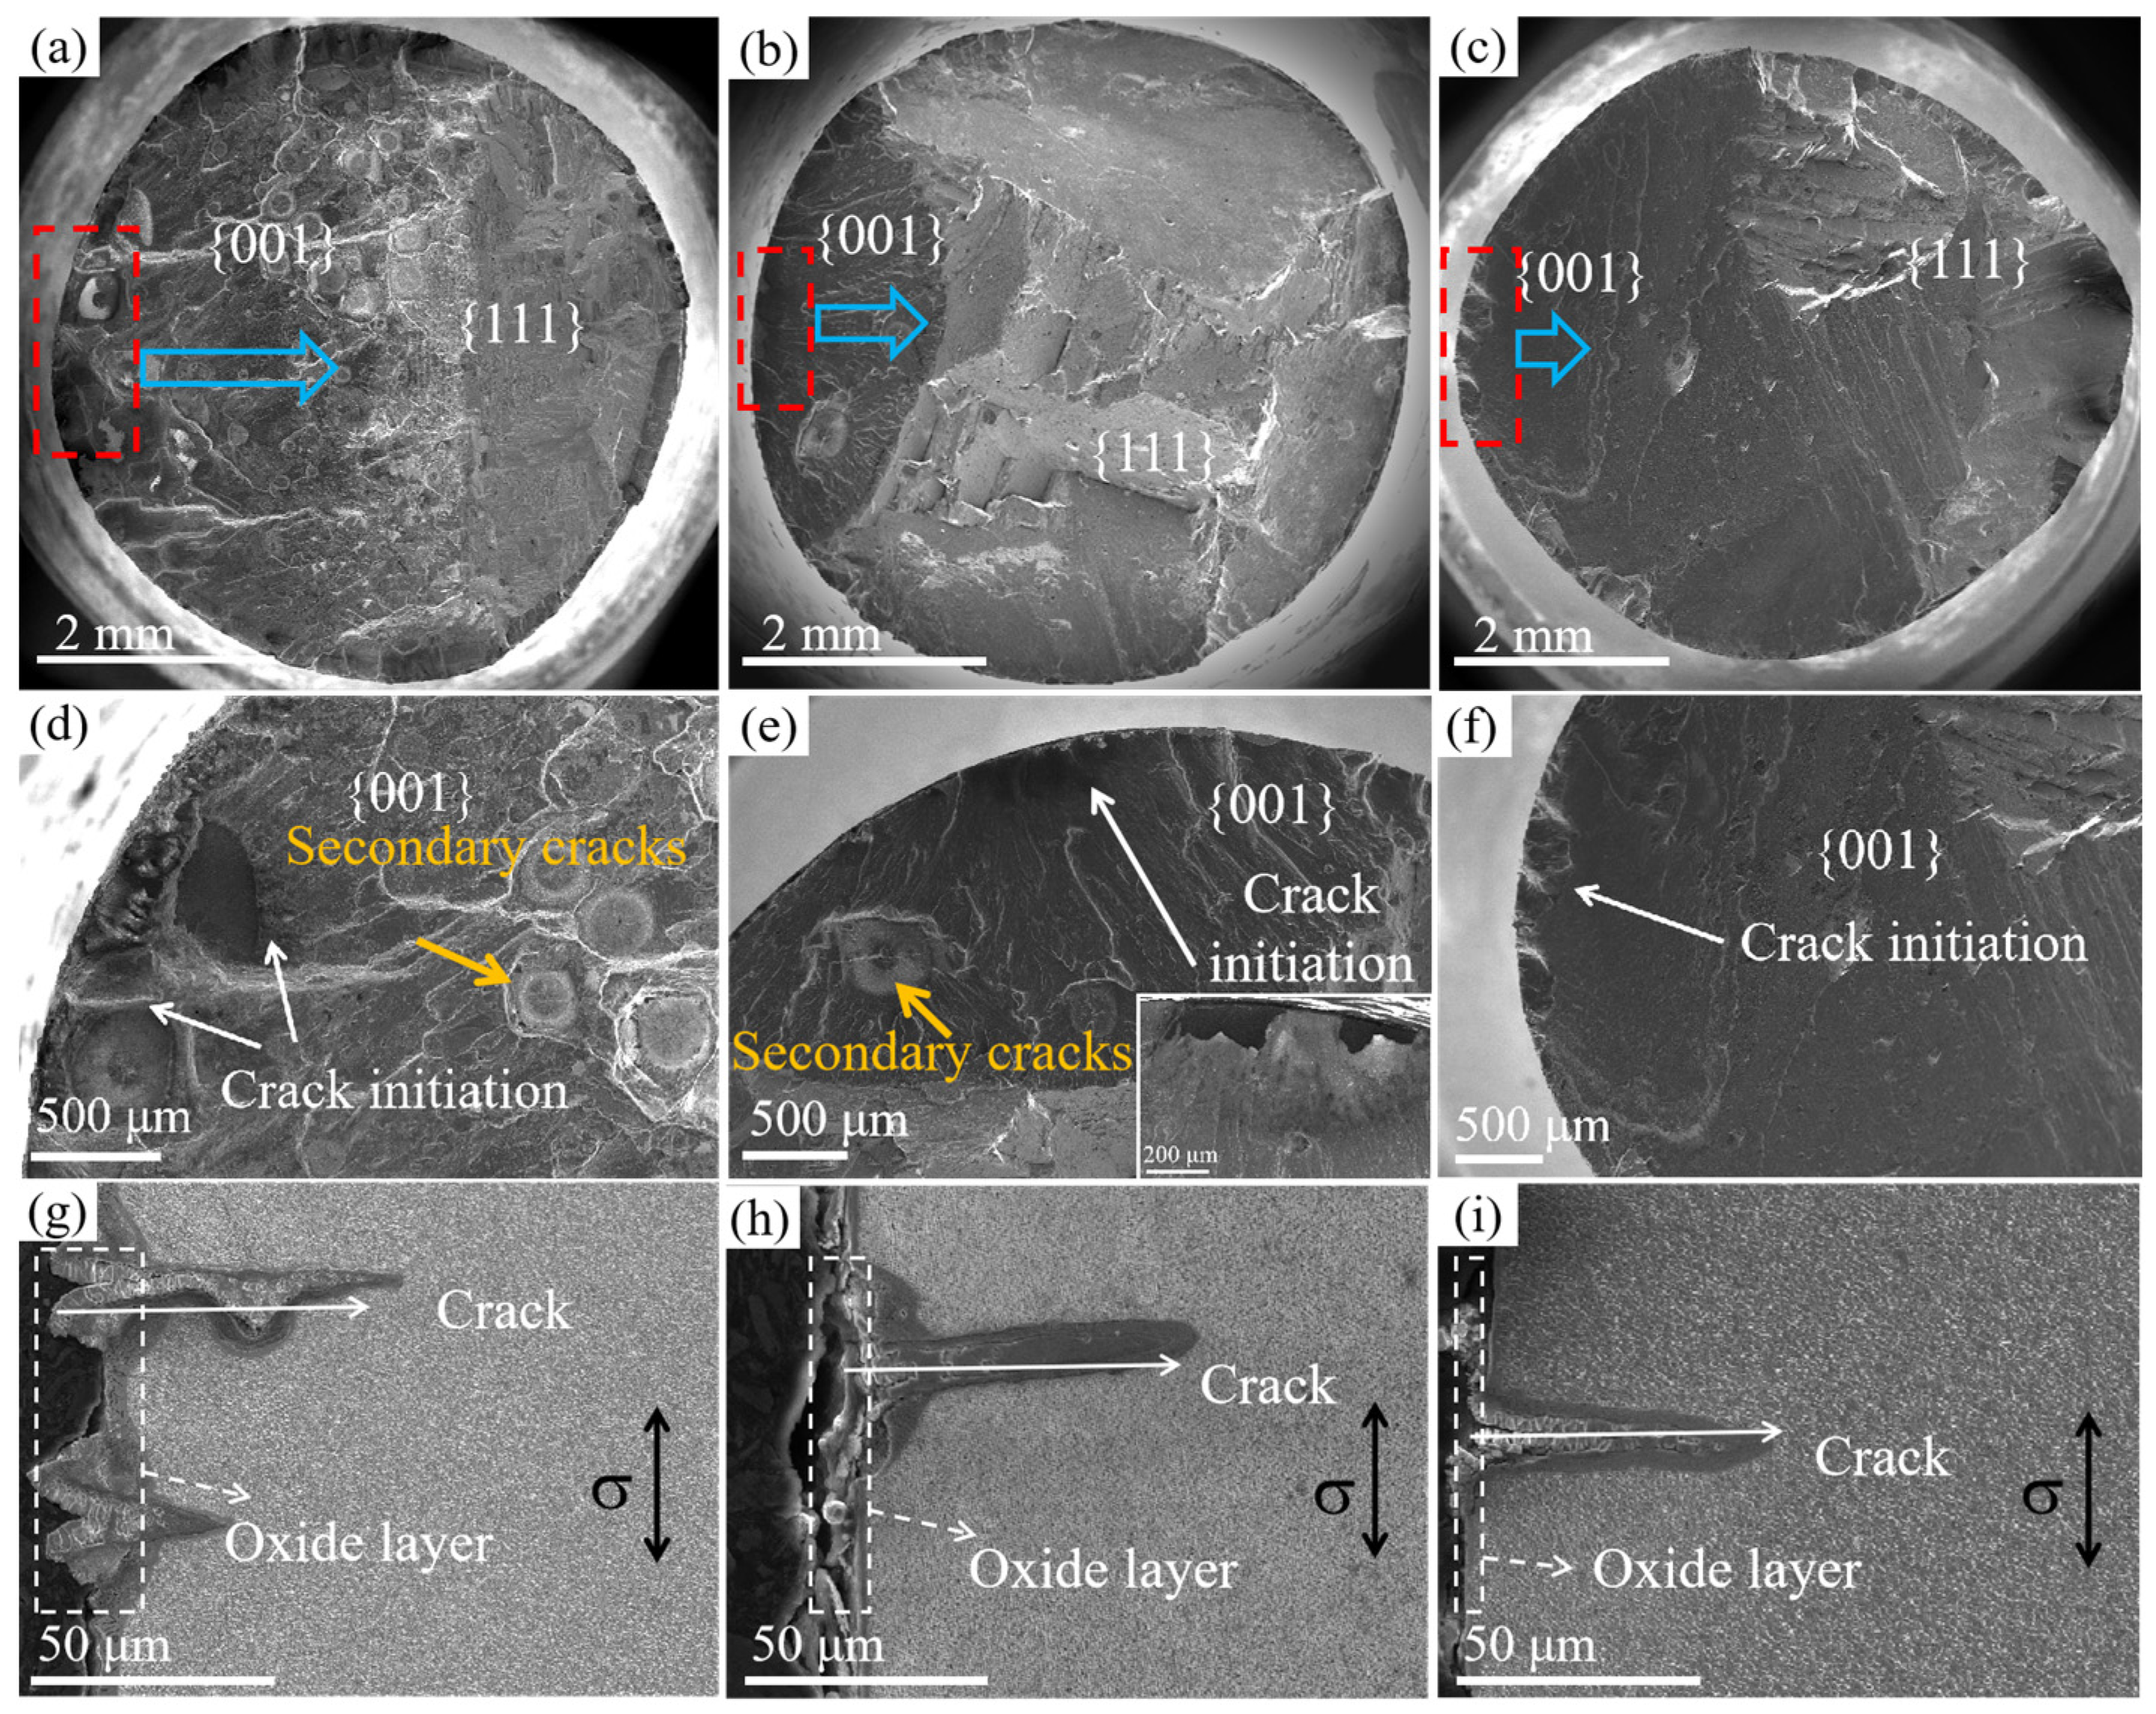
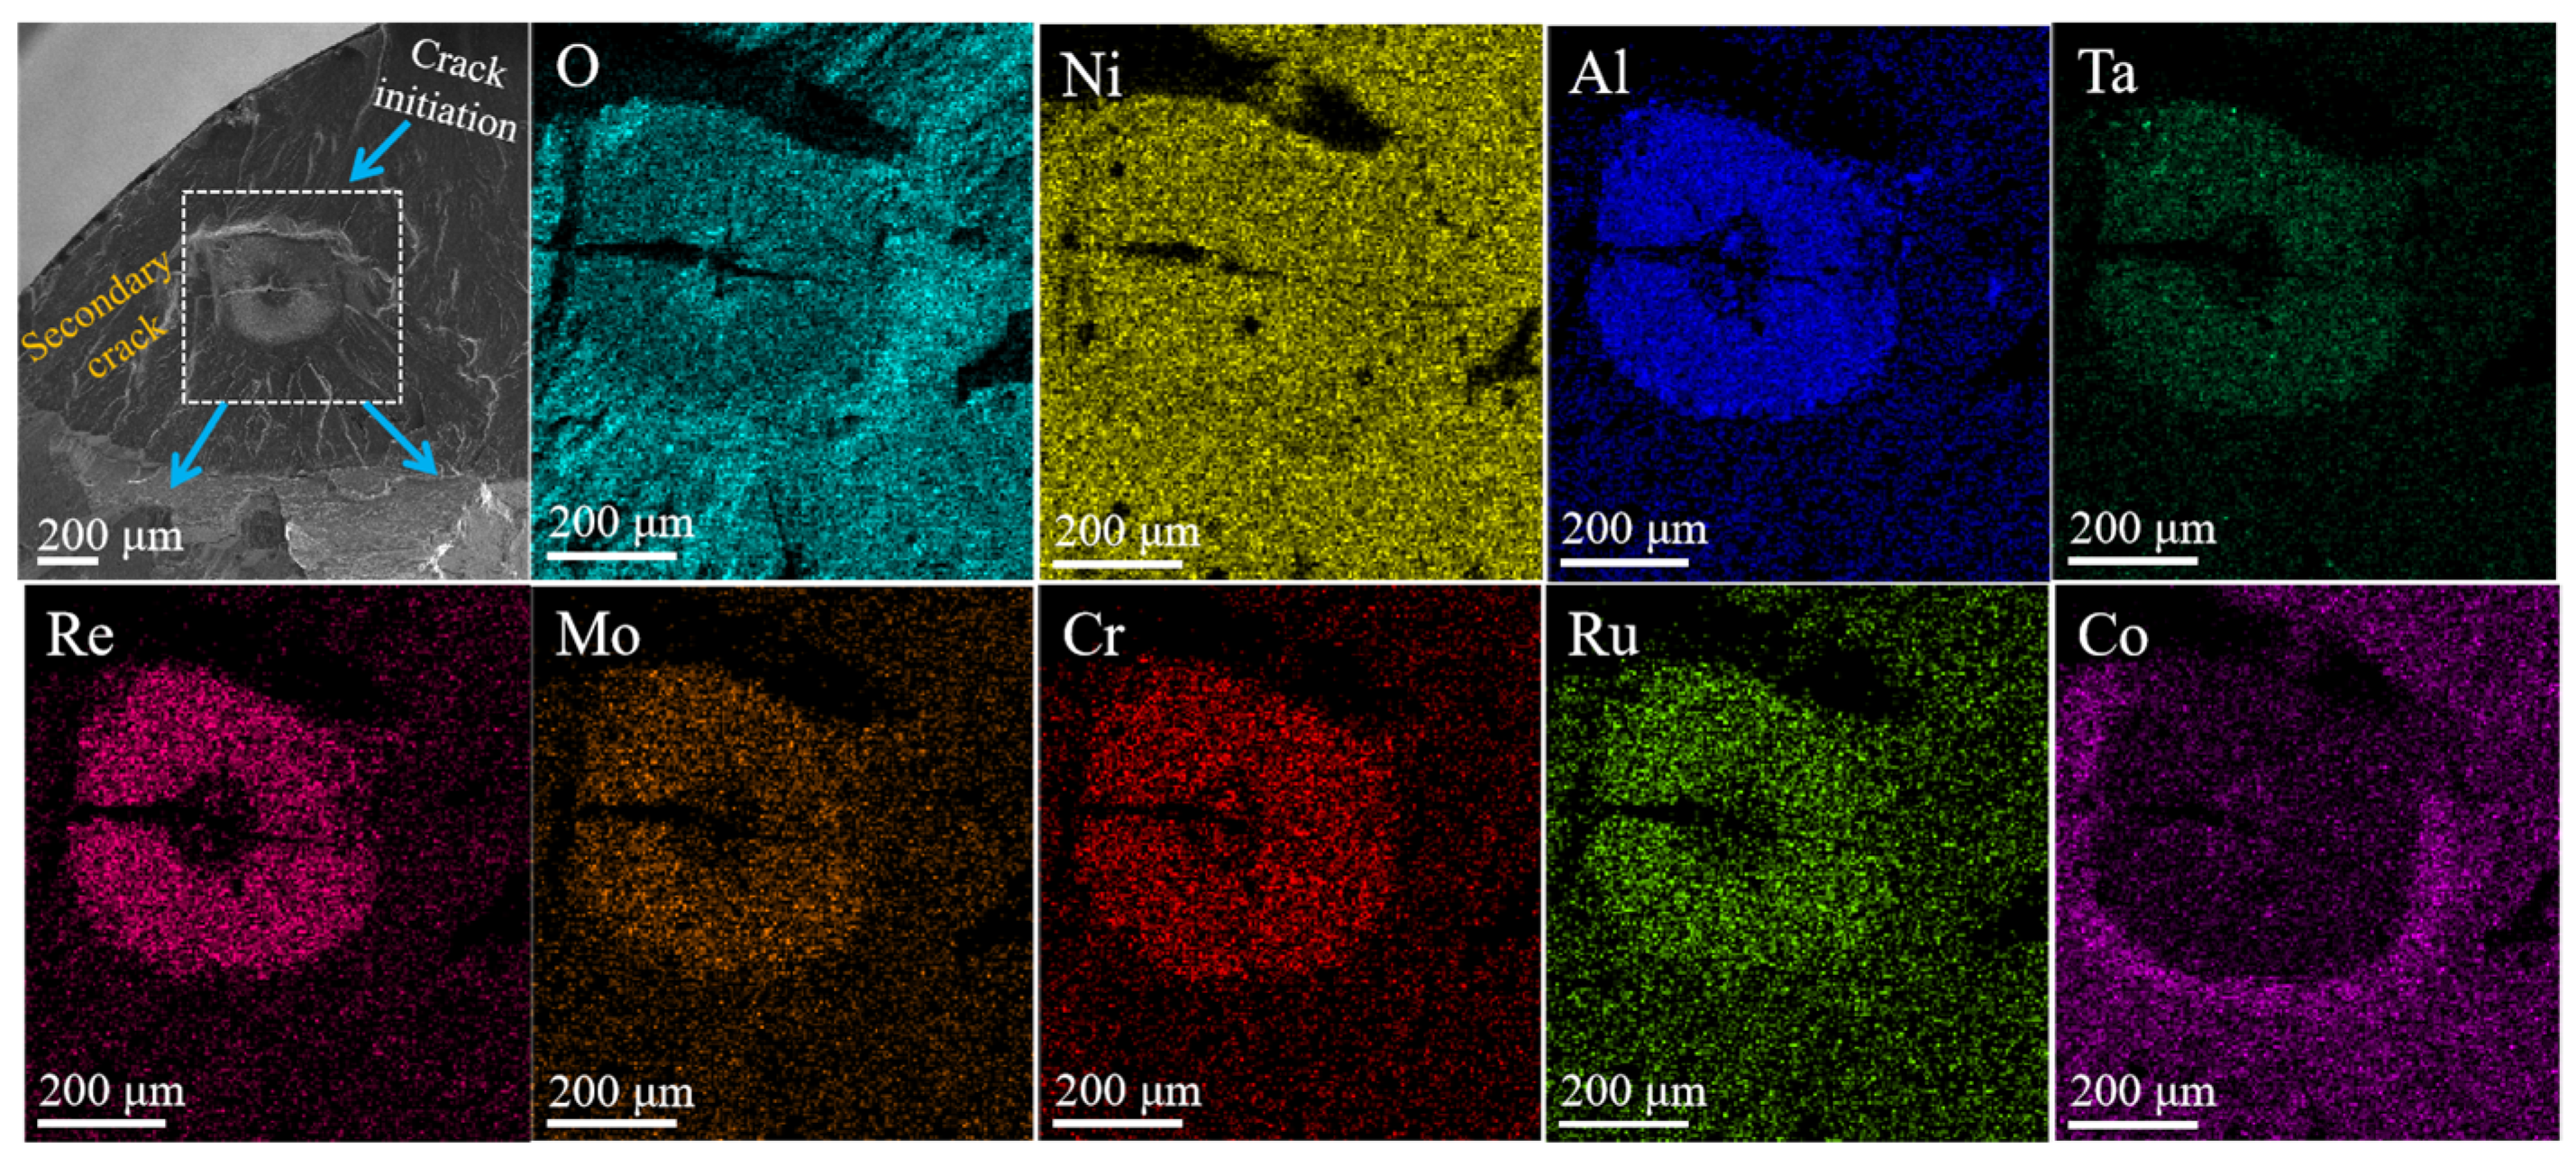
3.2. Fatigue Fractography and Fracture Mechanism

As shown in Figure 3, the cracks initiated from or near the surfaces of the specimens, thereafter propagating along the {001} planes; that is, they are perpendicular to the applied stress. The direction of the crack propagation is indicated by the blue arrow. The mechanism of crack initiation and growth results from local stress concentrations in the midplane of the micropore–alloy interfaces, resulting in a circular crack with a relatively featureless surface [24]. When cracking reaches a certain depth, crack propagation translates to the shear mode; that is, it occurs on different {111} planes [20]. Under a strain amplitude of 0.6%, the crack initiated on the surface in a circular morphology with a halo (white arrow) and bright color, as shown in Figure 3a,d. The existence of the halo is linked to the homogenization of slip at high temperatures in the presence of oxidation [33,34]; the oxidation is more pronounced in the bright-colored areas. After crack initiation, the crack propagated along the plane perpendicular to the stress axis, with the propagation speed being low because of the less effective crack growth driver at a lower cyclic amplitude [19]. The stress concentration generated at the defect also formed several secondary cracks (yellow arrows), with a bright halo formed around the pores. As the strain amplitude increased to 0.8%, cracks started to form at the surface defect and exhibited distinct bright regions associated with oxidation, as shown in Figure 3b,e. When the crack propagated in a plane perpendicular to the stress axis, it also produced secondary microcracks with circular halos; however, the number of microcracks were significantly reduced than at the 0.6% strain amplitude. When the strain amplitude was increased to 1.0%, cracks started to form at the surface defect with no evident oxidation trace, and no secondary microcracks with a halo were observed during the crack growth stage, as shown in Figure 3c,f. The oxidation layers formed on the sample surface at strain amplitudes of 0.6, 0.8, and 1.0% are shown in Figure 3g–i, respectively. The oxide layer represented by the dashed box became thinner with increasing strain amplitude, illustrating a decrease in alloy oxidation. The cracks initiated from the oxide layer of the specimen were observed to propagate predominantly perpendicular to the loading axis, similar to the cracks initiated from the subsurface.
The effect of the strain amplitude on crack initiation and propagation is related to oxidation. At high-strain amplitudes, it is easy to rapidly generate stress concentrations at the surface notches owing to the large cyclic loads, which can initiate cracks. However, at low-strain amplitudes, the cyclic load is small, and it is difficult to rapidly generate stress concentrations that reach the threshold. As time increased, high-temperature oxidation occurred. During the load cycle, the strain mismatch between the plastically deformed metal substrate, and the stiff oxide scale caused repeated cracking and reoxidation, resulting in an oxide plug. The oxide plugs fill the micropores, and the surface micropores (caused by insufficient liquid flow during casting) are passivated after oxidation [34]. This reduced the effective stress concentration of the surface shrinkage cavity by generating a compressive stress in/around the hole. Therefore, the stress concentration at the internal defects reached the threshold faster than that at the surface, and cracks were less likely to be initiated at the surface at low-strain amplitudes.
However, crack propagation along the micropores is an efficient approach for lowering the crack propagation threshold. Micropores can also change the crack direction by modifying the stress intensity factor at the crack tip to form secondary cracks [35]. The crack propagation path is indicated by blue arrows in Figure 4. When the primary crack reaches the micropores, a secondary crack forms, and the direction of the crack propagation changes. Crack propagation occurs at a slow rate under a low-strain amplitude, and the embrittlement effect of oxidation promotes crack propagation due to the sufficient transmission of oxygen (O) along the crack [19]. Consequently, at low-strain amplitudes, more secondary cracks with distinct oxidation signatures appeared during the slow crack propagation stage. The chemical composition of the halo surrounding the micropores was analyzed using EDS, as shown in Figure 4. The analysis demonstrated that the oxide was enriched with Ni, aluminum (Al), tantalum (Ta), Re, molybdenum (Mo), chromium (Cr), and Ru, whereas a decrease in the cobalt (Co) content was observed. One explanation for this phenomenon is that O is transferred during crack propagation, and the partial pressure of O at the crack tip is low, at which point Co is difficult to oxidize [36]. Therefore, the initiation and propagation of secondary cracks are influenced by the oxide composition, particularly at low-strain amplitudes where the oxidation time is longer.
A previous study [37] reported that, at 980 °C and low-strain amplitude, the crack initiation occurred from the stripping of the oxide layer on the surface, which is in agreement with the results obtained in another study [38] but different from the results obtained in this study. At similar loading times, the oxide layer thickness and crack length were higher than those obtained in this study, indicating that the alloy was less resistant to oxidation, and cracks were initiated earlier. This may be the main reason for the crack initiation from the oxide layer on the surface at high temperatures and low-strain amplitudes.

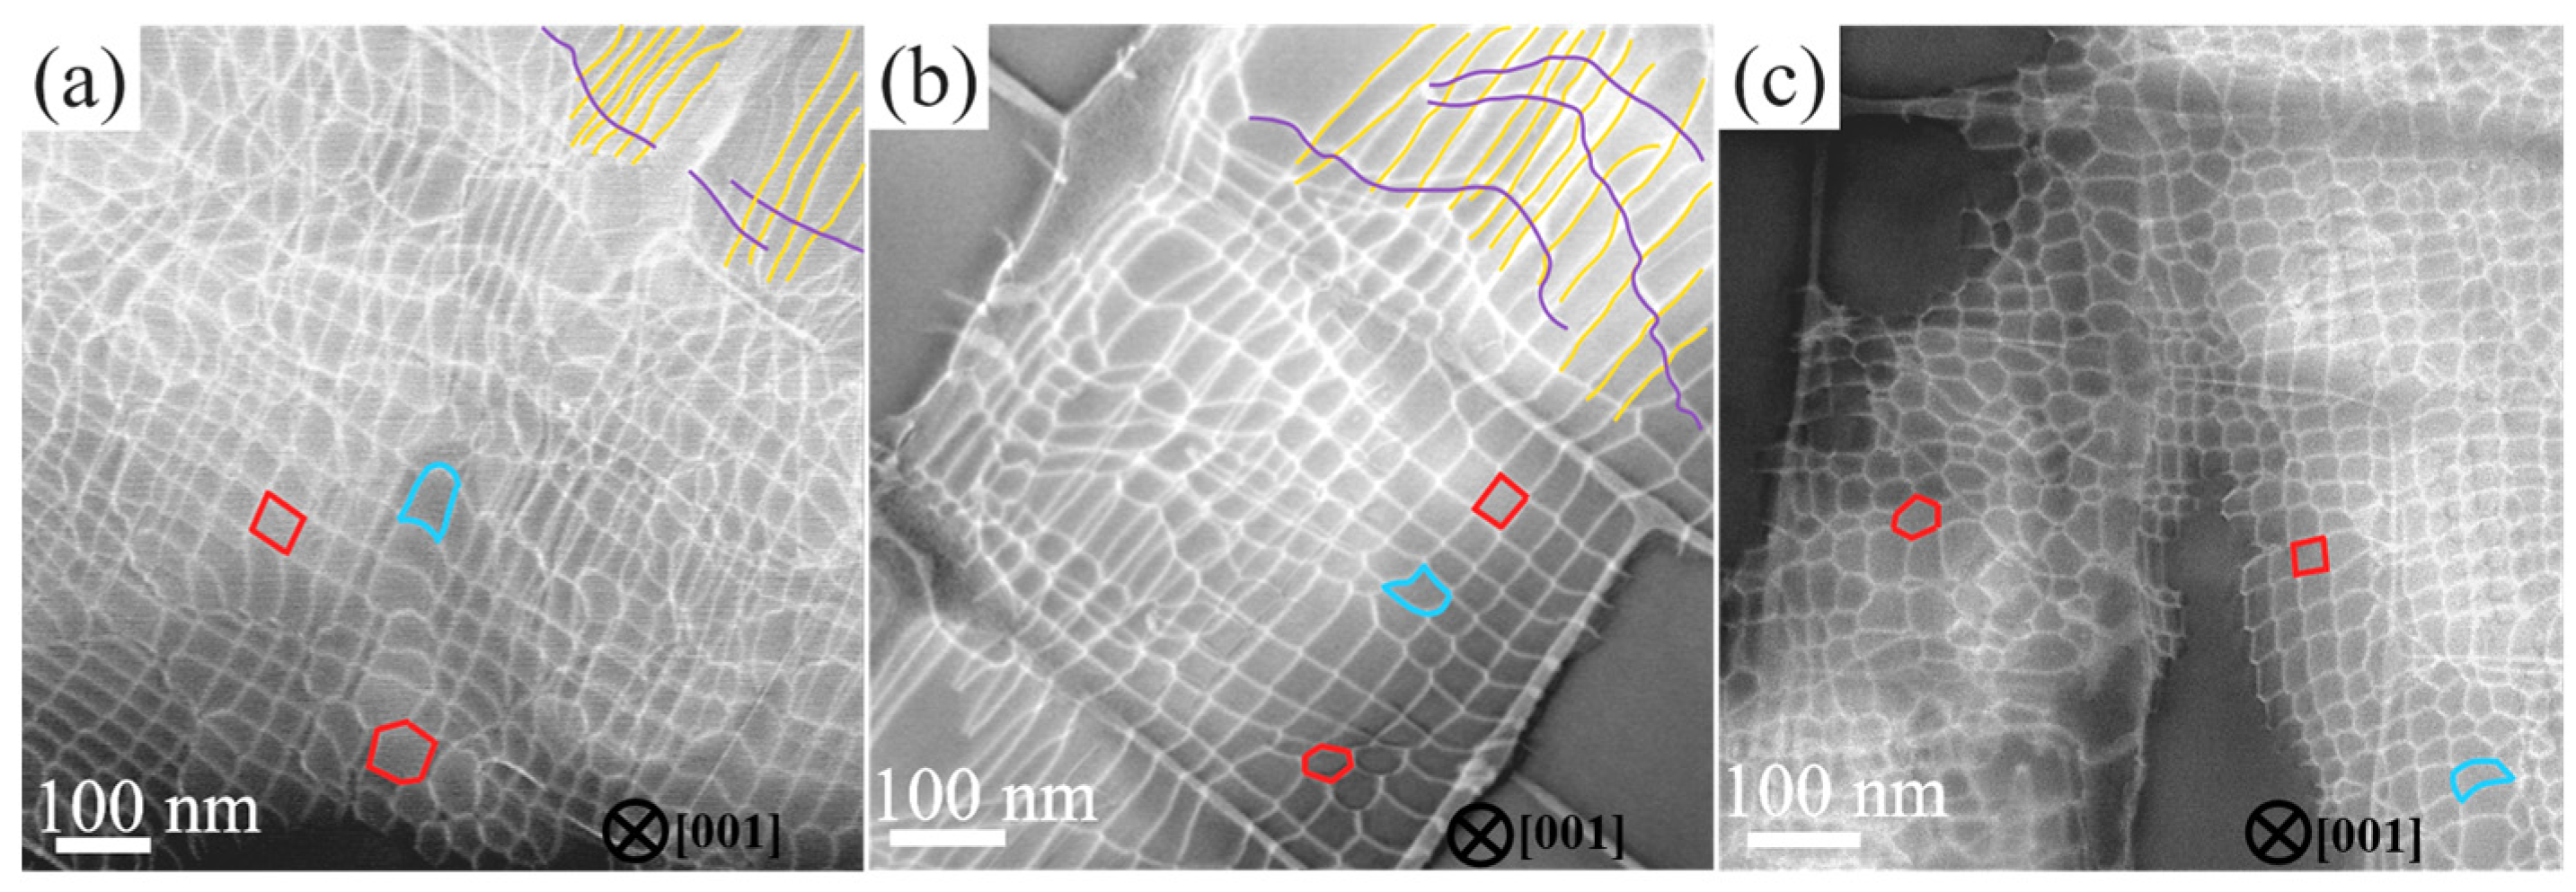
3.3. Dislocation Movement and Deformation Mechanisms

Figure 5 illustrates the γ′ morphology away from the fracture surface under different strain amplitudes at 980 °C. As shown in Figure 5a, when the strain amplitude is 0.6%, a slight decrease in the degree of γ′ cubic was observed. When the strain amplitude is 0.8%, more γ′ cubic degree decreased, as shown in Figure 5b. When the strain amplitude was 1.0%, the γ′ cubic degree exhibited no evident changes, as shown in Figure 5c. The widths of the transverse channels broadened after fatigue, as shown in Figure 5d. Width broadening was most pronounced at a strain amplitude of 0.8%, followed by 0.6%; however, it was not significant at a strain amplitude of 1.0%.
Microstructural configurations of a fatigued alloy after an LCF test at 980 °C under the strain amplitude of 0.6% were performed, as shown in Figure 6. Figure 6a shows that almost all the dislocations distribute in the γ matrix channels, and a small amount of dislocation networks are generated at the γ/γ′ interface. The rafting of the γ′ phase is not evident. As shown in Figure 6b, the dislocations bow out through the γ matrix channel, promoting the dislocation slips to the γ/γ′ interface. Dislocations piled-up at the γ/γ′ interface form a large number of dislocation entanglements. Figure 6c shows that, under cyclic deformation, the dislocation networks are considered to be produced by the reaction of two sets of parallel cross-slip dislocations arising from the misfit interface between the γ matrix and γ′ phase [14].
When the strain amplitude increases to 0.8% at 980 °C, typical dislocation configurations and different deformation microstructures are observed, as shown in Figure 7. At this condition, the corners of the cubic γ′ phase are appreciably degenerated, and the corresponding width of matrix channels is increased at some deformed regions. Most dislocations distribute along the γ/γ′ interfaces and form several dense and regular dislocation networks at the interfaces of the deformed regions (Figure 7a). In comparison with microstructures observed under the strain amplitude of 0.6% (Figure 6), more dislocation networks are observed at the γ/γ′ interfaces. Although the cyclic stress increased, almost no dislocations cut into the γ′ phases, indicating that dislocation networks have a significant influence on hindering matrix dislocations from cutting into the γ′ phases [39,40]. As shown in Figure 7b, bowing and cross-slipping of dislocations in the γ matrix channels piled up at the γ/γ′ interfaces, resulting in the generation of dislocation networks rather than dislocation entanglements in the reaction. More small-scale dislocation networks were formed at the interfaces, which were related to greater cyclic stress (Figure 7c).
Figure 8 shows the typical dislocation configurations of an alloy after a test at 980 °C under a strain amplitude of 1.0%. A large number of regular dislocation networks are observed at the γ/γ′ interfaces, which are formed by depositing matrix dislocations, as shown in Figure 8a,b. In addition, a small amount of dislocation shearing into the γ′ phases was observed, owing to the accumulation of plastic deformation under high stress, as shown in Figure 8c, which is attributed to the cyclic softening [18,20]. These dislocations are of two main types under the conditions of high-temperature and high-strain amplitude: (1) the γ′ phases are sheared by the matrix dislocations, resulting in SF formation within them [9,13,41,42]; (2) the γ′ phases are sheared by the superdislocation, which decomposes to form two partial dislocations and superlattice intrinsic SFs [9,12,27,42,43]. The dislocations in the γ′ phases exhibit no characteristics of SFs in the samples; thus, it is likely to be a superdislocation.
Therefore, for the LCF test at 980 °C under a strain of 1.0%, cross-slip and climbing of dislocations are the main forms of deformation, and the shearing of γ′ phases by superdislocation also begin to increase.
As shown in Figure 9, there are two main types of dislocation networks at 980 °C: (1) arrangement of transitional dislocation network dominated by slip dislocations (blue segments); and (2) equilibrium dislocation network including hexagonal and rhombic arrangements (red line segment). Transition dislocation networks, which tend to be slightly bowed, consist mostly of slip dislocations and exhibit a relatively irregular arrangement. This transitional arrangement can develop into equilibrium arrangements with hexagonal, rhombic, or octagonal structures [44]. As the strain amplitude increases, the morphology of the interface dislocation network changes.
As shown in Figure 9a, under a strain amplitude of 0.6%, two sets of slip dislocations in the upper right corner (yellow and purple lines) and few equilibrium dislocation networks are observed. When the strain amplitude increases to 0.8% (Figure 9b), two sets of slip dislocations intersect. Combined with the analysis illustrated in Figure 6 and Figure 7, we established that the formation of dislocation networks at a strain amplitude of 0.8% may be faster than that at 0.6%, for which the fraction of equilibrium dislocation networks increases significantly. As shown in Figure 9c, when the strain amplitude increased to 1.0%, the fraction of equilibrium dislocation networks further increased, and the slip traces that formed the dislocation networks disappeared. The influence of the strain amplitude on the formation process of the dislocation network may be due to the following two reasons: (1) under a high-strain amplitude, more dislocations accumulate at the interface, which is conducive to the rapid formation of the dislocation network; (2) and under a high-strain amplitude, the dislocation climbs faster, promoting the rapid movement of the dislocation toward the interface.

3.4. Cyclic Hardening/Softening

Owing to the high temperatures, the strength of the γ′ phase is relatively high, cyclic deformation is mainly concentrated in the γ matrix channels, and dislocations can move along the {111} planes by bowing out through the γ matrix channels. It is difficult for dislocations to enter the γ′ phases and pile up at the γ/γ′ interface, which will cause cyclic hardening owing to the interaction of dislocations and the γ′ phases [45]. Meanwhile, the appearance of interfacial dislocations reduces the lattice mismatch between the γ′ and γ phases, and annihilation occurs when dislocations of opposite signs meet, resulting in a softening effect [46,47]. The formation of dislocation networks through dislocation reactions is an important deformation mechanism at high temperatures. In contrast, the existence of a dislocation network hinders the movement of dislocations and prevent dislocations from cutting into the γ′ phase, resulting in the hardening effect [18,41]. However, the dislocation network can absorb the moving dislocations in the γ matrix channels, resulting in a decrease in the dislocation density and cyclic softening [48]. When the dislocation cuts into the γ′ phase, resistance to the dislocation movement is reduced, similar to the density of the dislocation that accumulates at the interface, resulting in a softening effect [18]. Remarkably, cyclic stability occurred when cyclic hardening was balanced with cyclic softening.
The cyclic stress response changed from cyclic stability to cyclic hardening when the strain amplitude increased from 0.6 to 0.8 to 1.0% during the initial fatigue stage, as shown in Figure 1. In addition, the area of the hysteresis loop is large under a strain amplitude of 1.0% at the initial stage of fatigue, resulting in significant plastic strain, indicating that the high density of dislocations accumulated and multiplied more than annihilation to adapt to the generation of plastic strain under high-strain amplitude, as illustrated in Figure 2a. As a result, initial cyclic hardening occurred under a strain amplitude of 1.0%. The formation of interfacial dislocation networks is a result of the interaction of the piled-up dislocations, as shown in Figure 8 and Figure 9c. For the samples with strain amplitudes of 0.6 and 0.8%, the area of the hysteresis loop (as shown in Figure 2a,b) is small, illustrating that the dislocation density is low [49]. Therefore, equilibrium between dislocation multiplication and annihilation is easy to achieve, and cyclic stability occurs.
With the increase in the number of cycles, more dislocations are absorbed in the dislocation network, resulting in a decrease in the dislocation density [21]. Thereafter, the formation of interface dislocation networks results in cyclic softening. Under the strain amplitudes of 0.6 and 0.8%, the matrix channel becomes wider, and γ′ cubic degree decreases with increasing cycles, as shown in Figure 5, which can reduce the resistance of dislocation movement in the γ channels and result in cyclic softening. At a strain amplitude of 1.0%, dislocations cutting into the γ′ phases also contributed to cyclic softening, as shown in Figure 8c.

4. Conclusions

The LCF behaviors of SC superalloys with an [001] orientation at 980 °C under varying strain amplitudes are systematically investigated using SEM and TEM, and variations in their fracture and deformation mechanisms are proposed. In addition, the effects of strain amplitude on the LCF behavior at 980 °C are analyzed in detail. The main conclusions are as follows:
(1)
As the strain amplitude increased from 0.6 to 1.0%, the cyclic stress and plastic strain per cycle increased, whereas the cyclic lifetime decreased. Cyclic hardening is associated with the reaction of accumulated dislocations and dislocation networks, which hinder the movement of dislocations. At a strain amplitude of 1.0%, the high densities of dislocations and dislocation reactions resulted in an initial cyclic hardening.
(2)
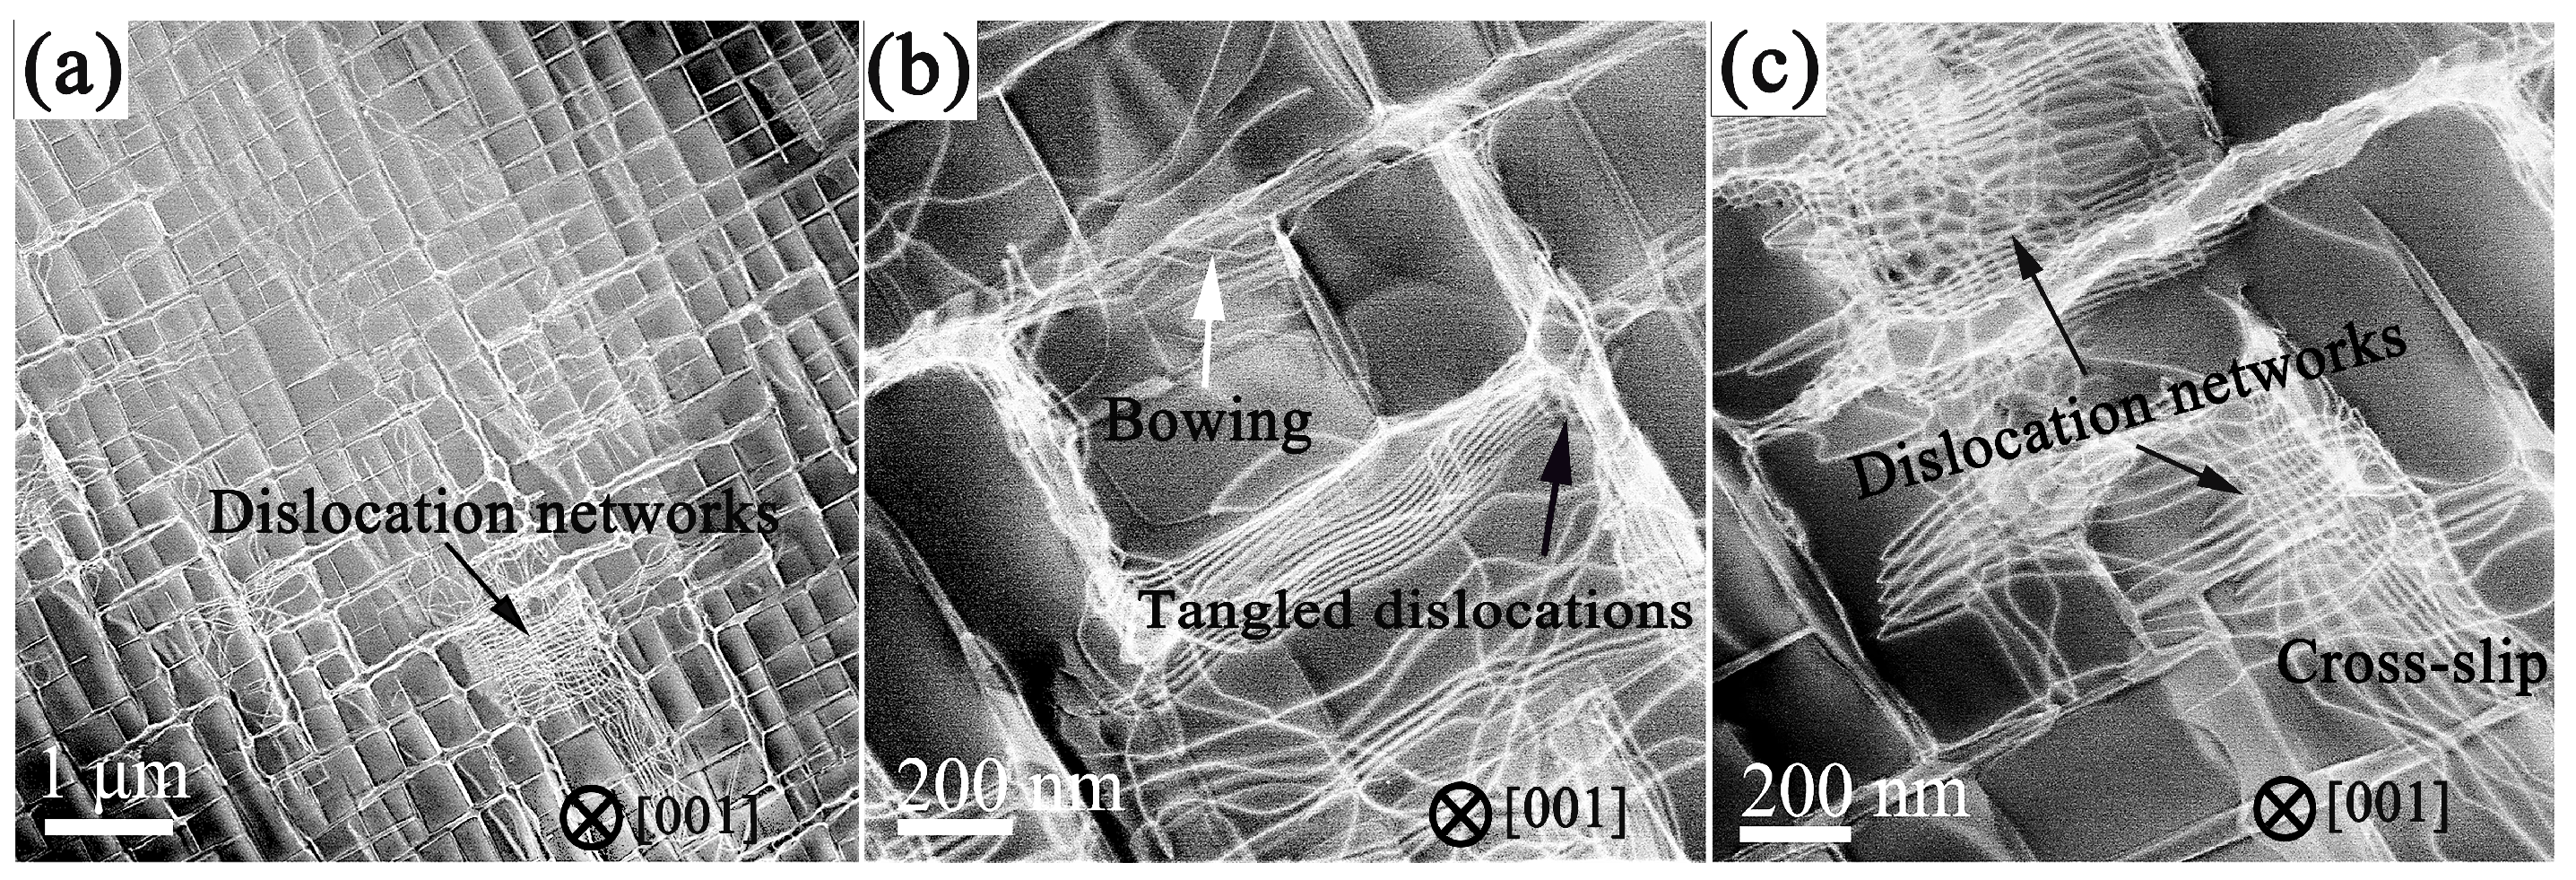
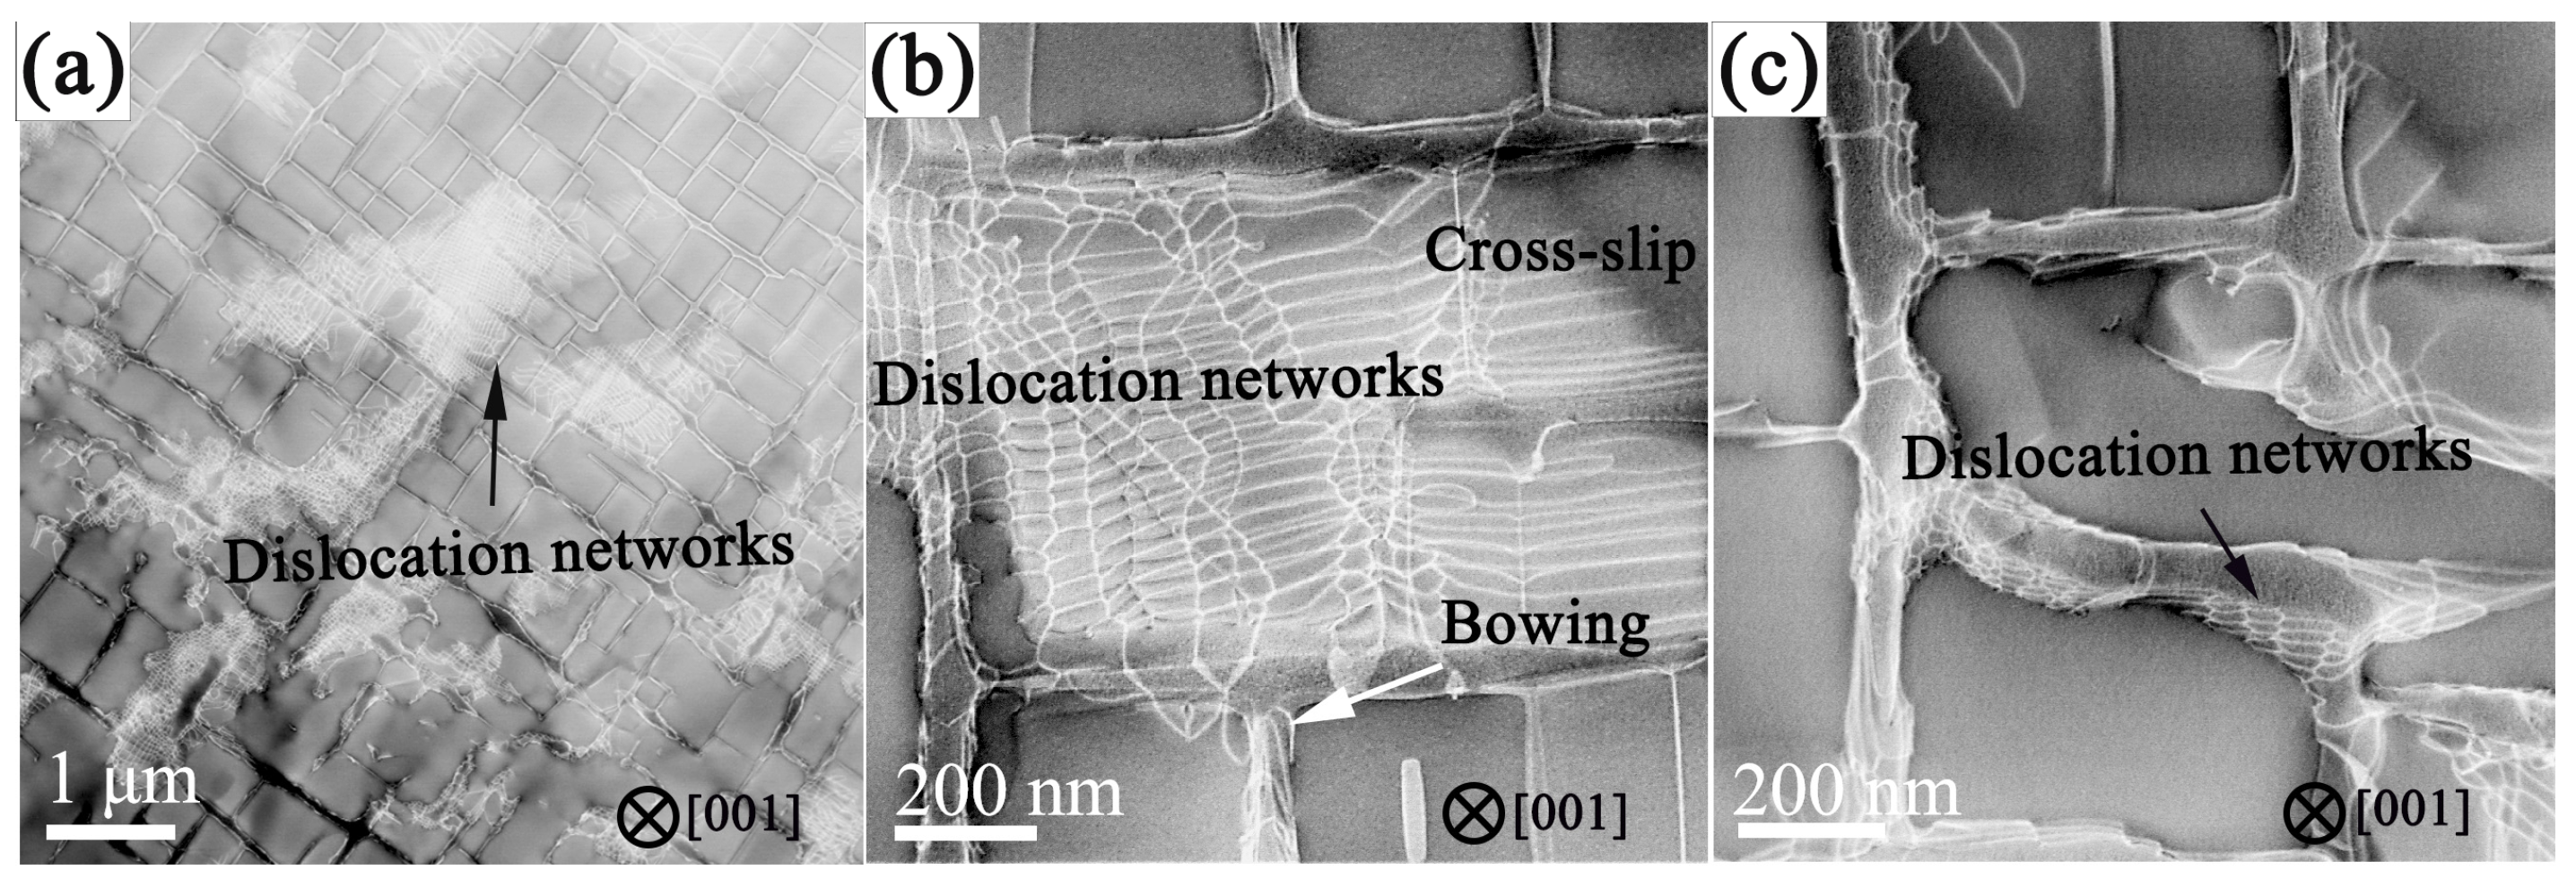
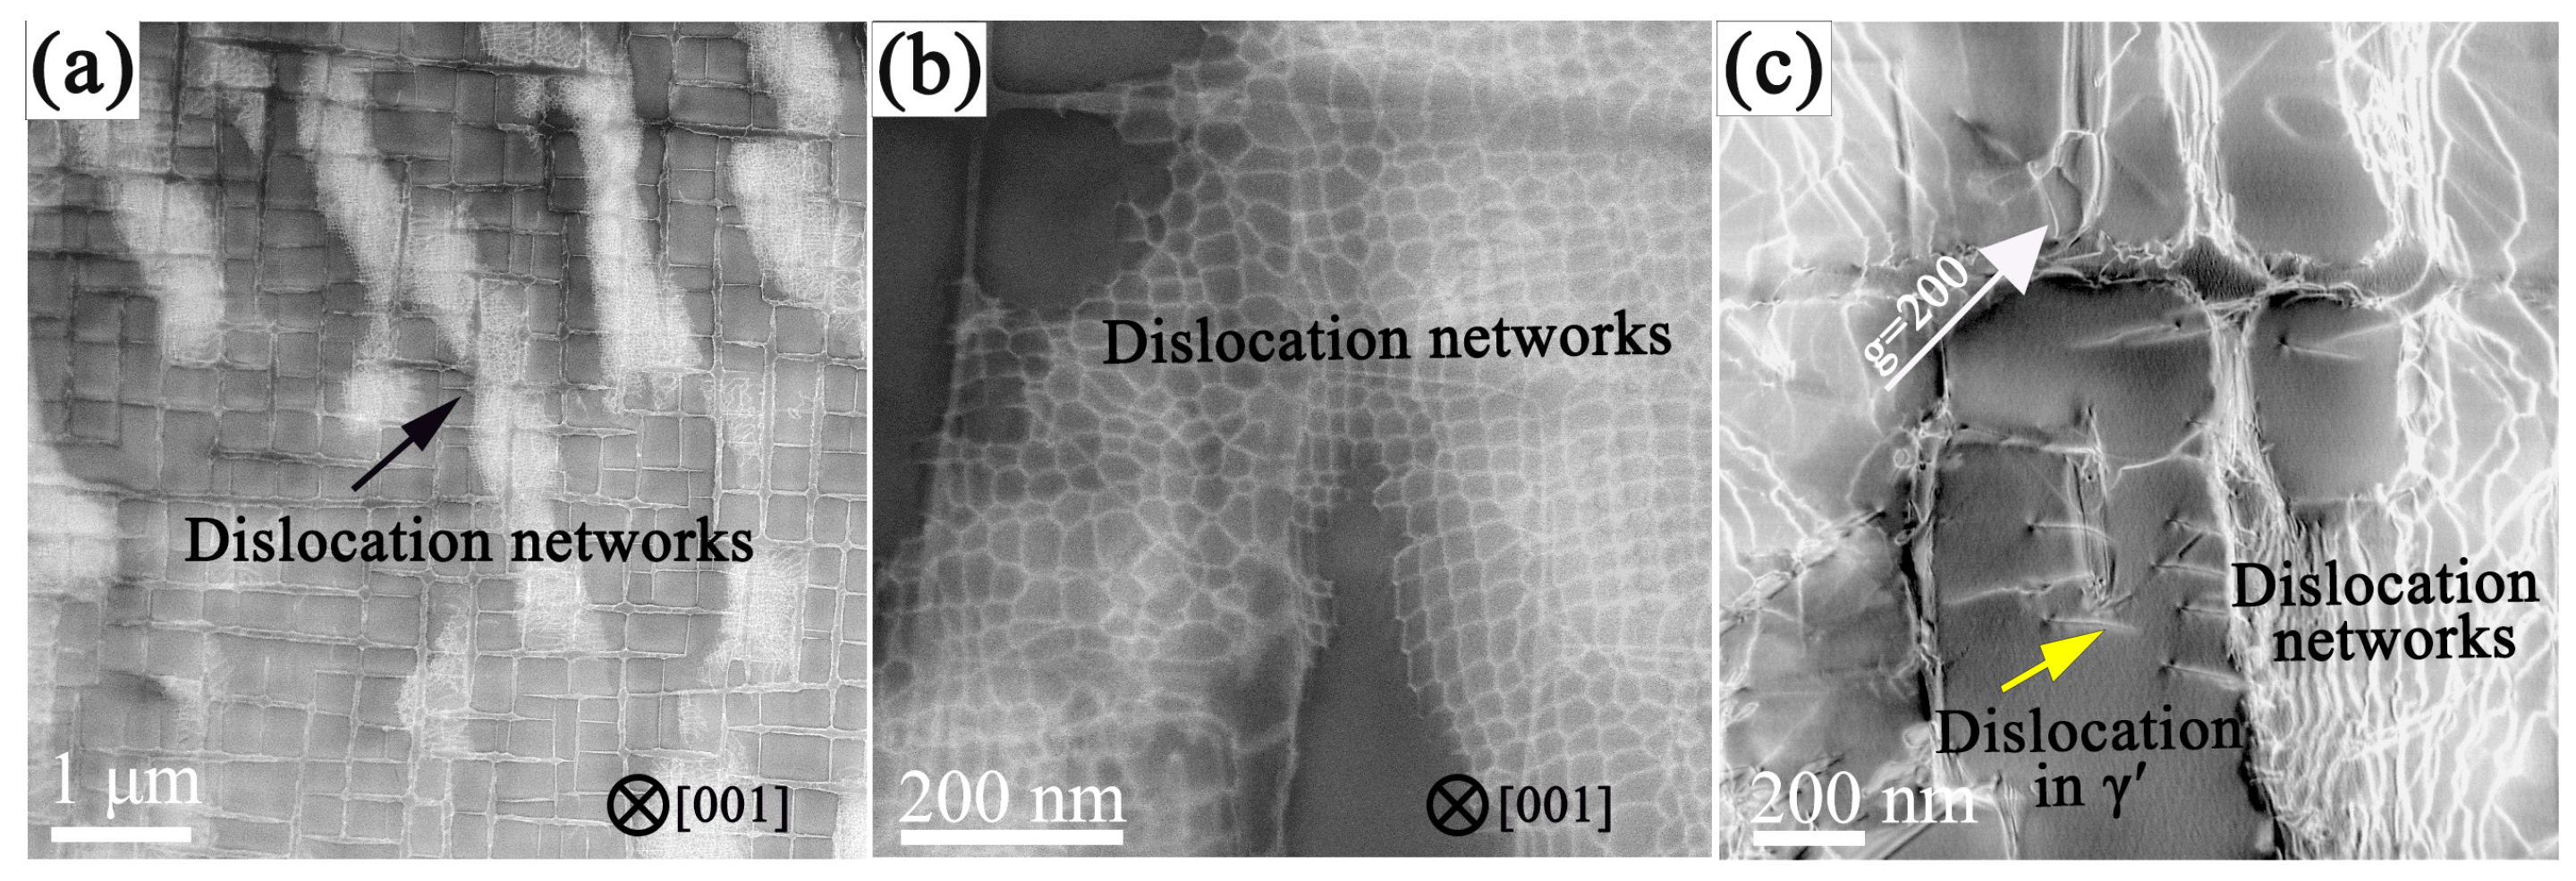
As the strain amplitude increased from 0.6 to 1.0%, more dislocation networks were formed, and the formation rate accelerated. The appearance of interfacial dislocations reduced the lattice mismatch between the γ and γ′ phases, and the presence of dislocation networks that absorb mobile dislocations resulted in cyclic softening. The dislocation cutting into the γ′ phases is one of the reasons for cyclic softening at a strain amplitude of 1.0%.
(3)
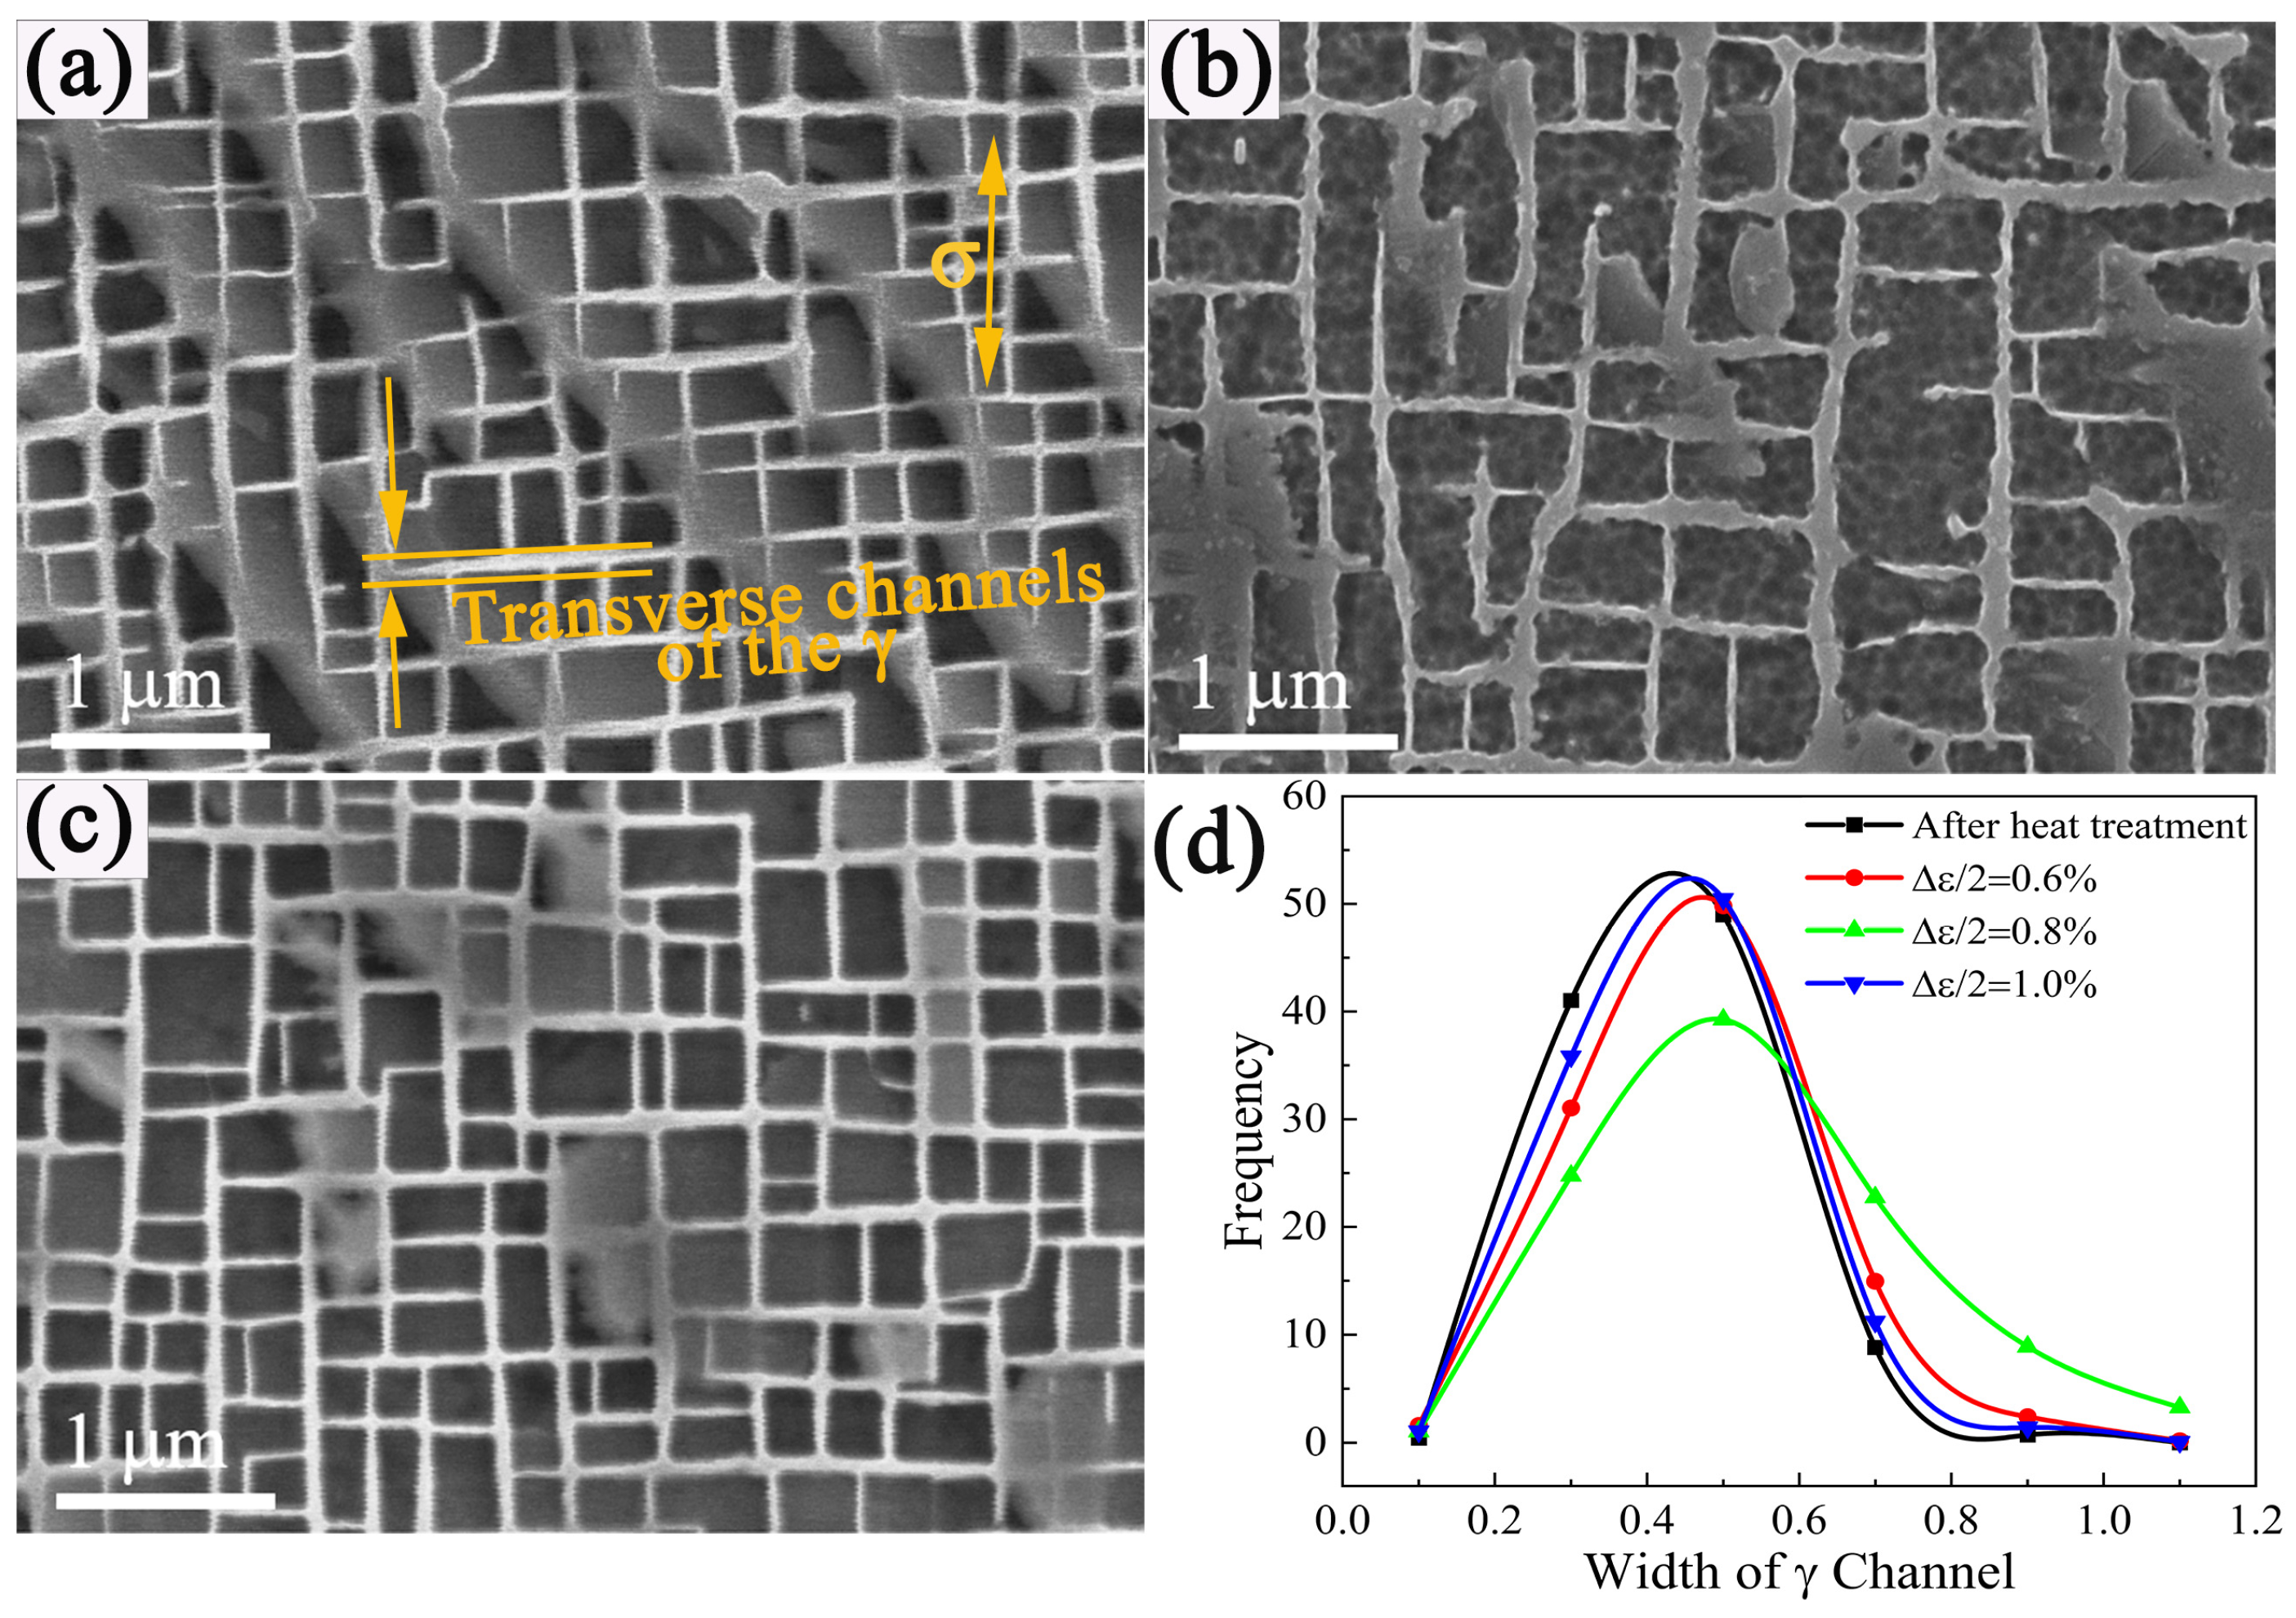
The decrease of the γ′ cubic degree and the width variation of the matrix channel was pronounced for a strain amplitude of 0.8%. The crack initiation site changed from a near-surface defect to a surface defect when the strain amplitude increased from 0.6 to 0.8 to 1.0%. The number of secondary cracks that were initiated from the micropores during the growth stage decreased as the strain amplitude increased.

Author Contributions

Conceptualization, P.W. and X.Z.; formal analysis, P.W.; investigation, P.W.; data curation, P.W.; writing—original draft, P.W.; writing—review and editing, P.W., X.Z., Q.Y., W.X. and Y.G.; visualization, P.W., W.X. and Y.G.; resources, X.Z.; project administration, Q.D., H.B. and Y.Z.; supervision, Z.Z. All authors have read and agreed to the published version of the manuscript.

Funding

This work was jointly supported by the National Natural Science Foundation of China (91960201 and 52101155), the National Science and Technology Major Project of China (J2019-Ⅲ-0008-0051), the Key Basic Research Program of Zhejiang Province (2020C01002), the Zhejiang Provincial Natural Science Foundation of China (LR22E010003), and the Fundamental Research Funds for central Universities (226-2022-00050). Thanks to the support of equipment and guidance of experiments of researchers in the Centre of Electron of Microscopy of Zhejiang University.

Data Availability Statement

Not applicable.

Conflicts of Interest

The authors declare that they have no known competing financial interest or personal relationships that could have appeared to influence the work reported in this paper.

References

  1. James, C.W.; Edgar., A.S. Progress in structural materials for aerospace systems. Acta Mater. 2003, 51, 5775–5799. [Google Scholar] [CrossRef]
  2. Cui, L.; Yu, J. The creep deformation mechanisms of a newly designed nickel-base superalloy. Mater. Sci. Eng. A 2018, 710, 309–317. [Google Scholar] [CrossRef]
  3. Xiong, W.J.; Ai, X.; Wang, J.F. Study of the Creep Behavior of Nickel-Based Single Crystal Superalloy Micro Specimens with Dimensional Effects. Crystals 2022, 12, 592. [Google Scholar] [CrossRef]
  4. Rouault, H.; Dupeux, M.; Ignat, M. High temperature tensile creep of CMSX-2 Nickel base superalloy single crystals. Acta Metall. Mater. 1994, 42, 3137–3148. [Google Scholar] [CrossRef]
  5. Ma, X.; Jiang, J.; Zhang, W. Effect of Local Recrystallized Grains on the Low Cycle Fatigue Behavior of a Nickel-Based Single Crystal Superalloy. Crystals 2019, 9, 312. [Google Scholar] [CrossRef]
  6. Reed, R.C. The Superalloys: Fundamentals and Applications, 1st ed.; Cambridge University Press: Cambridge, UK, 2006. [Google Scholar] [CrossRef]
  7. Liu, L.; Meng, J.; Liu, J. Investigation on low cycle fatigue behaviors of the (001) and (011) oriental single crystal superalloy at 760 °C. Mater. Sci. Eng. A 2018, 734, 1–6. [Google Scholar] [CrossRef]
  8. Jiang, R.; Bull, D.; Evangelou, A. Strain accumulation and fatigue crack initiation at pores and carbides in a SX superalloy at room temperature. Int. J. Fatigue 2018, 114, 22–33. [Google Scholar] [CrossRef]
  9. Wang, X.G.; Liu, J.L.; Jin, T. Deformation mechanisms of a nickel-based single-crystal superalloy during low-cycle fatigue at different temperatures. Scr. Mater. 2015, 99, 57–60. [Google Scholar] [CrossRef]
  10. Carter, T.J. Common failures in gas turbine blades. Eng. Fail. Anal. 2005, 12, 237–247. [Google Scholar] [CrossRef]
  11. Brien, V.; Decamps, B. Low cycle fatigue of a nickel-based superalloy at high temperature: Deformation microstructures. Mater. Sci. Eng. A 2001, 316, 18–31. [Google Scholar] [CrossRef]
  12. Wang, B.Z.; Liu, D.S.; Wen, Z.X. Tension/compression asymmetry of single-crystal nickel-based superalloy DD6 during low cycle fatigue. Mater. Sci. Eng. A 2014, 593, 31–37. [Google Scholar] [CrossRef]
  13. Auerswald, J.; Mukherji, D.; Chen, W. Deformation behaviour of the single crystal superalloy SC16 under low cycle fatigue loading. Z. Metallkd. 1997, 88, 652–658. [Google Scholar] [CrossRef]
  14. Zhang, J.H.; Hu, Z.Q.; Xu, Y.B. Dislocation structure in a single-crystal nickel-base superalloy during low cycle fatigue. Metall. Mater. Trans. A 1992, 23, 1253–1258. [Google Scholar] [CrossRef]
  15. Huang, E.W.; Barabash, R.I.; Wang, Y.D. Plastic behavior of a nickel-based alloy under monotonic-tension and low-cycle-fatigue loading. Int. J. Plast. 2008, 24, 1440–1456. [Google Scholar] [CrossRef]
  16. Gabb, T.P.; Welsch, G.; Miner, R.V. The characteristics of γ′ dislocation pairs in a nickel-base superalloy. Scr. Mater. 1987, 21, 987–992. [Google Scholar] [CrossRef]
  17. Gabb, T.P.; Welsch, G. The cyclic stress-strain behavior of a nickel-base superalloy at 650 °C. Scr. Mater. 1986, 20, 1049–1054. [Google Scholar] [CrossRef]
  18. Huang, M.; Zhao, L.; Tong, J. Discrete dislocation dynamics modelling of mechanical deformation of nickel-based single crystal superalloys. Int. J. Plast. 2012, 28, 141–158. [Google Scholar] [CrossRef]
  19. Neu, R.W. Crack paths in single-crystal Ni-base superalloys under isothermal and thermomechanical fatigue. Int. J. Fatigue 2019, 123, 268–278. [Google Scholar] [CrossRef]
  20. Hong, H.U.; Kang, J.G.; Choi, B.G. A comparative study on thermomechanical and low cycle fatigue failures of a single crystal nickel-based superalloy. Int. J. Fatigue 2011, 33, 1592–1599. [Google Scholar] [CrossRef]
  21. Gabb, T.P.; Welsch, G. The high temperature deformation in cyclic loading of a single crystal nickel-base superalloy. Acta Metall. 1989, 37, 2507–2516. [Google Scholar] [CrossRef]
  22. Fan, Y.S.; Yang, X.G.; Shi, D.Q. A quantitative role of rafting on low cycle fatigue behaviour of a directionally solidified Ni-based superalloy through a cross-correlated image processing method. Int. J. Fatigue 2020, 131, 105305. [Google Scholar] [CrossRef]
  23. Fritzemeier, L.; Tien, J. The cyclic stress-strain behavior of nickel-base superalloys—II. Single crystals. Acta Metall. 1988, 36, 283–290. [Google Scholar] [CrossRef]
  24. Fleury, E.; Remy, L. Low cycle fatigue damage in nickel-base superalloy single crystals at elevated temperature. Mater. Sci. Eng. A 1993, 167, 23–30. [Google Scholar] [CrossRef]
  25. Hong, H.U.; Choi, B.G.; Kim, I.S. Characterization of deformation mechanisms during low cycle fatigue of a single crystal nickel-based superalloy. J. Mater. Sci. 2011, 46, 5245–5525. [Google Scholar] [CrossRef]
  26. Shishvan, S.S.; Mcmeeking, R.M.; Pollock, T.M. Discrete dislocation plasticity analysis of the high-temperature cyclic response of composites. Mater. Sci. Eng. A 2018, 712, 714–719. [Google Scholar] [CrossRef]
  27. Zhou, H.; Ro, Y.; Haradah, H. Deformation microstructures after low-cycle fatigue in a fourth-generation Ni-base SC superalloy TMS-138. Mater. Sci. Eng. A 2004, 381, 20–27. [Google Scholar] [CrossRef]
  28. Pyczak, F.; Neumeier, S.; Goeken, M. Influence of lattice misfit on the internal stress and strain states before and after creep investigated in nickel-base superalloys containing rhenium and ruthenium. Mater. Sci. Eng. A 2009, 510, 295–300. [Google Scholar] [CrossRef]
  29. Warren, P.J.; Cerezo, A.; Smith, G. An atom probe study of the distribution of rhenium in a nickel-based superalloy. Mater. Sci. Eng. A 1998, 250, 88–92. [Google Scholar] [CrossRef]
  30. Khan, T.; Caron, P. Development of a New Single Crystal Superalloy for Industrial Gas Turbines. Superalloys 2000, 729–734. [Google Scholar] [CrossRef]
  31. Pineau, A.; Antolovich, S. Intergranular Fatigue; John Wiley & Sons, Inc.: Hoboken, NJ, USA, 2013. [Google Scholar] [CrossRef]
  32. Cui, L.; Yu, J.; Liu, J. Cyclic stress responses of a newly developed nickel-base superalloy at elevated temperatures. J. Alloys Compd. 2019, 773, 250–263. [Google Scholar] [CrossRef]
  33. Miller, M.D.; Reed, P.A.S.; Joyce, M.R. Effect of environment on notch fatigue behaviour in CMSX4. Meter. Sci. Tech.-Lond. 2007, 23, 1439–1445. [Google Scholar] [CrossRef]
  34. Reed, P.A.S. Fatigue crack growth mechanisms in superalloys: Overview. Mater. Sci. Tech.-Lond. 2009, 25, 258–270. [Google Scholar] [CrossRef]
  35. Liu, L.; Meng, J.; Liu, J.L. Effects of Crystal Orientations on the Low-Cycle Fatigue of a Single-Crystal Nickel-Based Superalloy at 980 °C. Acta Metall. Sin. 2019, 32, 381–390. [Google Scholar] [CrossRef]
  36. Hardy, M.; Huron, E.; Glatzl, U. Oxide Scale Formation in Novel γ-γ′ Cobalt-Based Alloys. Superalloys 2016, 991–999. [Google Scholar] [CrossRef]
  37. Fan, Z.D.; Wang, D.; Lou, L.H. Corporate Effects of Temperature and Strain Range on the Low Cycle Fatigue Life of a Single-Crystal Superalloy DD10. Acta Metall. Sin. 2015, 28, 152–158. [Google Scholar] [CrossRef]
  38. Guo, Y.Y.; Zhao, Y.S.; Zhang, J. Effect of Strain Amplitude on Cyclic Deformation Behavior of Nickel-Based Single Crystal Superalloy DD11 in Low Cycle Fatigue. Rare Met. Mater. Eng. 2019, 48, 366–374. [Google Scholar]
  39. Zhang, J.X.; Murakumo, T.; Koizumi, Y. Slip geometry of dislocations related to cutting of the γ′ phase in a new generation single-crystal superalloy. Acta Mater. 2003, 51, 5073–5081. [Google Scholar] [CrossRef]
  40. Wang, X.G.; Liu, J.L.; Jin, T. Creep deformation related to dislocations cutting the γ′ phase of a Ni-base single crystal superalloy. Mater. Sci. Eng. A 2015, 626, 406–414. [Google Scholar] [CrossRef]
  41. Decamps, B.; Brien, V.; Moreon, A.J. Deformation microstructures after low-cycle fatigue at 950 °C in Ni-based superalloys: The effect of test conditions. Scr. Metall. Mater. 1994, 31, 793–798. [Google Scholar] [CrossRef]
  42. Ding, Q.; Bei, H.; Yao, X. Temperature effects on deformation substructures and mechanisms of a Ni-based single crystal superalloy. Appl. Mater. Today 2021, 23, 101061. [Google Scholar] [CrossRef]
  43. Feller-Kniepmeier, M.; Link, T. Temperature dependence of deformation mechanisms in a single crystal nickel-base alloy with high volume fraction of γ′ phase. Acta Mater. 1996, 44, 2397–2407. [Google Scholar] [CrossRef]
  44. Field, R.D.; Pollock, T.M.; Murphy, W.H. The Development of γ/γ′ Interfacial Dislocation Networks During Creep in Ni-Base Superalloys. Superalloys 1992, 557–566. [Google Scholar] [CrossRef]
  45. Lin, B.; Huang, M.; Zhao, L. 3D DDD modelling of dislocation–precipitate interaction in a nickel-based single crystal superalloy under cyclic deformation. Philos. Mag. 2018, 98, 1550–1575. [Google Scholar] [CrossRef]
  46. Yin, Q.; Lian, Y.; Wen, Z. Atomic simulation of the effect of orientation on tensile/compressive properties in nickel-based single crystal superalloys. J. Alloys Compd. 2022, 893, 162210. [Google Scholar] [CrossRef]
  47. Li, P.; Li, S.X.; Wang, Z.G.; Zang, Z.F. Fundamental factors on formation mechanism of dislocation arrangements in cyclically deformed fcc single crystals. Prog. Mater. Sci. 2010, 56, 328–377. [Google Scholar] [CrossRef]
  48. Tian, S.G.; Zhou, H.H.; Zhang, J.H. Formation and role of dislocation networks during high temperature creep of a single crystal nickel–base superalloy. Mater. Sci. Eng. A 2000, 279, 160–165. [Google Scholar] [CrossRef]
  49. Bin, C.; Wu, W.P. Molecular dynamics study of fatigue mechanical properties and microstructural evolution of Ni-based single crystal superalloys under cyclic loading. Comput. Mater. Sci. 2020, 185, 109954. [Google Scholar] [CrossRef]
Figure 1. Cyclic stress response curves of experimental alloys at varying strain amplitudes during low-cycle fatigue deformation.
Crystals 13 00686 g001
Figure 2. Typical hysteresis loops of the alloy under varying strain amplitudes: (a) first cycle and (b) stabilized cycle.
Crystals 13 00686 g002
Figure 3. Surface morphologies and oxide layer near the surface of specimens after failure: (a,d,g); Δεt/2 = 0.6%, (b,e,h); Δεt/2 = 0.8%, and (c,f,i); Δεt/2 = 1.0%.
Crystals 13 00686 g003
Figure 4. Scanning electron microscope (SEM) energy-dispersive X-ray spectroscopy (EDS),(SEM-EDS), maps of the micropores after fatigue at 980 °C under Δεt/2 = 0.8%.
Crystals 13 00686 g004
Figure 5. Microstructures of the longitudinal profile: (a) Δεt/2 = 0.6%, (b) Δεt/2 = 0.8%, and (c) Δεt/2 = 1.0%. (d) Width of the transverse channels of the γ phase.
Crystals 13 00686 g005
Figure 6. Transmission electron microscope (TEM) bright field (BF) images showing dislocation configurations of an alloy at 980 °C under Δεt/2 = 0.6%: (a) distribution of the dislocations; (b) bowing and tangled dislocations; and (c) formation of dislocation networks.
Crystals 13 00686 g006
Figure 7. TEM-BF images showing dislocation configurations of an alloy at 980 °C under Δεt/2 = 0.8%: (a) distribution of the dislocations; (b) dislocation networks and bowing dislocations; and (c) formation of dislocation networks.
Crystals 13 00686 g007
Figure 8. TEM-BF images showing dislocation configurations of an alloy at 980 °C under Δεt/2 = 1.0%: (a) distribution of the dislocations; (b) formation of dislocation networks; and (c) dislocation in the γ′ phase.
Crystals 13 00686 g008
Figure 9. Dislocation networks under different strain amplitudes of an alloy at 980 °C: (a) Δεt/2 = 0.6%, (b) Δεt/2 = 0.8%, and (c) Δεt/2 = 1.0%.
Crystals 13 00686 g009
Table 1. Nominal composition of experimental alloy (wt.%).
Al + TaCo + CrMo + WRe + RuNi
12%8%9%7.5%Bal.%
Disclaimer/Publisher’s Note: The statements, opinions and data contained in all publications are solely those of the individual author(s) and contributor(s) and not of MDPI and/or the editor(s). MDPI and/or the editor(s) disclaim responsibility for any injury to people or property resulting from any ideas, methods, instructions or products referred to in the content.

