Article

Determination of Nicotine in Human Saliva Using Electrochemical Sensor Modified with Green Synthesized Silver Nanoparticles Using Phyllanthus reticulatus Fruit Extract

by
Gokul Sridharan
1,†,
Kaushik L. Babu
2,†,
Dhanraj Ganapathy
1,
Raji Atchudan
3,†,
Sandeep Arya
4 and
Ashok K. Sundramoorthy
1,*
1
Centre for Nano-Biosensors, Department of Prosthodontics, Saveetha Dental College and Hospitals, Saveetha Institute of Medical and Technical Sciences, Poonamallee High Road, Velappanchavadi, Chennai 600077, Tamil Nadu, India
2
Saveetha Medical College and Hospitals, Saveetha Institute of Medical and Technical Sciences (SIMATS), Saveetha Nagar, Chennai 602105, Tamil Nadu, India
3
School of Chemical Engineering, Yeungnam University, Gyeongsan 38541, Republic of Korea
4
Department of Physics, University of Jammu, Jammu 180006, Jammu and Kashmir, India
*
Author to whom correspondence should be addressed.
These authors contributed equally.
Crystals 2023, 13(4), 589; https://doi.org/10.3390/cryst13040589
Submission received: 28 February 2023 / Revised: 23 March 2023 / Accepted: 24 March 2023 / Published: 30 March 2023

Abstract

:
In this study, for the first time, Phyllanthus Reticulatus fruit extract was utilized as a reducing agent in the synthesis of silver nanoparticles (Ag-NPs). For sample analysis, a number of approaches were employed. The synthesized Ag-NPs have a spherical shape and a homogeneous in size. The well-known crystal structure and optical energy absorption spectrum of Ag-NPs were respectively revealed by the XRD and UV-VIS analysis. This new method is simple and eco-friendly for producing silver and other noble metals in large quantities. The Ag-NPs modified glassy carbon electrode was prepared for nicotine oxidation which indicated that Ag NPs had the ability to enhance the electron transfer rate of the oxidation process. In 0.1 M phosphate buffer (pH of 7.4), a significant increase in the oxidation peak current of nicotine was observed at the modified electrode. Cyclic voltammetry, amperometry, and electrochemical impedance spectroscopy characterizations showed that Ag-NPs had better electrocatalytic performance toward nicotine (NIC) oxidation with good stability, and selectivity. This sensor showed a linear response with the concentration of NIC in the range of 2.5 to 105 μM. The limit of detection (LOD) was estimated to be 0.135 μM. The interference analysis was carried out on the Ag-NPs/GCE with various molecules like acetic acid, ascorbic acid, calcium chloride, glucose, magnesium chloride, urea, and uric acid. Hence, these molecules did not interfere with NIC detection, indicating a perfect selectivity of Ag-NPs/GCE. Moreover, the Ag-NPs/GCE sensor was effectively applied to detect NIC in a real-world sample (saliva) of a tobacco chewer. Furthermore, the Ag-NPs/GCE sensor exhibited very good stability and repeatability in human saliva samples. Finally, Ag-NPs/GCE was also successfully applied to detect spiked nicotine in saliva samples with high recovery value, indicating its high accuracy and effectiveness in NIC analysis.

1. Introduction

A common practice around the world is now smoking and using tobacco products. Both active and passive smokers who consume Tobacco products are seriously harmed by their obsession with them. Each year, the use of tobacco products and smoking has an impact on more than 8 million people [1]. The addictive substance present in cigarettes and tobacco is known as nicotine (NIC) which has a negative impact on human health. Nicotiana tabacum is a plant species that produces NIC, a natural pyridine alkaloid. The chemical formula and IUPAC name for nicotine are C10H14N2, and 3-[(2S)-1-methylpyrrolidin-2-yl]pyridine, respectively [2]. The nicotine liquid is clear to light brown or yellow in color. NIC is exceedingly toxic and addictive, because it stimulates the brain, raises blood pressure, quickens the heartbeat and contributes to a number of risk factors [3]. Tobacco leaves are the primary component used to produce cigarettes, cigars, and flake tobacco. NIC makes roughly about 0.6–3.0% of the dry weight of tobacco and each cigarette contains ~2 mg of nicotine [4]. The liver breaks down nicotine into a variety of metabolites, although cotinine, a lactam derivative, is the most significant nicotine metabolite in the mammalian species. Approximately 70–80% of nicotine is metabolized into cotinine in humans (Figure 1). The conversion of NIC to cotinine involves two distinct stages. Initially, a particular enzyme known as microsomal P450 catalyzes the conversion of nicotine to an iminium ion with the nitrogen atom in the 1’ position and the carbon atom in the 5’ position. Following this, the cytosolic aldehyde oxidase enzyme catalyzes the conversion of this iminium ion to cotinine [5,6].
NIC is easily absorbed when it enters the alveoli, where it causes serious respiratory conditions as well as cancer [7]. In a non-smoker, the usual range of NIC values is less than 10 ng/mL [8]. By the way, NIC can be used therapeutically and as an insecticide, albeit it is eventually supplanted by its derivative neonicotinoids [4]. Numerous analytical techniques can be used to detect NIC in human samples such as sweat, saliva, urine and blood [9]. Gas chromatography (GC), capillary electrophoresis [10], High-performance liquid chromatography (HPLC) [11], spectroscopy, chemiluminescence [12], radio-immunoassay [13], diode array detection and other methods were also used to detect NIC content [11]. However, there are some limitations and drawbacks to each of these methods. They depend on expensive set up, required highly qualified technical personnel, extensive sample preparation, longer duration for analysis, etc. [14,15]. In recent years, electrochemical sensors have been tested for their applications across all industries due to their low price, simplicity, robustness, sensitivity, and speed [16,17,18,19,20,21,22,23]. Among the other methods, cyclic voltammetry and amperometry have numerous advantages to study the electrochemical activities of NIC [24]. Herein, we have developed an electrochemical sensor using green synthesized silver nanoparticles (Ag-NPs) as an electrocatalytic material using a berry fruit called Phyllanthus reticulatus (PER) as a reducing agent, which is commonly found in the southern part of India. As of now, no one reported this fruit as a reducing agent to synthesize silver nanoparticles. It is well known that noble metal nanoparticles are versatile agents which are widely acknowledged to have significant applications in a wide variety of fields. Metallic silver nanoparticles in particular are crucial for advanced sensor technology because they demonstrate traits typically associated with noble metals (high conductivity, chemical stability, non-linear optical behavior, etc.) and unique properties such as high catalytic activity and antibacterial action [25]. Thus, silver nanoparticles have been synthesized using a variety of techniques, including hydrothermal [9], microwave [26], electrochemical [27], and green chemistry [28]. Some of these systems have the disadvantages of the high cost of operation, toxic materials, and energy requirements. The process of green synthesis involves using of natural resources like plant biomass, plant extracts, or microorganisms to produce nanoparticles, and offers a more environmentally friendly alternative to the traditional chemical and physical methods. Thus, green synthesis is increasingly being explored as a promising approach for synthesizing nanoparticles in a sustainable manner [29]. The main objective of this research was to create silver nanoparticles effectively by eco-friendly green synthesis method and use them to prepare the electrochemical sensor for determination of NIC. X-ray diffraction (XRD), UV visible spectroscopy (UV–VIS), and Field emission scanning electron microscopy (FESEM) were used for the characterizations of as-prepared Ag-NPs. It is worth mentioning that the determination of NIC was carried out by others using Potentiometric paper sensors [24], carbon Nanofiber-Poly(amidoamine) dendrimer-altered glassy carbon electrode [10], and biosynthesized gold nanoparticles [30]. In this method, for the first time, synthesis of Ag-NPs was carried out using fruit extract obtained from Phyllanthus reticulatus and also prepared an electrochemical sensor for detection of NIC with high selectivity.

2. Experimental

2.1. Materials

Phyllanthus reticulatus (PER) fruits were collected (from Kattankulathur, Chengalpattu district, Tamil Nadu, India), washed and stored at 4 °C in an airtight vial for further work. Silver nitrate (AgNO3) was procured from Sigma Aldrich, India. The all-other reagents were of analytical grade and used without further purification. Nicotine (C10H14N2) was procured from Sigma-Aldrich. The solutions used in the experimental procedure were freshly prepared using deionized (DI) water and kept away from the light to prevent any photochemical reactions.

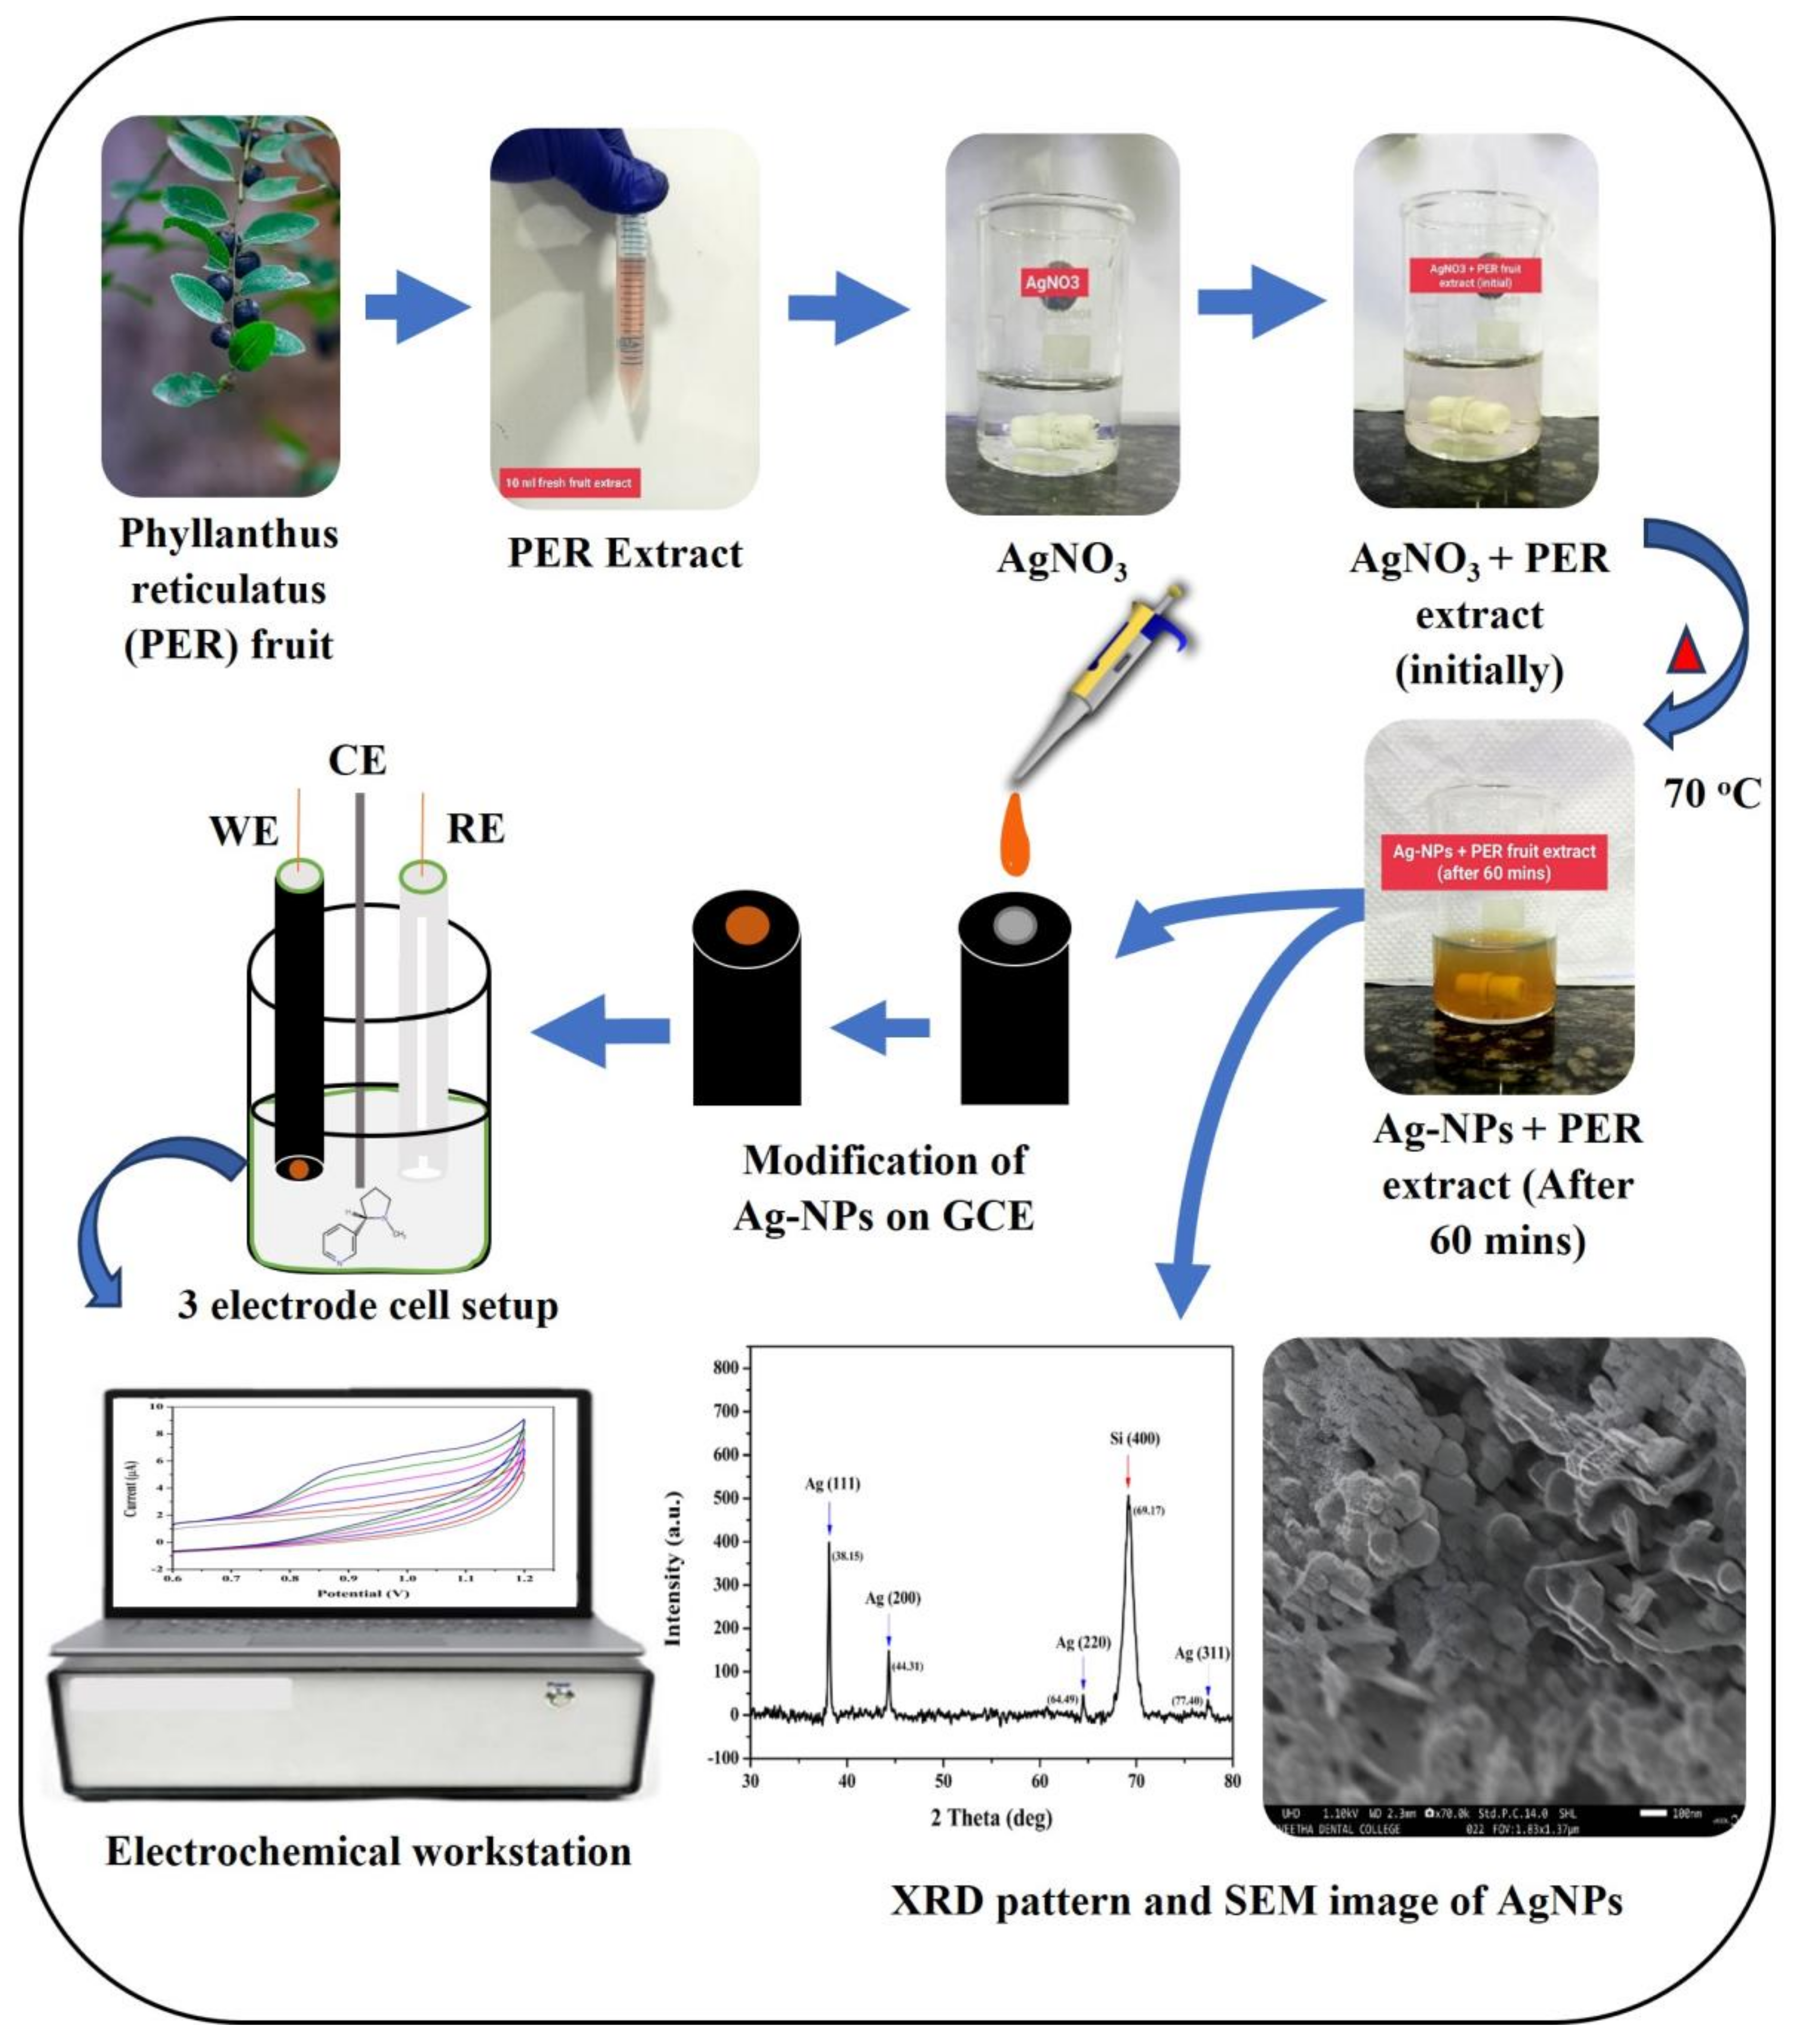
2.2. Synthesis of Silver Nanoparticles (Ag-NPs)

The 10 mL of AgNO3 solution (1 mM) was taken in a 25 mL glass beaker and wrapped with an aluminum foil, because of its light-sensitive property [31]. 0.2075 g of fresh fruits were taken in 10 mL of DI H2O and smashed to extract the dye, filtered the supernatant of the raw fruit, and the extract was stored at 4 °C. Finally, 1.5 mL of PER fruit extract (supernatant) was mixed with AgNO3 in a proportion of 1.5:10. This mixture was stirred continuously using a magnetic stirrer at 800 rpm and heated up to 70 °C. Within an hour, the color of the mixture changed to reddish-brown, which led to the change in absorption spectrum and indicated the formation of silver nanoparticles. The entire reaction was carried out with an aluminum-wrapped glass beaker. Then, the solution was transferred into an aluminum wrapped 15 mL centrifuge tube and kept under 4 °C for future characterization (Figure 2).

2.3. Characterization

The UV-Jasco spectrophotometer was utilized to collect UV-visible spectra of Ag-NPs and PER fruit extract. Additionally, the shape and size of the nanoparticles formed were determined using FE-SEM. The morphological characteristics of the Ag-NPs were studied by subjecting a drop of dispersion that was cast onto an aluminum foil and observed by a (JEOL, JSM IT800, Tokyo, Japan) field emission scanning electron microscope (FE-SEM) operated at 1.10 kV. For this purpose, the Ag-NPs dispersion was drop casted onto an aluminum foil and dried on a hot plate, kept in a hot air oven overnight at 50 °C, and finally subjected to FE-SEM analysis. To confirm the crystalline structure of the Ag-NPs, an X-ray diffractometer (D8-Advance, BRUKER, Mannheim, Germany) was used to obtain an X-ray diffraction (XRD) pattern in the 2θ range of 20 to 90°. To prepare the sample for XRD measurement, the Ag-NPs dispersion was cast onto a silicon wafer substrate and then calcined at 400 °C for 3 h to convert the phase from amorphous to crystalline by elimination of organic components [32]. The XRD pattern was obtained using Cu Kα radiation with a wavelength of 1.5406 Å, at a voltage of 40 kV, and a current of 15 mA. The scan rate was 10°/min.

2.4. Electrochemical Measurements and Sensor Preparation

A CHI 760E electrochemical workstation was used for all electrochemical measurements (CH Instruments, Austin, TX, USA). Ag/AgCl stored in 1 M KCl was utilized as a reference electrode and platinum wire was utilized as a counter electrode in a standard three-electrode setup. A glassy carbon electrode (GCE) modified with Ag-NPs was utilized as a working electrode. Prior to the modification, GCE was polished to achieve a mirror-like surface using 0.05 µm alumina powder (Al2O3) on a polishing cloth and bath-sonicated in DI H2O. After that, 10 cycles of potential scanning between 0.5 and 1.0 V were used to electrochemically treat GCE in 0.1 M H2SO4. This treated GCE’s surface was then drop-casted with 7 µL of Ag-NPs dispersion and was dried at 50 °C. After that, Ag-NPs/GCE was carefully dipped into 10 mL of DI H2O to remove the unbounded nanoparticles from the electrode surface, it was later dried at room temperature for a few minutes. Later, the same procedure was repeated for a second coat of Ag-NPs dispersion. Finally, before putting Ag-NPs/GCE into the phosphate buffer solution (PBS), as-prepared Ag-NPs/GCE was swept multiple cycles in 0.1 M KOH and then used to detect NIC in PBS.

2.5. Nicotine Standard Sample Preparation

1 mM stock solution of NIC sample was prepared by dissolving purchased NIC (C10H14N2) (3-(1-methyl2-pyrrolidinyl) pyridine) in 10 mL of DI H2O, and the prepared solution was bath sonicated for 5 minutes and stored at 4 °C for future use.

3. Results and Discussion

After the PER fruit extract was added to a 1 mM AgNO3 solution, the formation of nanoparticles (NPs) was observed. The color of the AgNO3/PER mixture changed from colorless to yellow to reddish brown, as shown in Figure 2, which demonstrated the formation of silver nanoparticles. Surface plasmon vibration, an optical characteristic that is exclusive to noble metals, is responsible for this shift in color [33]. UV-visible spectroscopy [34], field emission scanning electron microscopy [35], and X-ray diffraction [36] were also used to validate the production of Ag-NPs.

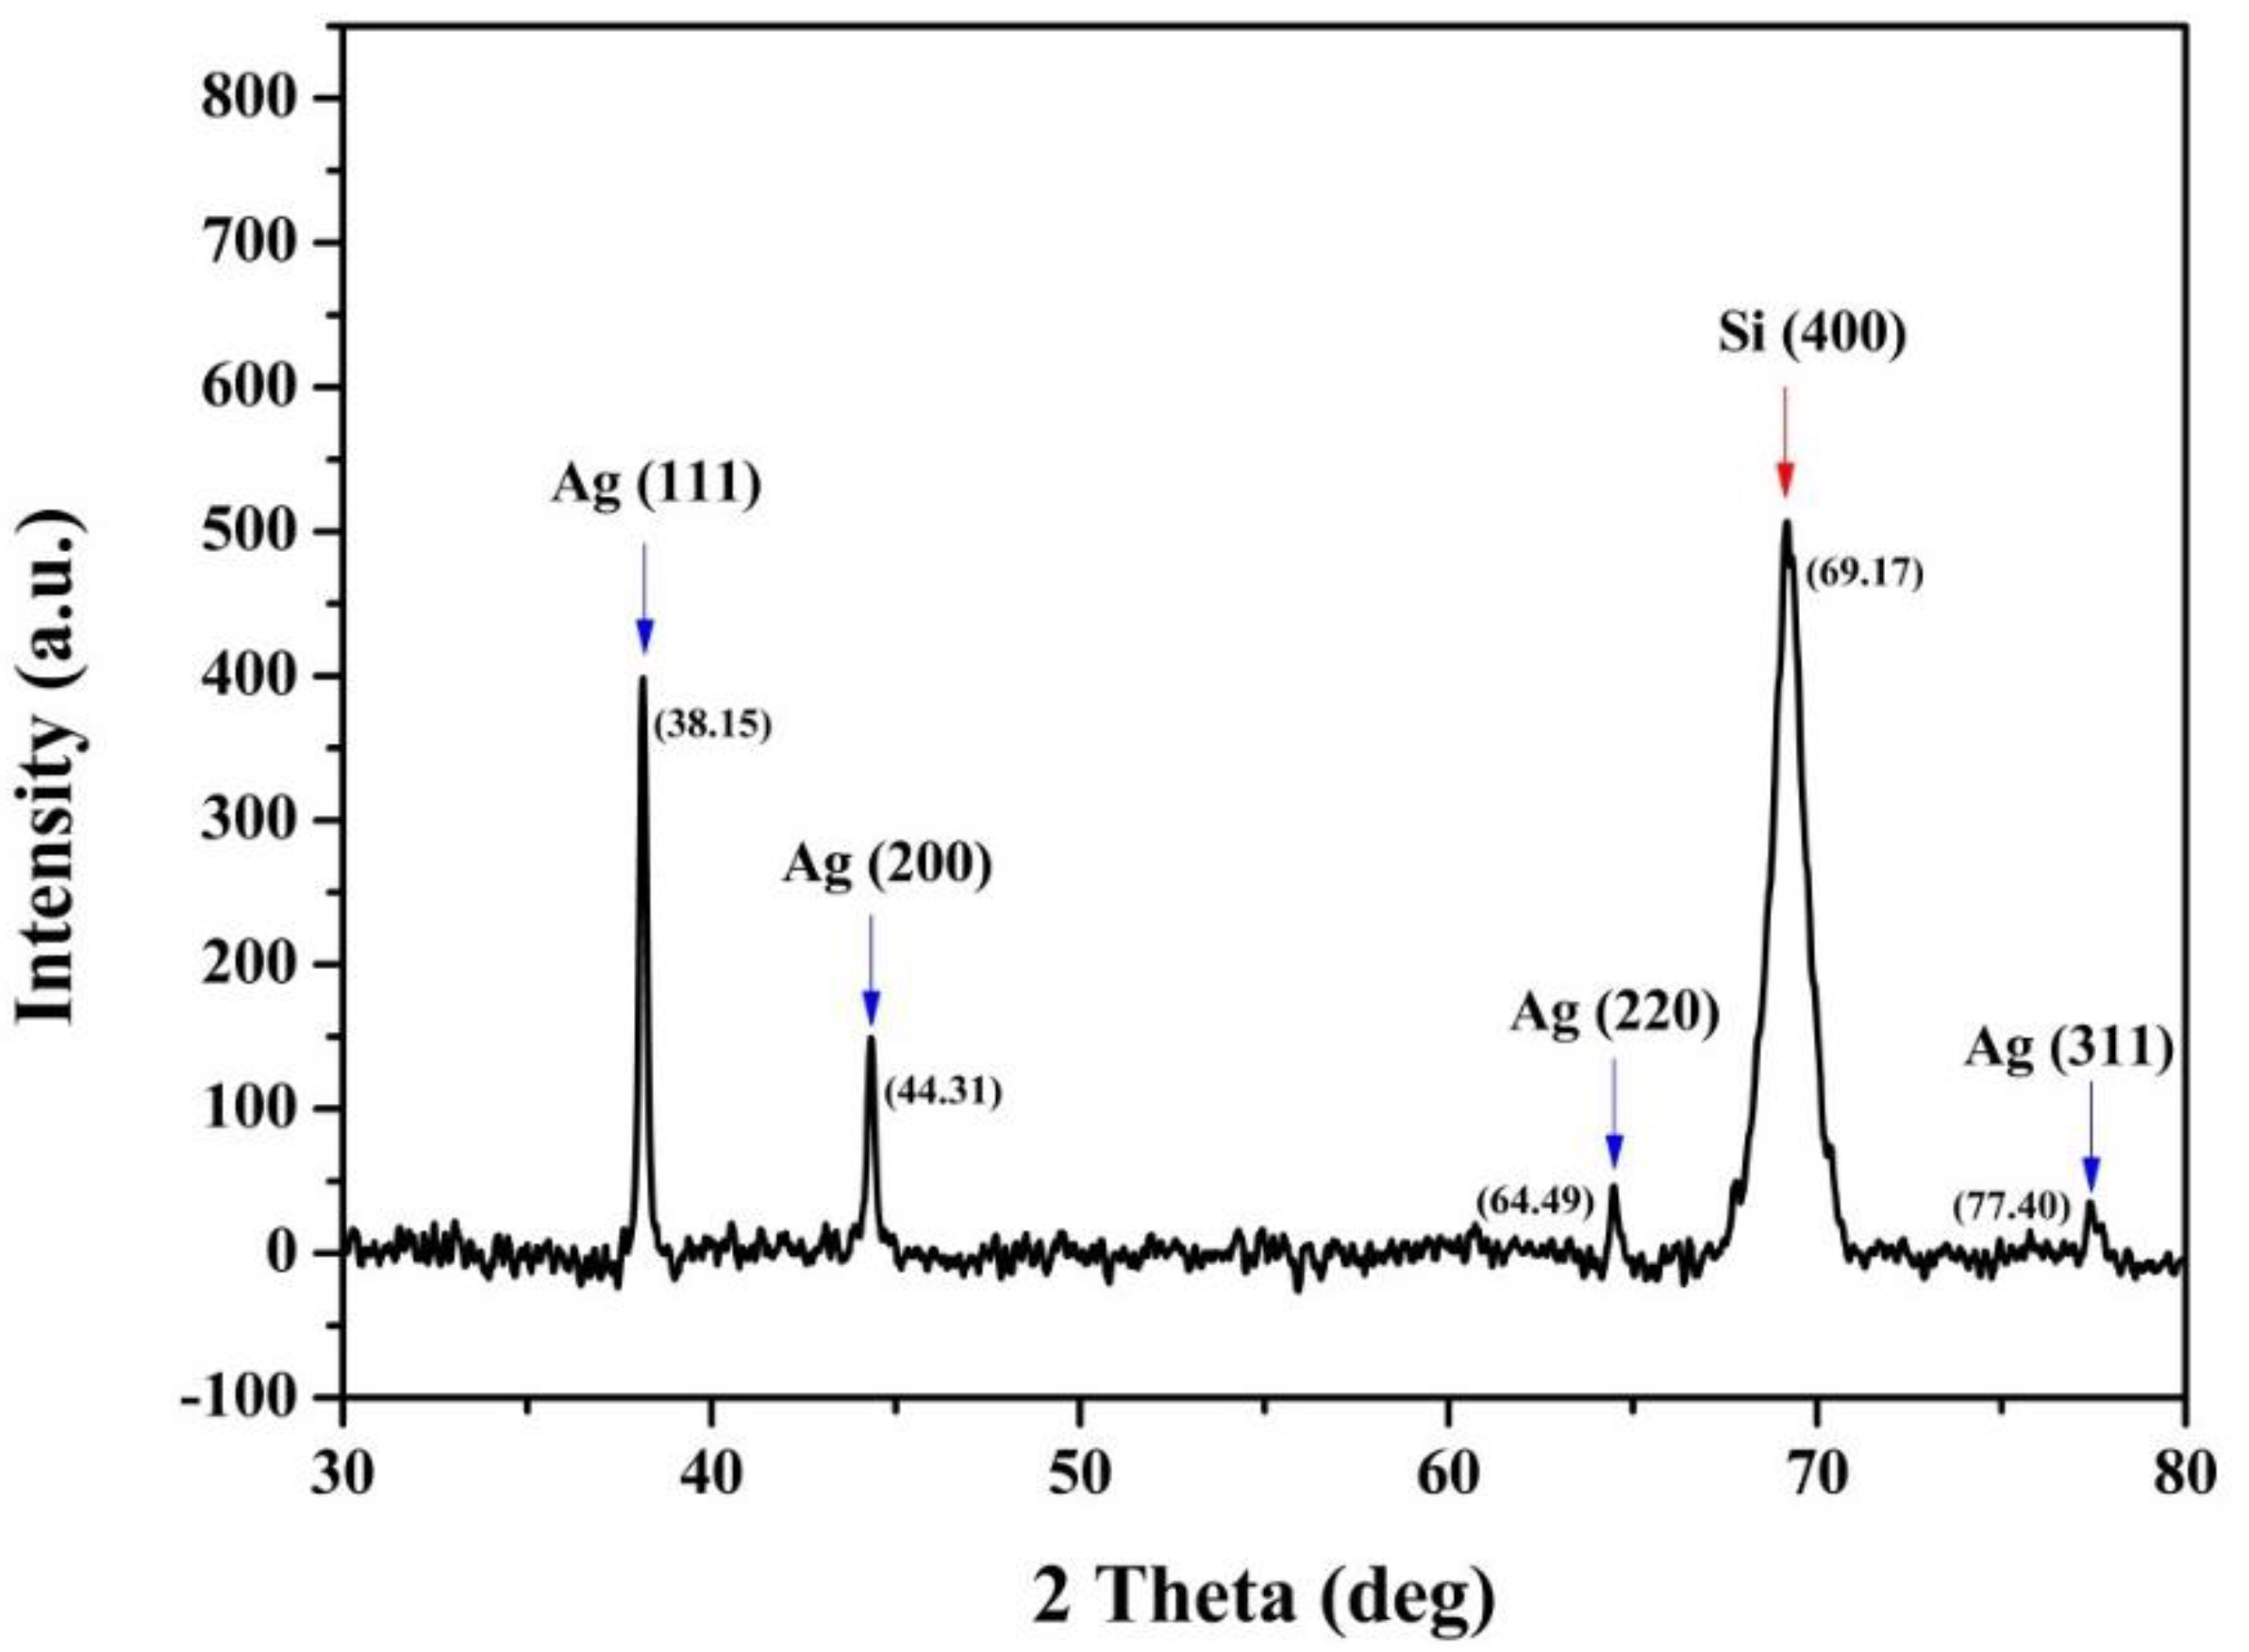
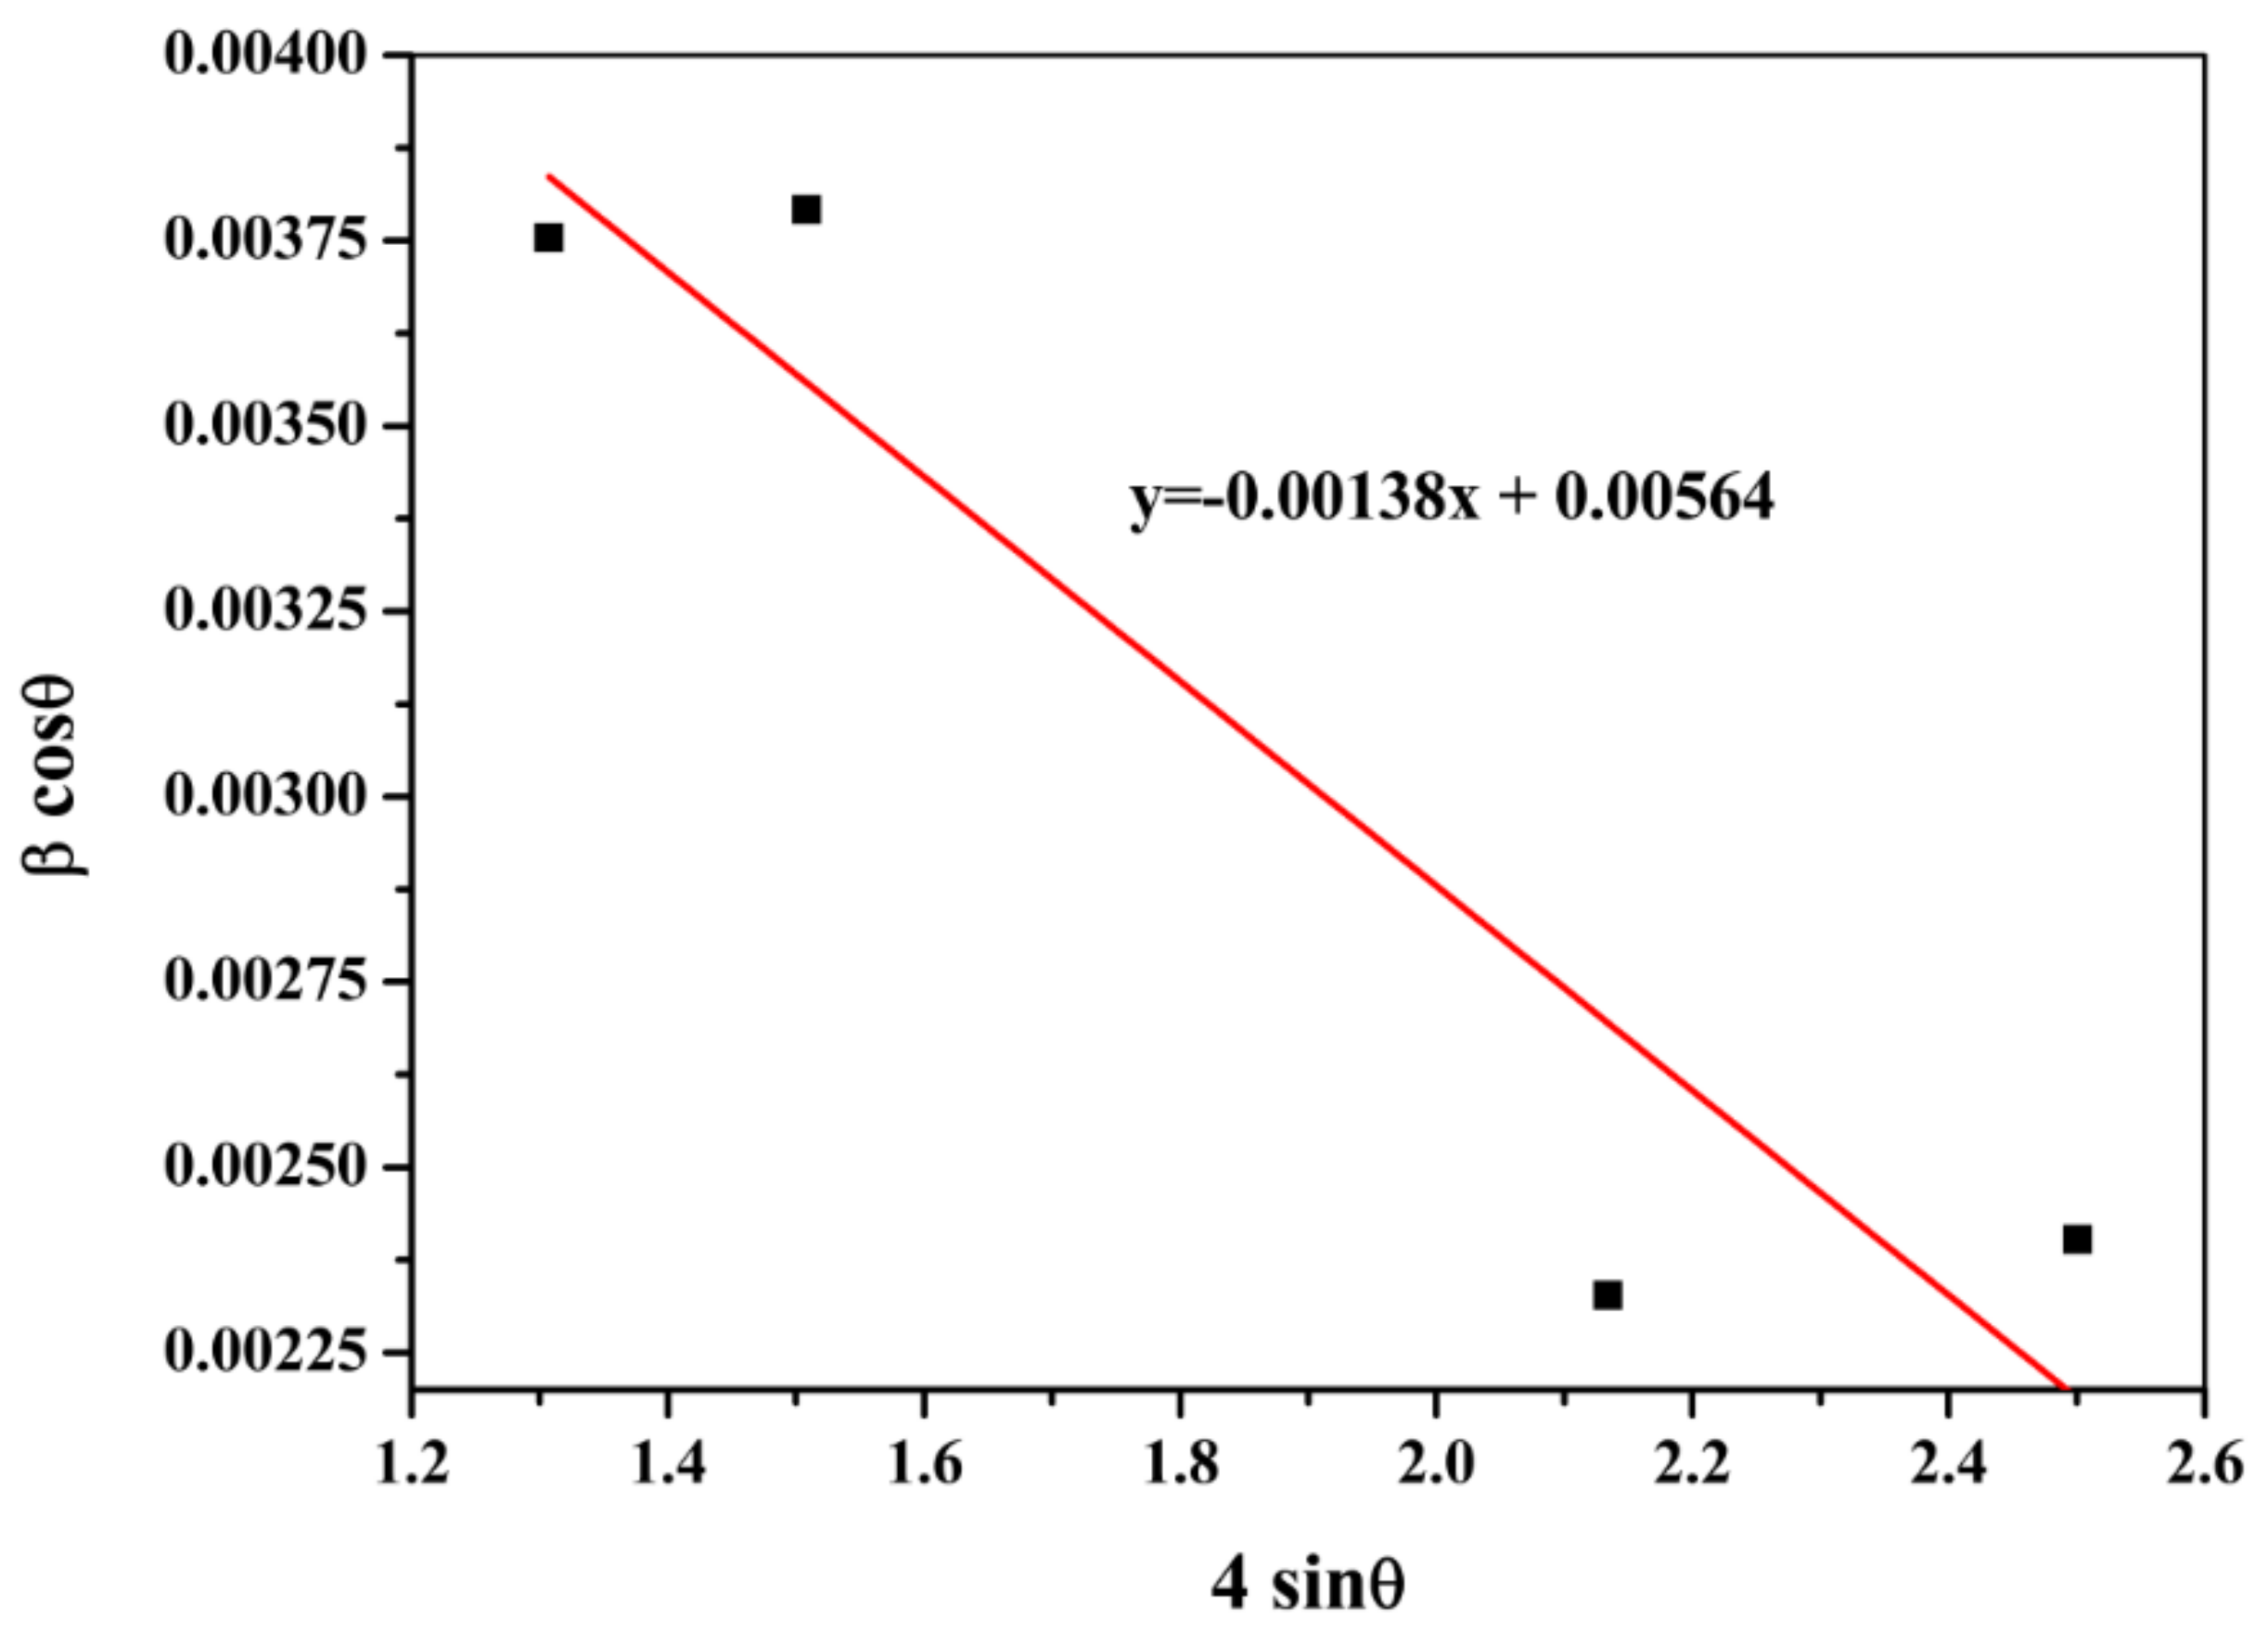
3.1. X-ray Diffraction Analysis

X-ray diffraction (XRD) is one of the most important techniques for identifying the structural properties of NPs. It gives sufficient information about the nanoparticles’ phase and crystallinity [37]. Figure 3 depicts the diffraction pattern of the Ag-NPs with the diffraction spots at 2θ values of 38°, 44.1°, 64.4°, and 77.3°, this pattern was consistent with the cubic phase of silver NPs and can be referenced to the (111), (200), (220), and (311) planes of the face-centered cubic (fcc) structure. The Scherrer equation was used to determine the typical crystallite size of the synthesized nanoparticles.
D = kλ/β cos θ
where, k is a dimensionless form factor (0.94), λ is the wavelength of Cu Kα’s, D is the average crystallite size, the diffraction peaks full-width half-maximum (FWHM) β, and (θ) Bragg’s angle which are all given in the formula of Equation (1).
The Williamson-Hall (WH) approach is based on the idea that the size and strain could be estimated by considering peak width as a function of the Bragg angle [38]. The average crystallite size and strain of Ag-NPs can be calculated from the angle of the line and the intersection at the y-axis, respectively.
ββ cos θ = ε (4 sin θ) +kλ/D
where k is a correction factor chosen as 0.94, D is the crystallite dimension in nm, strain (ε) is measured in nanometers (nm), and FWHM is expressed in radians (r). Equation (2) represents the uniform deformation model (UDM) of the WH approach, in which the strain of the material was considered to be homogenous in all directions of the crystallites [39].
The strain (ε) component of Equation (2), which is a straight line with y = mx + c (m = slope; c = intercept), can be extracted from the slope by comparing a diagram of cos (in radians) vs. sin. By plotting the Ag-NPs crystallographic planes, all the values can be calculated from Equation (2).
Sin2θ = (λ2/4a2) (h2 + k2 + l2)
where, a is the lattice parameter, hkl values for the above equation were taken from Table 1. Equation (3) was used to determine the average lattice parameter of the crystal structure of Ag NPs, which was 4.0847 Å. The XRD pattern of silver nanoparticles proved that Ag-NPs are crystalline. The four different diffraction peaks at 2θ values of 38.15°, 44.31°, 64.49°, and 77.40° can be correlated to the face-centered cubic structure (111), (200), (220), and (311) planes of Ag-NPs, respectively (ICCD file: 65-2871). An additional peak was found at 69.17°, this peak was caused by the silicon (si) substrate which was used as the substrate for the drop-casting of Ag-NPs, and calcination at 400 °C was required to remove the PER fruit extract components and achieve the phase formation of crystallite structure from amorphous nature. As shown in Figure 3, only the XRD bands of Ag NPs were found on the Si substrate, this demonstrated the excellent purity of the synthesized Ag NPs. From Equation (1), the average crystallite size “D” of the Ag-NPs was computed using Equations (1) and (2), and it was found to be 39.85 nm from equation 1 and 25.67 nm from Equation (2). The observed discrepancy between the crystallite size results from the Scherrer equation and the WH equation may be the result of the WH equation’s inclusion of strain of Ag-NPs and instrumentation broadening. Figure 4 was plotted using the β cos θ vs. 4 sin θ of Ag-NPs sample, where the θ is the same diffracted angle from the XRD pattern. Hence, the four points and their location gave a linear plot, in which the slope indicated the strain (−0.00138) of green synthesized Ag NPs. A positive strain value indicates that the strain is expanding, while a negative slope in the strain is compressive. Therefore, in this case, the micro-strains cannot be the primary cause of widening or establishes that the strain was compressive, resulting in a smaller crystallite size as given in Equation (2) (WH eqn.) than in Equation (1) (Scherrer eqn.). The low values showed that lattice relaxation occurs inside nano crystallites [40].

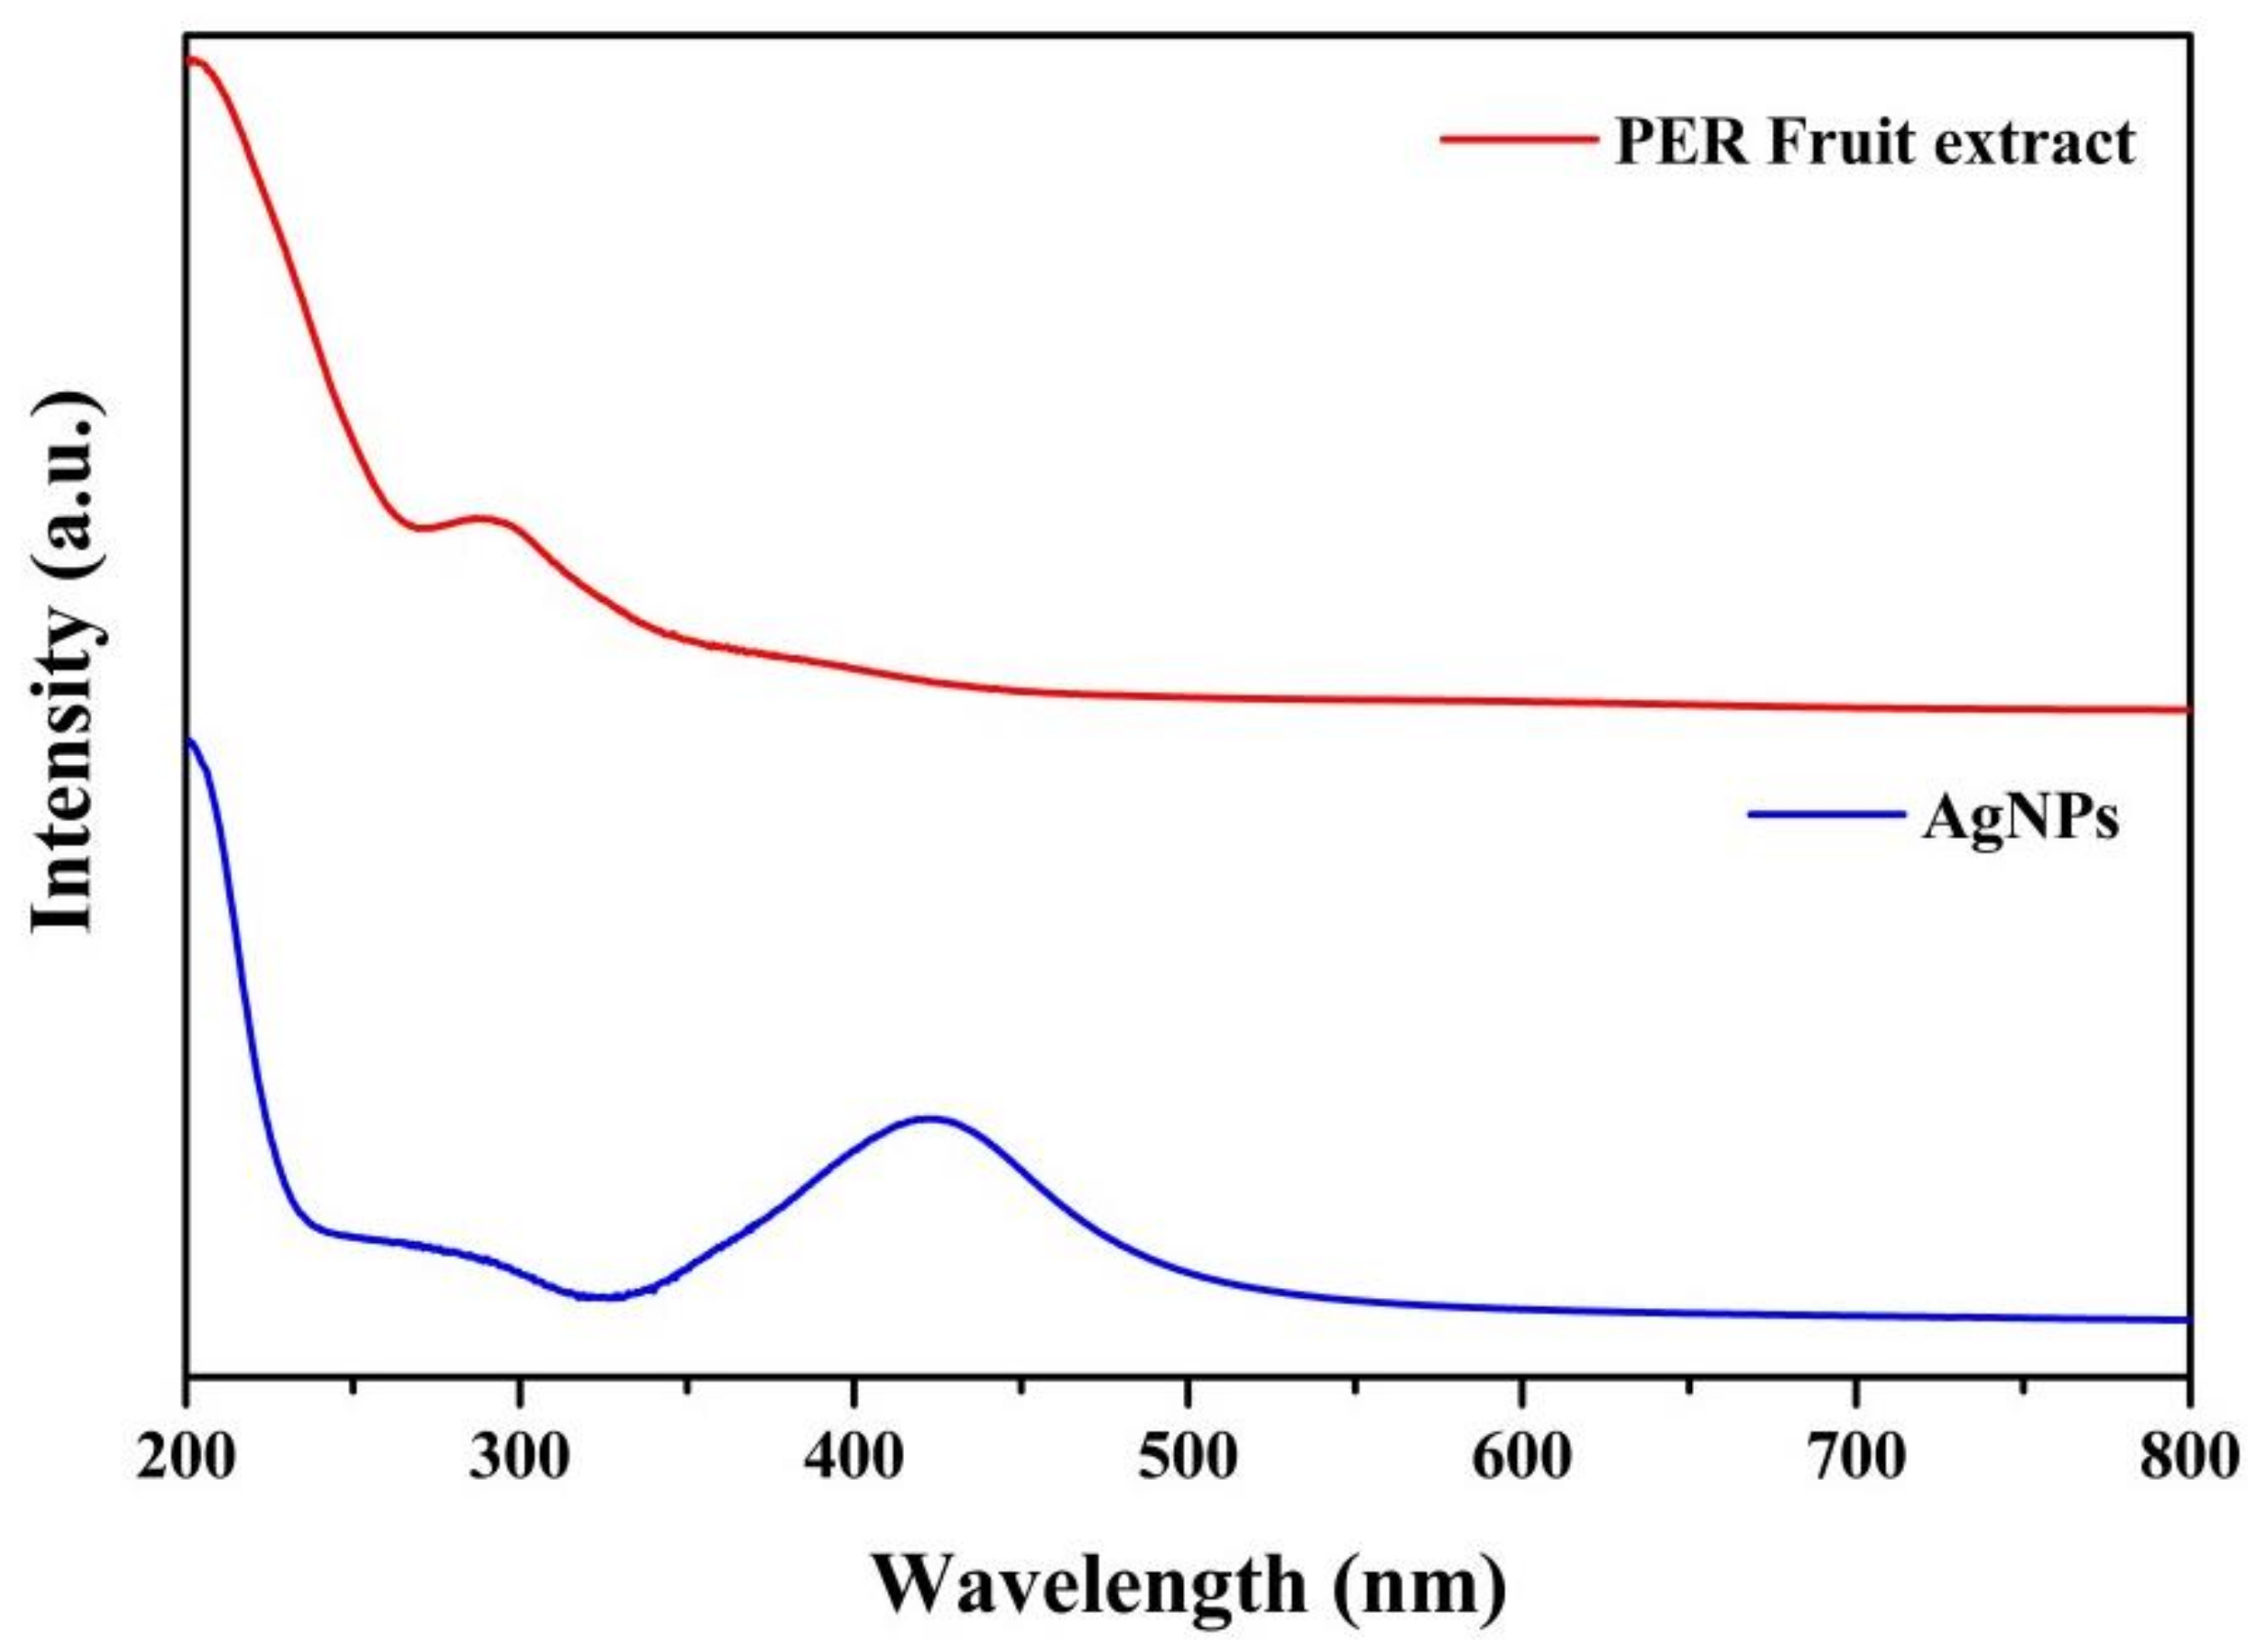
3.2. UV Visible (UV-Vis) Spectroscopy

The UV-visible spectra served as an additional confirmation that nanoparticle formation in the water solution had occurred, according to Figure 5. The dispersion was examined in the range from 200–800 nm wavelength. This study revealed a surface plasmonic resonance (SPR) [41] at the 440 nm wavelength range, which correlated to the generation of Ag-NPs. Ag-NPs heavily absorbed light at a wavelength of ~422 nm due to the electron transition (blue curve). Also, PER fruit extract revealed an absorption peak at ~275 nm due to organic compounds present in the solution (red curve). The exact process of metal NPs extracellular synthesis is unknown. It was once believed that the nicotinamide adenine dinucleotide (reduced form: NADH) coenzyme served as an electron transporter to neutralize the Ag+ ions [42,43].

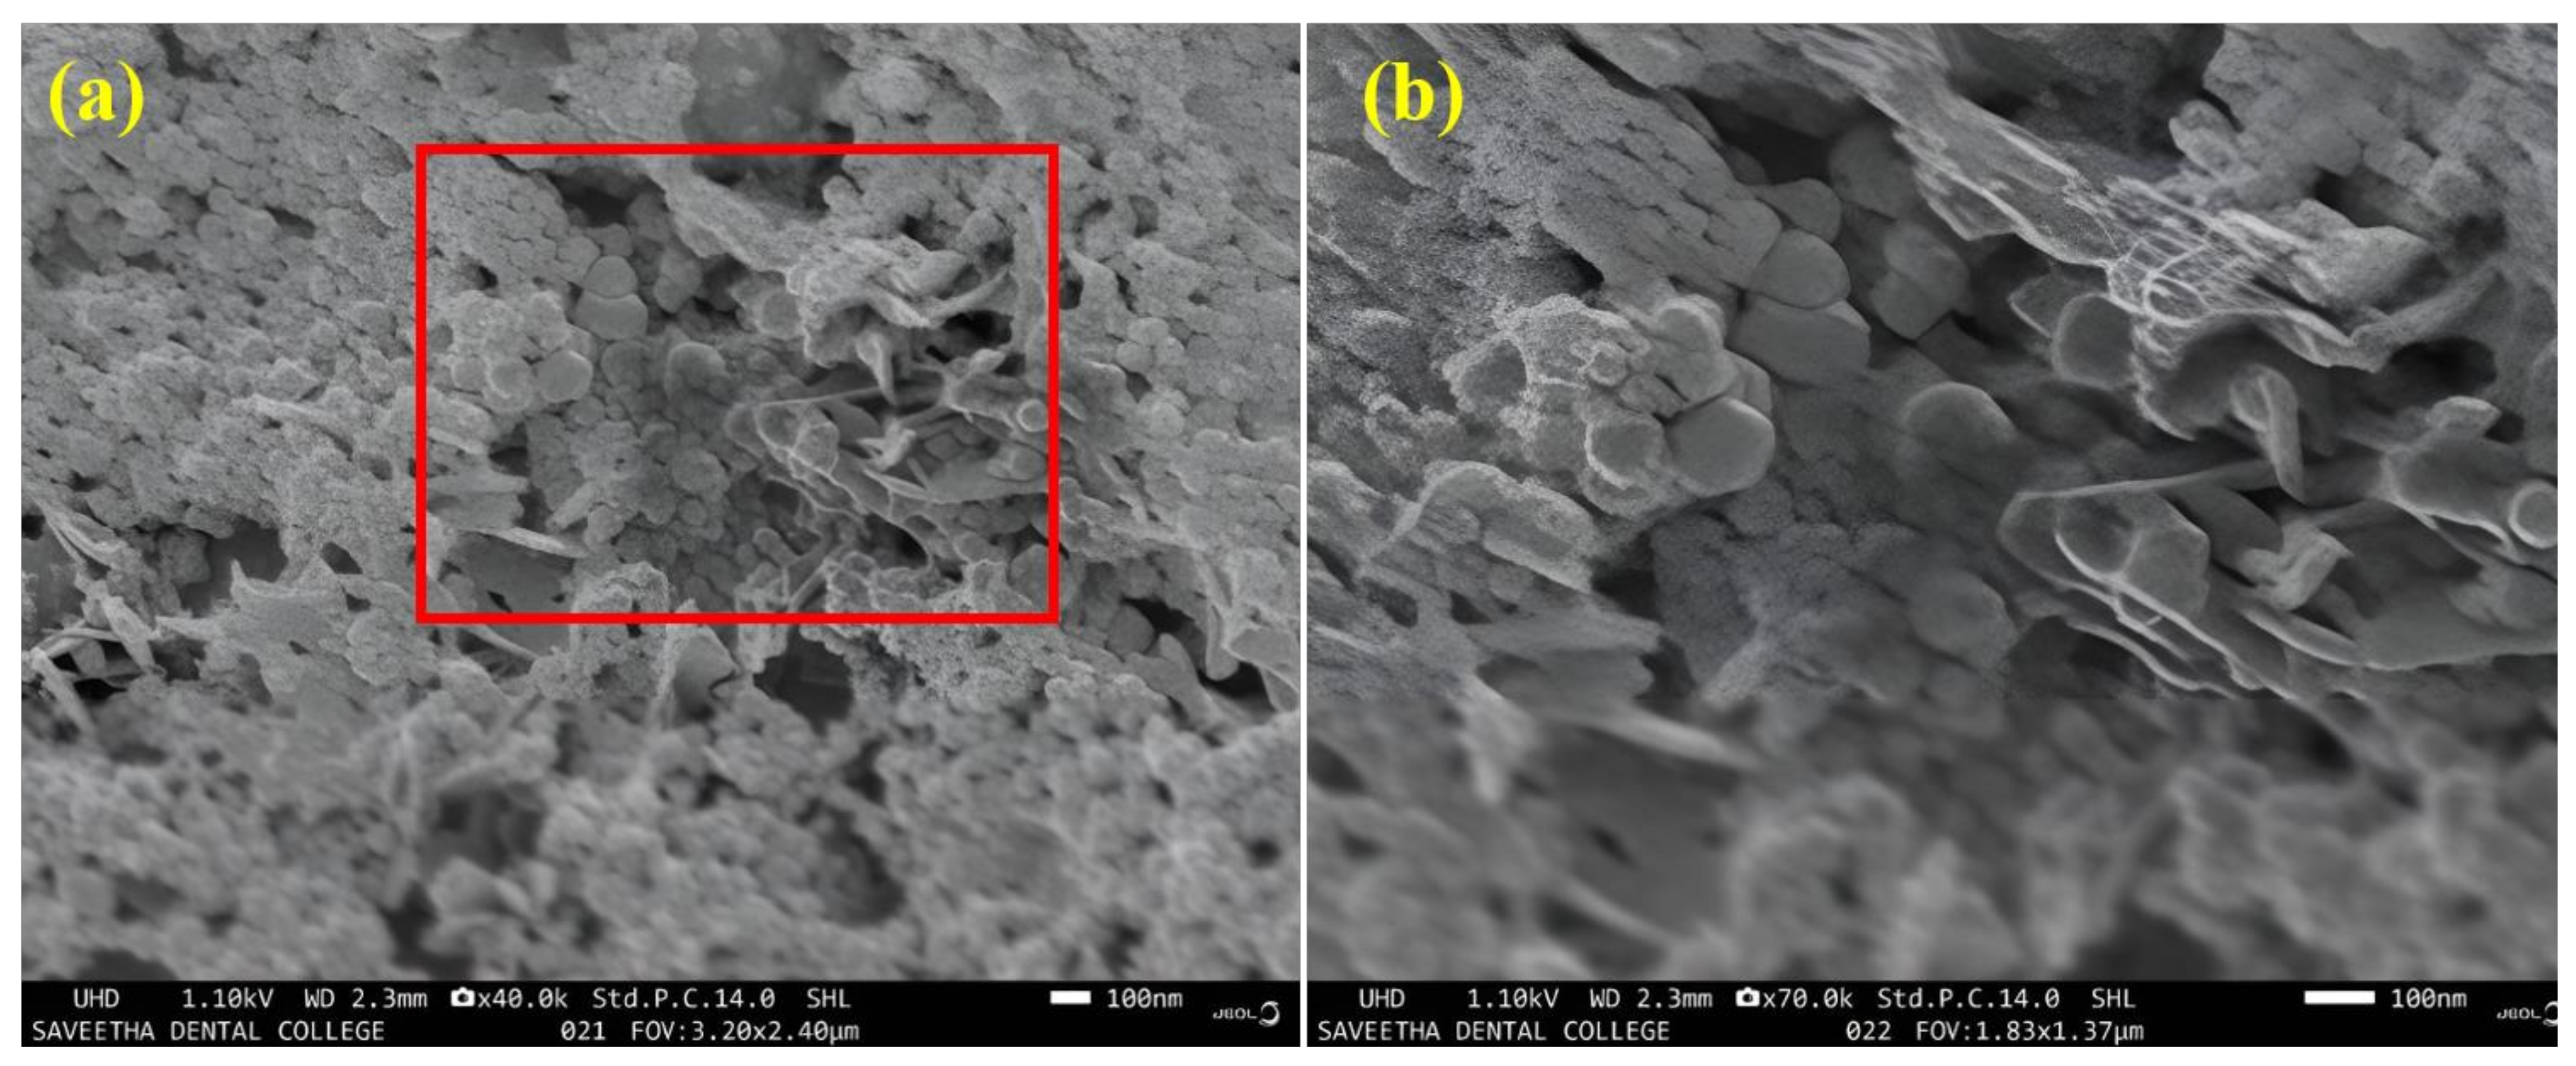
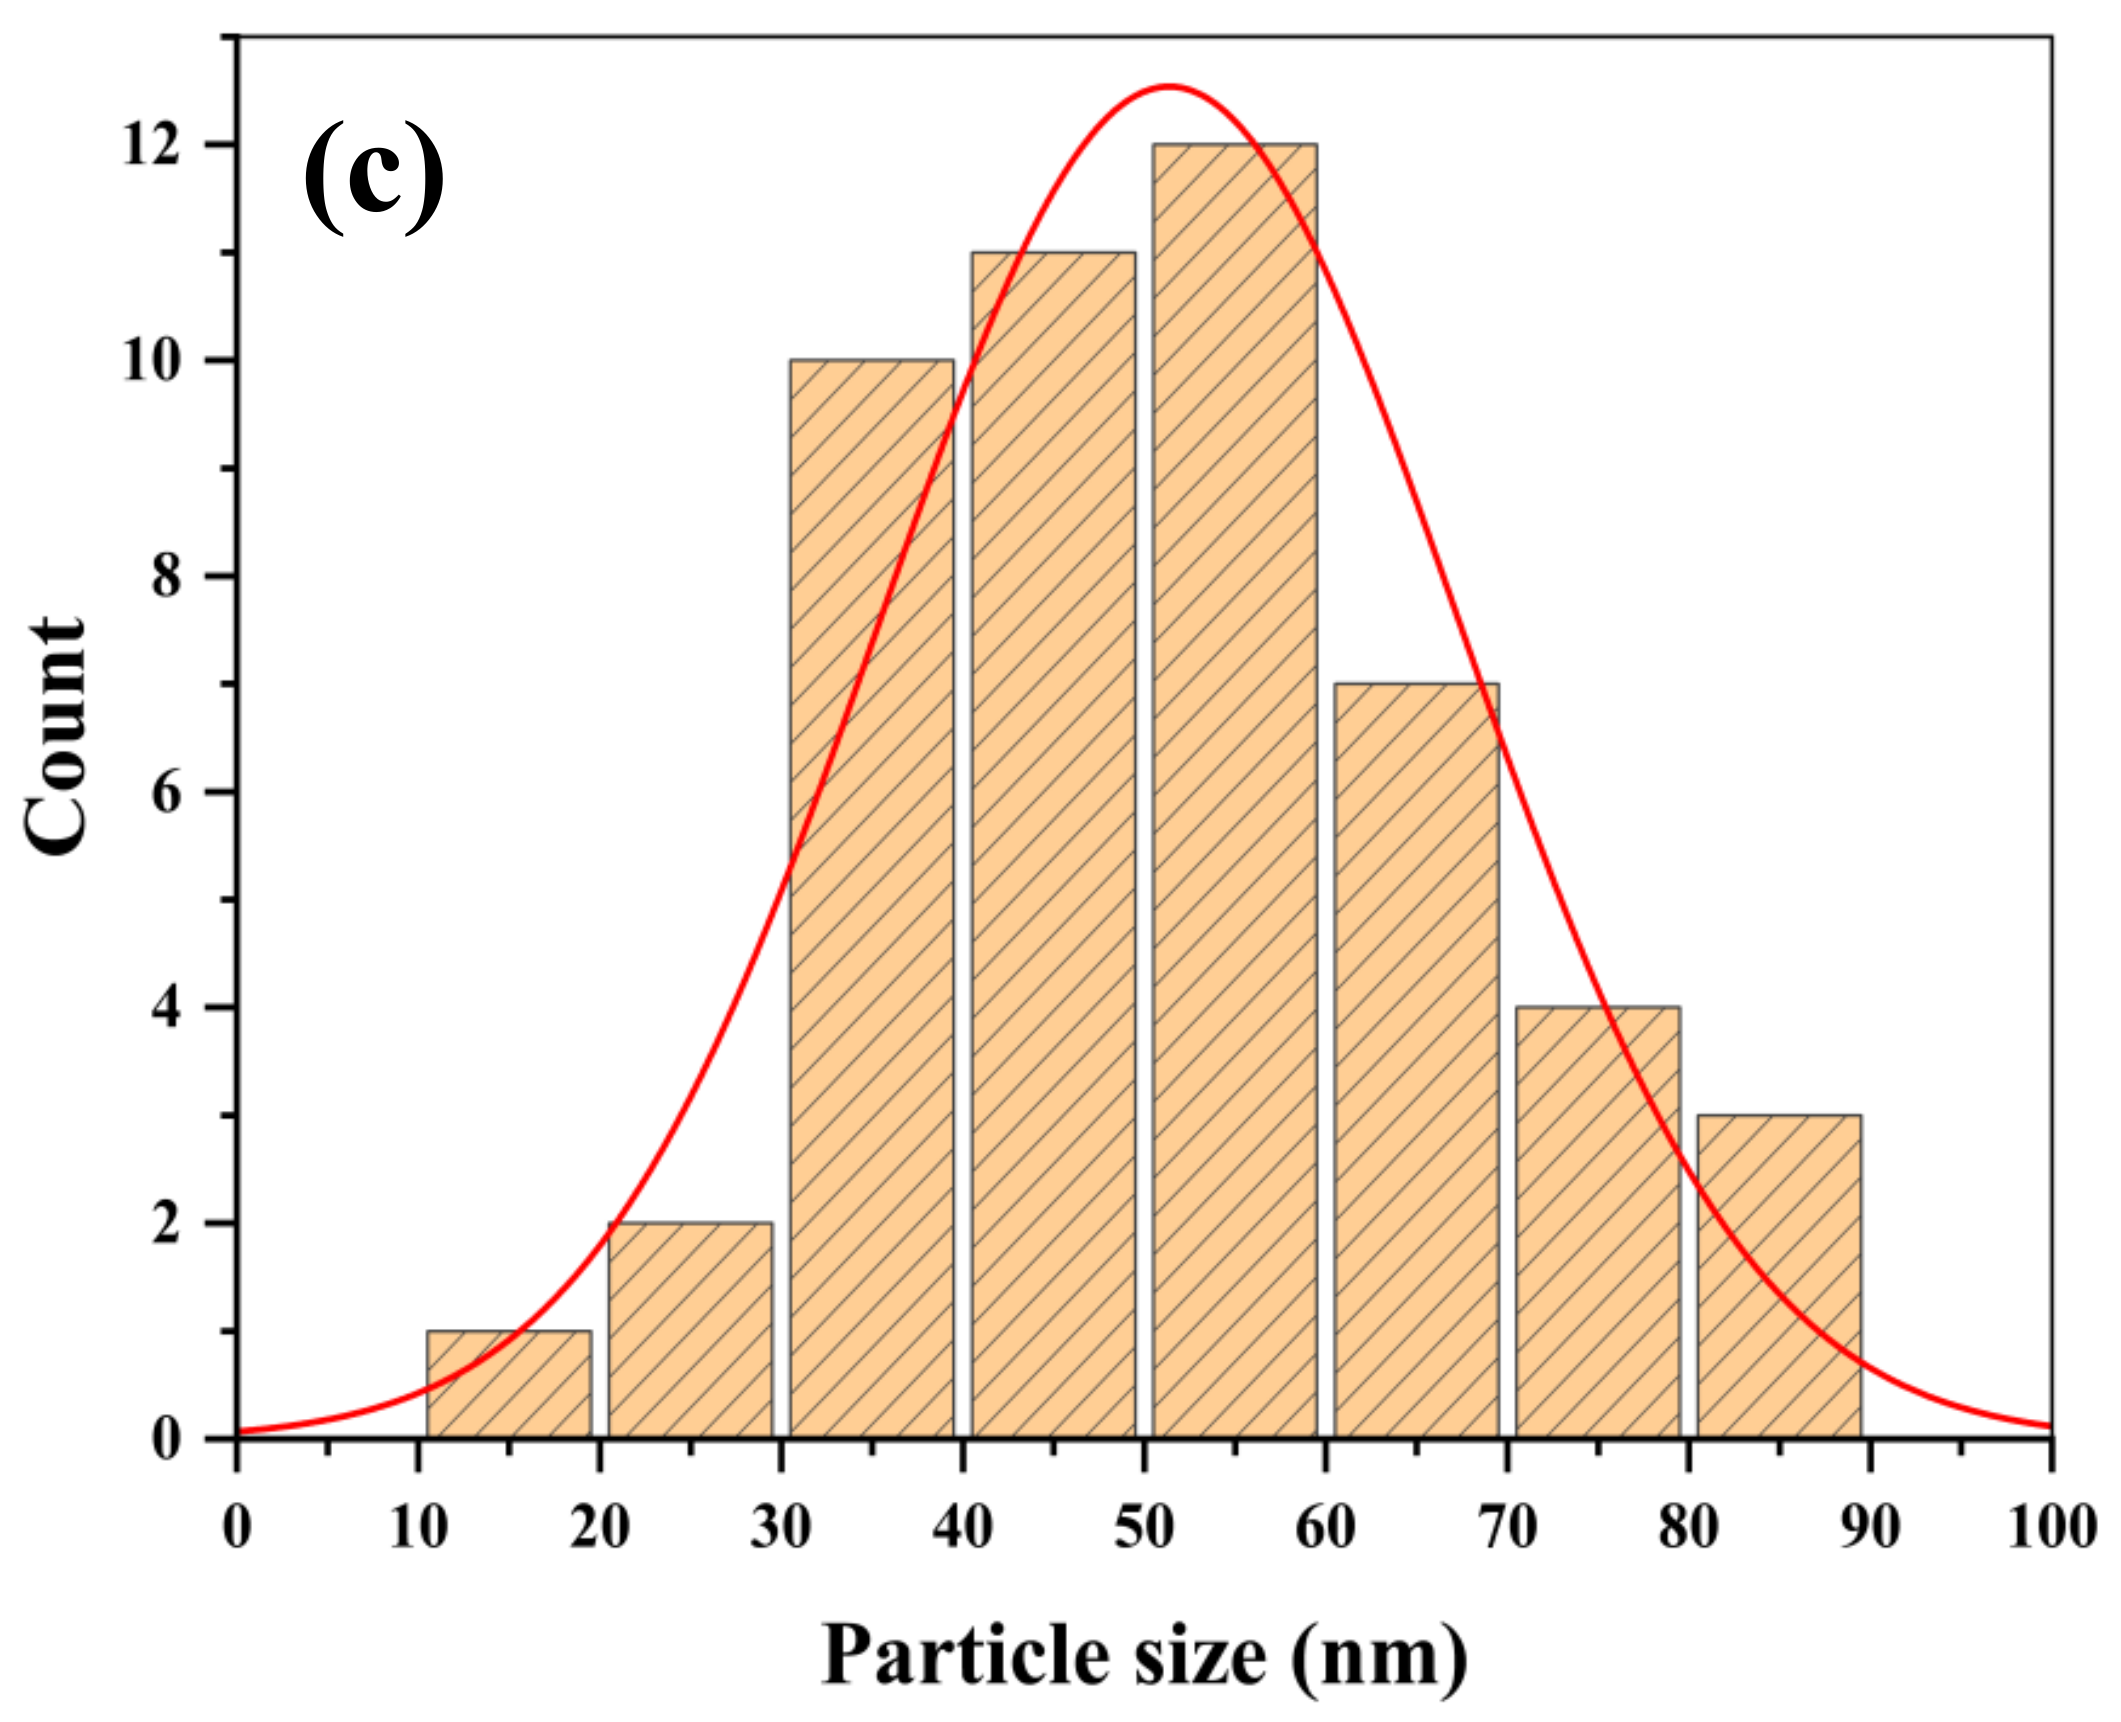
3.3. Surface Morphology Studies by FE-SEM

The Ag-NPs were analyzed by using FE-SEM to produce visual pictures. Figure 6a–c shows the morphology and size of the generated Ag-NPs. ImageJ software was used to measure the size distribution, which showed spherical nanoparticles between 10 to 90 nm (Figure 6c). These findings were consistent with the SPR peak’s form, which was seen by the UV-Vis spectrum at 422 nm. It was reported that the type of plant extract had an impact on the size and shape of the bio-synthesized nanoparticles [2]. Numerous studies have documented various forms of Ag-NPs, including triangular [31], spherical [26], pentagonal, cuboidal [44], and hexagonal [17]. As a result, the spherical Ag-NPs found in this work were consistent with the expected Ag-NPs forms, while other clustered configurations may be due to the presence of organic compounds in the extract. By transferring the electrons from the functional groups, the phytochemicals present in PER contributed to the reduction of Ag+ ions into Ag0 [36].

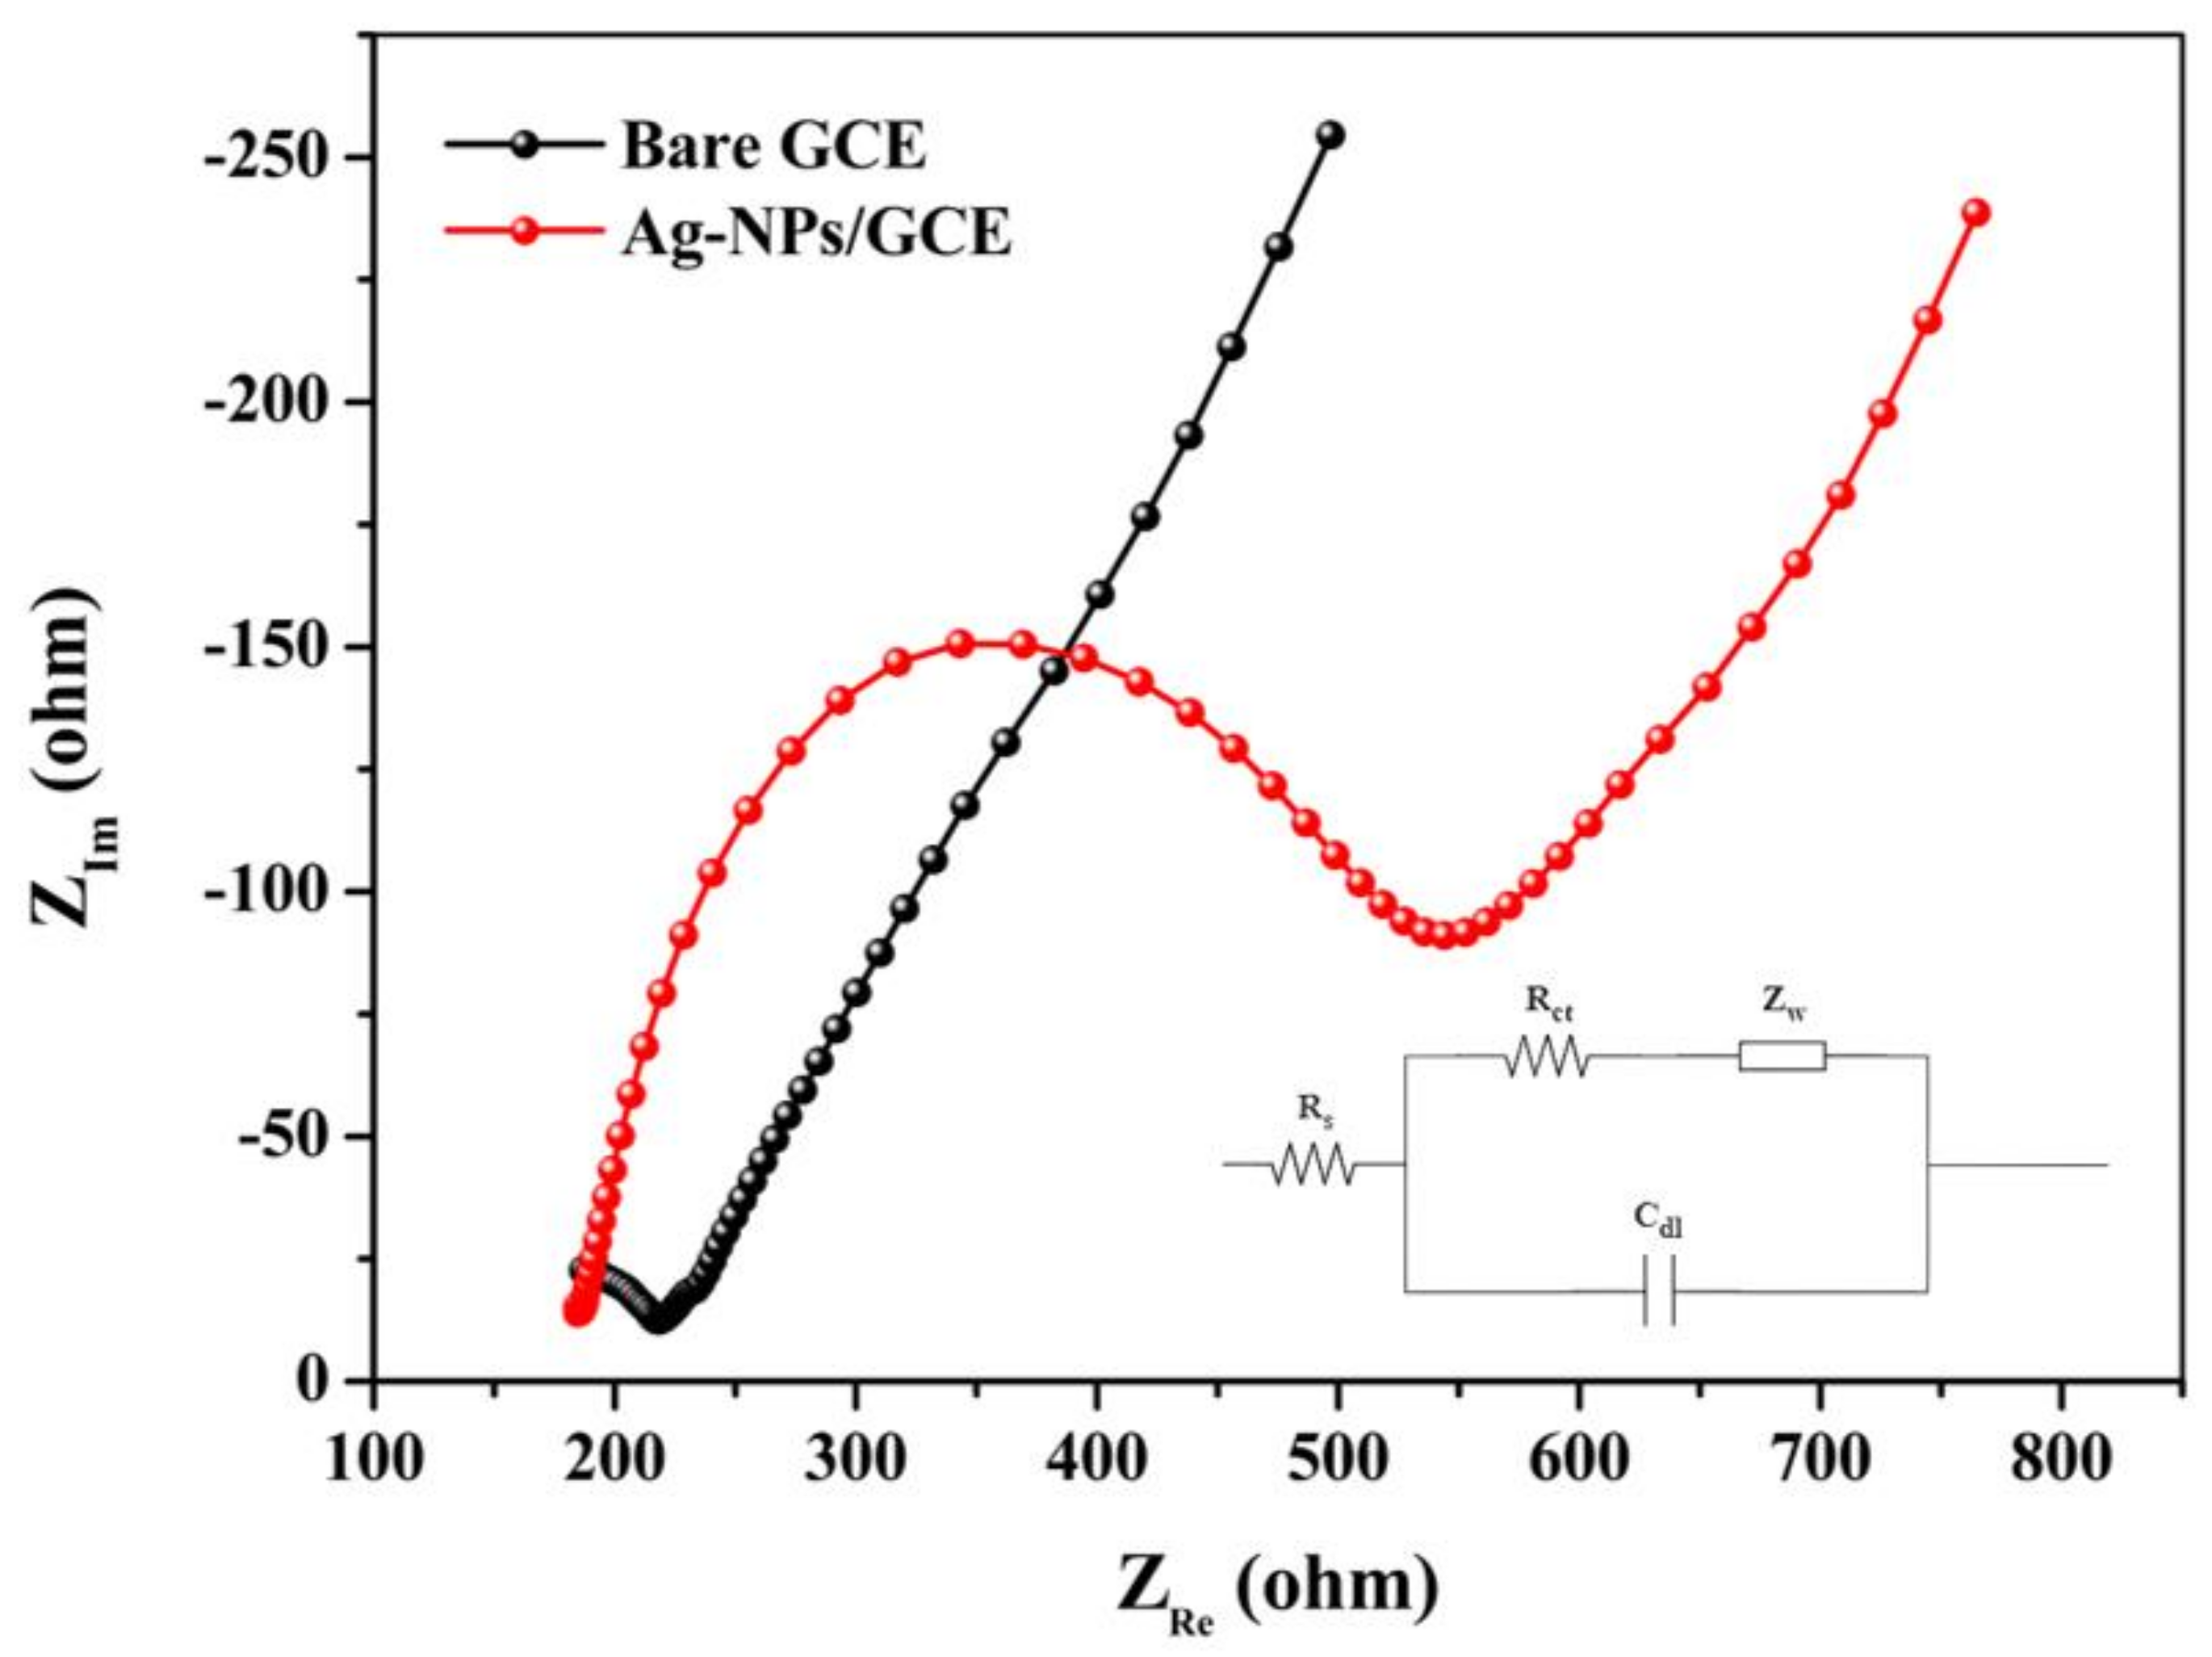
3.4. Electrochemical Impedance Spectroscopy (EIS) Studies

The EIS was used to analyze the interface properties of the electrodes in their original state. The section of the graph that resembled a semicircle at higher frequencies showed that the process of electron transfer was limited at the electrode interface, and this suggested that there was a resistance to the charge transfer (also known as Rct). Meanwhile, the linear section at lower frequencies indicated that the electron transfer process was limited by diffusion [44,45,46,47]. Figure 7 illustrates the impedance spectra of both the bare GCE and the Ag-NPs/GCE in a solution containing 5 mM of the [Fe(CN)6]−3/−4 in 0.1 M KCl. It was clear that at bare GCE, the lowest Rct value (218 Ω) was found, indicating a desirable conductivity. At Ag-NPs/GGE (545 Ω), a rise in the Rct value was noted due to the formation of an organic layer covered Ag-NPs which prevented electron transfer between the [Fe(CN)6]−3/−4 system and GCE. As a result, the Ag-NPs/GCE showed the biggest Nyquist diameter when compared to bare GCE. It was possible that the Rct value had increased due to the electrostatic repulsion between the Ag-NPs covered with the negatively charged organic molecules and [Fe(CN)6]−3/−4 in the solution [48]. The rise in semi-circular diameter seen at the Ag-NPs/GCE may indicate the formation of a layer that prevents electrons moving from the electrolyte [Fe(CN)6]−3/−4 to the surface of the electrode. The inset in Figure 7 illustrates the equivalent of Randle’s circuit of a Nyquist plot, where the circuit was simulated and fitted to the Nyquist plot perfectly. The aforementioned findings supported that green synthesized Ag-NPs can be used to modify GCE for NIC oxidation.

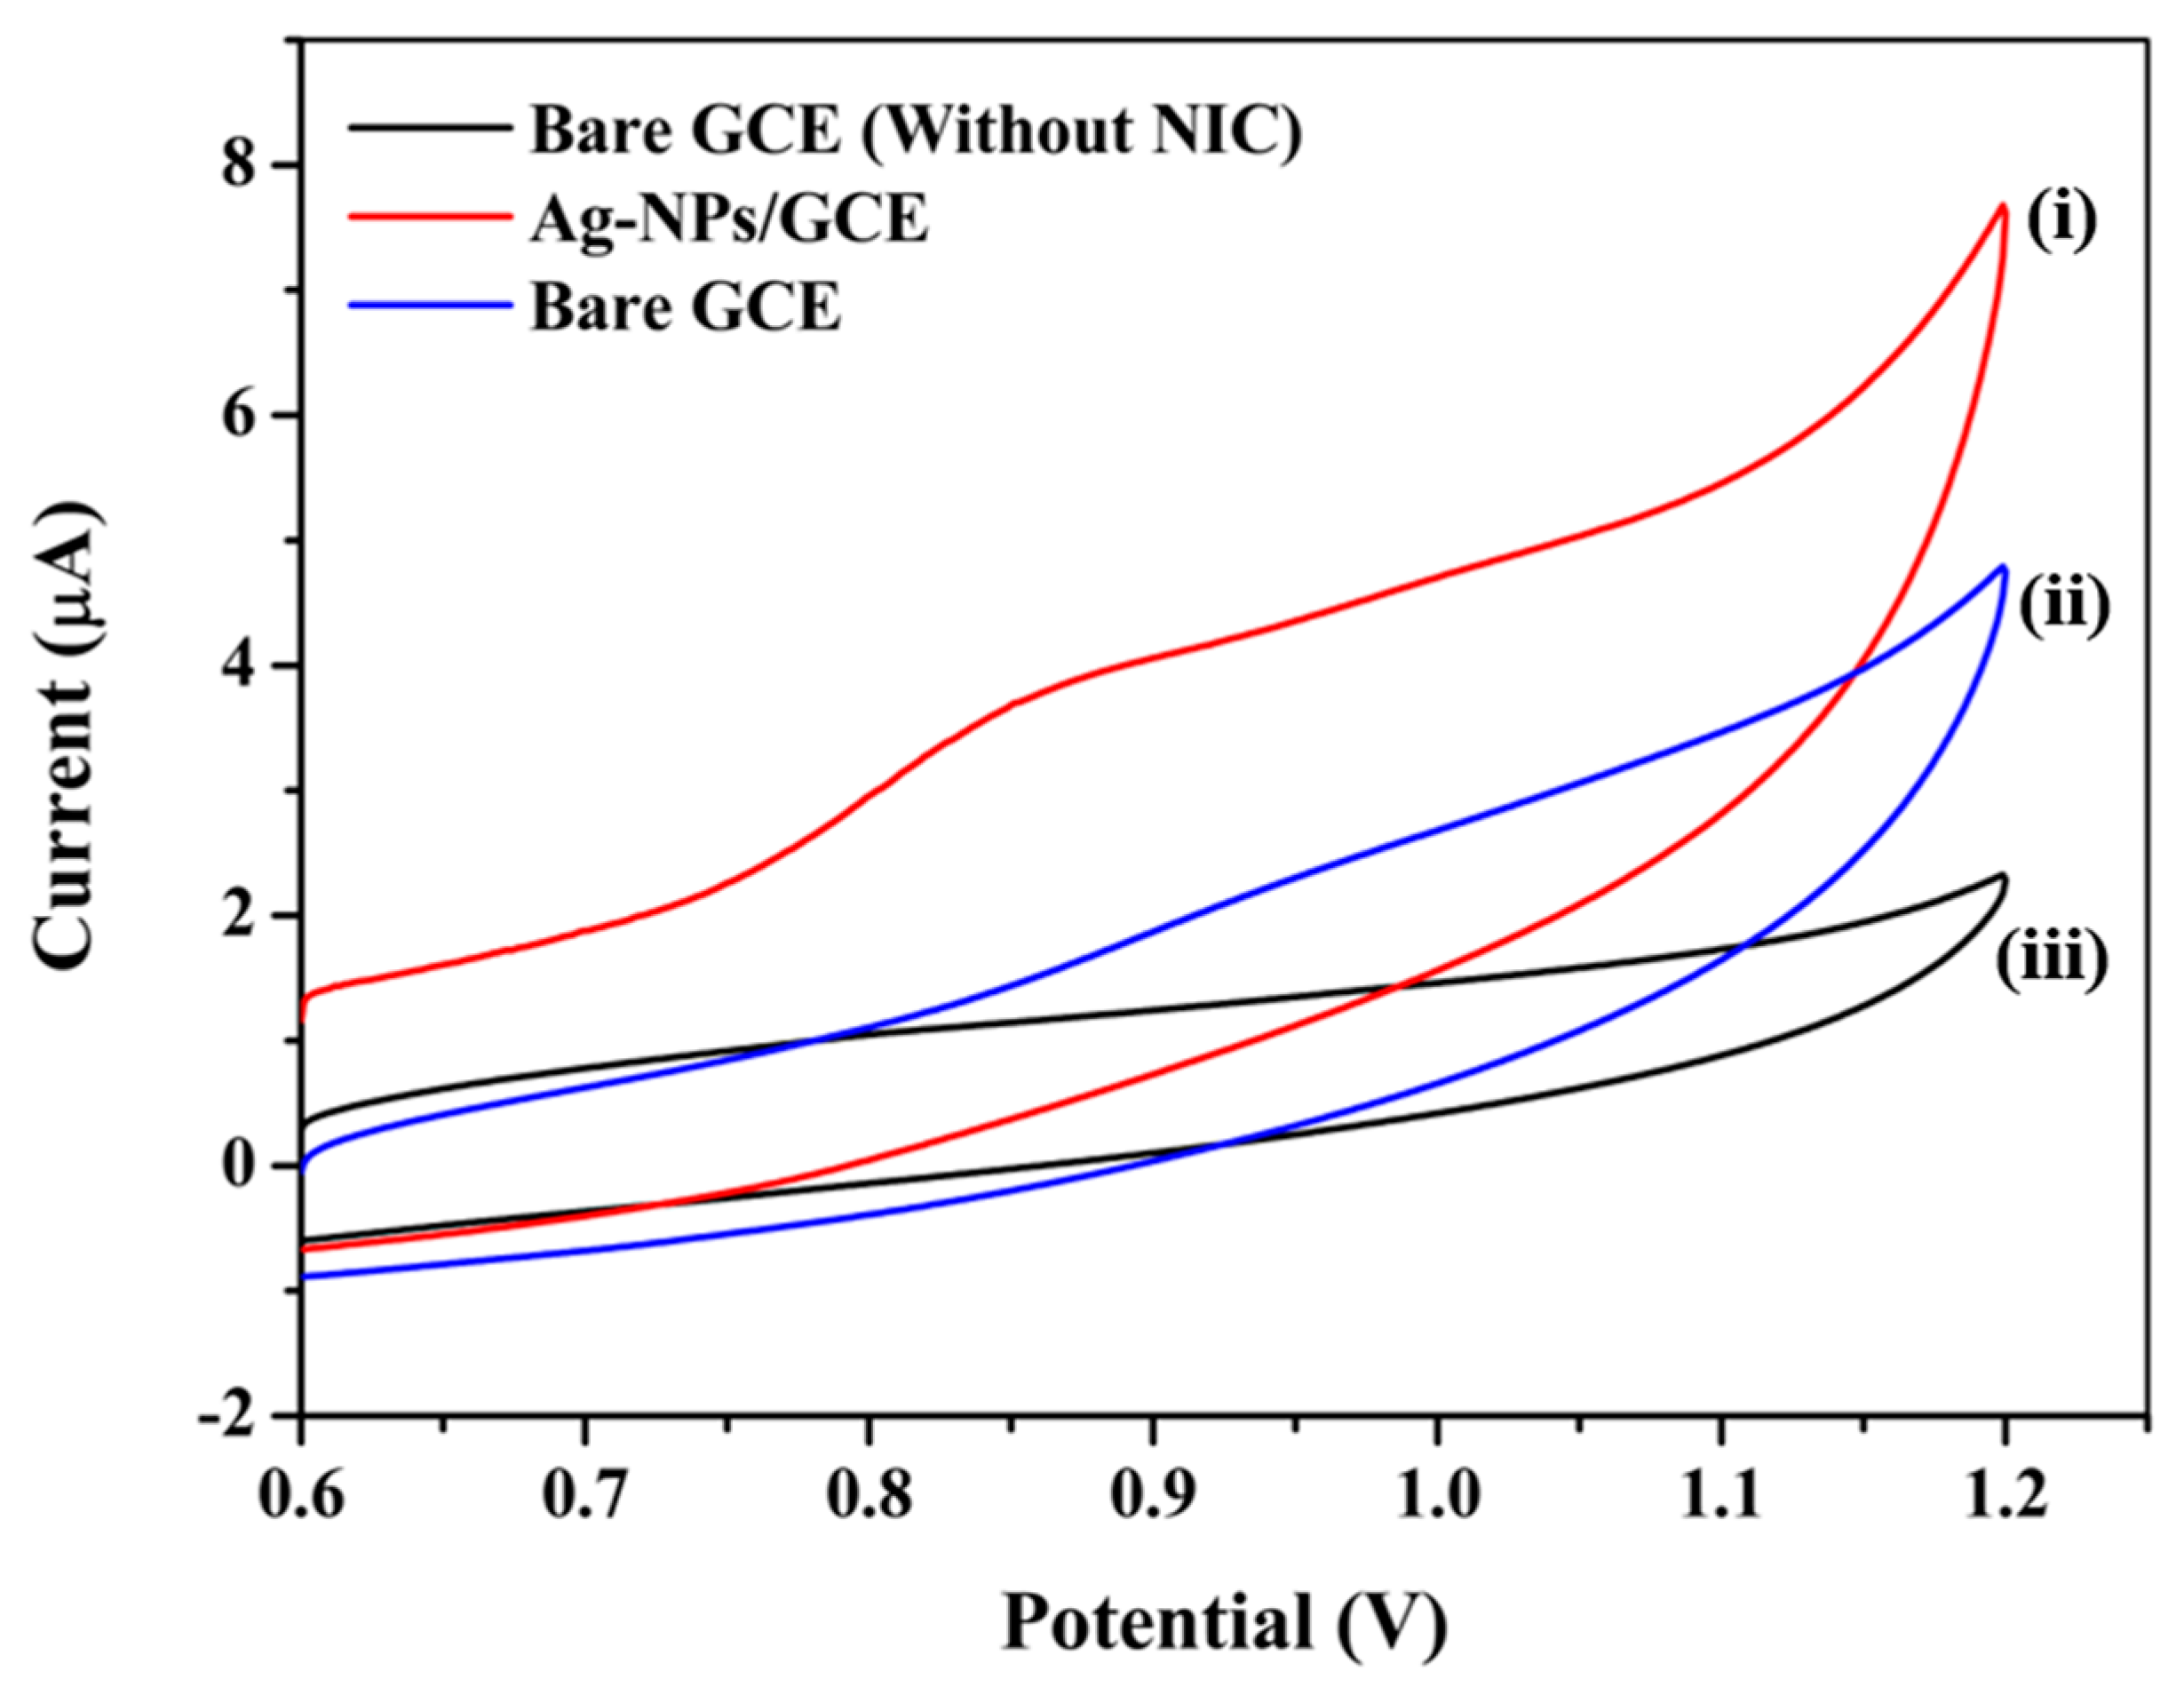
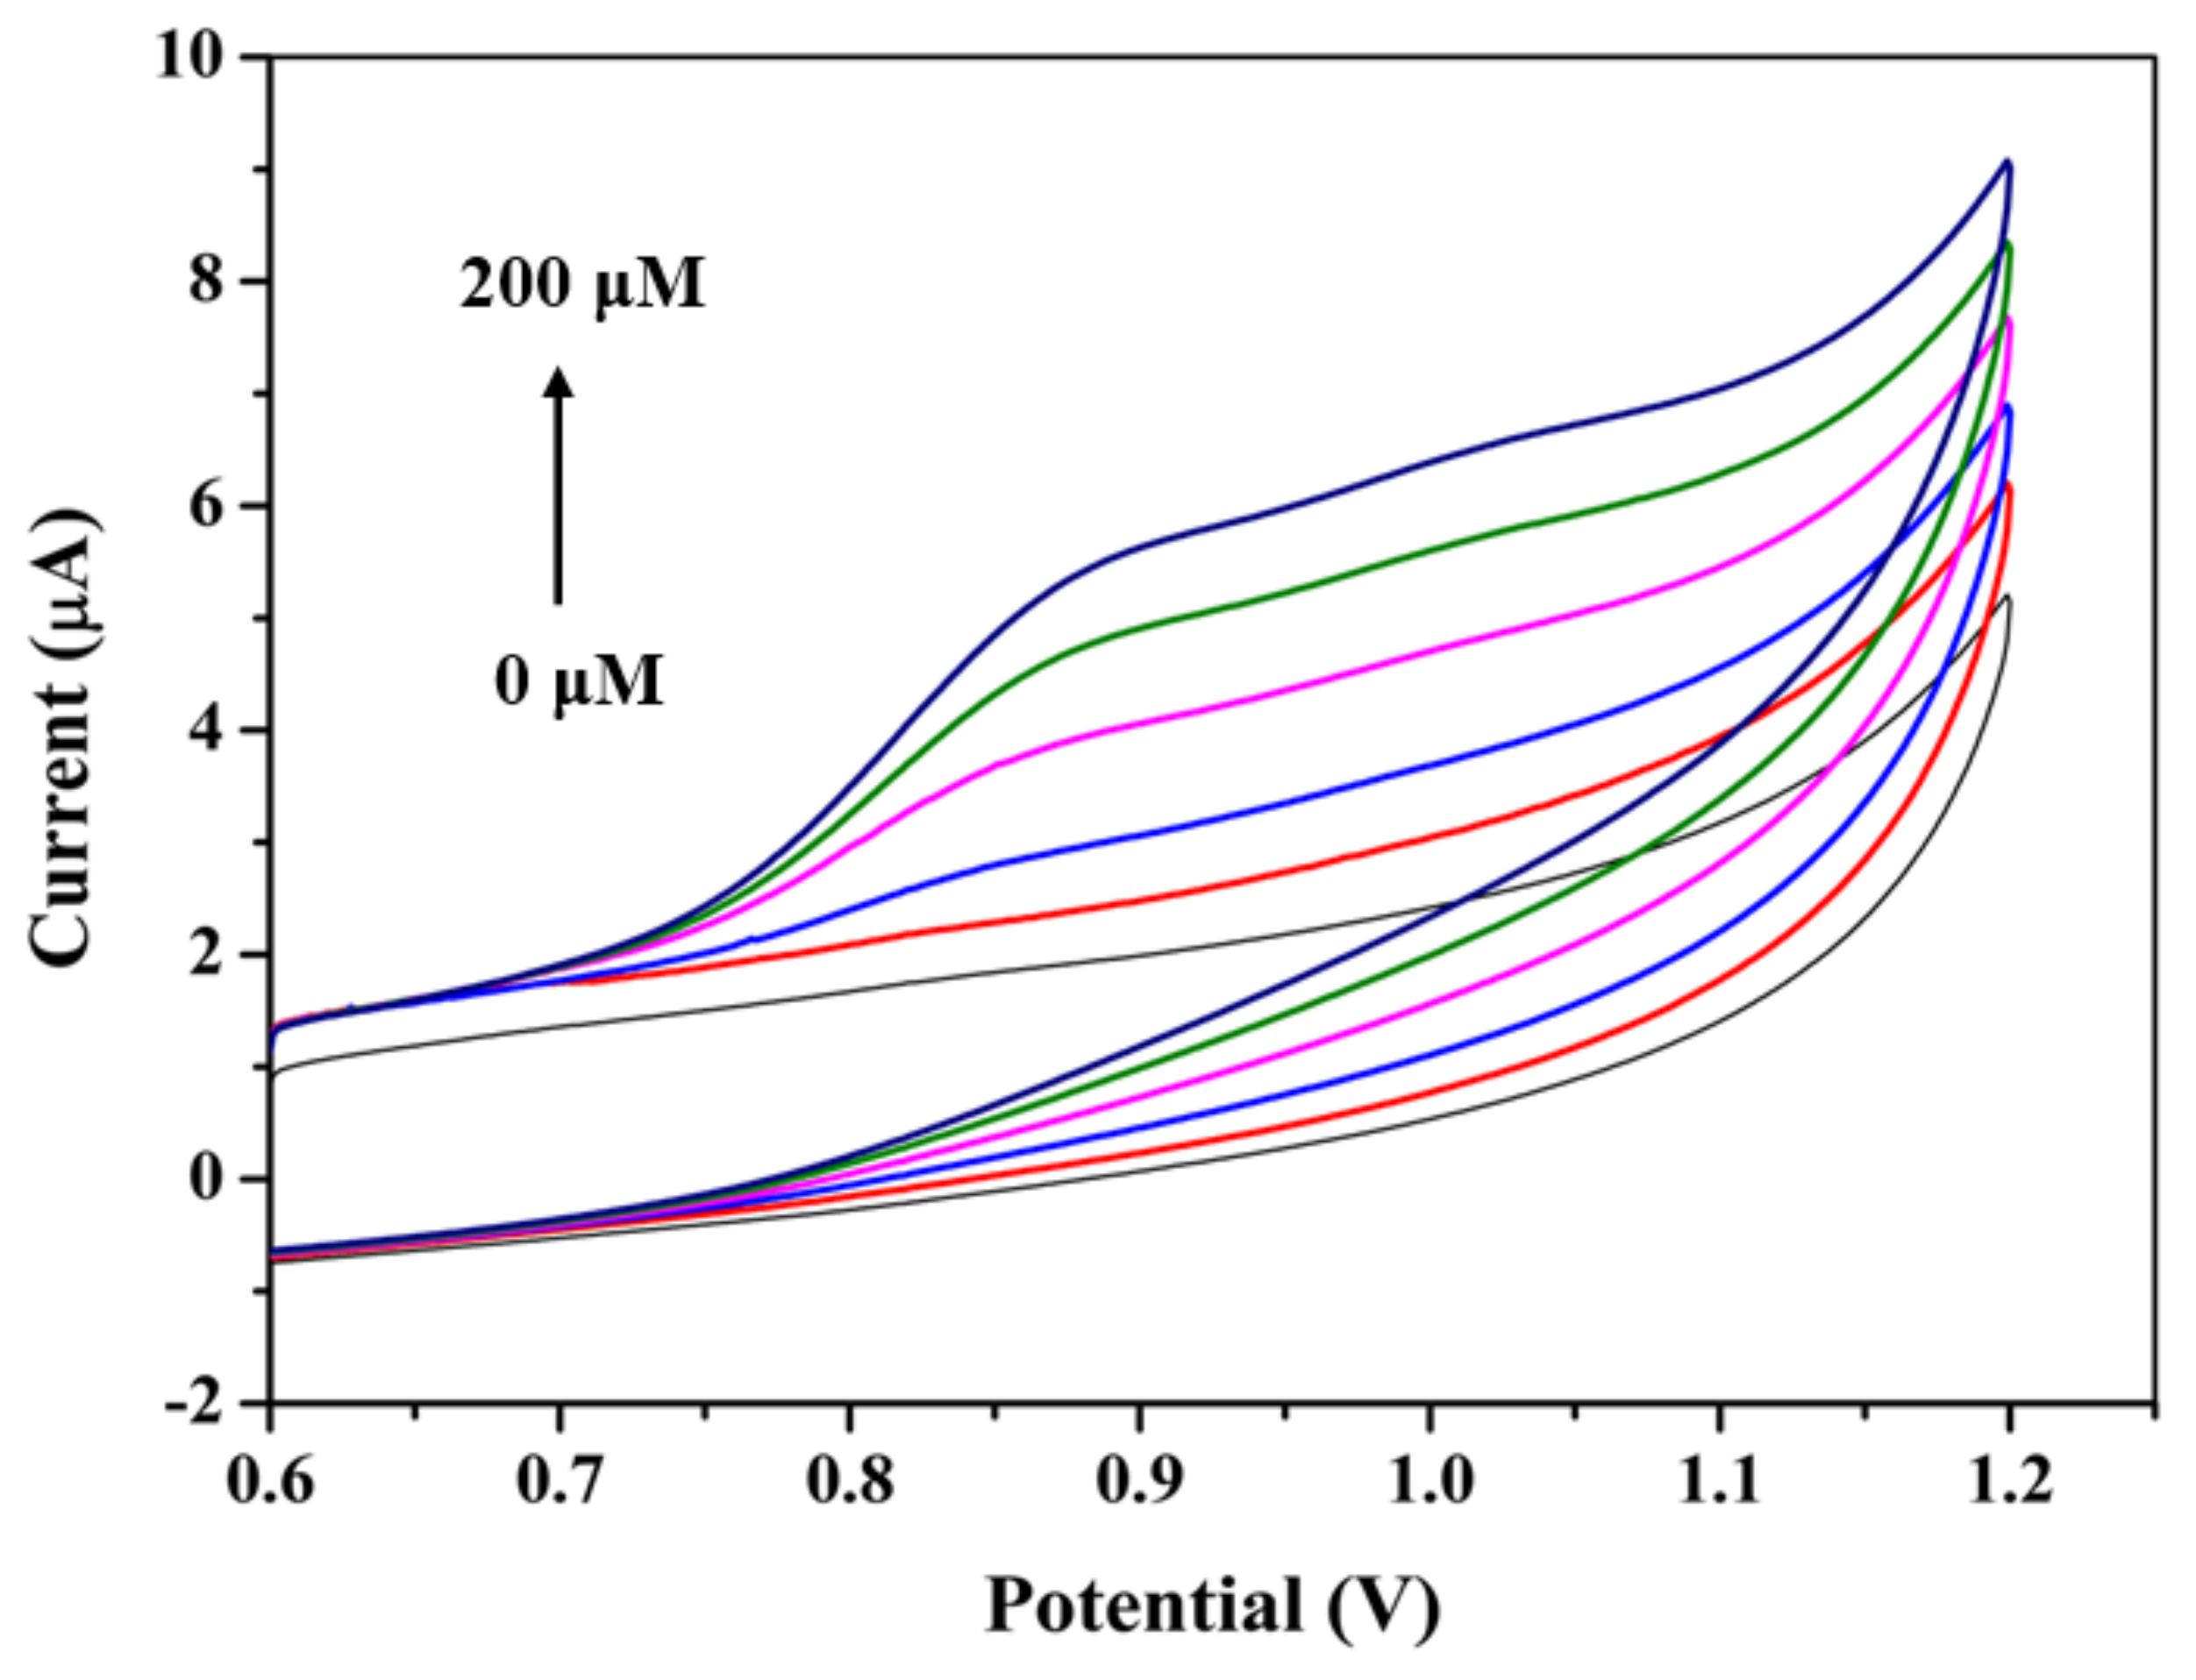
3.5. Cyclic Voltammetry Response of the Sensor

To examine the electrochemical behavior of NIC on Ag-NPs modified GCE, cyclic voltammograms (CV) were recorded. The ideal settings for achieving the best analytical performance were carefully determined by examining all required aspects that may affect the current reaction of NIC. Figure 8 displays the equivalent voltammograms for both modified and unmodified bare GCEs in the presence and absence of 100 μM NIC in PBS (pH 7.4). Contrary to the earlier reports, which stated that NIC starts to oxidize at a potential of around 0.9 V on the modified GCE [14,49], this study showed that NIC undergoes anodic oxidation at the surface of the Ag-NPs modified GCE starting at a potential of about +0.75 V and the peak centered at +0.85 V with a high oxidation peak current of 4 µA. It showed the best electrocatalytic property of Ag-NPs and suggested a faster electron transfer rate towards NIC compared to the bare GCE. By reversing at +1.2 V, during a cathodic scan, no voltametric reaction that might be related to the NIC reduction was seen. As a result, we draw the conclusion that NIC oxidation at both Ag-NPs modified or unmodified GCE was irreversible. The obtained background current was suitably low, demonstrating the advantages of using the unaltered GCE as a sensing platform. Ag-NPs/GCE was used to measure the different concentrations of NIC by recording CVs in 0.1 M PBS at a scan rate of 50 mV/s. As shown in Figure 9, the peak current of NIC oxidation (Ipa) was linearly increased with the concentrations of NIC from 10 μM to 200 μM. This proved that the Ag-NPs/GCE had exhibited high sensitivity and stability towards electro-oxidation of NIC.

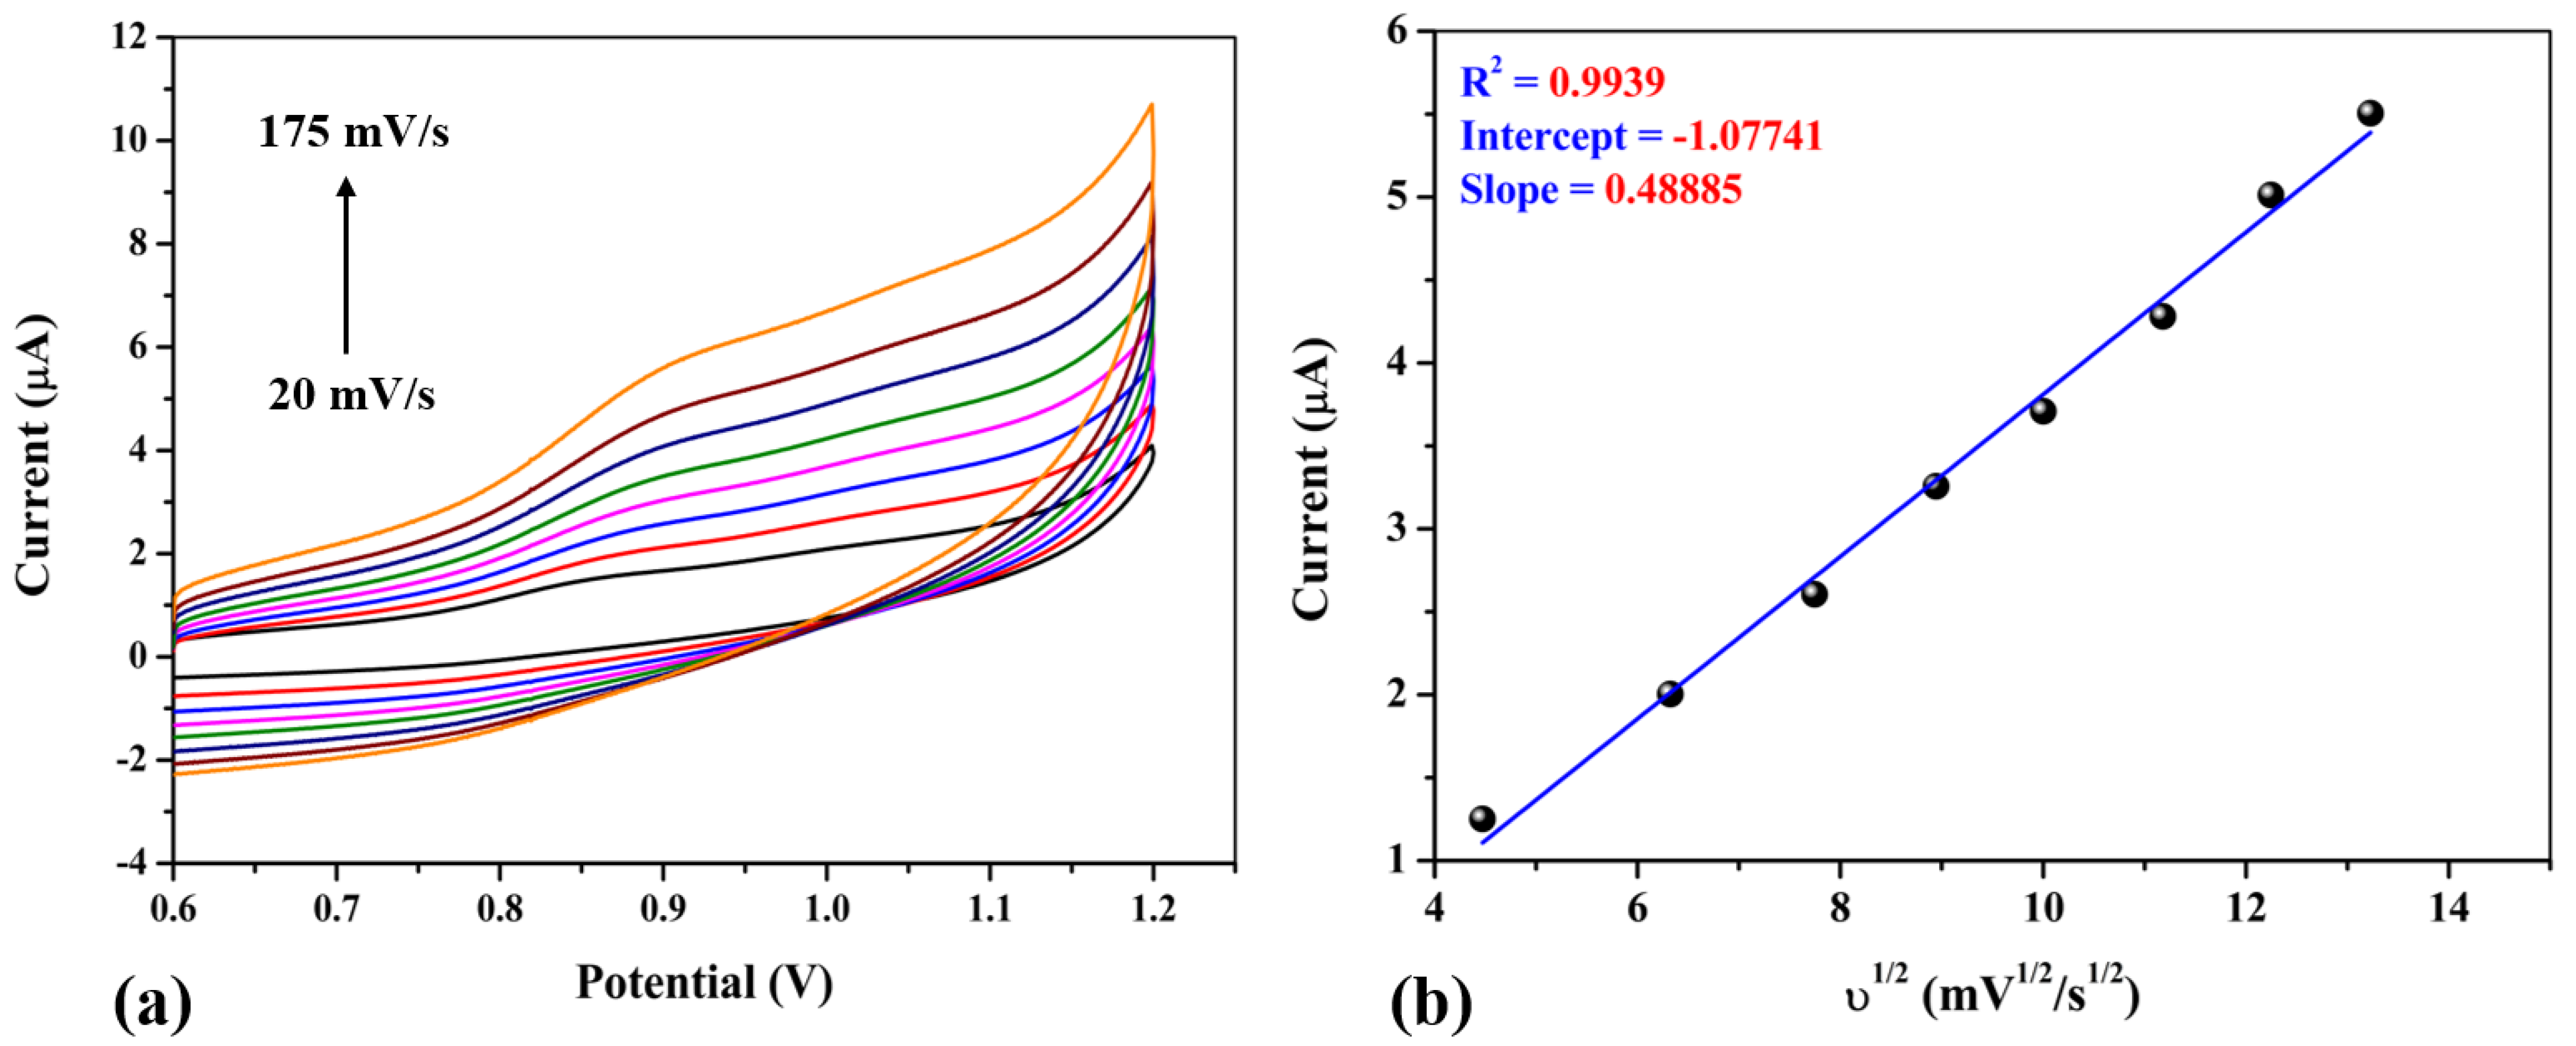
3.5.1. Effect of Scan Rate on NIC

The effect of the scan rate on the NIC oxidation process was evaluated in order to reveal the mechanism of the electrochemical process on Ag-NPs/GCE. The scan rate had an impact on the peak potential as well as oxidation peak currents of NIC as we recorded CVs at different scan rates in the range from 10 to 200 mVs−1 in 0.1 M PBS (pH 7.4). It was found that when the scan rate (υ) was increased, the peak potential for anodic peak (Epa) of NIC marginally shifted to a more positive potential in accordance with the kinetic regulated process, confirming an irreversible electrochemical reaction (Figure 10a) [14]. The oxidation peak currents (Ipa) of NIC were increased linearly with the square root (sqrt.) of the scan rate (υ1/2) (Figure 10b). The linear equation was found to be Y = 0.48885 x − 1.07741 with a correlation coefficient of (R2) of 0.9939, indicating that NIC underwent a diffusion-controlled oxidation process on the Ag-NPs/GCE.

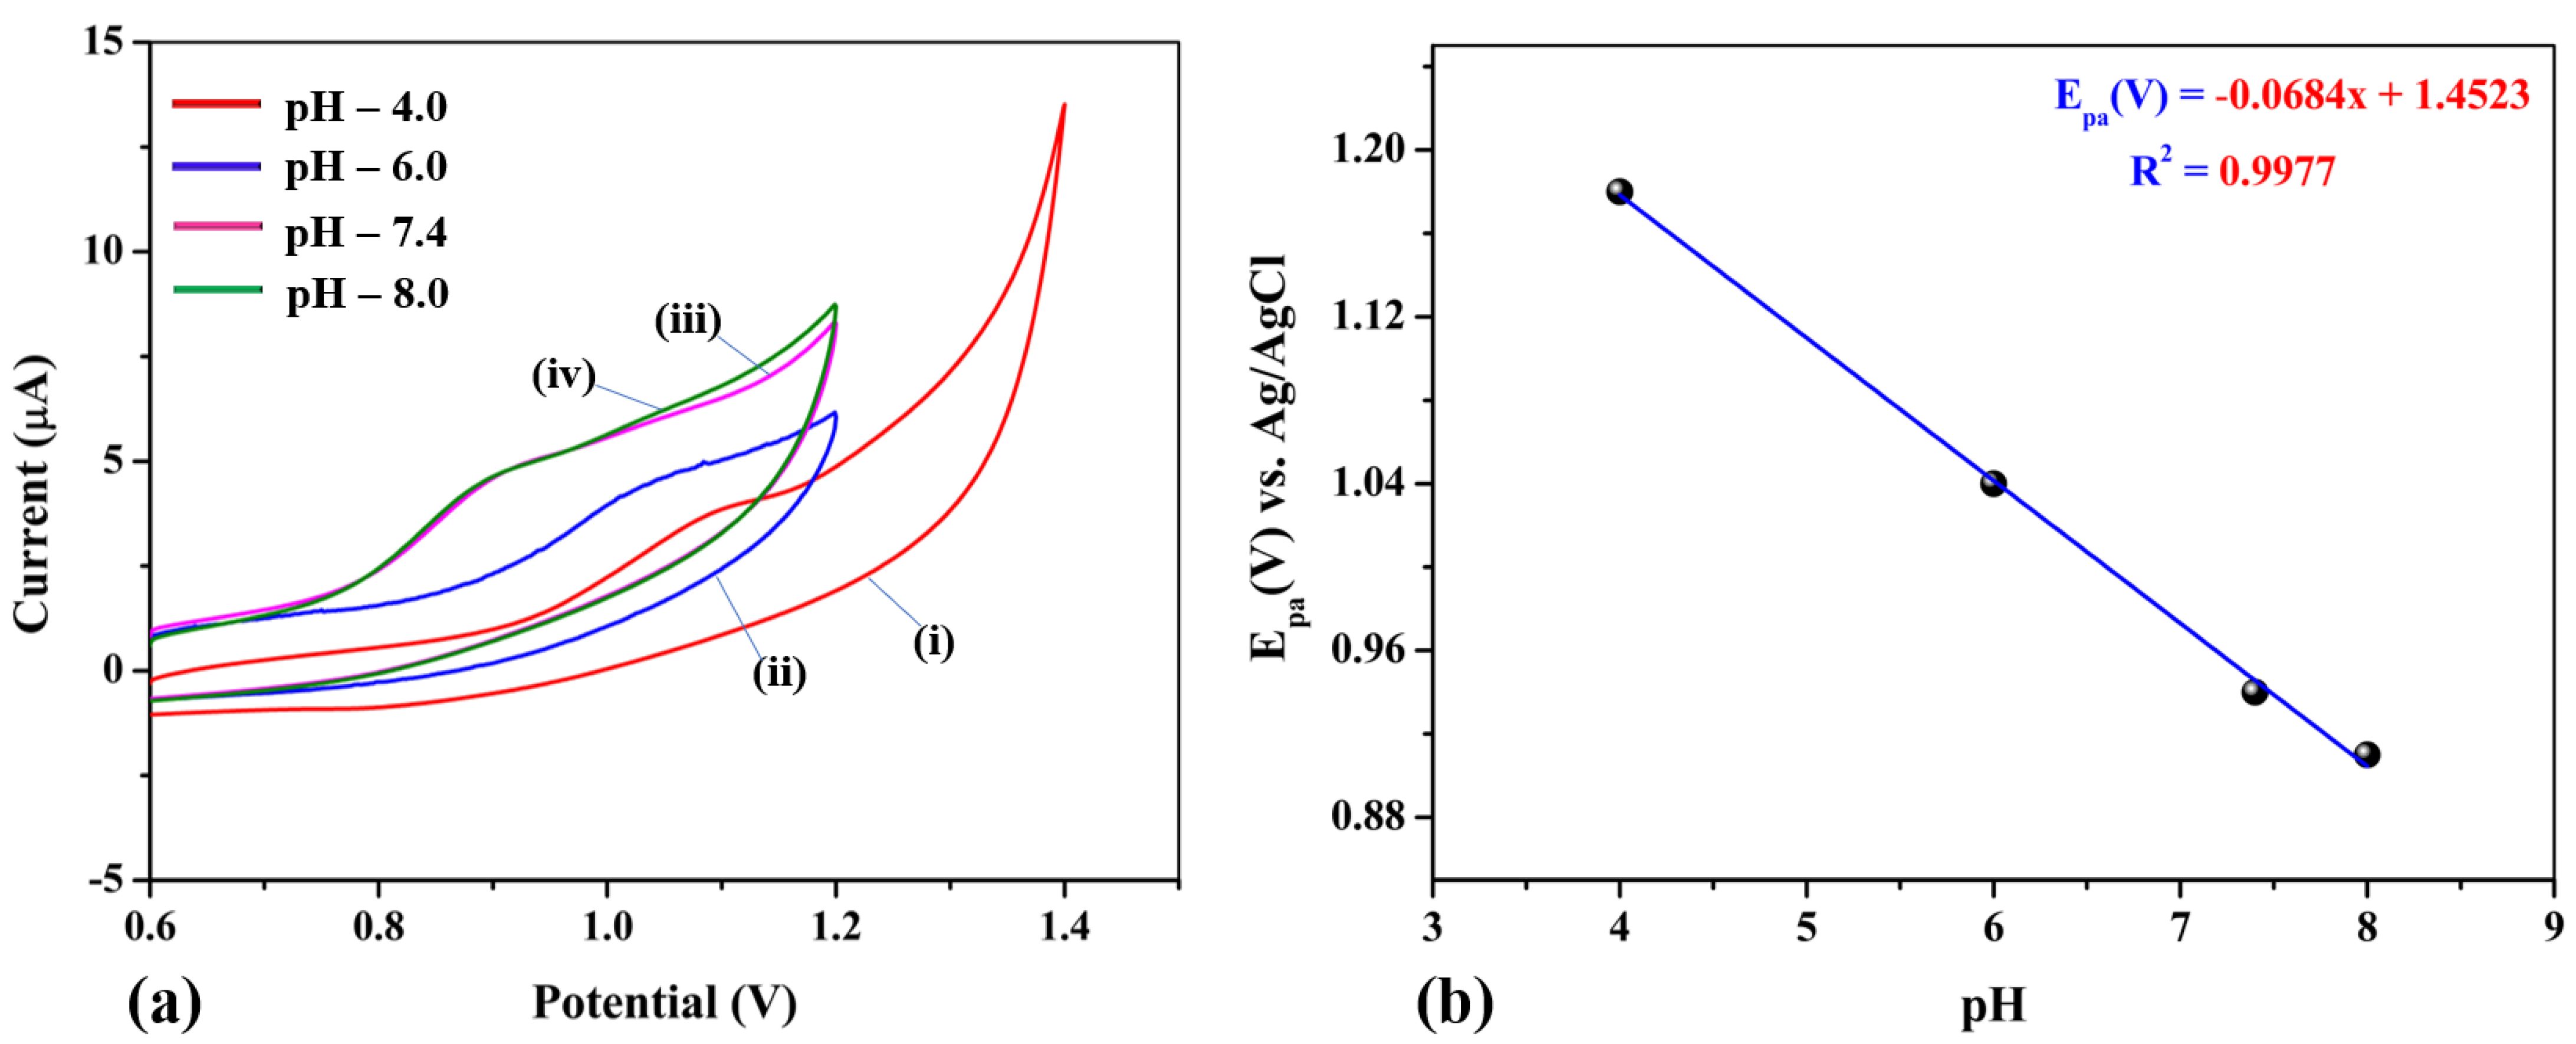
3.5.2. Effect of pH on NIC Oxidation

Figure 11a illustrated CVs recorded for NIC oxidation at the Ag-NPs/GCE in different pH solutions from 4.0 to 8.0. The oxidation current responses of NIC were not discernible when pH values were reduced to less than 4.0 (i.e., pH 2). The electrocatalytic oxidation peak of NIC at the Ag-NPs/GCE was shifted negatively as the pH of the solution increased. This suggested that the NIC oxidation reaction was pH dependent. At pH 8, the highest Ipa was attained. NIC is a base that is not very strong and has two acidic properties. It has pKa1 of 8.02, and pKa2 of 3.12. When it accepts a proton, it becomes the form of tetrahydropyrrole nitrogen that has only one proton. When it loses a proton, it becomes the form of pyridine nitrogen that has no proton. These forms were found for NIC molecules [50,51]. Additionally, Figure 11b illustrates the correlation between the pH and Epa of NIC, which gave a slope of −68.4 mV/pH. The measured value was comparable to the theoretical value of −59 mV/pH as per the Nernst equation, indicating that the oxidation of nicotine on Ag-NPs/GCE involved an equivalent number of electrons and protons.

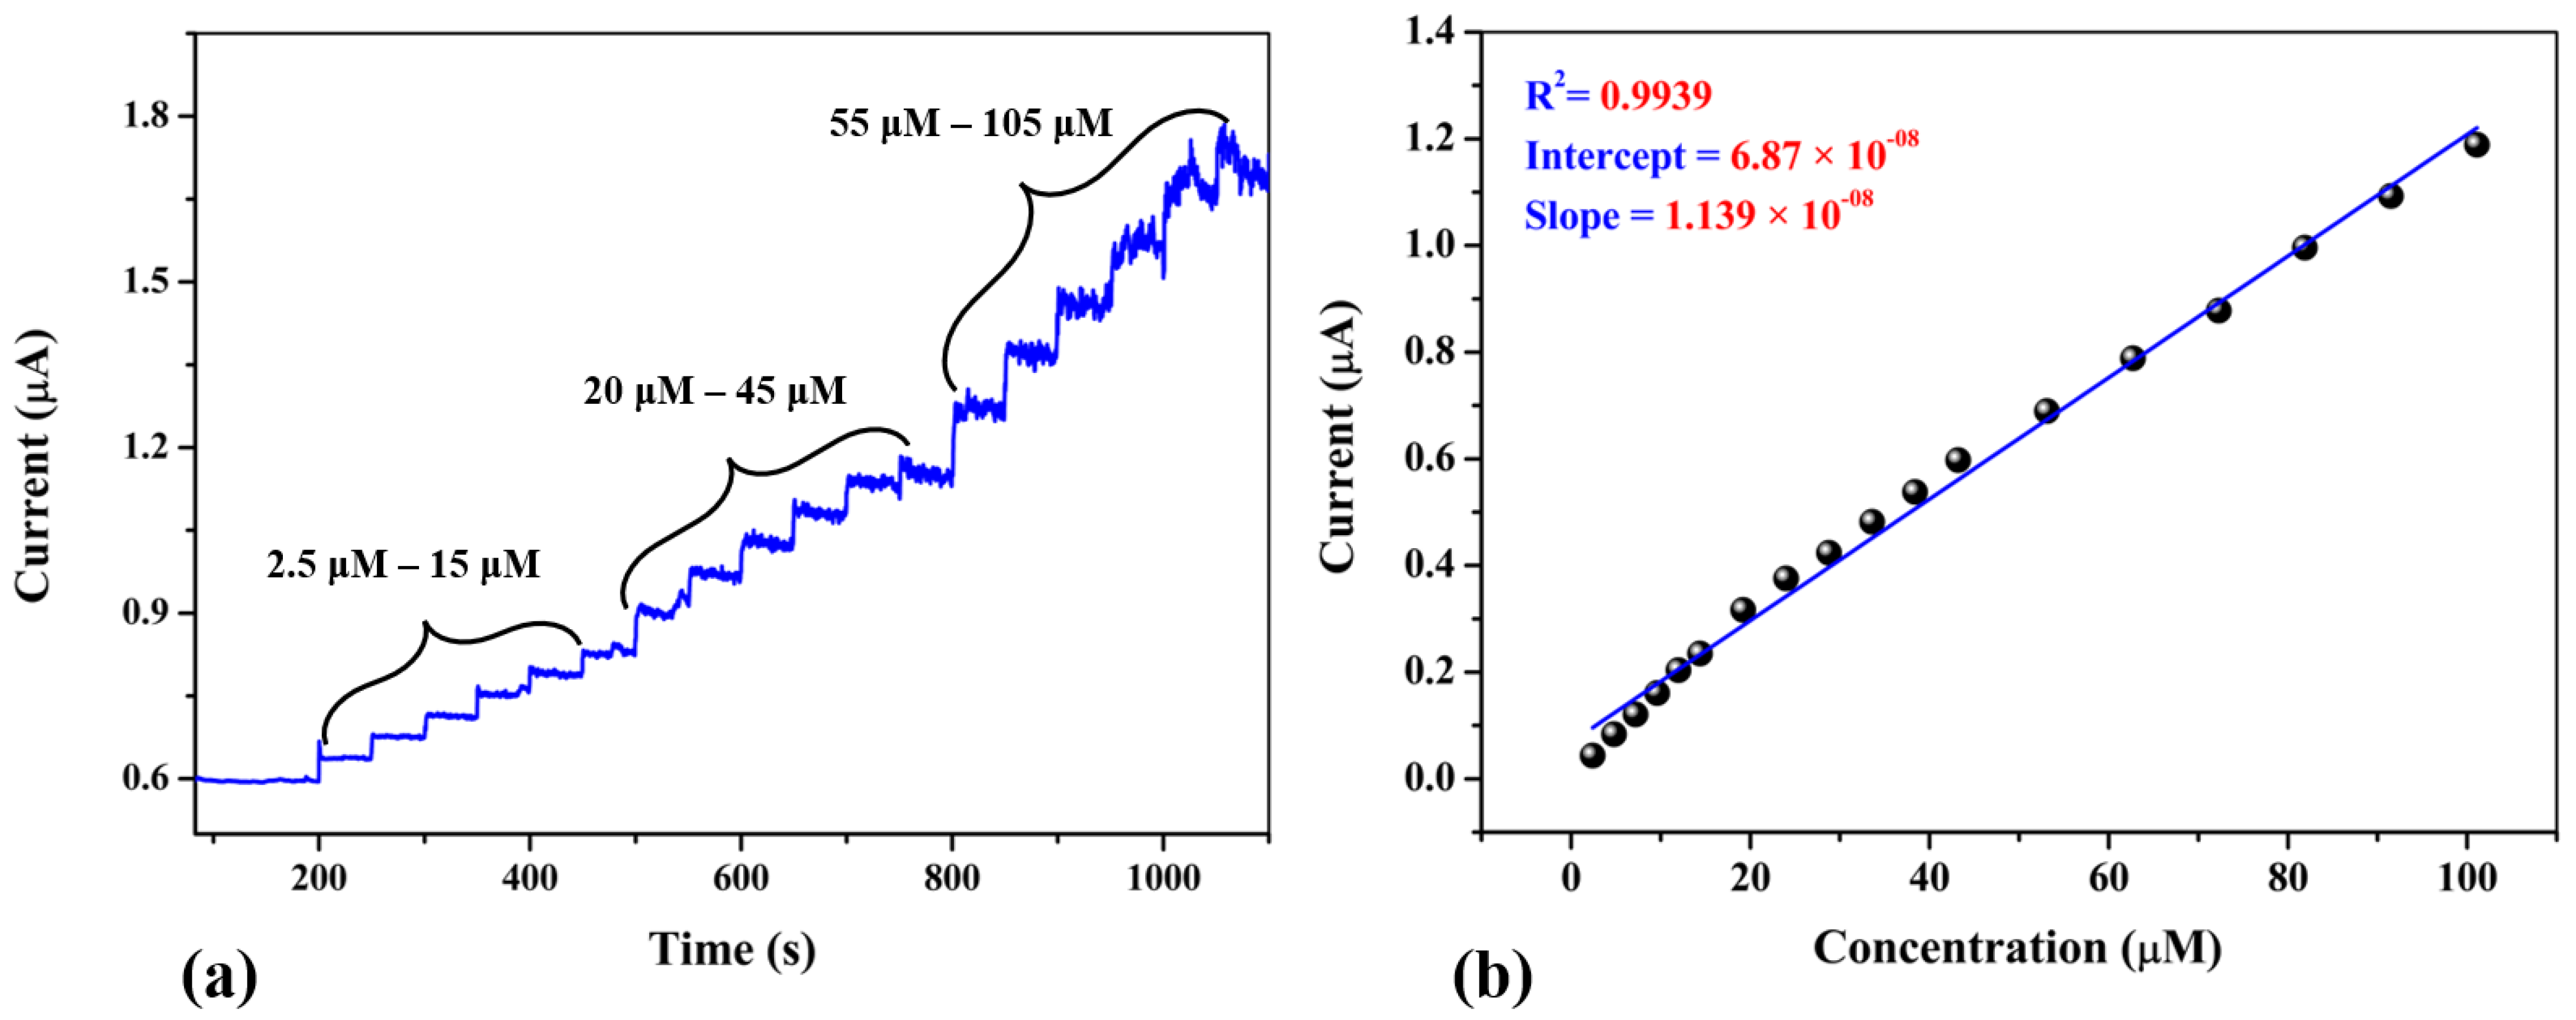
3.6. Amperometric Study

Since amperometry (I-T) could provide a low detection limit, great sensitivity, and excellent reproducibility, this technique was more frequently used to detect various analytes. The amperometric response of the Ag-NPs/GCE was recorded at an applied potential of 1.0 V in 0.1 M PBS (pH 7.4) containing various concentrations of NIC (Figure 12a). During this measurement, the buffer solution was stirred using a magnetic pellet at a speed of 750 rpm. To determine the standard deviation, amperograms were performed using a newly prepared Ag-NPs/GCE. Also, a calibration graph of NIC was made by plotting NIC concentrations against oxidation currents as shown in Figure 12b. With the addition of NIC concentrations, the oxidation peak currents were increased linearly. A linear relationship between the amperometric response and NIC concentrations was observed from 2.5 to 105 μM. The linear equation was found to be Y = 1.139 × 10-08x + 6.87 × 10-08, with a correlation coefficient (r2) of 0.9937. By using Equation (4), the limit of detection (LOD) was determined to be 0.135 µM.
LOD = 3.3 SD/S
The standard deviation (SD) and slope of the calibration graph were found to be 4.682 × 10⁻⁸ A and 1.139 × 10⁻⁸ A μM−1, respectively. The response time of the Ag-NPs/GCE was also about 2 s for NIC. Compared to some of the previously published electrochemical sensors, this newly synthesized Ag-NPs based sensor could offer the lowest LOD for NIC, as shown in Table 2.

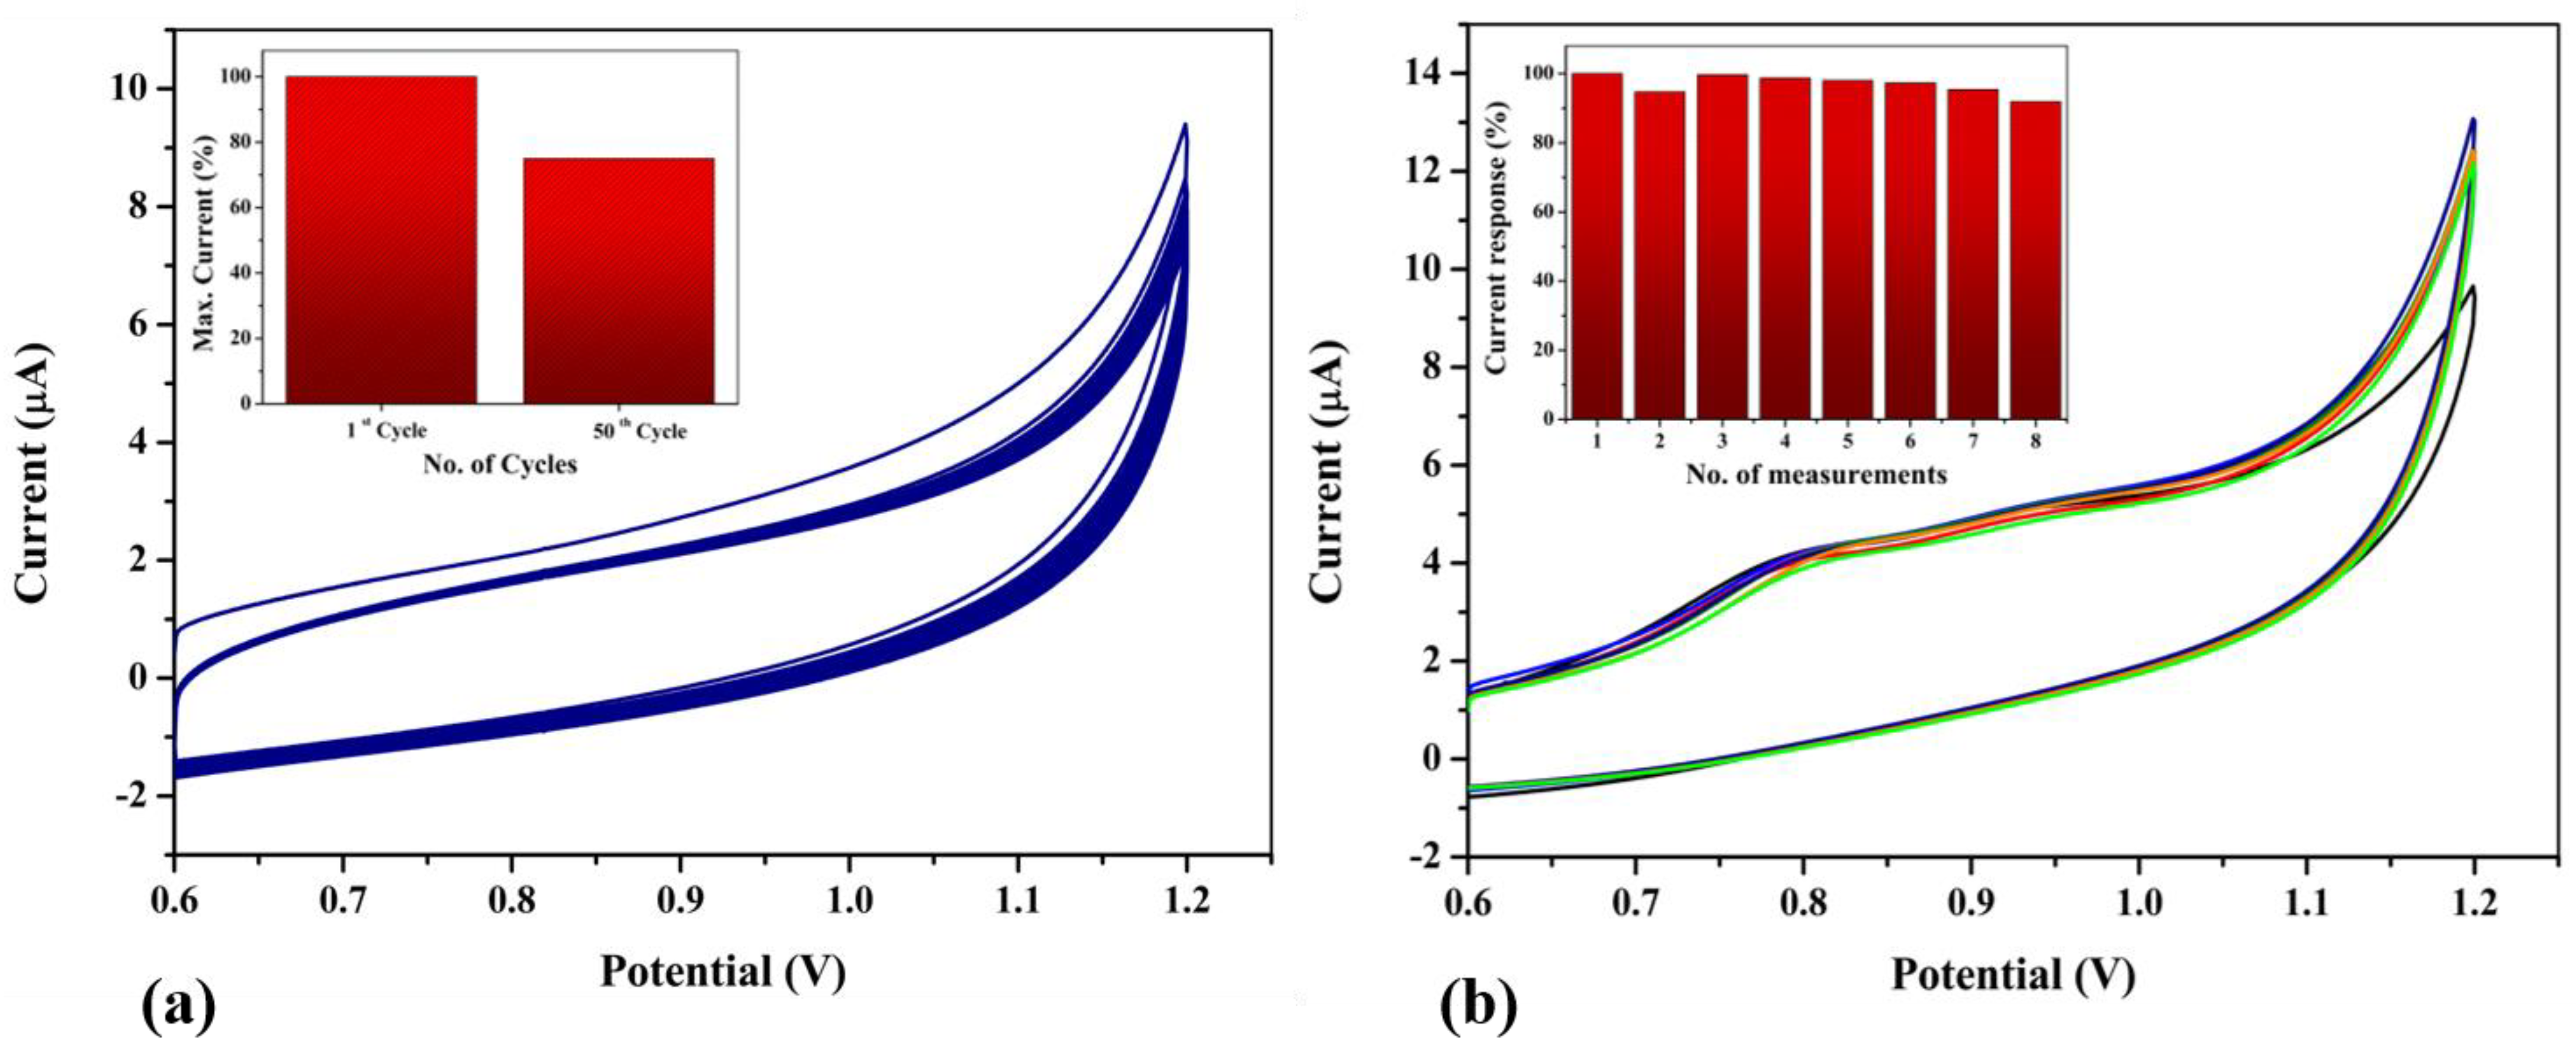
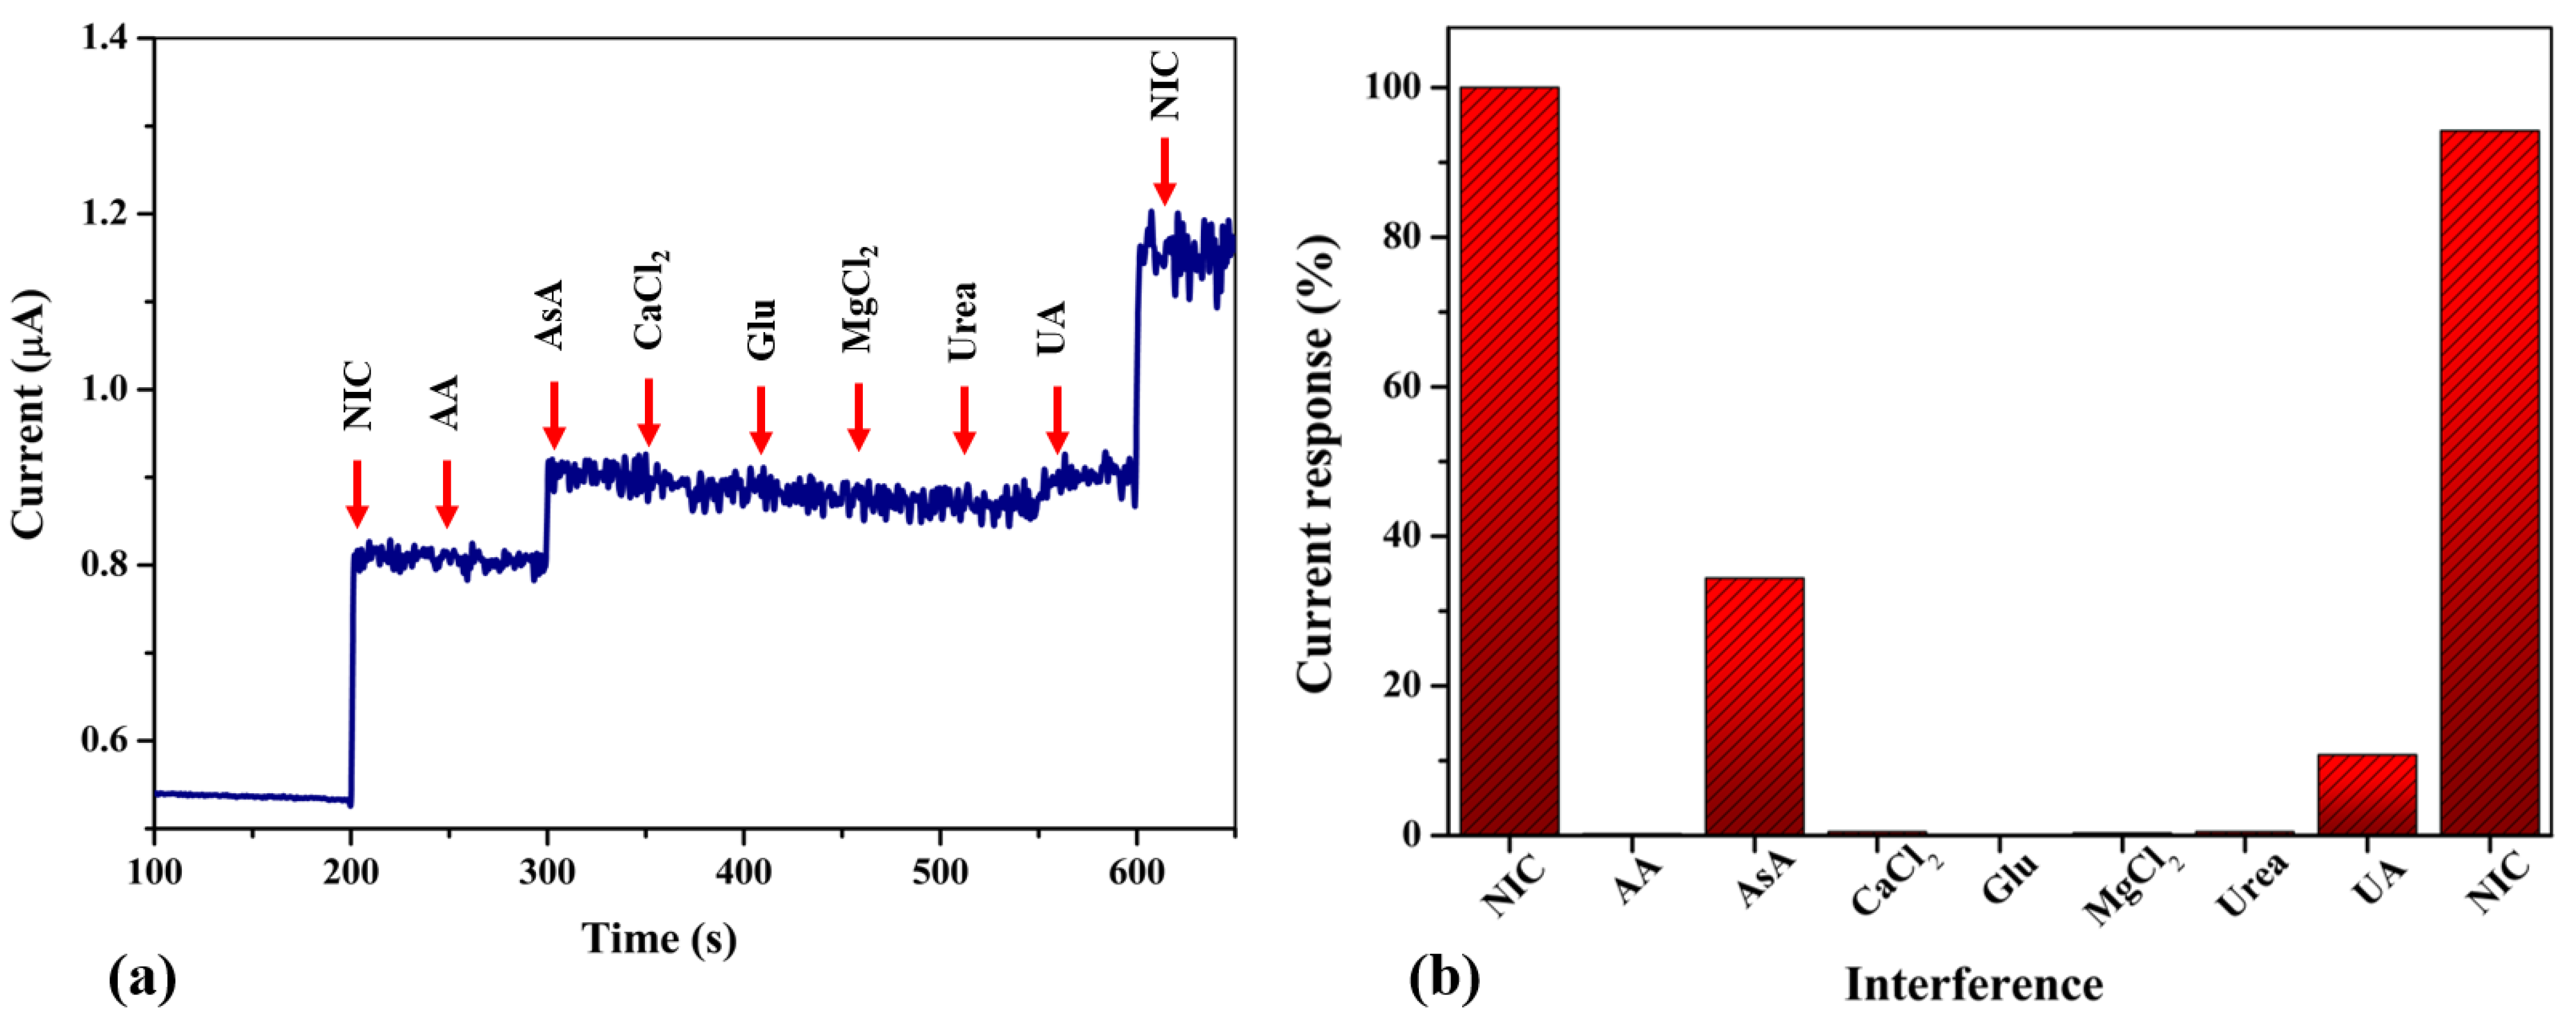
3.7. Stability, Repeatability and Interference Studies

As shown in Figure 13a, the stability of freshly modified Ag-NPs/GCE was studied by recording continuous CVs in 0.1 M PBS for up to 50 potential cycles. It was noticed that background current was decreased only up to 25% at the potential of 1 V. Thus, the majority of the Ag-NPs are still attached to the surface of GCE. Although, some of the material was leached out of the GCE after multiple potential cycles which was commonly reported for various modified electrodes. From this study, it was believed that organic components covered Ag-NPs have firmly adhered to the GCE which can be used for NIC detection. Figure 13b shows the repeatability data for NIC detection on an Ag-NPs/GCE after eight independent measurements of 100 μM NIC in 0.1 M PBS. The bar diagram was also showed that the current response of the sensor for NIC detection was almost stable (inset of Figure 13b), which indicated the good repeatability of the sensor. Next, the selectivity of the newly prepared Ag-NPs/GCE was investigated by recording amperograms with the addition of various interfering molecules with 5 µM NIC, as depicted in Figure 14a. The oxidation responses of commonly encountered chemicals in saliva were also investigated, including acetic acid (AA), ascorbic acid (AsA, 2 µM), calcium chloride (CaCl2), glucose (Glu), magnesium chloride (MgCl2), urea, and uric acid (UA). These interference molecules were mixed with 0.1 M PBS (pH 7.4) and NIC in a 1:1 ratio. As shown in Figure 14b, the oxidation current response was decreased by about ~5% in the presence of these chemicals. This study further suggested that the tested chemicals had no significant impact during the measurement of NIC which may be credited to the organic compounds bound to the nanoparticles surface.

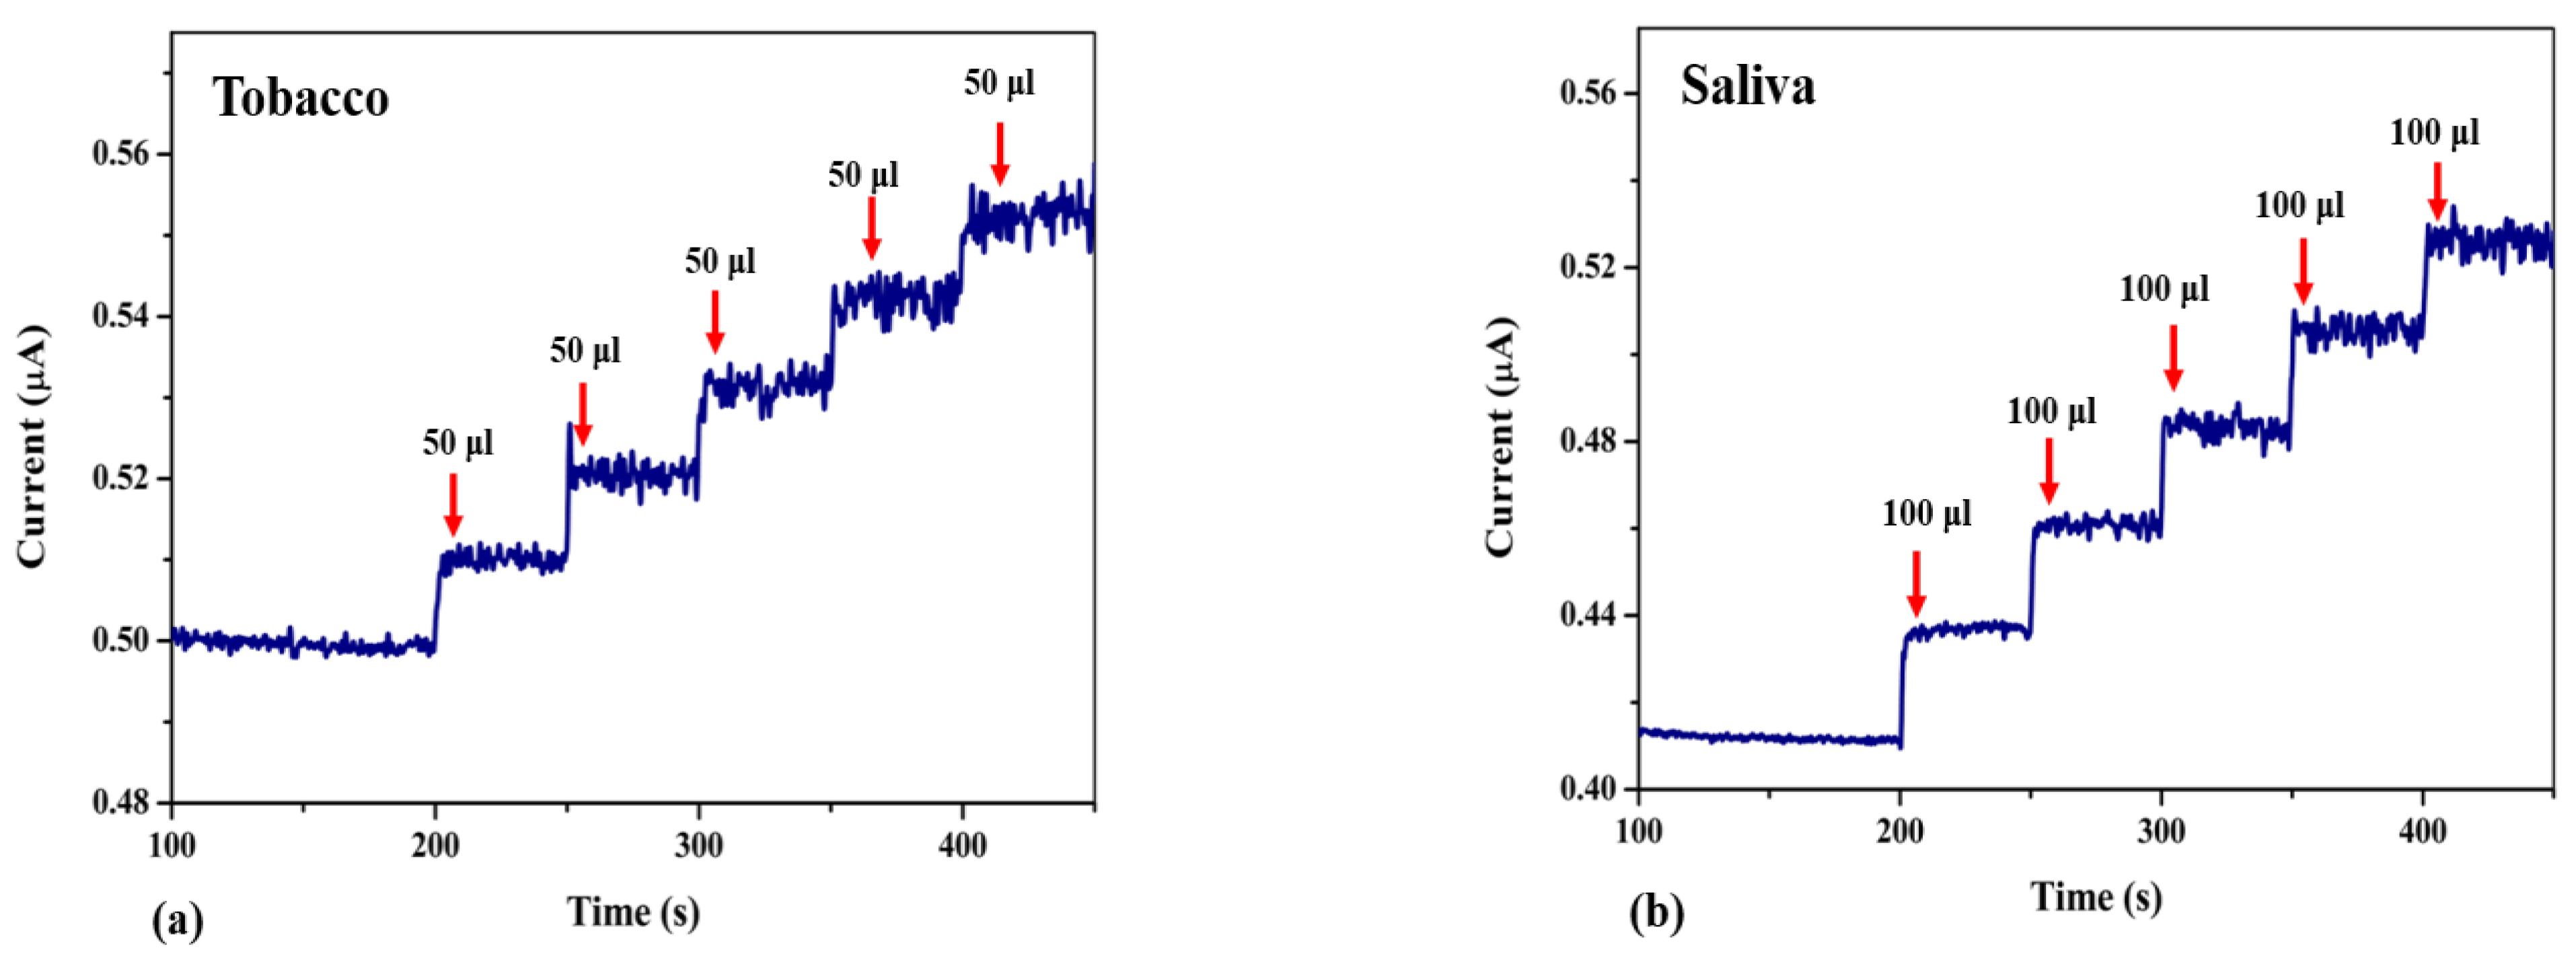
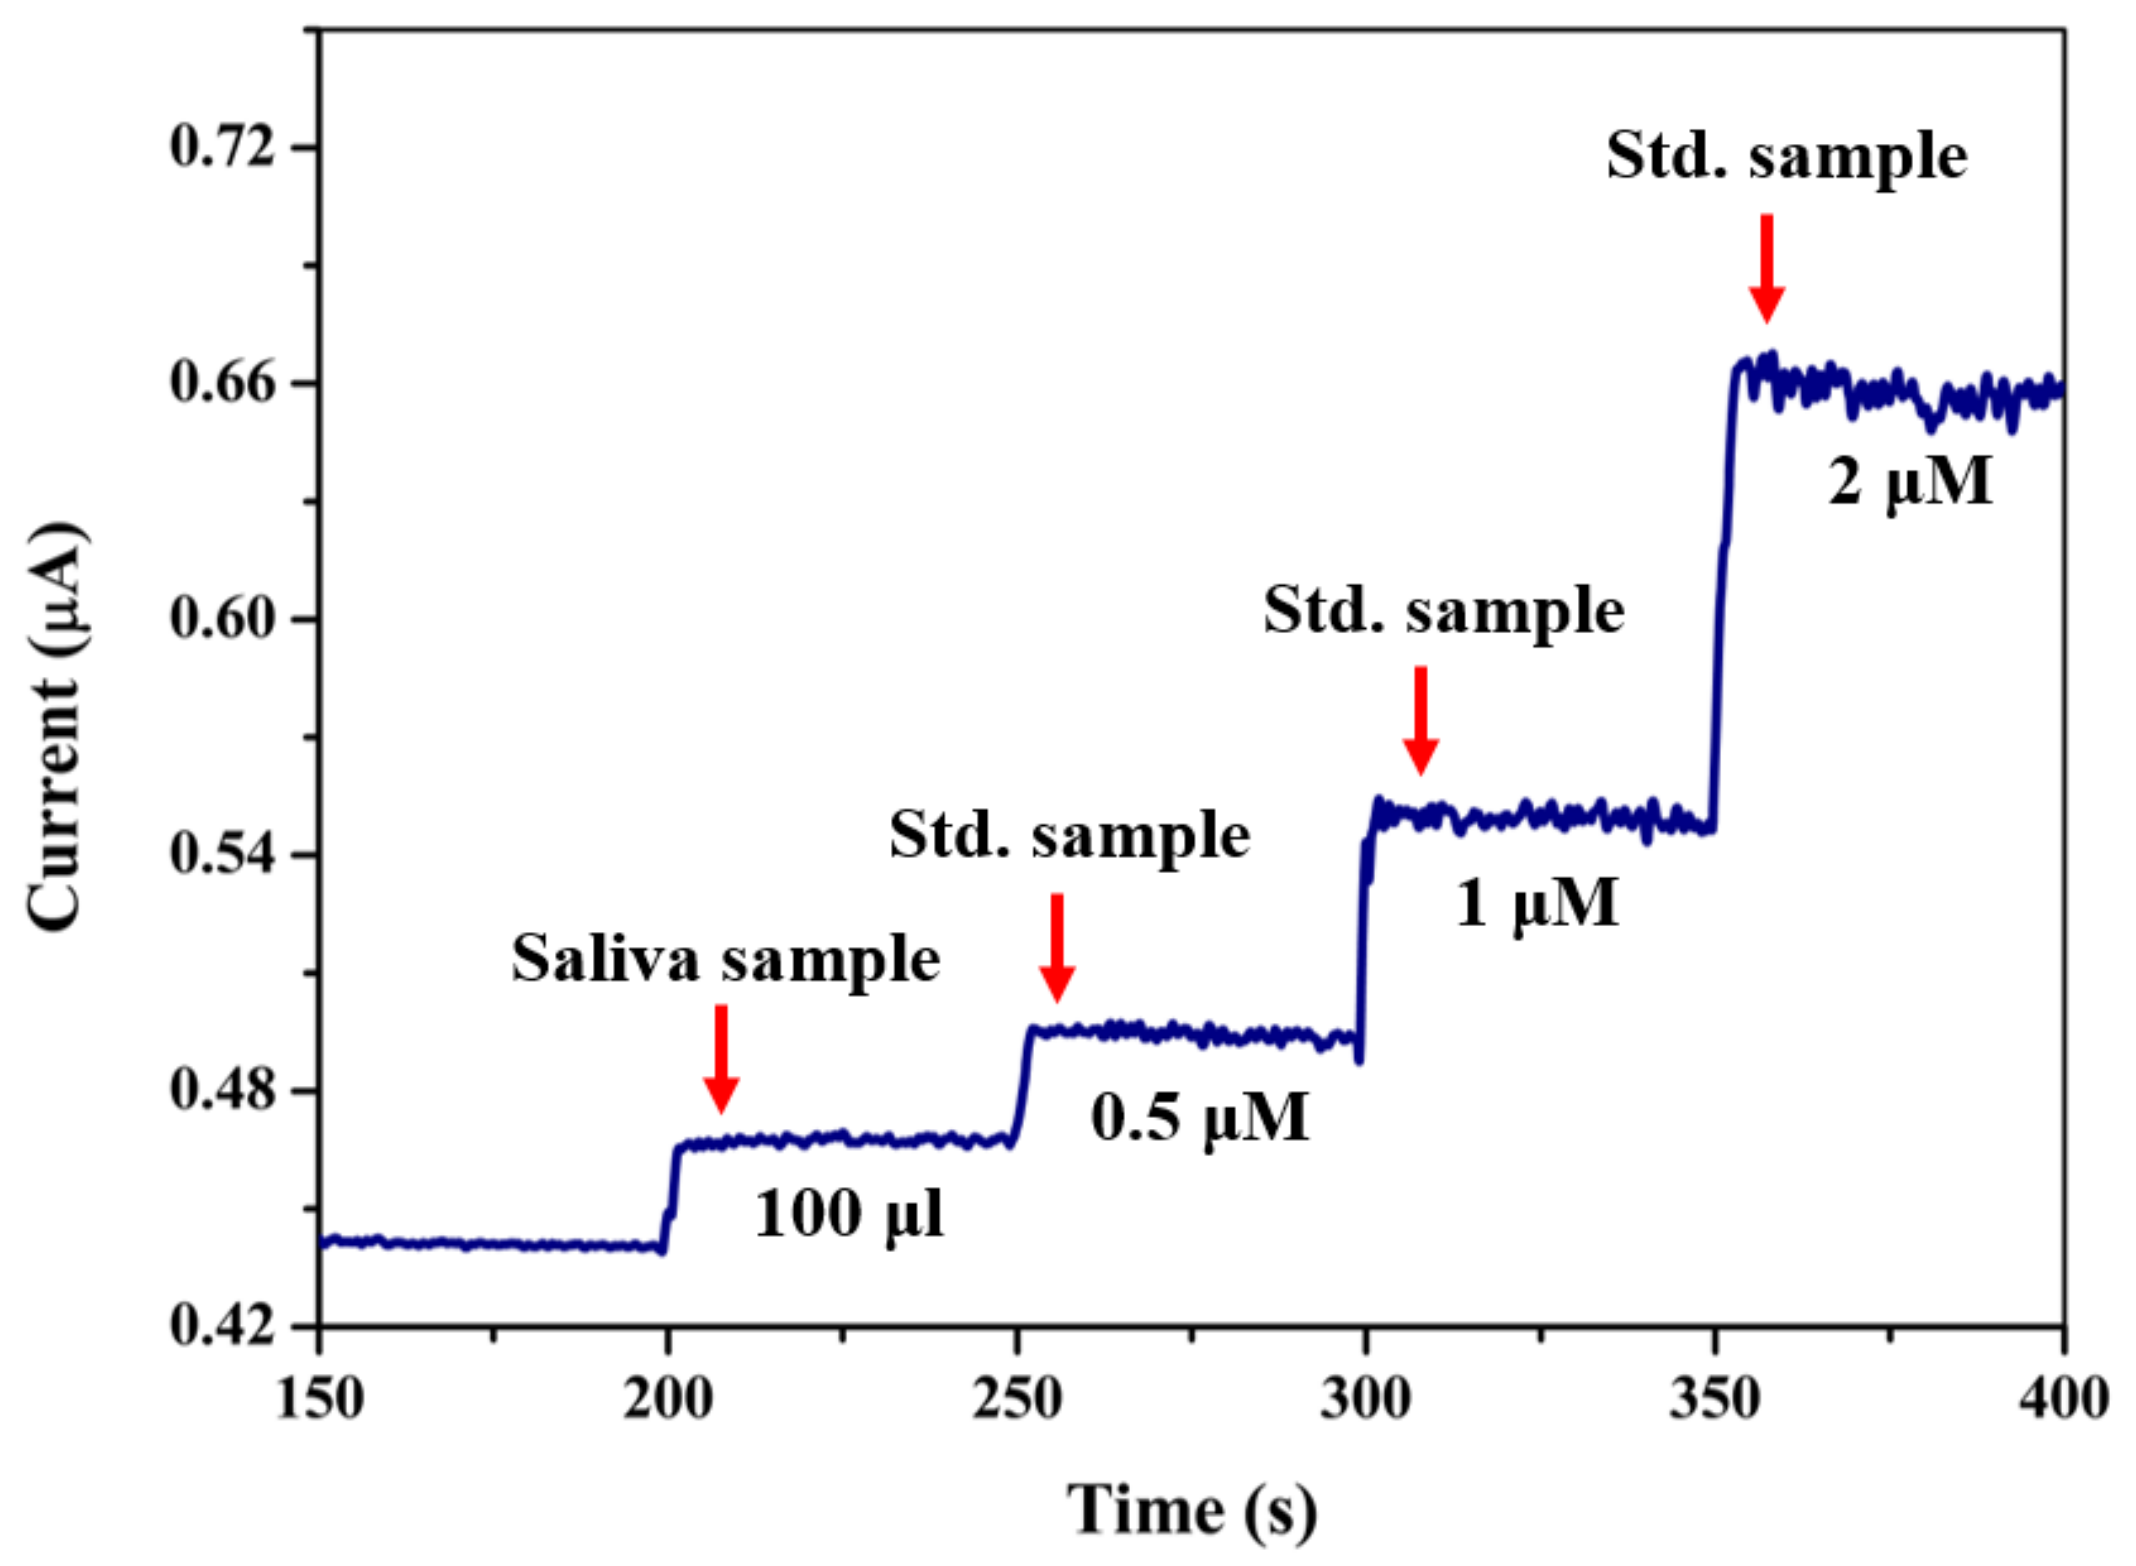
3.8. NIC Detection in Tobacco and Saliva Samples

Figure 15a,b illustrates the amperometric detection of NIC content in tobacco and saliva samples using an Ag-NPs/GCE. These data demonstrated the practical application of the fabricated nanomaterial. For this analysis, salivary samples were collected from a person (age = 62) before and after the consumption of commercially available PAN masala. To conduct further experiments, both of the saliva samples were diluted using DI H2O, sonicated for five minutes, and then centrifuged at 5000 rpm for ten minutes. After the centrifugation, the supernatant was isolated. Various linear concentrations of both tobacco and saliva samples were added separately into PBS, and the resulting amperograms were recorded using an Ag-NPs/GCE. Figure 16 shows that our newly prepared sensor can be used to detect known concentrations of standard NIC solutions that were spiked. Table 3 shows the estimated concentrations of NIC in both the salivary samples and the spiked samples. The recovery values were also calculated which ranged from 98 to 102%. These results suggested that the Ag-NPs/GCE could be used to selectively detect NIC in real samples.

4. Conclusions

In this article, for the first time, we reported a novel green synthesis method to produce Ag-NPs using the fruit extract of Phyllanthus reticulatus (PER). As-synthesized Ag-NPs had been comprehensively analyzed by using FE-SEM, XRD, and UV-Vis spectroscopy. It was found that the Ag-NPs were formed with a spherical shape in the size range from 10–90 nm. FCC crystal structures with a crystallite size of 25.67 nm were measured by XRD data. In addition, the light absorption peak of the nanoparticles was found at 422 nm, which also confirmed that organic compounds were bounded on the surface of Ag-NPs. From CV and EIS results, electrochemical and electrocatalytic properties of Ag-NPs/GCE were measured. CV data indicated the good electrocatalytic activity of the as-prepared Ag-NPs for NIC oxidation in 0.1 M PBS. The conductivity of Ag-NPs was studied by EIS which confirmed that Rct was increased after the modification process. Moreover, using amperometry, the linear range of NIC detection was found to be from 2.5 μM to 105 μM with a detection limit of 0.135 μM and a response time of the sensor was ~2s. We envisage that our proposed sensor could be used for the accurate determination of NIC in tobacco and saliva samples.

Author Contributions

Conceptualization, G.S., K.L.B. and A.K.S.; Methodology, Validation, Formal Analysis, Data Curation, Software, Writing—Original Draft Preparation, G.S. and K.L.B.; Resources, Supervision, Project Administration, Funding Acquisition, Writing—Review & Editing, A.K.S.; Validation, Review, Resources, D.G., R.A., and S.A. All authors have read and agreed to the published version of the manuscript.

Funding

We appreciate the Science and Engineering Research Board (SERB), India and Department of Science and Technology, India for funding through CRG/2021/001517.

Data Availability Statement

Data can be made available upon request.

Conflicts of Interest

The authors declare no conflict of interest.

References

  1. Tobacco. Available online: https://www.who.int/news-room/fact-sheets/detail/tobacco (accessed on 27 January 2023).
  2. Cinková, K.; Dianová, L.; Vojs, M.; Marton, M.; Švorc, Ľ. Rapid Electrochemical Platform for Nicotine Sensing in Cigarettes and Chewing Gums. Acta Chim. Slovaca 2015, 8, 166–171. [Google Scholar] [CrossRef] [Green Version]
  3. Kassa, H.; Geto, A.; Admassie, S. Voltammetric Determination of Nicotine in Cigarette Tobacco at Electrochemically Activated Glassy Carbon Electrode. Bull. Chem. Soc. Ethiop. 2013, 27, 321–328. [Google Scholar] [CrossRef]
  4. Kowalcze, M.; Prof, M.J. Diamond & Related Materials Voltammetric Determination of Nicotine in Electronic Cigarette Liquids Using a Boron-Doped Diamond Electrode (BDDE). Diam. Relat. Mater. 2020, 103, 107710. [Google Scholar] [CrossRef]
  5. Stolerman, I.; Rose, J. Nicotine Psychopharmacology. J. Psychopharmacol. 1992, 6, 545–546. [Google Scholar] [CrossRef] [PubMed]
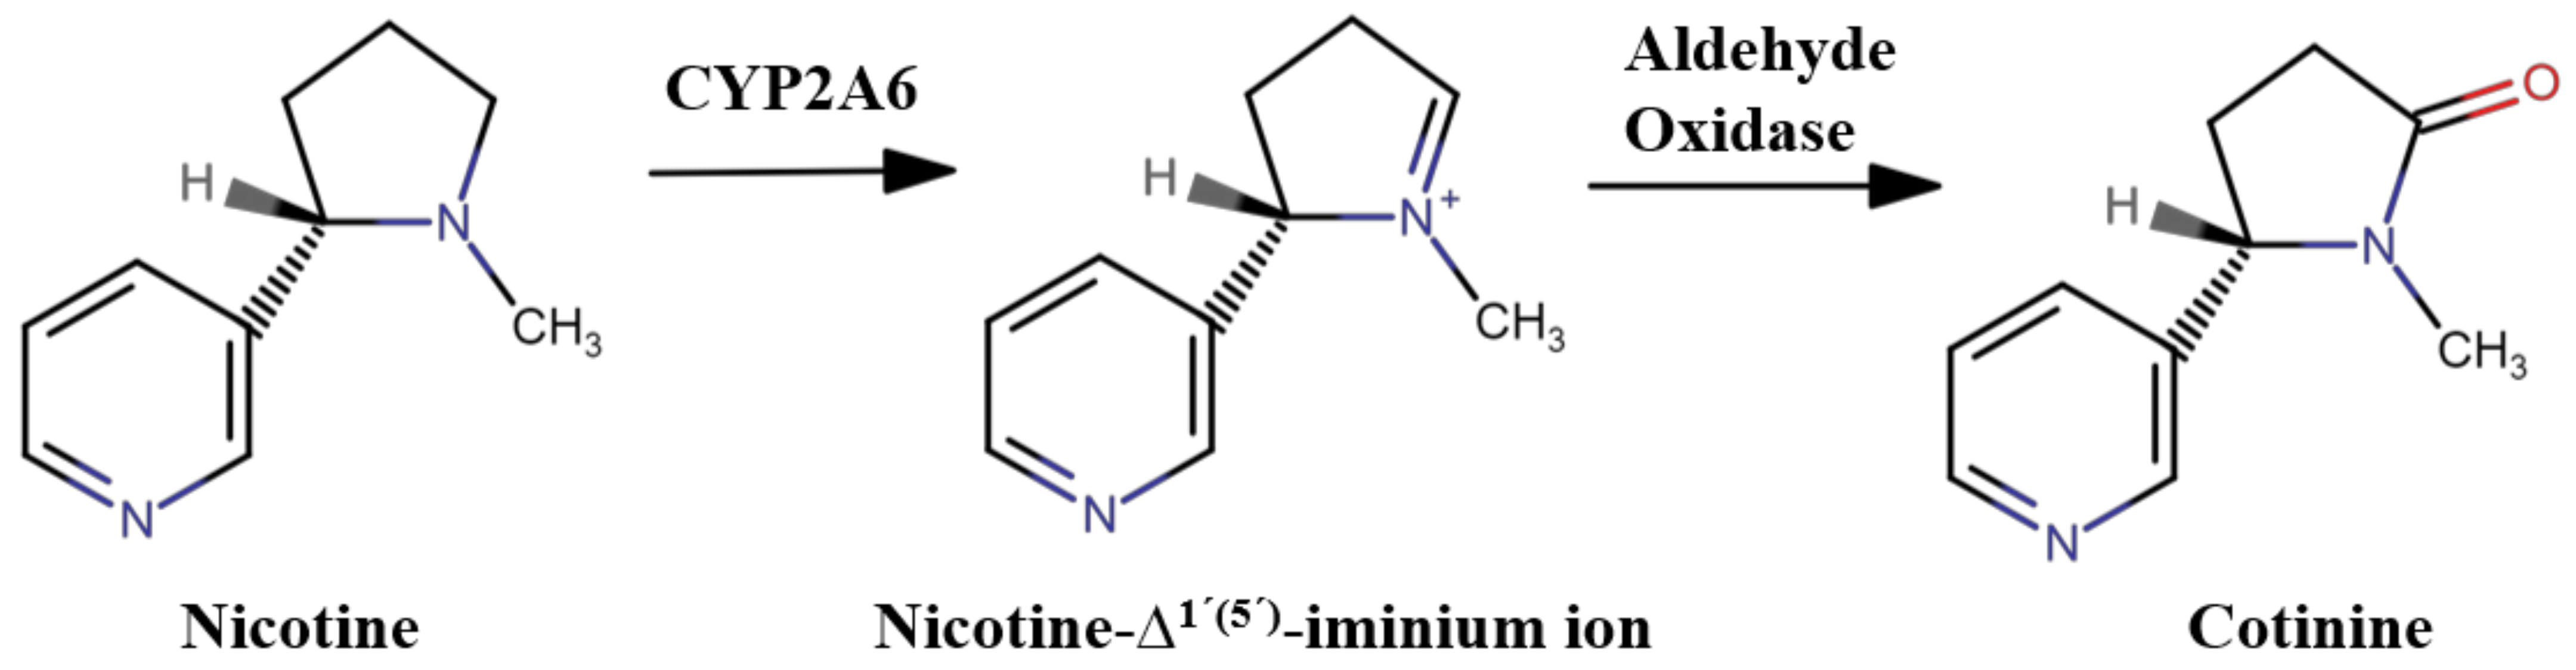
  6. Nakajima, M.; Yamagishi, S.I.; Yamamoto, H.; Yamamoto, T.; Kuroiwa, Y.; Yokoi, T. Deficient Cotinine Formation from Nicotine Is Attributed to the Whole Deletion of the CYP2A6 Gene in Humans. Clin. Pharm. Ther. 2000, 67, 57–69. [Google Scholar] [CrossRef]
  7. Sridharan, G.; Ganapathy, D.; Ramadoss, R.; Atchudan, R.; Arya, S.; Sundramoorthy, A.K. Biosensors for Rapid and Accurate Determination of Oral Cancer. Oral Oncol. Rep. 2023, 5, 100021. [Google Scholar] [CrossRef]
  8. Nicotine Cotinine (Urine)-Health Encyclopedia-University of Rochester Medical Center. Available online: https://www.urmc.rochester.edu/encyclopedia/content.aspx?contentid=nicotine_cotinine&contenttypeid=167 (accessed on 27 January 2023).
  9. Mersal, G.A.M.; Mostafa, N.Y.; Omar, A.E.H. Hydrothermal Synthesis and Processing of Hydrogen Titanate Nanotubes for Nicotine Electrochemical Sensing. Mater. Res. Express 2017, 4, 085031. [Google Scholar] [CrossRef]
  10. Sebokolodi, T.I.; Sipuka, D.S.; Muzenda, C.; Nkwachukwu, O.V.; Nkosi, D.; Arotiba, O.A. Electrochemical Detection of Nicotine at a Carbon Nanofiber-Poly(Amidoamine) Dendrimer Modified Glassy Carbon Electrode. Chemosphere 2022, 303, 134961. [Google Scholar] [CrossRef]
  11. Kuo, C.Y.; Wu, S.M. High-Performance Liquid Chromatography with Electrochemical Detection for Analysis of Gliclazide in Plasma. J. Chromatogr. A 2005, 1088, 131–135. [Google Scholar] [CrossRef]
  12. Bezuneh, T.T.; Fereja, T.H.; Kitte, S.A.; Li, H.; Jin, Y. Gold Nanoparticle-Based Signal Amplified Electrochemiluminescence for Biosensing Applications. Talanta 2022, 248, 123611. [Google Scholar] [CrossRef]
  13. Ozcelikay, G.; Bakirhan, N.K.; Ozkan, S.A. Novel Advances in Nanomaterial-Based Electrochemical Sensing of the Biomarker. Detect. Biomarkers 2022, 209–224. [Google Scholar] [CrossRef]
  14. Jerome, R.; Sundramoorthy, A.K. Preparation of Hexagonal Boron Nitride Doped Graphene Film Modified Sensor for Selective Electrochemical Detection of Nicotine in Tobacco Sample. Anal. Chim. Acta 2020, 1132, 110–120. [Google Scholar] [CrossRef]
  15. Molaakbari, E.; Mostafavi, A.; Beitollahi, H. First Electrochemical Report for Simultaneous Determination of Norepinephrine, Tyrosine and Nicotine Using a Nanostructure Based Sensor. Electroanalysis 2014, 26, 2252–2260. [Google Scholar] [CrossRef]
  16. Fekry, A.M.; Azab, S.M.; Shehata, M.; Ameer, M.A. A Novel Electrochemical Nicotine Sensor Based on Cerium Nanoparticles with Anionic Surfactant. RSC Adv. 2015, 5, 51662–51671. [Google Scholar] [CrossRef]
  17. Preethika, M.; Sundramoorthy, A.K. Humic Acid/Halloysite Nanotube/Flavin Adenine Dinucleotide Nanocomposite Based Selective Electrochemical Biosensor for Hydrogen Peroxide. Appl. Surf Sci. 2019, 488, 503–511. [Google Scholar] [CrossRef]
  18. Murugan, N.; Jerome, R.; Preethika, M.; Sundaramurthy, A.; Sundramoorthy, A.K. 2D-Titanium Carbide (MXene) Based Selective Electrochemical Sensor for Simultaneous Detection of Ascorbic Acid, Dopamine and Uric Acid. J. Mater. Sci. Technol. 2021, 72, 122–131. [Google Scholar] [CrossRef]
  19. Nagarajan, R.D.; Murugan, P.; Palaniyandi, K.; Atchudan, R.; Sundramoorthy, A.K. Biocompatible MXene (Ti3C2Tx) Immobilized with Flavin Adenine Dinucleotide as an Electrochemical Transducer for Hydrogen Peroxide Detection in Ovarian Cancer Cell Lines. Micromachines 2021, 12, 862. [Google Scholar] [CrossRef]
  20. Murugan, P.; Sundramoorthy, A.K.; Ganapathy, D.; Atchudan, R.; Nallaswamy, D.; Khosla, A. Electrochemical Detection of H2O2 Using an Activated Glassy Carbon Electrode. ECS Sens. Plus 2022, 1, 034401. [Google Scholar] [CrossRef]
  21. Murugan, P.; Nagarajan, R.D.; Shetty, B.H.; Govindasamy, M.; Sundramoorthy, A.K. Recent Trends in the Applications of Thermally Expanded Graphite for Energy Storage and Sensors–A Review. Nanoscale Adv. 2021, 3, 6294–6309. [Google Scholar] [CrossRef] [PubMed]
  22. Murugan, P.; Annamalai, J.; Atchudan, R.; Govindasamy, M.; Nallaswamy, D.; Ganapathy, D.; Reshetilov, A.; Sundramoorthy, A.K. Electrochemical Sensing of Glucose Using Glucose Oxidase/PEDOT: 4-Sulfocalix [4] Arene/MXene Composite Modified Electrode. Micromachines 2022, 13, 304. [Google Scholar] [CrossRef] [PubMed]
  23. Rajendran, J.; Kannan, T.S.; Dhanasekaran, L.S.; Murugan, P.; Atchudan, R.; ALOthman, Z.A.; Ouladsmane, M.; Sundramoorthy, A.K. Preparation of 2D Graphene/MXene Nanocomposite for the Electrochemical Determination of Hazardous Bisphenol A in Plastic Products. Chemosphere 2022, 287, 132106. [Google Scholar] [CrossRef] [PubMed]
  24. Amr, A.E.G.E.; Kamel, A.H.; Almehizia, A.A.; Sayed, A.Y.A.; Elsayed, E.A.; Abd-Rabboh, H.S.M. Paper-Based Potentiometric Sensors for Nicotine Determination in Smokers’ Sweat. ACS Omega 2021, 6, 11340–11347. [Google Scholar] [CrossRef] [PubMed]
  25. Rauwel, P.; Küünal, S.; Ferdov, S. A Review on Green Synthesis of Silver. Adv. Mater. Sci. Eng. 2014, 2015, 682749. [Google Scholar]
  26. Al-Ghamdi, A.Y. Antimicrobial and Catalytic Activities of Green Synthesized Silver Nanoparticles Using Bay Laurel (Laurus Nobilis) Leaves Extract. J. Biomater. Nanobiotechnol. 2019, 10, 26–39. [Google Scholar] [CrossRef] [Green Version]
  27. Nagarajan, R.D.; Sundramoorthy, A.K. One-Pot Electrosynthesis of Silver Nanorods/Graphene Nanocomposite Using 4-Sulphocalix[4]Arene for Selective Detection of Oxalic Acid. Sens. Actuators B Chem. 2019, 301, 127132. [Google Scholar] [CrossRef]
  28. Roy, A.; Bulut, O.; Some, S.; Mandal, A.K.; Yilmaz, M.D. Green Synthesis of Silver Nanoparticles: Biomolecule-Nanoparticle Organizations Targeting Antimicrobial Activity. RSC Adv. 2019, 9, 2673–2702. [Google Scholar] [CrossRef] [Green Version]
  29. Mousavi, S.M.; Hashemi, S.A.; Ghasemi, Y.; Atapour, A.; Amani, A.M.; Savar Dashtaki, A.; Babapoor, A.; Arjmand, O. Green Synthesis of Silver Nanoparticles toward Bio and Medical Applications: Review Study. Artif. Cells Nanomed. Biotechnol. 2018, 46, S855–S872. [Google Scholar] [CrossRef] [Green Version]
  30. Jing, Y.; Ning, S.; Guan, Y.; Cao, M.; Li, J.; Zhu, L.; Zhang, Q.; Cheng, C.; Deng, Y. Electrochemical Determination of Nicotine in Tobacco Products Based on Biosynthesized Gold Nanoparticles. Front. Chem. 2020, 8, 922. [Google Scholar] [CrossRef]
  31. Debnath, B.; Das, R. Controlled Synthesis of Saponin-Capped Silver Nanotriangles and Their Optical Properties. Plasmonics 2019, 14, 1365–1375. [Google Scholar] [CrossRef]
  32. Birusanti, A.B.; Mallavarapu, U.; Nayakanti, D.; Espenti, C.S.; Mala, S. Sustainable Green Synthesis of Silver Nanoparticles by Using Rangoon Creeper Leaves Extract and Their Spectral Analysis and Anti-Bacterial Studies. IET Nanobiotechnol. 2019, 13, 71–76. [Google Scholar] [CrossRef]
  33. Matter, I.A.; Darwesh, O.M.; Matter, H.A.B. Nanomaterials for Soil Remediation; Elsevier: Amsterdam, The Netherlands, 2021; pp. 221–237. [Google Scholar]
  34. Srikar, S.K.; Giri, D.D.; Pal, D.B.; Mishra, P.K.; Upadhyay, S.N.; Srikar, S.K.; Giri, D.D.; Pal, D.B.; Mishra, P.K.; Upadhyay, S.N. Light Induced Green Synthesis of Silver Nanoparticles Using Aqueous Extract of Prunus Amygdalus. Green Sustain. Chem. 2016, 6, 26–33. [Google Scholar] [CrossRef] [Green Version]
  35. Mandal, S.; Marpu, S.B.; Hughes, R.; Omary, M.A.; Shi, S.Q. Green Synthesis of Silver Nanoparticles Using Cannabis Sativa Extracts and Their Anti-Bacterial Activity. Green Sustain. Chem. 2021, 11, 28–38. [Google Scholar] [CrossRef]
  36. Thi Lan Huong, V.; Nguyen, N.T. Green Synthesis, Characterization and Antibacterial Activity of Silver Nanoparticles Using Sapindus Mukorossi Fruit Pericarp Extract. Mater. Today Proc. 2019, 42, 88–93. [Google Scholar] [CrossRef]
  37. Widdatallah, M.O.; Mohamed, A.A.; Alrasheid, A.A.; Widatallah, H.A.; Yassin, L.F.; Eltilib, S.H.; Ahmed, S.A.R. Green Synthesis of Silver Nanoparticles Using Nigella Sativa Seeds and Evaluation of Their Antibacterial Activity. Adv. Nanopart. 2020, 9, 41–48. [Google Scholar] [CrossRef] [Green Version]
  38. Rautela, A.; Rani, J.; Debnath (Das), M. Green Synthesis of Silver Nanoparticles from Tectona Grandis Seeds Extract: Characterization and Mechanism of Antimicrobial Action on Different Microorganisms. J. Anal. Sci. Technol. 2019, 10, 1–10. [Google Scholar] [CrossRef] [Green Version]
  39. Mote, V.; Purushotham, Y.; Dole, B. Williamson-Hall Analysis in Estimation of Lattice Strain in Nanometer-Sized ZnO Particles. J. Theor. Appl. Phys. 2012, 6, 2–9. [Google Scholar] [CrossRef] [Green Version]
  40. Meva, F.E.; Mbeng, J.O.A.; Ebongue, C.O.; Schlüsener, C.; Kökçam-Demir, Ü.; Ntoumba, A.A.; Kedi, P.B.E.; Elanga, E.; Loudang, E.-R.N.; Nko’o, M.H.J.; et al. Stachytarpheta Cayennensis Aqueous Extract, a New Bioreactor towards Silver Nanoparticles for Biomedical Applications. J. Biomater. Nanobiotechnol. 2019, 10, 102–119. [Google Scholar] [CrossRef] [Green Version]
  41. Dhar, S.A.; Chowdhury, R.A.; Das, S.; Nahian, M.K.; Islam, D.; Gafur, M.A. Plant-Mediated Green Synthesis and Characterization of Silver Nanoparticles Using Phyllanthus Emblica Fruit Extract. Mater. Today Proc. 2021, 42, 1867–1871. [Google Scholar] [CrossRef]
  42. Okafor, F.; Janen, A.; Kukhtareva, T.; Edwards, V.; Curley, M. Green Synthesis of Silver Nanoparticles, Their Characterization, Application and Antibacterial Activity. Int. J. Environ. Res. Public Health 2013, 10, 5221–5238. [Google Scholar] [CrossRef] [Green Version]
  43. Elemike, E.E.; Dare, E.O.; Samuel, I.D.; Onwuka, J.C. 2-Imino-(3,4-Dimethoxybenzyl) Ethanesulfonic Acid Schiff Base Anchored Silver Nanocomplex Mediated by Sugarcane Juice and Their Antibacterial Activities. J. Appl. Res. Technol. JART 2016, 14, 38–46. [Google Scholar] [CrossRef] [Green Version]
  44. Osonga, F.J.; Le, P.; Luther, D.; Sakhaee, L.; Sadik, O.A. Water-Based Synthesis of Gold and Silver Nanoparticles with Cuboidal and Spherical Shapes Using Luteolin Tetraphosphate at Room Temperature. Environ. Sci. Nano 2018, 5, 917–932. [Google Scholar] [CrossRef]
  45. Nycz, M.; Arkusz, K.; Pijanowska, D.G. Influence of the Silver Nanoparticles (AgNPs) Formation Conditions onto Titanium Dioxide (TiO2) Nanotubes Based Electrodes on Their Impedimetric Response. Nanomaterials 2019, 9, 1072. [Google Scholar] [CrossRef] [PubMed] [Green Version]
  46. Sundramoorthy, A.K.; Chen, S.-L.; Chen, S.-M. Disposable Redox Polymer Coated Screen-Printed Carbon Electrode for NADH Sensing. Micro Nanosyst. 2012, 4, 172–179. [Google Scholar] [CrossRef] [Green Version]
  47. Kumar, T.H.V.; Sundramoorthy, A.K. Electrochemical Biosensor for Methyl Parathion Based on Single-Walled Carbon Nanotube/Glutaraldehyde Crosslinked Acetylcholinesterase-Wrapped Bovine Serum Albumin Nanocomposites. Anal. Chim. Acta 2019, 1074, 131–141. [Google Scholar] [CrossRef] [PubMed]
  48. Jing, Y.; Yu, B.; Li, P.; Xiong, B.; Cheng, Y.; Li, Y.; Li, C.; Xiao, X.; Chen, M.; Chen, L.; et al. Synthesis of Graphene/DPA Composite for Determination of Nicotine in Tobacco Products. Sci. Rep. 2017, 7, 14332. [Google Scholar] [CrossRef] [Green Version]
  49. Magesh, V.; Sundramoorthy, A.K.; Ganapathy, D.; Atchudan, R.; Arya, S.; Alshgari, R.A.; Aljuwayid, A.M. Palladium Hydroxide (Pearlman’s Catalyst) Doped MXene (Ti3C2Tx) Composite Modified Electrode for Selective Detection of Nicotine in Human Sweat. Biosensors 2022, 13, 54. [Google Scholar] [CrossRef]
  50. Takeda, N.; Hirata, K.; Tsuruta, K.; Santis, G.D.; Xantheas, S.S.; Ishiuchi, S.I.; Fujii, M. Gas Phase Protonated Nicotine Is a Mixture of Pyridine- and Pyrrolidine-Protonated Conformers: Implications for Its Native Structure in the Nicotinic Acetylcholine Receptor. Phys. Chem. Chem. Phys. 2022, 24, 5786–5793. [Google Scholar] [CrossRef]
  51. Ameer, M.A.; Fekry, A.M.; Azab, S.M.; Shehata, M. Synthesis of a Simply Modified Electrochemical Nicotine Sensor Based on Silver Nanoparticles. Can. J. Chem. 2018, 96, 821–827. [Google Scholar] [CrossRef]
  52. Xiong, H.; Zhao, Y.; Liu, P.; Zhang, X.; Wang, S. Electrochemical Properties and the Determination of Nicotine at a Multi-Walled Carbon Nanotubes Modified Glassy Carbon Electrode. Microchim. Acta 2010, 168, 31–36. [Google Scholar] [CrossRef]
  53. Stočes, M.; Švancara, I. Electrochemical Behavior of Nicotine at Unmodified Carbon Paste Electrode and Its Determination in a Set of Refilling Liquids for Electronic Cigarettes. Electroanalysis 2014, 26, 2655–2663. [Google Scholar] [CrossRef]
  54. Li, X.; Zhao, H.; Shi, L.; Zhu, X.; Lan, M.; Zhang, Q.; Hugh Fan, Z. Electrochemical Sensing of Nicotine Using Screen-Printed Carbon Electrodes Modified with Nitrogen-Doped Graphene Sheets. J. Electroanal. Chem. 2017, 784, 77–84. [Google Scholar] [CrossRef]
  55. Liang, J.; Han, F.; Chen, Y. An Electrochemical Method for high Sensitive Detection of Nicotine and Its Interaction with Bovine Serum Albumin. Electrochem. Commun. 2012, 24, 93–96. [Google Scholar] [CrossRef]
Figure 1. Chemical transition of nicotine to cotinine by liver.
Crystals 13 00589 g001
Figure 2. Schematic representation of green synthesis of Ag-NPs for electrochemical detection of NIC.
Crystals 13 00589 g002
Figure 3. X−ray diffractogram of Ag-NPs on a silicon substrate.
Crystals 13 00589 g003
Figure 4. Williamson Hall Plot of β cos θ vs. 4 sin θ of Ag-NPs sample.
Crystals 13 00589 g004
Figure 5. UV–visible spectra of (red curve) PER fruit extract and (blue curve) Ag-NPs synthesized by using phytochemical agents present in the Phyllanthus reticulatus fruit extract. The peak at 422 nm corresponds to the surface plasmon resonance of Ag-NPs.
Crystals 13 00589 g005
Figure 6. (a) FE-SEM images of Ag-NPs prepared using PER fruit extract, (b) magnified image of Ag-NPs as shown in red square on image (a), and (c) particle size distribution of Ag-NPs.
Crystals 13 00589 g006aCrystals 13 00589 g006b
Figure 7. The Nyquist plots of bare GCE and Ag-NPs/GCE in a solution containing 5 mM [Fe(CN)6]−3/−4 in 0.1 M KCl with an equivalent circuit diagram (inset).
Crystals 13 00589 g007
Figure 8. Cyclic voltammograms of Ag-NPs/GCE (i) and bare GCE (ii) were recorded in 0.1 M PBS containing 100 μM of NIC at a scan rate of 50 mV/s. CVs of bare GCE in the solution without NIC (iii).
Crystals 13 00589 g008
Figure 9. Cyclic voltammograms were recorded using Ag-NPs/GCE with different concentration of NIC (0 μM, 10 μM, 50 μM, 100 μM, 150 μM and 200 μM) in 0.1 M PBS at a scan rate of 50 mV/s.
Crystals 13 00589 g009
Figure 10. (a) CVs were recorded using Ag-NPs/GCE at different scan rates (20, 40, 60, 80, 100, 125, 150 and 175 mV/s) in 0.1 M PBS with 100 μM NIC. (b) The linear plot was made between the square root of scan rate and oxidation peak currents of NIC.
Crystals 13 00589 g010
Figure 11. (a) CVs of Ag −NPs modified GCE were recorded in different pH solutions containing 150 μM of NIC (pH 4 (i), pH 6 (ii), pH 7.4 (iii), and pH 8 (iv)) at a scan rate of 50 mV/s. (b) The correlation between various pH and oxidation potential of NIC.
Crystals 13 00589 g011
Figure 12. (a) Typical steady state amperometric measurement of nicotine oxidation at 1.0 V (vs. Ag/AgCl) with successive additions of nicotine from 2.5 to 105 µM in 0.1 M PBS. (b) Calibration curve of NIC which was made by Ipa vs. [NIC].
Crystals 13 00589 g012
Figure 13. (a) CVs were recorded using an Ag-NPs/GCE for continues 50 cycles in 0.1 M PBS at a scan rate of 50 mV/s. (inset: Bar plot shows the changes in current during the 1st cycle and 50th cycles). (b) CVs of 100 μM NIC detection in 0.1 M PBS for 8 times on an Ag-NPs/GCE at a scan rate of 50 mV/s. (inset: Bar diagram shows the changes in peak currents for 100 μM NIC on a same Ag-NPs/GCE).
Crystals 13 00589 g013
Figure 14. (a) Amperogram was recorded for interference compounds with (5 μM) NIC in 0.1 M PBS using an Ag-NPs/GCE under a rotation speed of 750 rpm, applied voltage of 1 V. (b) Bar plot shows the magnitude of current response changes after each addition of interference compounds.
Crystals 13 00589 g014
Figure 15. Amperograms were recorded using an Ag-NPs/GCE for NIC analysis in (a) Tobacco, and (b) saliva samples, after the additions of different volume of samples in to 0.1 M PBS. The applied potential was 1 V and a rotation speed was 750 rpm.
Crystals 13 00589 g015
Figure 16. Amperogram was recorded using an Ag-NPs/GCE for detection of NIC in saliva sample along with spiking of standard NIC solution in to 0.1 M PBS under a rotation speed of 750 rpm. The applied potential was 1 V.
Crystals 13 00589 g016
Table 1. The hkl plane of Ag-NPs calculation using 2θ values from XRD graph.
θ (Rad)Sin2 θ Ratio 1Ratio 3h2 + k2 + l2h k lLattice Parameter ‘a’ (Å)
38.150.332920.106801871.046763.1402831114.0825
44.310.386680.142214591.393844.1815242004.0852
64.490.562780.284665692.790008.3699982204.0835
77.40.675440.390928383.8314711.4944113114.0847
Table 2. Comparison of various analytical parameters between the proposed method and other reported EC sensors for NIC.
ElectrodeLinear RangeLODReference
BDE9.9 to 170 μM0.3 μM[2]
AGCE1200 μM0.7 μM[3]
BN doped graphene1 to 1000 μM0.42 μM[14]
bAuNPs/SPE10–2000 μM2.33 μM[30]
RGO/DPA/PGE131–1,900 µM7.60 µM[48]
MWCNT31–220 μM7.6 μM[52]
Carbon paste50–500 μM6.1 μM[53]
NDG/GCE0–200 µM0.27 µM[54]
PoPD/GCE0.000183 to 1.01 µM55.00 pM[55]
Green synthesized Ag-NPs/GCE2.5 to 105 μM0.135 μMThis work
Footnotes: BN—boron nitride nanosheets, AGCE—Activated glassy carbon electrode, RGO—Reduced graphene oxide, bAuNPs—biosynthesized gold nanoparticles, SPE—screen printed electrode, AGCE—activated glassy carbon electrode, MWCNT—multiwall carbon nanotubes, PoPD—poly (o-phenylenediamine), NDG—nitrogen doped graphene, BDE—boron doped diamond electrode.
Table 3. The determination of NIC in saliva samples using Ag-NPs/GCE.
S.No.SamplesAdded (μM)Found * (μM)RSD %Recovery %
1.Saliva-0.494--
2.Std. sample0.5 0.9840.031498
3.Std. sample11.5140.0097102
4.Std. sample22.4740.039199
* Mean value of triplicate measurements.
Disclaimer/Publisher’s Note: The statements, opinions and data contained in all publications are solely those of the individual author(s) and contributor(s) and not of MDPI and/or the editor(s). MDPI and/or the editor(s) disclaim responsibility for any injury to people or property resulting from any ideas, methods, instructions or products referred to in the content.

