Article

Design of Titanium Alloys Insensitive to Thermal History for Additive Manufacturing

1
Department of Chemistry and Materials Engineering, Faculty of Chemistry, Materials and Bioengineering, Kansai University, 3-3-35, Yamate-cho, Suita 564-8680, Japan
2
Carbon Neutrality Research Centre, Kansai University, 3-3-35, Yamate-cho, Suita 564-8680, Japan
3
Graduate School of Science and Engineering, Kansai University, 3-3-35, Yamate-cho, Suita 564-8680, Japan
4
Nihon Superior Co., Ltd., 1-16-15 Esaka-Cho, Suita 564-0063, Japan
5
Division of Materials and Manufacturing Science, Graduate School of Engineering, Osaka University, 2-1, Yamadaoka, Suita 565-0871, Japan
*
Author to whom correspondence should be addressed.
Crystals 2023, 13(4), 568; https://doi.org/10.3390/cryst13040568
Submission received: 27 February 2023 / Revised: 17 March 2023 / Accepted: 20 March 2023 / Published: 27 March 2023

Abstract

:
Powder bed fusion is the most common technology used for 3D printing, where thermal energy is used to selectively melt/sinter granular materials into solid shapes. The build platform is then lowered, more powder is added, and the process is repeated for the next layer to fully print the design. As a result, the built-up part is repeatedly heated. Therefore, materials that are not sensitive to thermal history are preferred for this process. The Ti–Zr system forms a continuous solid solution for both β- and α-phases. The presence of Fe in Ti alloys is inevitable; however, it provides some beneficial effects. The purpose of this work was to prepare Ti–Zr–Fe alloys and investigate their heat treatment behaviour. Ti-xmass%Zr-1mass%Fe alloys (x = 0, 5, 10) were prepared with arc melting. The formation of a solid solution of Zr in Ti was confirmed on the basis of X-ray diffraction peak shifts and hardening effects. A small amount of β-phase precipitation was suggested by the change in electrical resistivity after isothermal ageing at 673 and 773 K. However, no obvious phase or microstructural changes were observed. The laser scanning increased the volume of the precipitates and also coarsened them, but the effect was limited.

1. Introduction

Ti and its alloys are widely used in biomedical applications such as bone substitutes and scaffolds [1,2,3] because of their excellent mechanical properties, biocompatibility, and reliability. In orthopaedic surgery, however, such metallic materials often cause stress shielding due to a mismatch of Young’s modulus between the implant devices and the surrounding bone. As is well known, Young’s moduli of cortical bone and Ti-6Al-4V are 10–30 GPa and 110 GPa, respectively [4]. Under such conditions, bone atrophy/osteolysis occurs, which leads to a fracture of the surrounding bone. In order to avoid this problem, Young’s moduli of metallic materials/devices should be decreased. The mechanical properties can be controlled through metallurgical methods and/or structural design [5,6,7,8,9]. Constructing a porous structure is a promising method for controlling the mechanical properties.
Additive manufacturing (AM) technology has revolutionized design possibilities by enabling the creation of complex structures. It allows for the adjustment of mechanical properties. Powder bed fusion (PBF) is the most common technology used in 3D printing, where the thermal energy of a laser or electron beam is used to selectively melt/sinter granular materials into solid shapes. Thermal energy is applied to a specific area in the powder bed, and the granules are combined into a solid layer. The build platform is then lowered, and the next powder bed is prepared. This process is repeated until the final shape is obtained. Thermal energy is not only applied to the top layer, but also to the already-built-up part below it. Thus, the already-built part is repeatedly heated [10,11]. This process is equivalent to subjecting the built part to a heat treatment for a certain time. In many alloys, heat treatments induce phase transformations such as the precipitation of a secondary phase and the formation of inclusions, which change several properties. Therefore, in the case of an alloy used in AM technology, designing a structure is easier if some of the alloy’s properties are insensitive to the thermal histories.
Thus far, porous Ti structures with submillimetre parts have been fabricated with laser AM [9]. The porosity and mechanical properties of such structures can be easily controlled using this structural design method. The overall mechanical properties are known to be governed by the mechanical properties of the portions with the minimum cross-sectional area ratio. The use of metallic materials with several physical/chemical properties and thermal stabilities comparable to those of pure Ti would enable even greater adjustment of the mechanical properties of the porous devices. Since precipitation does not occur in such pure materials, there is no need to pay attention to heat treatment. Alloying is an effective way to improve the mechanical properties of the materials used, but the effect of heat treatment during the forming process of the structures cannot be ignored. To improve the degree of freedom in structural design, it is necessary to improve the thermal stability of the materials.
In the present study, Zr was chosen as a nonallergenic and nontoxic element as the main additive to pure Ti. It belongs to the same group 4 as Ti in the periodic table and possesses similar chemical properties. The Ti–Zr binary system shows a continuous solid solution for both the high-temperature β-phase, with a body-centred cubic (BCC) structure; and the low-temperature α-phase, with a hexagonal close-packed (HCP) structure throughout the entire range of composition [12]. Fe is an inevitable component of Ti alloys and is known to strongly influence several alloy properties. In addition, if a small amount of Fe is added at the alloy design stage, off-grade sponge Ti can be used in Ti alloy manufacturing, leading to lower manufacturing costs. The purpose of the present study was to prepare Ti–Zr–Fe alloys and then investigate their heat treatment behaviour, with consideration of the thermal effects of laser scanning on the phase constitutions and mechanical properties. In addition, the microstructural change that occurs inside the material when it is actually laser scanned was investigated via electrical resistivity measurements.

2. Materials and Methods

2.1. Ti–Zr–Fe Alloys and Specimens

Ti-xmass%Zr-1mass%Fe alloys (x = 0, 5, 10) were prepared from mixtures of sponge Ti (>99.8%, Osaka Titanium Technology, Amagasaki, Japan), sponge Zr (99.9%, Mitsuwa Chemical, Hiratsuka, Japan), and pure Fe wire (99.5%, Nilako, Tokyo, Japan). The mass of each raw material was measured using an electronic balance (AUW-D Series 120D, Shimadzu, Kyoto, Japan). Each compact of 80 g was melted in a laboratory-scale arc furnace under a high-purity Ar atmosphere. The resultant ingots were hot-forged and rolled at approximately 1120 K to obtain plates approximately 3 mm thick with homogeneous microstructures.
Bar-shaped (2 × 2 × 40–60 mm3) and plate-shaped (10 × 10 × 2 mm3) specimens were cut from the hot-rolled plates. Specimens for electrical resistivity measurements (1.5 × 1.5 × 40–60 mm3) were obtained by shaping the bars with emery paper. The dimensional error was less than ±2.5 μm for the specimens used for electrical resistivity measurements. Other measurements/observations were performed on the plate-shaped specimens.

2.2. Solution Treatment/Quenching and Ageing

Each specimen was encapsulated in a silica glass tube under a vacuum of approximately 3 mPa. The specimens were solution-treated in the β-phase region at 1173 K for 3.6 ks in a muffle furnace and then immediately quenched in ice water by breaking the silica glass tubes. Ageing was carried out by directly dipping the specimens in a nitrate salt bath maintained at 673 or 773 K. After the heat treatment, the specimens were quenched immediately in ice water. The heat treatments for ageing were carried out cumulatively on the same specimens.

2.3. Electrical Resistivity Measurements

Electrical resistivity measurements were carried out in order to characterise the ageing behaviours. The electrical resistance at temperature T (ΩT) was measured with a direct-current (DC) four-point method using a nanovoltmeter (Keithley 2182A, Cleveland, OH, USA) and a direct current/alternating current (DC/AC) current source (Keithley 6221, Cleveland, OH, USA) with a constant current of 100 mA. By changing the current polarity in the measurements, the thermoelectromotive forces at all contacts were cancelled.
The cross-sectional area (S) and distance between two potential contacts (L) of the bar-shaped specimens were measured using a micrometre and a measuring microscope, respectively. We refer to the ratio between S and L (S/L) as the size factor. The electrical resistivity (ρT) was obtained as follows:
ρT = (S/L)T.
To accurately measure the electrical resistivity change before/after the heat treatment, ageing treatments were performed with the potential contacts attached.
As is well known, electrical resistivity is sensitive to temperature; thus, the temperature must be carefully/precisely controlled. In the present study, the measurement temperature was selected to be 77 K (in liquid N2) and 300 K. Measurements of electrical resistance at 300 K were carried out in dimethylpolysiloxane, a silicone oil with high heat capacity. The temperature of the oil was controlled using a cooling/heating circulator and was monitored with highly accurate probes. The temperature variation at 300 K was accurately controlled at less than 0.1 K during the measurement.

2.4. Laser Scanning

The specimens (1.5 × 1.5 × 40–60 mm3) for electrical resistivity measurements were prepared. They were solution-treated at 1173 K for 3.6 ks under a vacuum and then immediately quenched in ice water. A surface oxide layer was removed with emery paper. The surfaces of them were scanned with a laser using a selective laser melting (SLM) apparatus (EOS M 290, EOS, Munich, Germany) equipped with a Yb fibre laser. The laser power, scanning speed, and scan pitch were 360 W, 1200 mm/s and 60 μm, respectively. Laser scanning was performed longitudinally and perpendicularly on one side of the bar-shaped specimens.

2.5. General Characterisations

The microstructure of the specimens was observed using optical microscopy (Olympus, DSX10, Tokyo, Japan). Their phase constitution was identified with X-ray diffraction (XRD) analysis (RINT-2500, Rigaku, Tokyo, Japan) at room temperature using Cu-Kα radiation. The chemical composition of the alloys was measured with X-ray fluorescence (XRF, JSX-1000S, JEOL, Tokyo, Japan) and oxygen–nitrogen analysis (EMGA-620W, HORIBA Scientific, Kyoto, Japan). Vickers hardness (HV) measurements (Mitsuzawa, MMT-X7, Yokohama, Japan) were also carried out to simply evaluate the mechanical properties of each alloy in several states.

3. Results and Discussions

3.1. Ti–Zr–Fe Alloys

Well-mixed and homogeneous Ti–Zr–Fe alloy specimens were obtained irrespective of their composition. The chemical composition was analysed by XRF and oxygen–nitrogen elemental analysis using specimens in the as-hot-rolled state; the results are shown in Table 1. The compositions analysed were similar to the target ones for all of the investigated alloys. In addition, the oxygen and nitrogen concentrations were less than 0.09% and 0.005%, respectively, for all of the specimens. Oxygen and nitrogen are interstitial elements in Ti alloys and affect various properties, so attention should be paid to them.
The HV tests were carried out using specimens in the solution-treated and quenched (STQ) state at room temperature under an applied force of 4.9 N. The hardness increased almost linearly with increasing Zr content (mass%), as shown in Figure 1. In addition, an XRD analysis was performed to identify the phase constituents; the profiles are shown in Figure 2. Sharp peaks due to α’ martensite were observed in the XRD patterns for all the prepared alloys, and a small peak associated with the β-phase was observed in the pattern for the 0Zr specimen. The peaks due to Si are from the NIST-certified Si crystallographic standard adhered to the surfaces of the plate specimens. The measurement error for the diffraction angle was corrected using the peaks for Si. Figure 3 shows the changes in diffraction angles for the peaks of 11.0, 10.3, and 11.2, which are attributed to α’ martensite, as a function of the Zr content. The measured values of diffraction peaks are also shown in the figure. The measurement error was 0.02 degrees. All of the peaks shifted to smaller angles. The atomic radius of Zr is larger than that of Ti. In accordance with Vegard’s law, the lattice parameter increases monotonically with increasing Zr content. The change in the lattice parameter was confirmed from low-angle shifts in the diffraction peaks. Therefore, these results indicate that Zr was homogeneously dispersed, resulting in solid-solution hardening.

3.2. Ageing Behaviour

The PBF technique is an AM process that uses thermal energy to selectively fuse granular materials into solid shapes. The build platform is then lowered, more powder is added, and the process is repeated for the next layer to fully print the design. As a result, the built-up part is repeatedly heated, and this heating is equivalent to the medium being subjected to a heat treatment for a certain time. Both the heating for melting of granular materials and the thermal history in the already-built-up parts under the whole building process are important for the various properties of the obtained products. The thermal history is very complex and cannot be generalised, since it depends on the scan strategy and product geometry. In the present study, therefore, the Ti–Zr–Fe alloys were cumulatively heat-treated to simply reproduce the thermal history associated with PBF as a fundamental study. The ageing temperatures were selected as 673 and 773 K because various phase transformations are known to occur around these temperatures in several Ti alloys [13,14,15].
Figure 4 shows optical micrographs of the Ti–Zr–Fe alloys before/after the ageing process at 673 and 773 K. Acicular α’ martensite was observed in all the alloys in the STQ state. The addition of Zr tended to refine the microstructure. In addition, no remarkable changes in microstructure were found even after isothermal ageing treatments at 673 and 773 K for at least 18.0 ks. No coarsening of the martensitic plates or precipitation of secondary phase was observed.
Figure 5 shows XRD patterns for Ti–Zr–Fe alloys before/after isothermal ageing at 673 and 773 K. Ageing was performed cumulatively on the same specimen. Sharp peaks due to α’ martensite can be seen for the specimens in the STQ state, although a small peak associated with the β-phase is observed in the patterns for the 0Zr and 10Zr specimens. Since the peaks were observed in the STQ state, they were judged to be from the β-phase rather than intermetallic compounds. Nonhomogeneous regions might still remain locally at the nanometre order. However, we consider the present alloys homogeneous at the optical microscope level. In fact, the martensitic structures were homogeneous. The slight differences between the XRD profiles shown in Figure 2 must be due to individual differences among the specimens and the cooling rate during quenching. Therefore, they are not critical issues. No significant changes due to the ageing process were observed in the XRD profiles. Thus, these results are consistent with the microstructural characteristics as shown in Figure 4, and also indicate that no significant change occurred in the microstructure or phase constitution as a result of the ageing treatment.
The ageing behaviour was also traced using precise measurements of the electrical resistivity. In general, the measurement of electrical resistivity is a classical method; however, it has been used in numerous studies involving observations of the heat treatment behaviour of metals because it is sensitive to the specimens’ microstructure [16,17]. Essentially, as the solute in the matrix increases, the electrical resistance increases due to electron scattering. Similarly, the generation of local strain fields also leads to an increase in electrical resistance. For example, the formation of Guinier–Preston (GP) zones [18] in Al alloys and spinodal decomposition in Ti alloys [19] can be clearly detected by electrical resistivity measurements in spite of slight crystallographic changes.
In the present study, identical specimens were cumulatively heat-treated with the two potential contacts attached and their electrical resistance was subsequently measured, thereby enabling even minute changes in electrical resistivity to be detected. Figure 6 shows the changes in electrical resistivities at 77 and 300 K (ρ77 and ρ300, respectively) for Ti–Zr–Fe alloys during isothermal ageing treatments at 673 and 773 K. For all the alloys, the resistivity decreased distinctly after 0.6 ks of heat treatment, irrespective of the ageing temperature. Slight changes were observed thereafter, although the decrease continued for 5Zr until 3.6 ks of ageing at 673 K. These results suggest that a change in the phase constitution occurred even though it was not detected with XRD analysis or microstructural observation. The decrease in the electrical resistance due to ageing included a decrease in the vacancy concentration, since the ageing temperatures were significantly lower than the STQ temperature. The vacancy concentration is likely to reach equilibrium at high temperatures such as the ageing temperatures. It is considered that the saturated one was already reached at 0.6 ks. Therefore, the decrease in the electrical resistance that appears after 0.6 ks was due to phenomena accompanying the phase change, such as changes in the concentration distribution.
Figure 7 shows the changes in the HV and the electrical resistivity ratio (ρ77/ρ300) for the Ti–Zr–Fe alloys during ageing treatments at 673 and 773 K. The resistivity ratio clearly decreased after heat treatment for 0.6 ks, irrespective of the ageing temperature. This tendency is identical to that found for the electrical resistivity. After ageing, the vacancy concentration should be decreased from the STQ state. From this point of view, ageing should soften the materials. However, the HV increased slightly after the heat treatment for 0.6 ks and then was saturated. These results are consistent with our above assertion that a change in the phase constitution occurred during the ageing treatment.
Fe must be supersaturated in a solid solution because the solubility of Fe in Ti is very low [20]. As a result, the β-phase was considered to have precipitated in the early stage of ageing. This is consistent with the observed decrease in the electrical resistivity and increase in the HV. In addition, Fe is known to diffuse abnormally rapidly even in the β-phase [21]. Therefore, the precipitation causing the hardening was completed by 0.6 ks. If the hardening was due to the clustering of the precursor stages of precipitation, such as GP zone formation, then the electrical resistivity would show an increase once. Although intermetallic compounds such as TiFe can precipitate during extended ageing, there is no need to consider this phenomenon in the repeated heating that occurs during PBF.

3.3. Microstructural Changes Due to Laser Scanning

Instead of heat treatments, we performed actual laser scans to reproduce the thermal history of the materials below the top layer in the PBF process. An SLM apparatus was used to carry out the laser scanning of the specimens for the electrical resistance measurements, which were sensitive to microstructural changes. The scanning was performed twice on one side of each specimen.
Figure 8 shows optical micrographs of the surfaces and topographic 3D images of the bar-shaped specimens after laser scanning. The specimens were slightly curved. Regular and linear grooves created with laser scanning were observed in all the specimens. The surfaces were approximately the same as those observed in specimens fabricated with the normal PBF process. Rapid heating appears to have partially shallow-melted only the surface layer, which then rapidly cooled and solidified. A melt pool partially over-wrote (remelted) the neighbouring right track. We confirmed that none of the alloy specimens showed a substantial change in surface topography.
Figure 9 shows the change in HV caused by the laser scanning and the electrical resistivity ratio (ρ77/ρ300) before/after the laser scanning for the Ti–Zr–Fe alloys. The HV was measured at both ends of the bar-shaped specimens (n = 4), and the measurement did not affect the electrical resistance. The laser scan induced a slight change in hardness for 5 Zr, a decrease in hardness for 0 Zr, and an increase in hardness for 10Zr. As a result, the HV increased uniformly with increasing Zr concentration. The resistivity ratio also increased with increasing Zr concentration in specimens in the STQ state. Thus, laser scanning lowered the resistivity ratio uniformly for all of the investigated alloys.
Although the size factor obviously changed because of the surface grooves (Figure 8) and bending, the electrical resistivity was estimated using the following method. The electrical resistivity of multicomponent dilute solid solutions at temperature T (ρST) is expressed by the following Equation [22]:
ρST = ρPT + ∑∆ρiTCi,
where ρPT is the resistivity of the ideal pure solvent/matrix, ΔρiT is the contribution to resistivity per unit concentration of the i-th solute or lattice defect at temperature T, and Ci is its concentration. The proportionality coefficients (ΔρiT) have been reported for various alloys. Using these values, we can estimate their concentrations and densities separately from the electrical resistivity. In the present study, the electrical resistivities were measured at two different temperatures, 77 and 300 K. Assuming that the temperature dependence of the electrical resistivity per unit concentration is negligible in dilute solid solutions, the following relationship can be obtained from Equation (2):
ρ300ρ77 = ρP300ρP77,
where ρ300 and ρ77 are the resistivities of specimens at 77 and 300 K in various states, such as after plastic deformation. From Equation (3), the relationship between the resistivity at 300 K, ρ300, and the resistivity ratio, R = ρ77/ρ300, can be expressed as:
ρ300 = (ρP300ρP77)/(1 − R).
The (ρP300ρP77) term is constant because those values are for a pure solvent without any solutes and lattice defects. R is the resistance ratio, R = ρ77/ρ300. Assuming that the sample size (size factor, S/L) does not change with temperature change, it equals Ω77/Ω300. Although Equation (4) shows a straight line from the origin, the measured relationship has an intercept on the ρ300 axis in the plots of ρ300 vs. 1/(1 − R). Therefore, Matthiessen’s empirical relationship can be described as follows [23]:
ρ300 = α/(1 − R) + β.
The values of α and β can be determined from resistivity measurements of well-shaped specimens. However, the values of α and β are not important in the present study. This is because the objective is not to obtain absolute values of lattice defect/solute concentrations by determining the absolute values of electrical resistivity, but to quantitatively evaluate their increase or decrease. By comparing the ratio of electrical resistances at two different temperatures, we can evaluate the change in electrical resistivity due to the laser scanning process without measuring the size factor. Specifically, increases and decreases in the electrical resistance ratio correspond to increases and decreases in the electrical resistivity, respectively.
As described above, if the decrease in the electrical resistivity ratio is due to the precipitation of the β-phase, its amount is considered to have increased as a result of laser scanning. The decrease in the resistivity ratio is up to approximately twice that of the change through ageing at 673 and 773 K for 18 ks. This suggests that the amount of precipitation clearly increased during the laser scan. As previously mentioned, precipitation was completed in the early stage of ageing at 673 and 773 K; thus, we inferred that precipitation was also completed in the present laser scanning process, although the heating time was very short. The change in hardness suggests that the precipitates might have coarsened at 0Zr, leading to a slight softening. However, HV for 10Zr is likely to have increased because of the increase in the amount of precipitate. Thus, the laser scanning might have coarsened the microstructures. On the other hand, the rapid cooling also introduced a large amount of vacancies. The balance of those factors eventually resulted in the change in hardness. Thus, the overall increase in hardness was slight; from an overall perspective, laser scanning did not appear to strongly affect the mechanical properties. Thus, the experimental results show that this alloy system can undergo an increase in hardness through solid-solution hardening and is not particularly sensitive to thermal history. The use of this alloy system in three-dimensional structural control allows further arbitrary control of the mechanical properties of porous devices without concern for thermal history.

4. Conclusions

Ti-xmass%Zr-1mass%Fe alloys (x = 0, 5, 10) were prepared, and changes in their phase constitution and microstructure as a result of isothermal ageing and laser scanning were investigated. The following conclusions can be drawn from the present study.
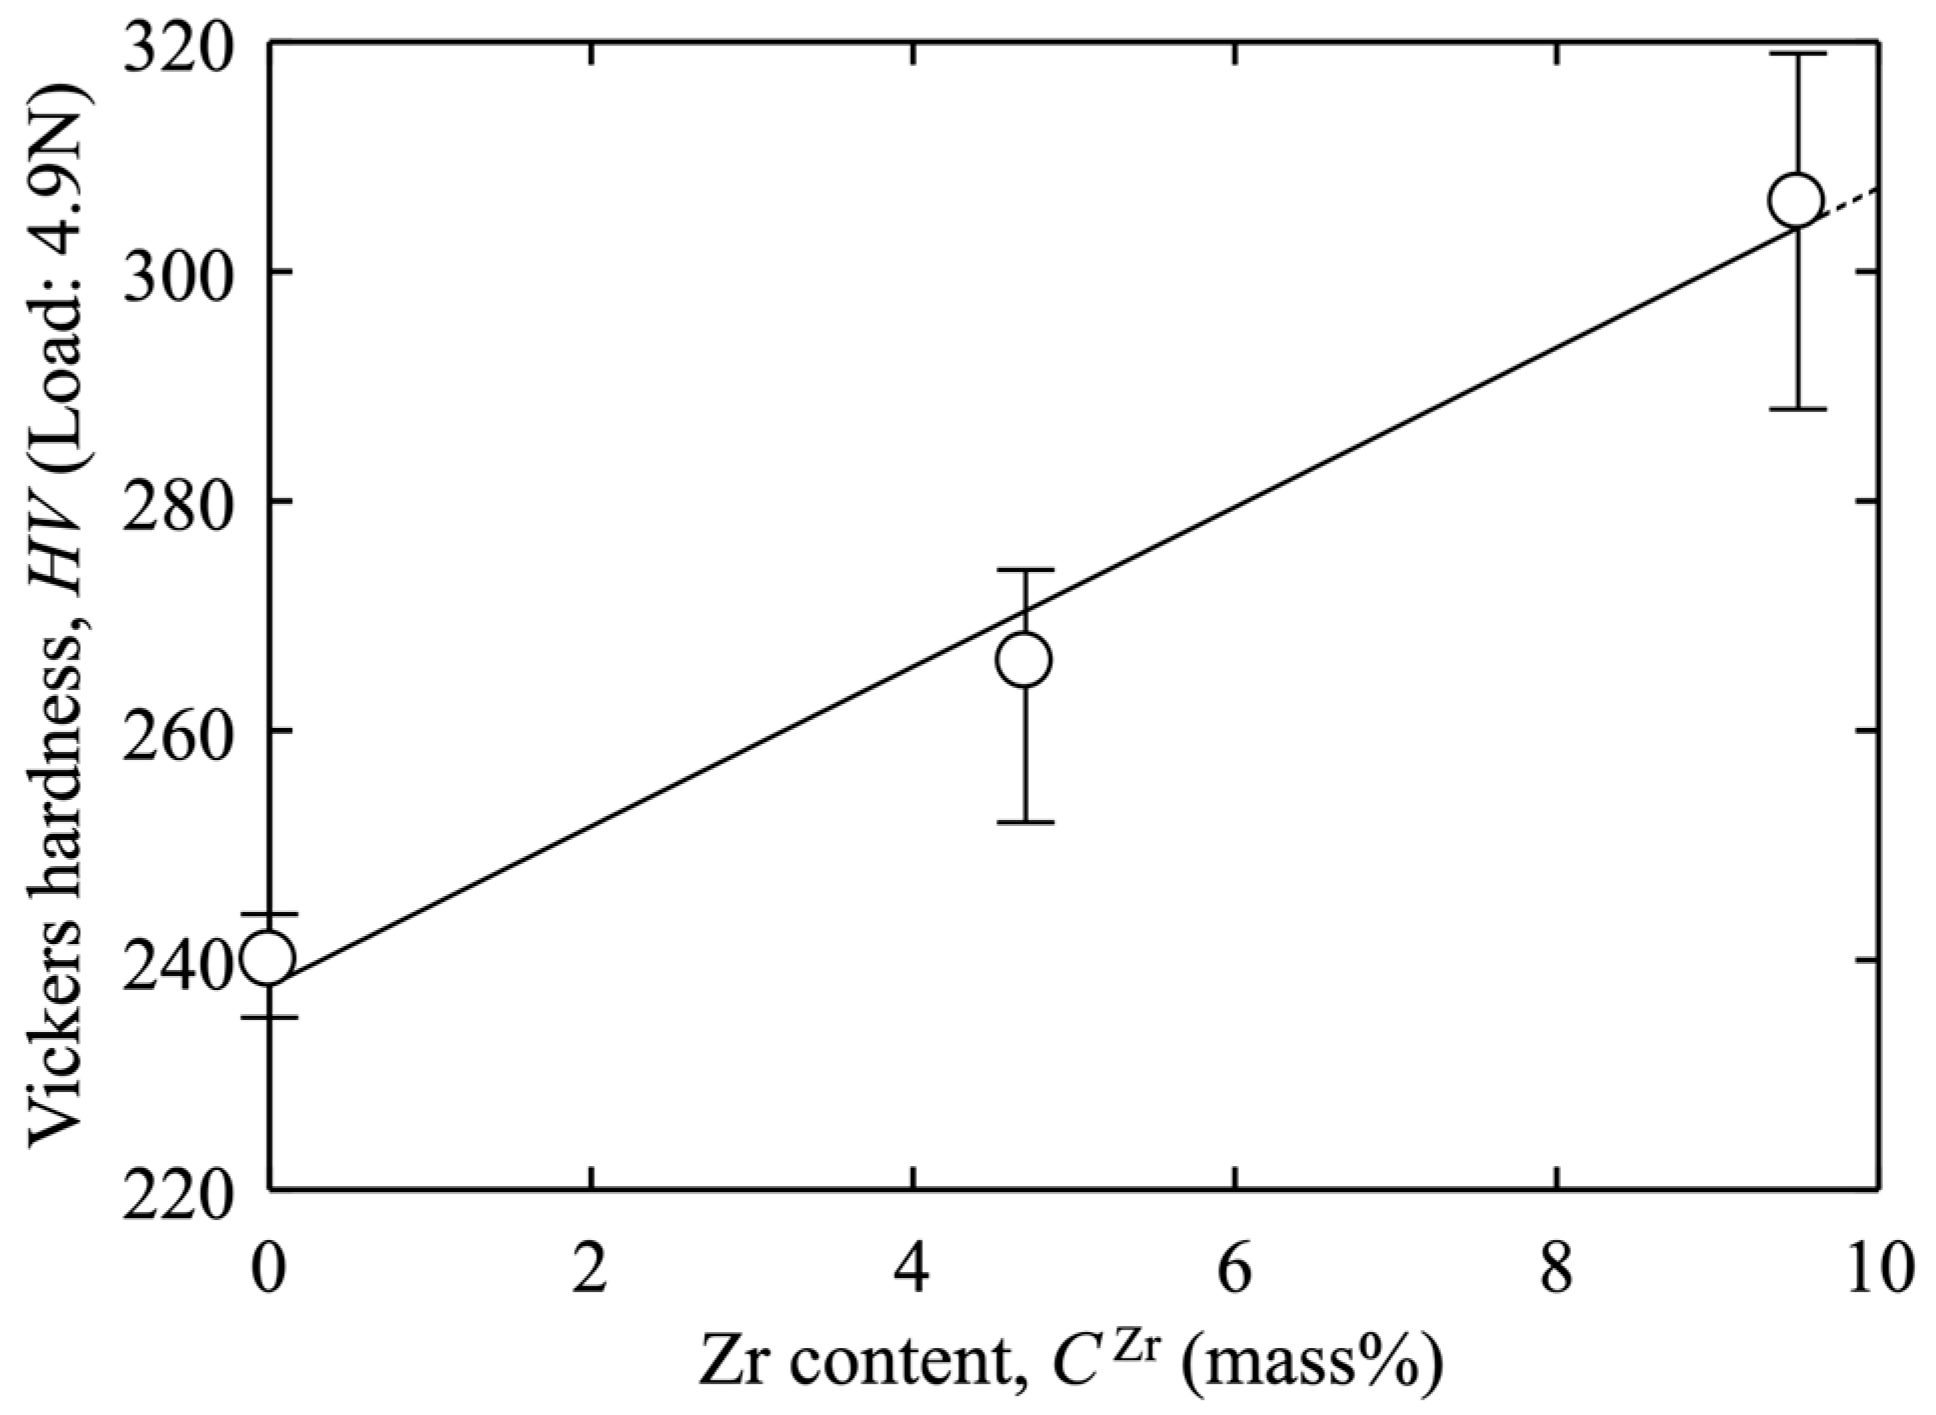
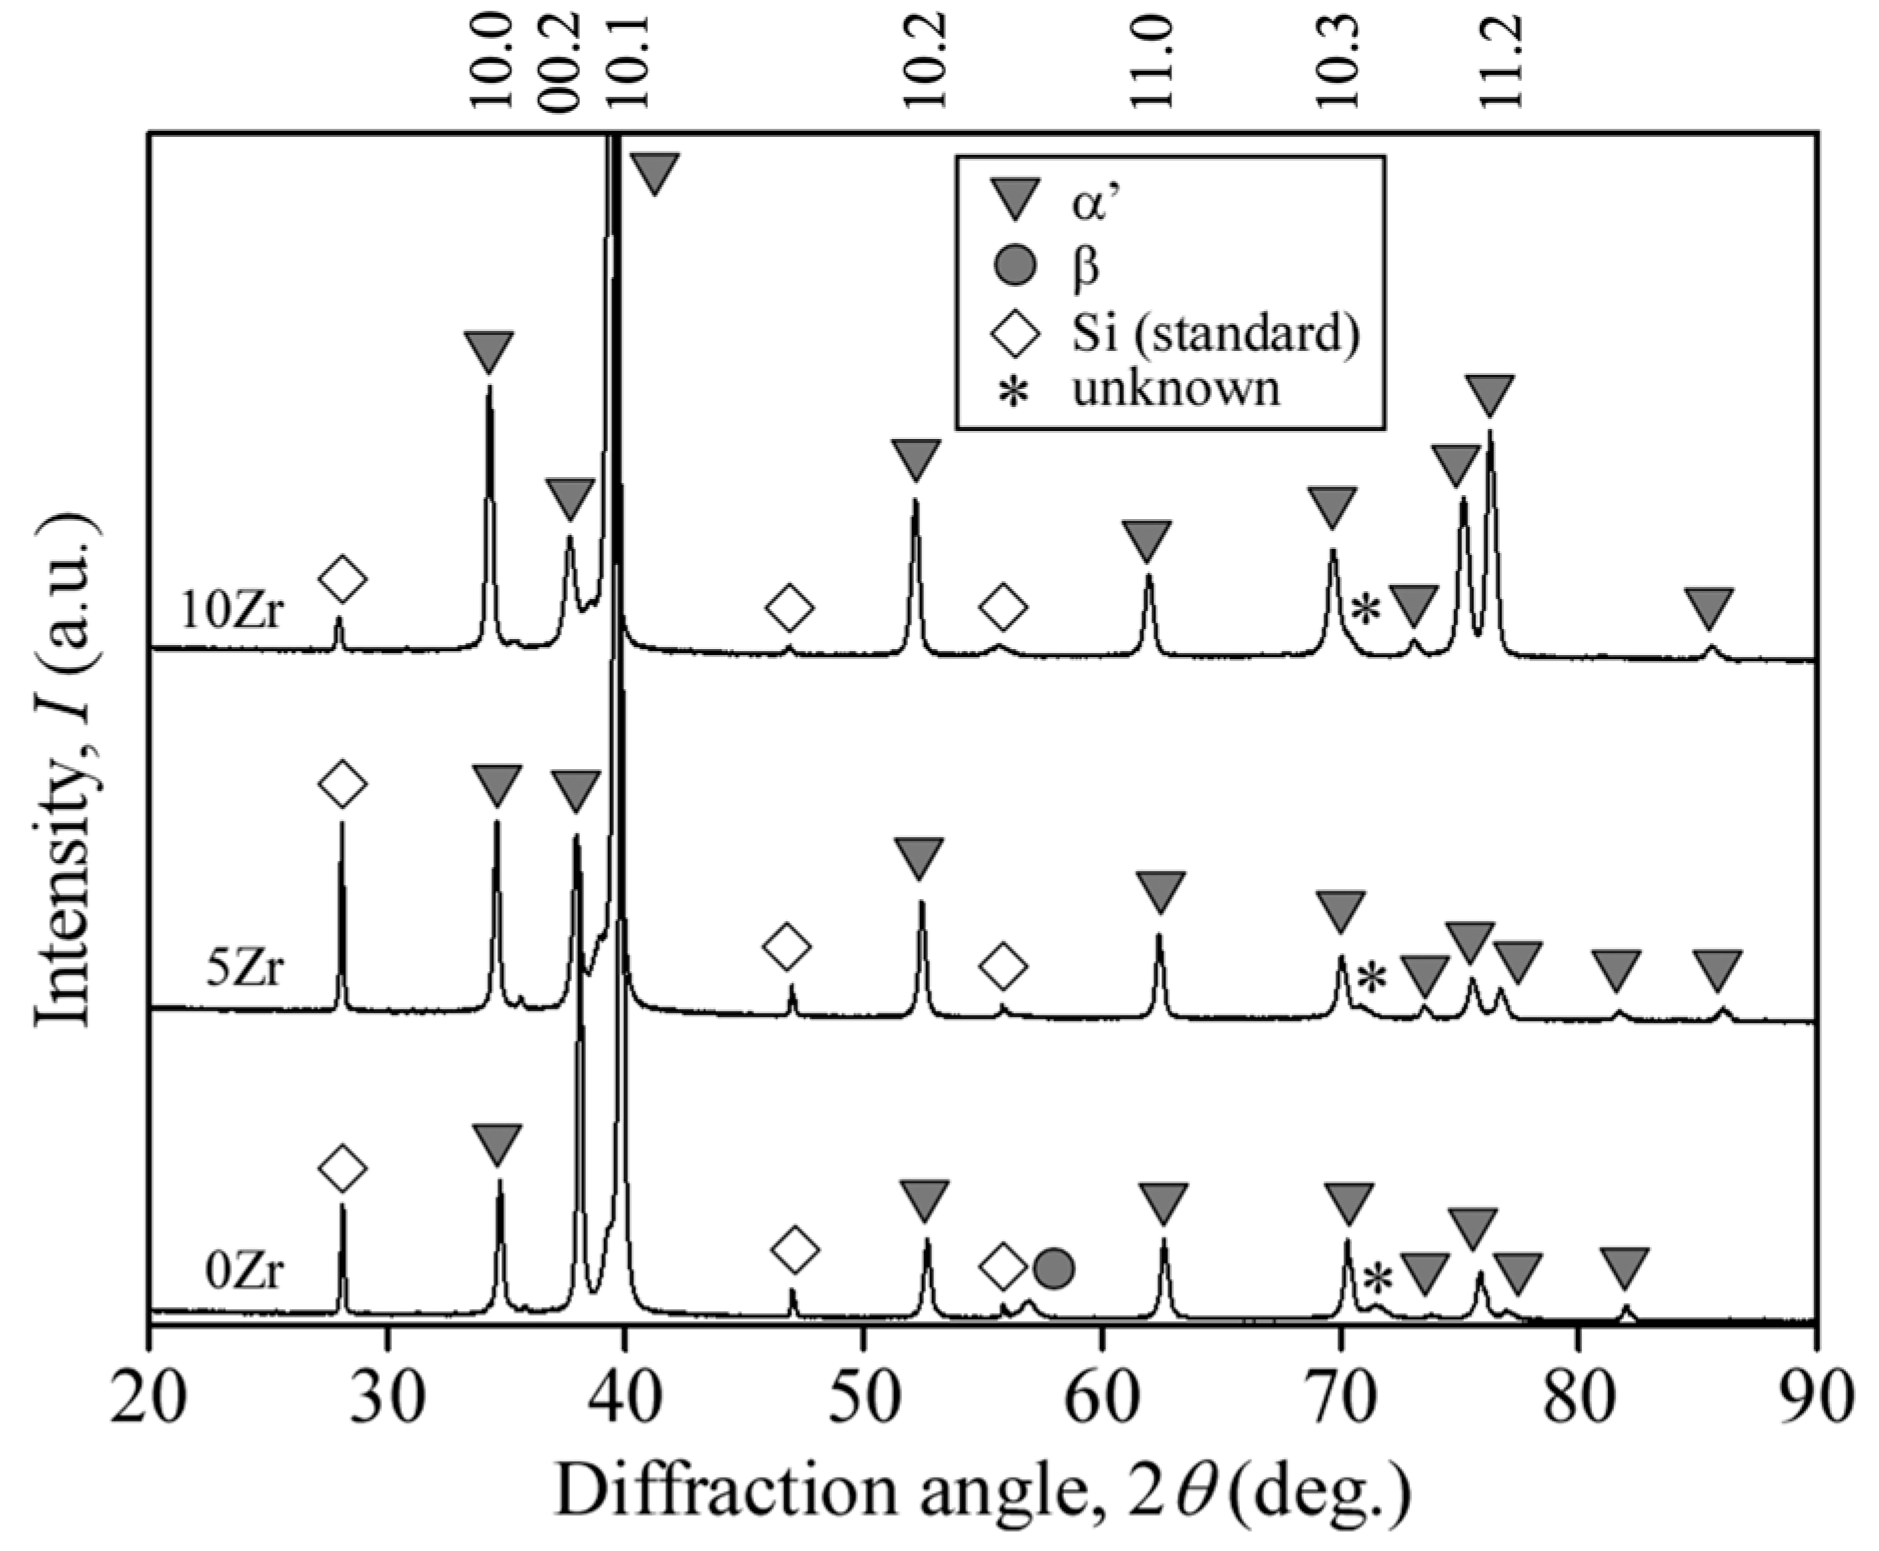
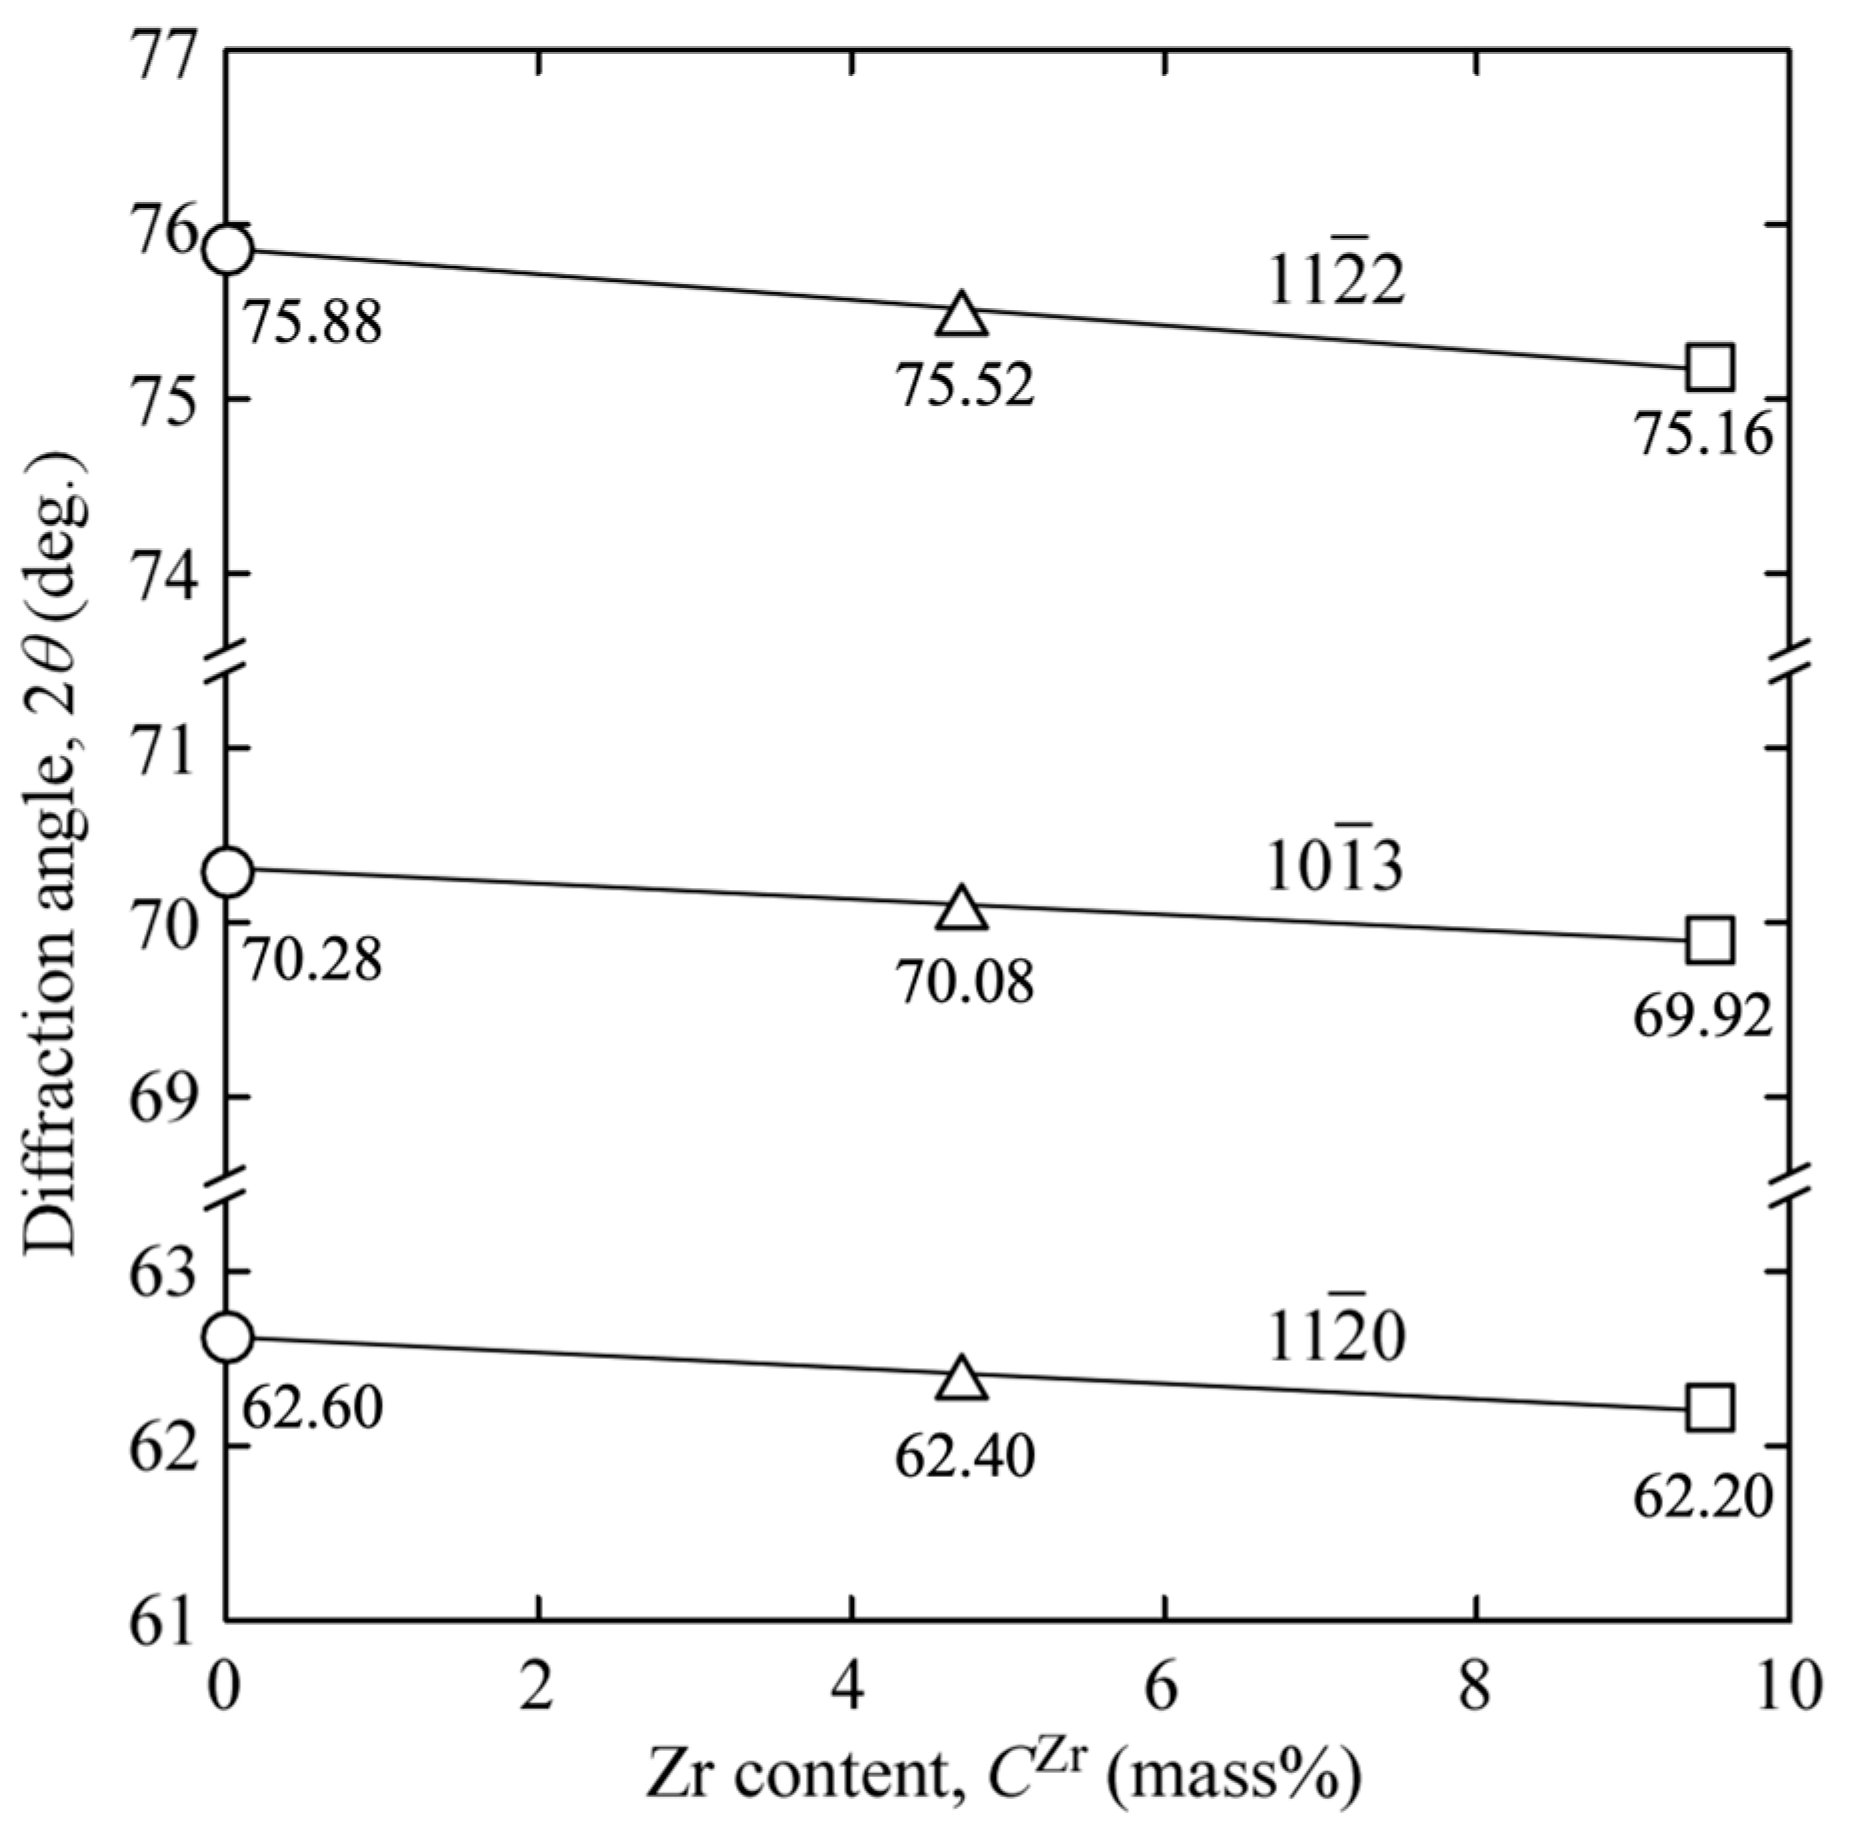
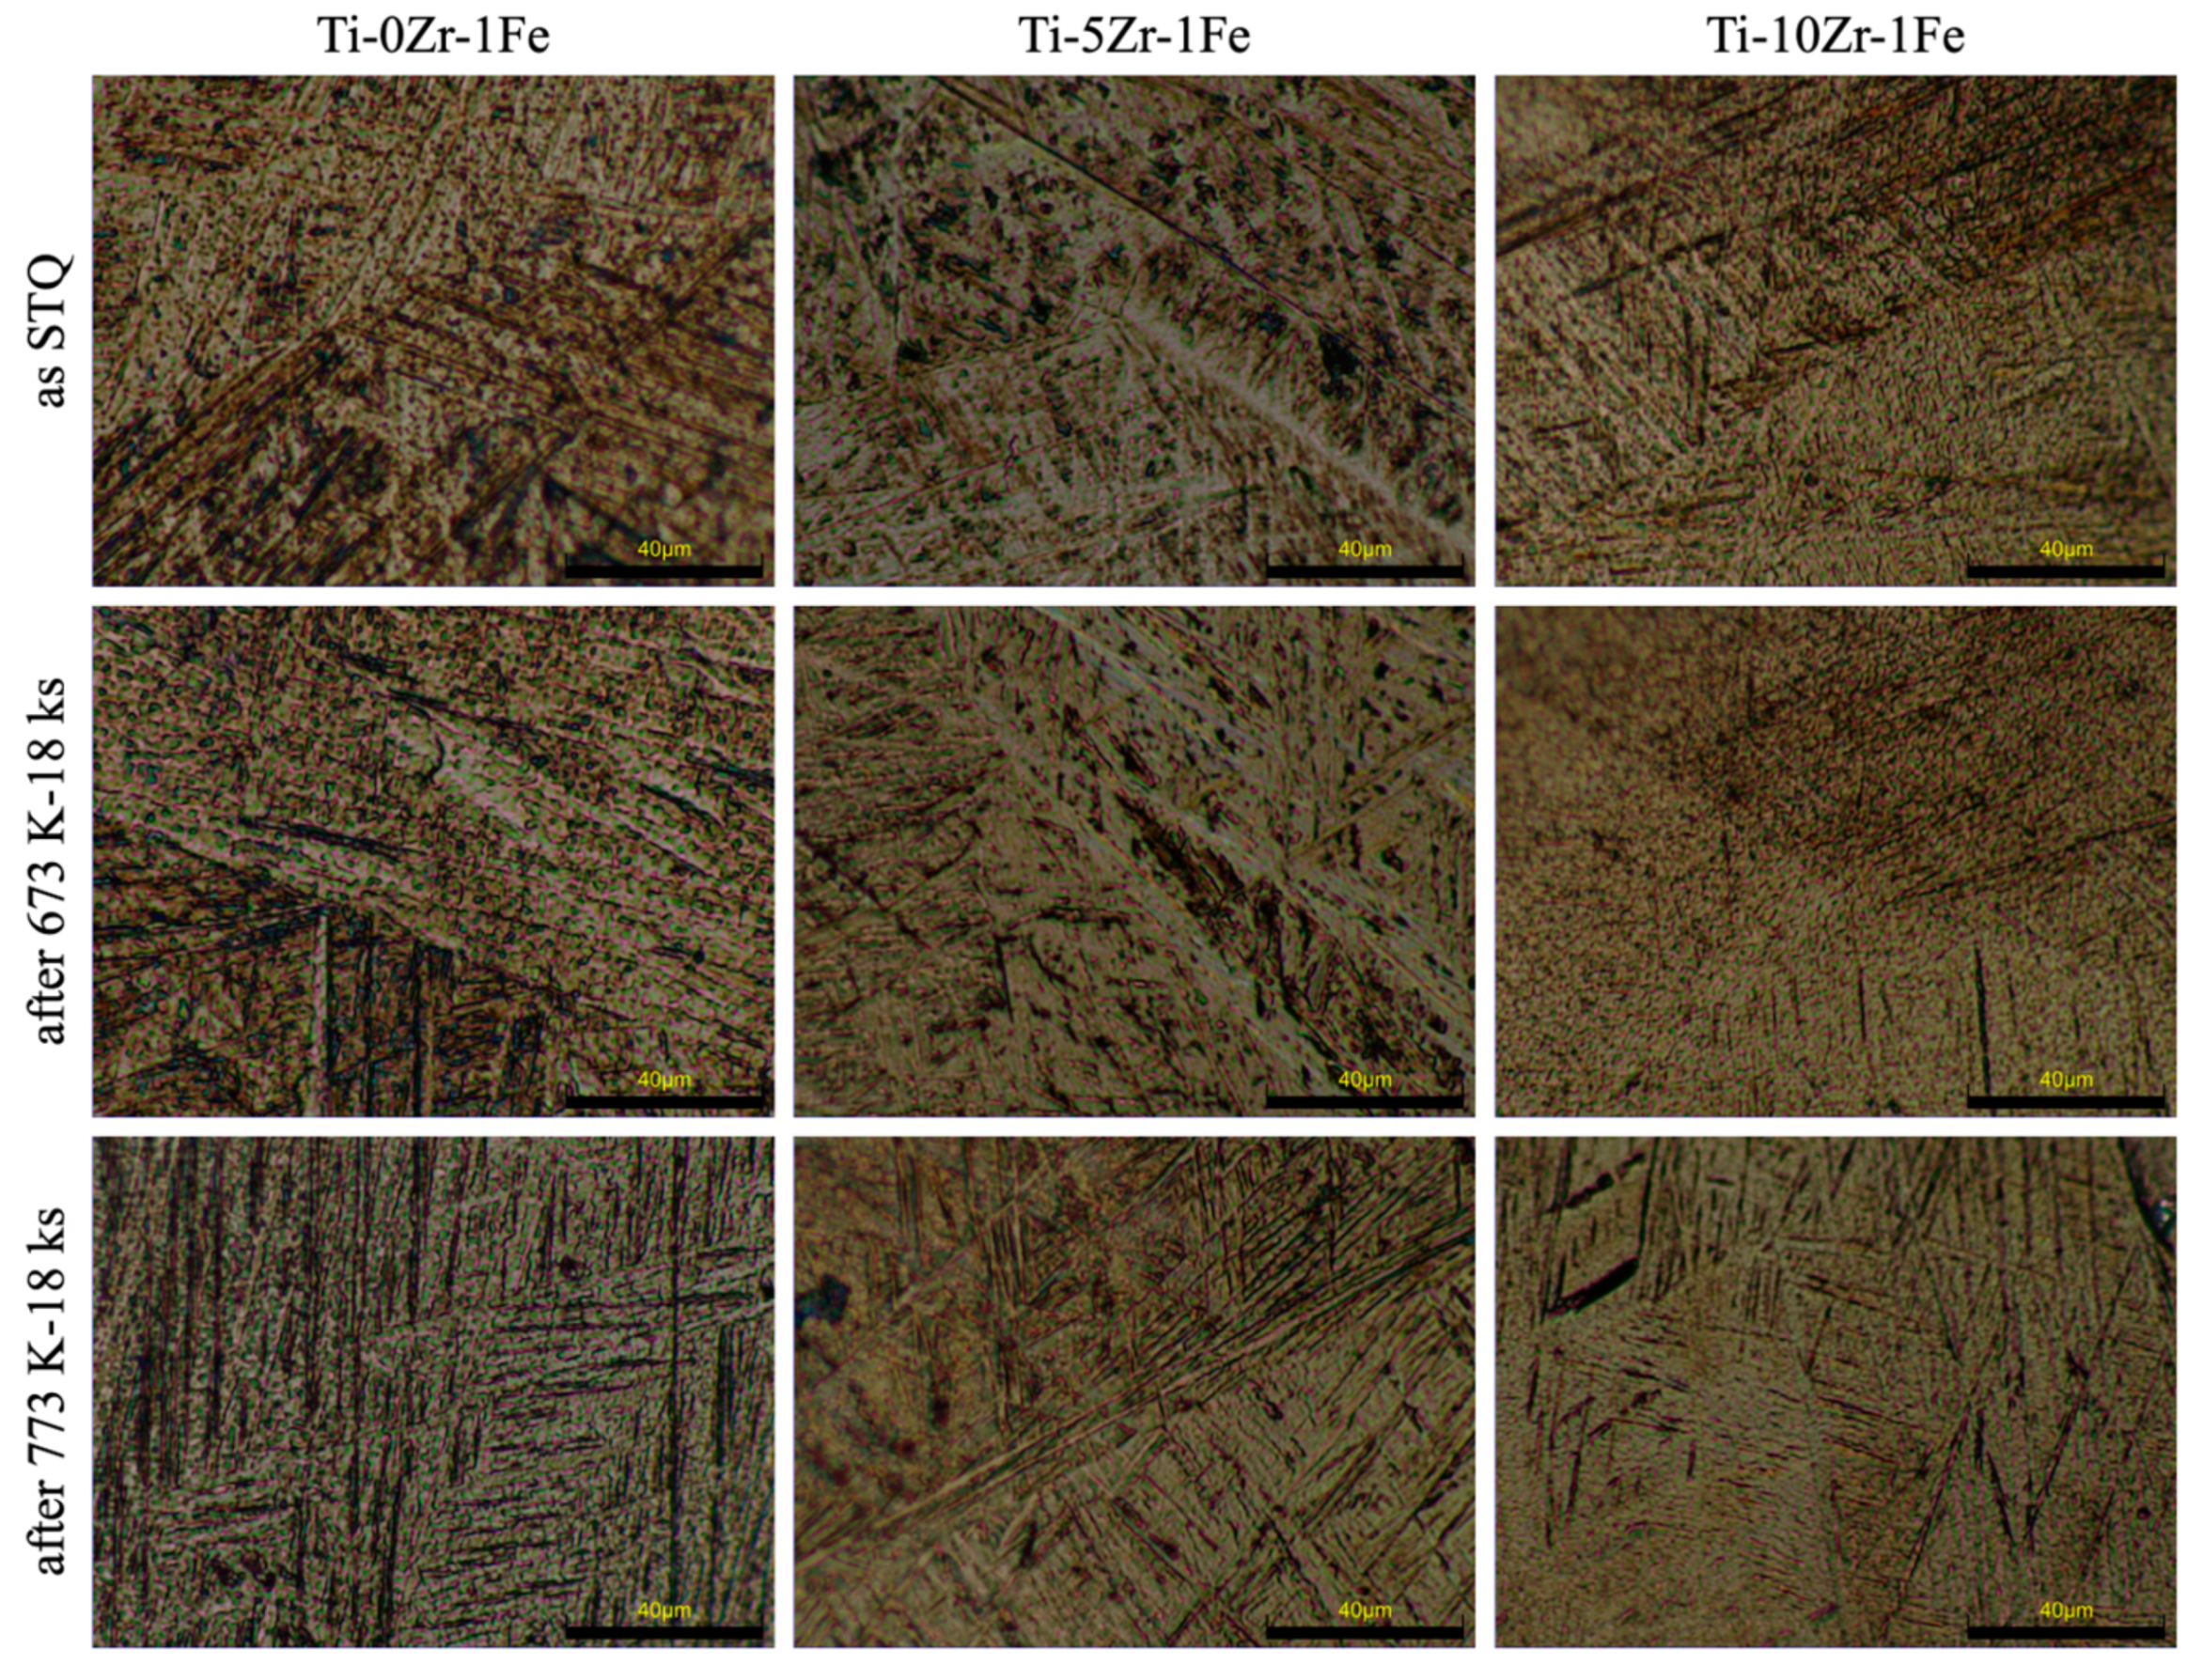
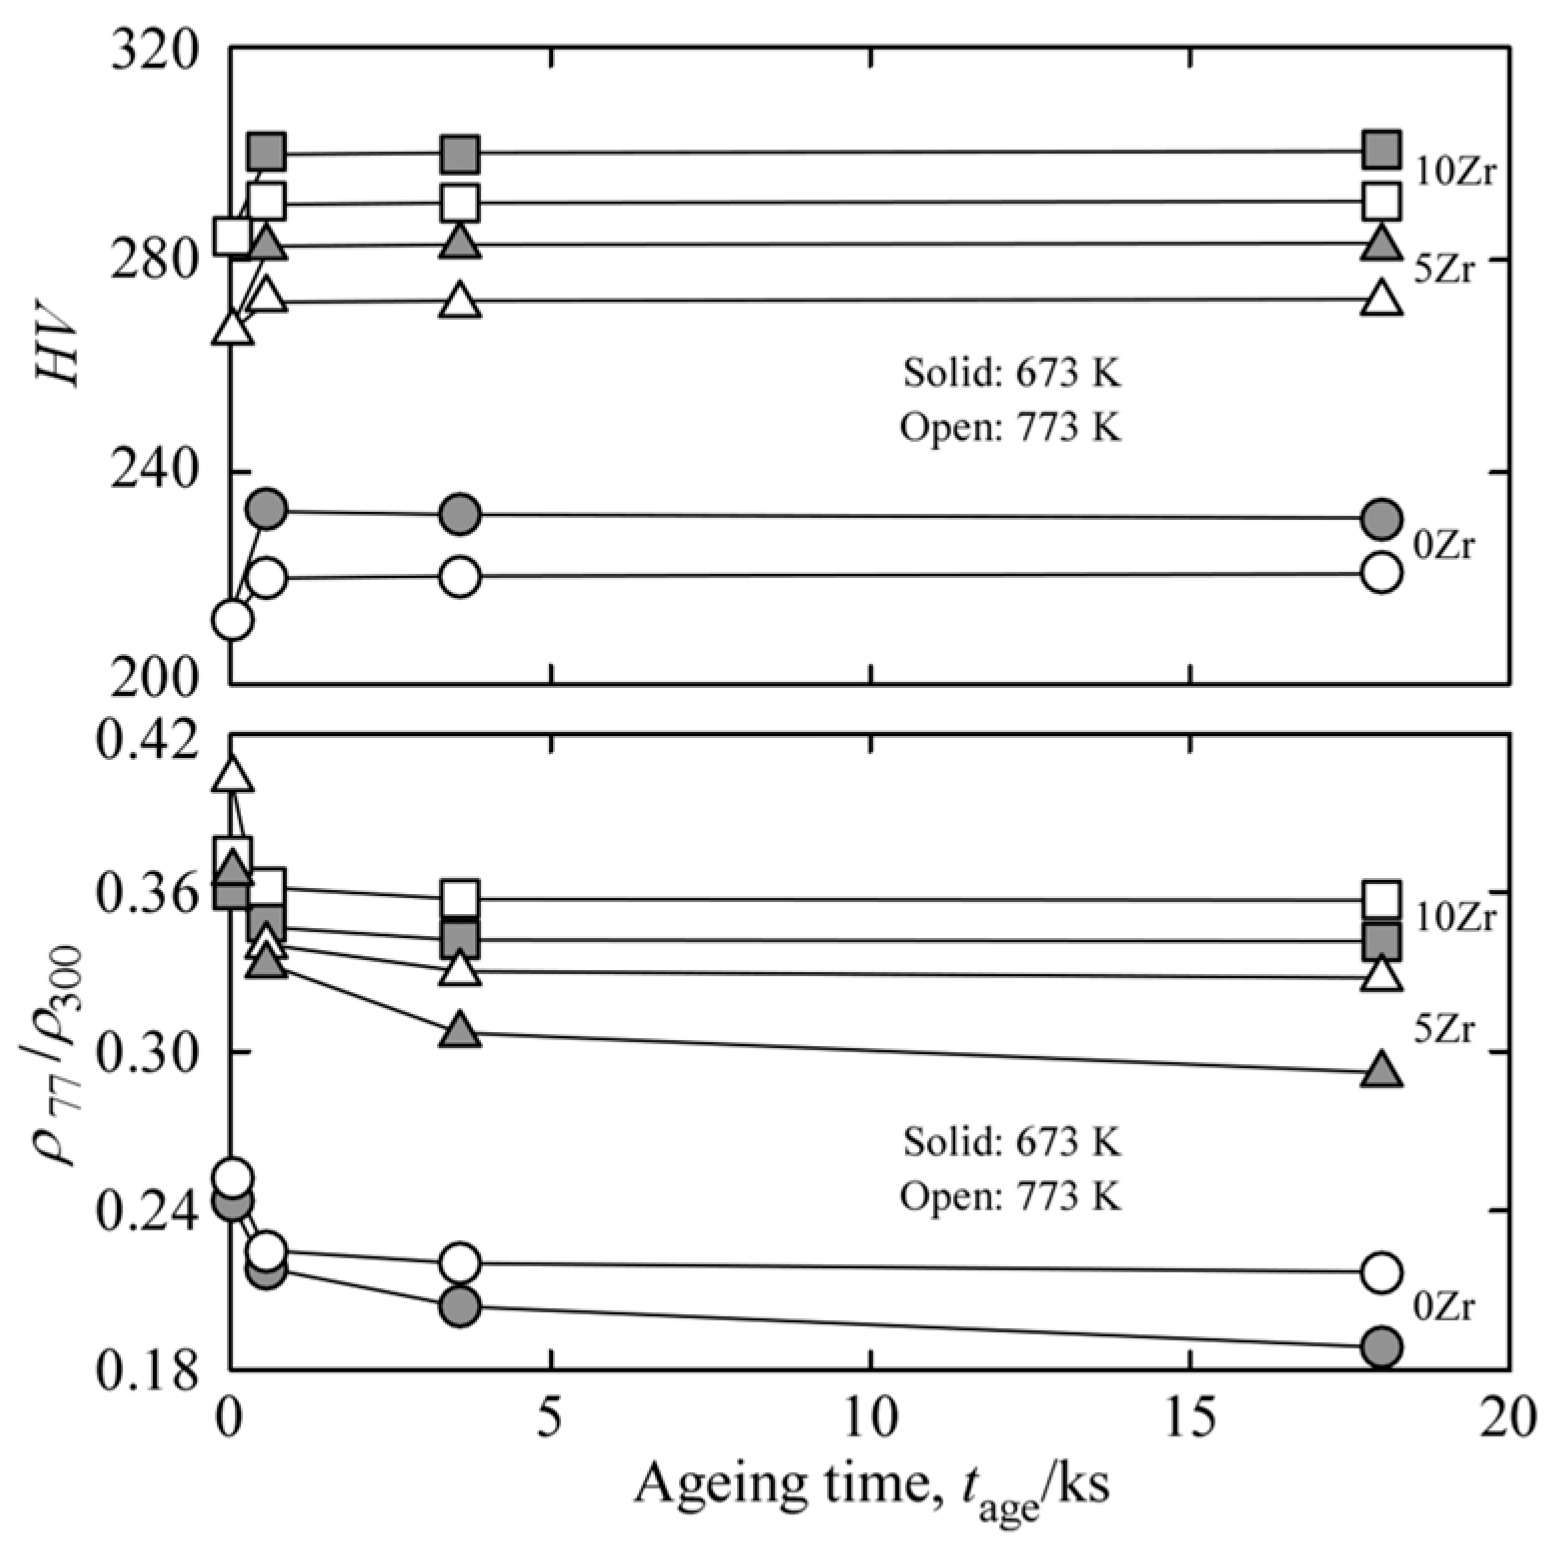
  • Well-mixed and homogeneous Ti–Zr–Fe alloys with almost the target compositions were obtained for all the investigated alloys. The oxygen and nitrogen impurity concentrations were less than 0.09% and 0.005%, respectively. A uniform acicular structure of α’ martensite was observed in all of the prepared alloys. The addition of Zr tended to refine the microstructure. HV increased with increasing Zr addition because of solid-solution hardening, as evidenced by an increase in the lattice constant.
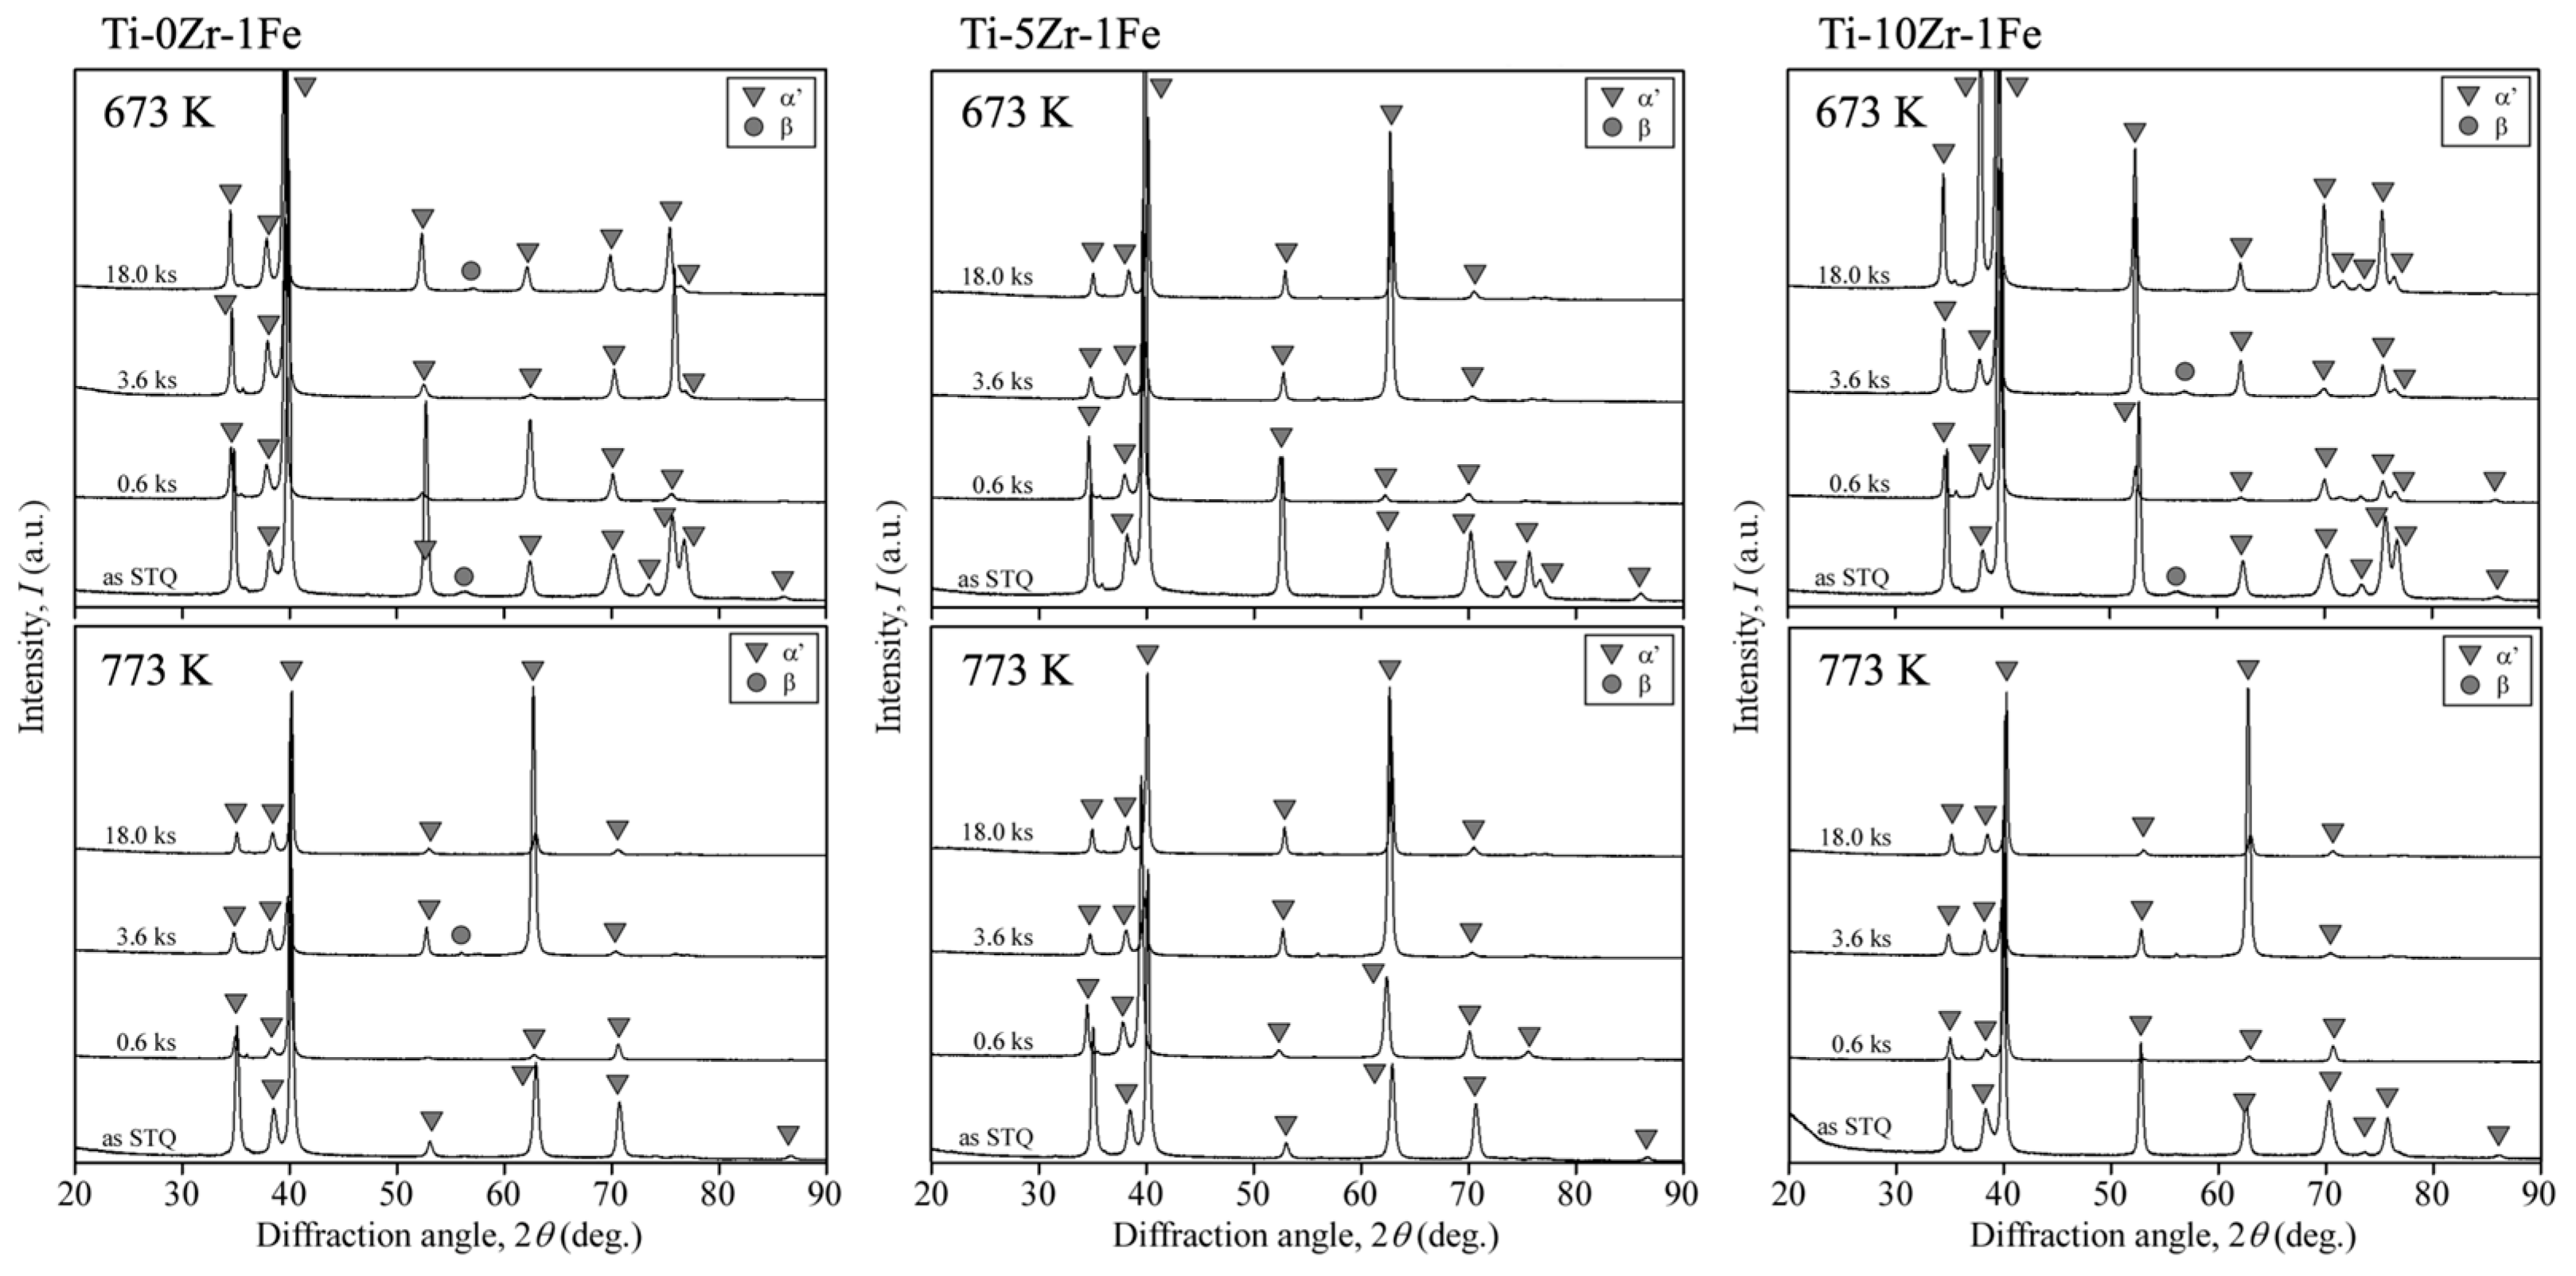
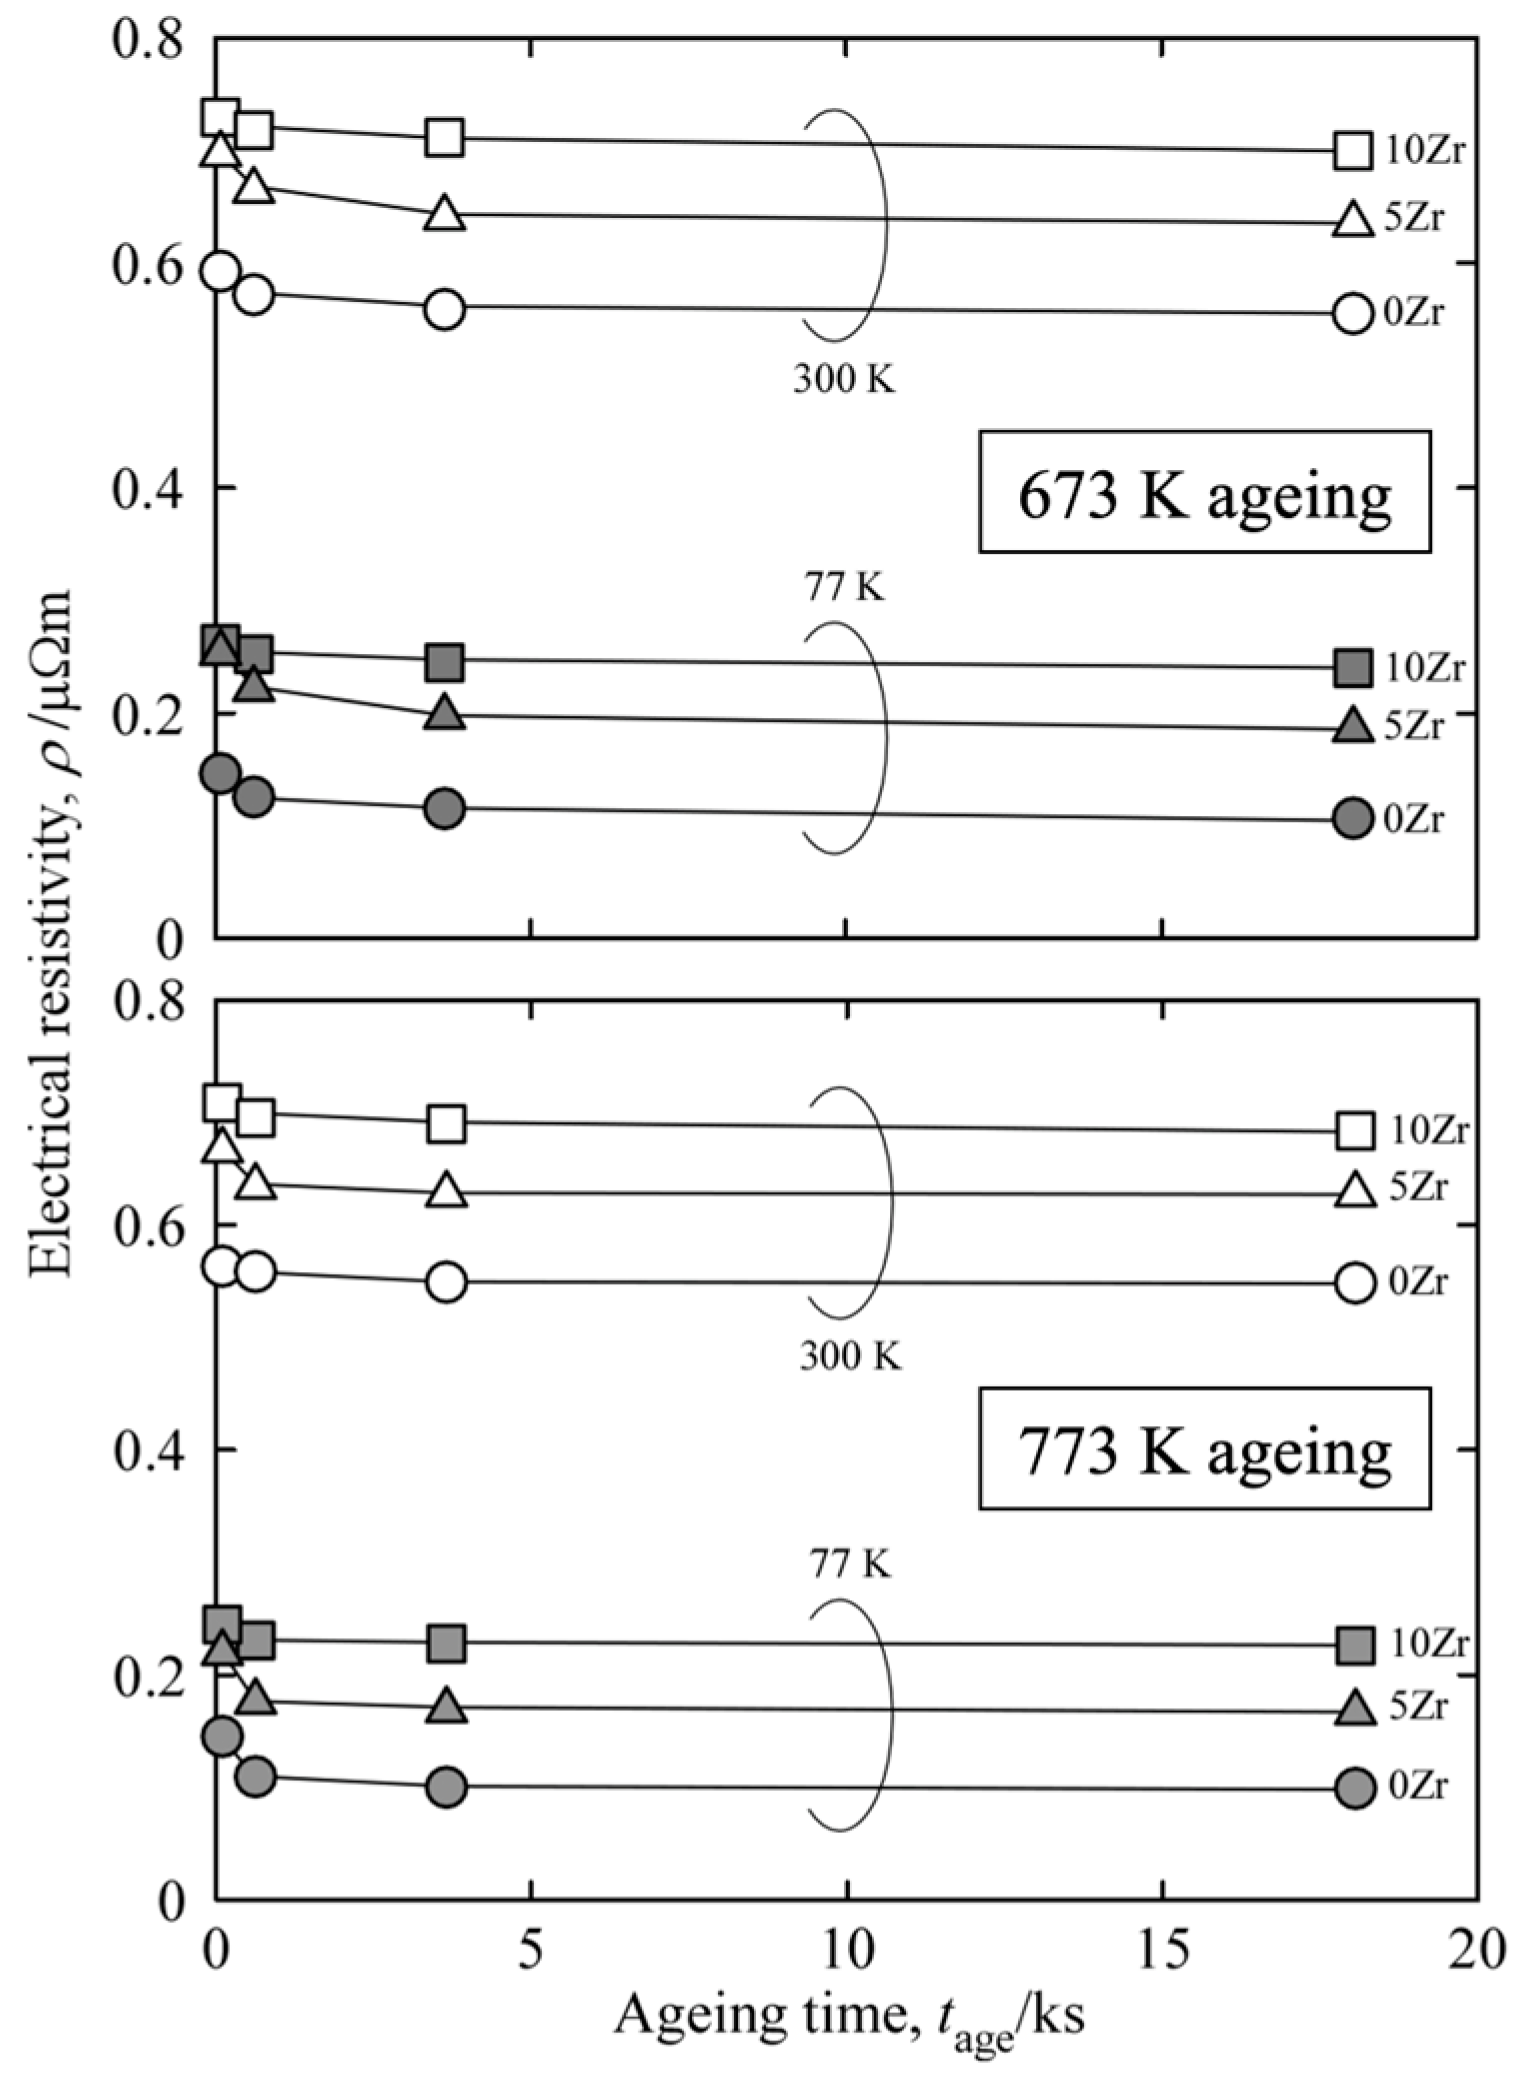
  • The change in electrical resistivity, which is very sensitive to phase changes, suggested the precipitation of a small amount of β-phase. However, no obvious change in the phase or microstructure was observed in either alloy after isothermal ageing at 673 or 773 K for 18 ks. The XRD and microstructural observations could not detect any precipitates.
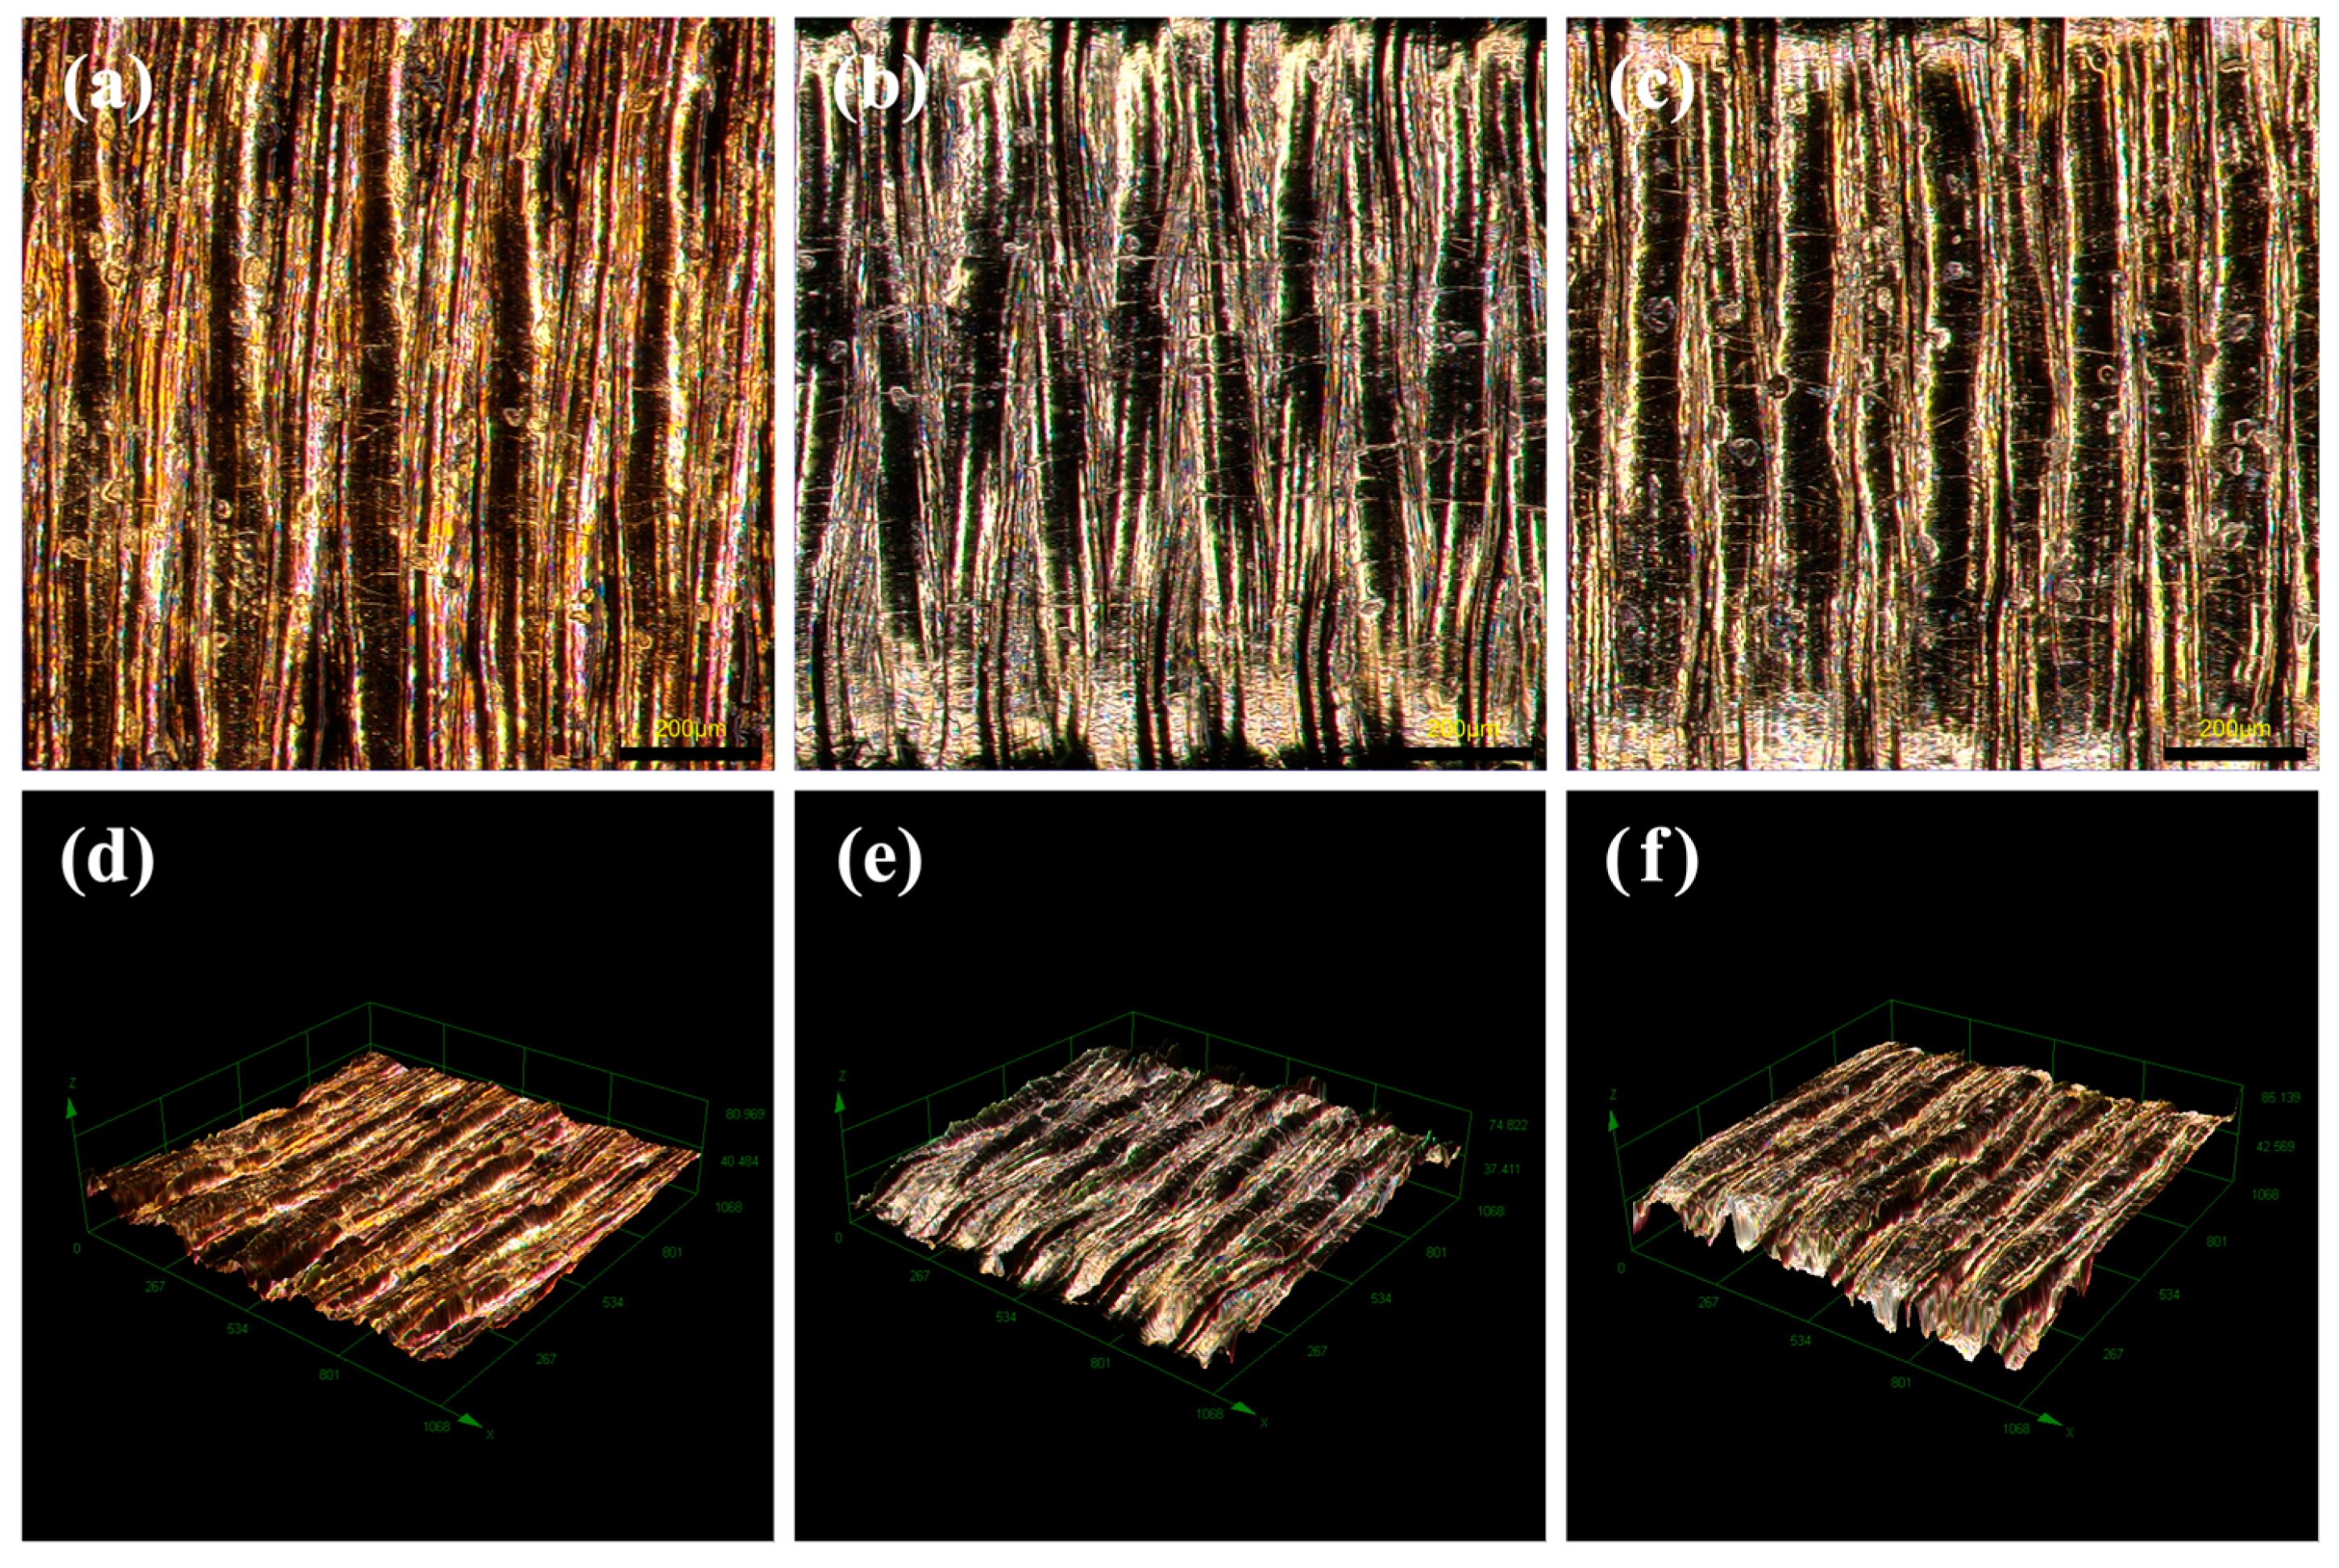
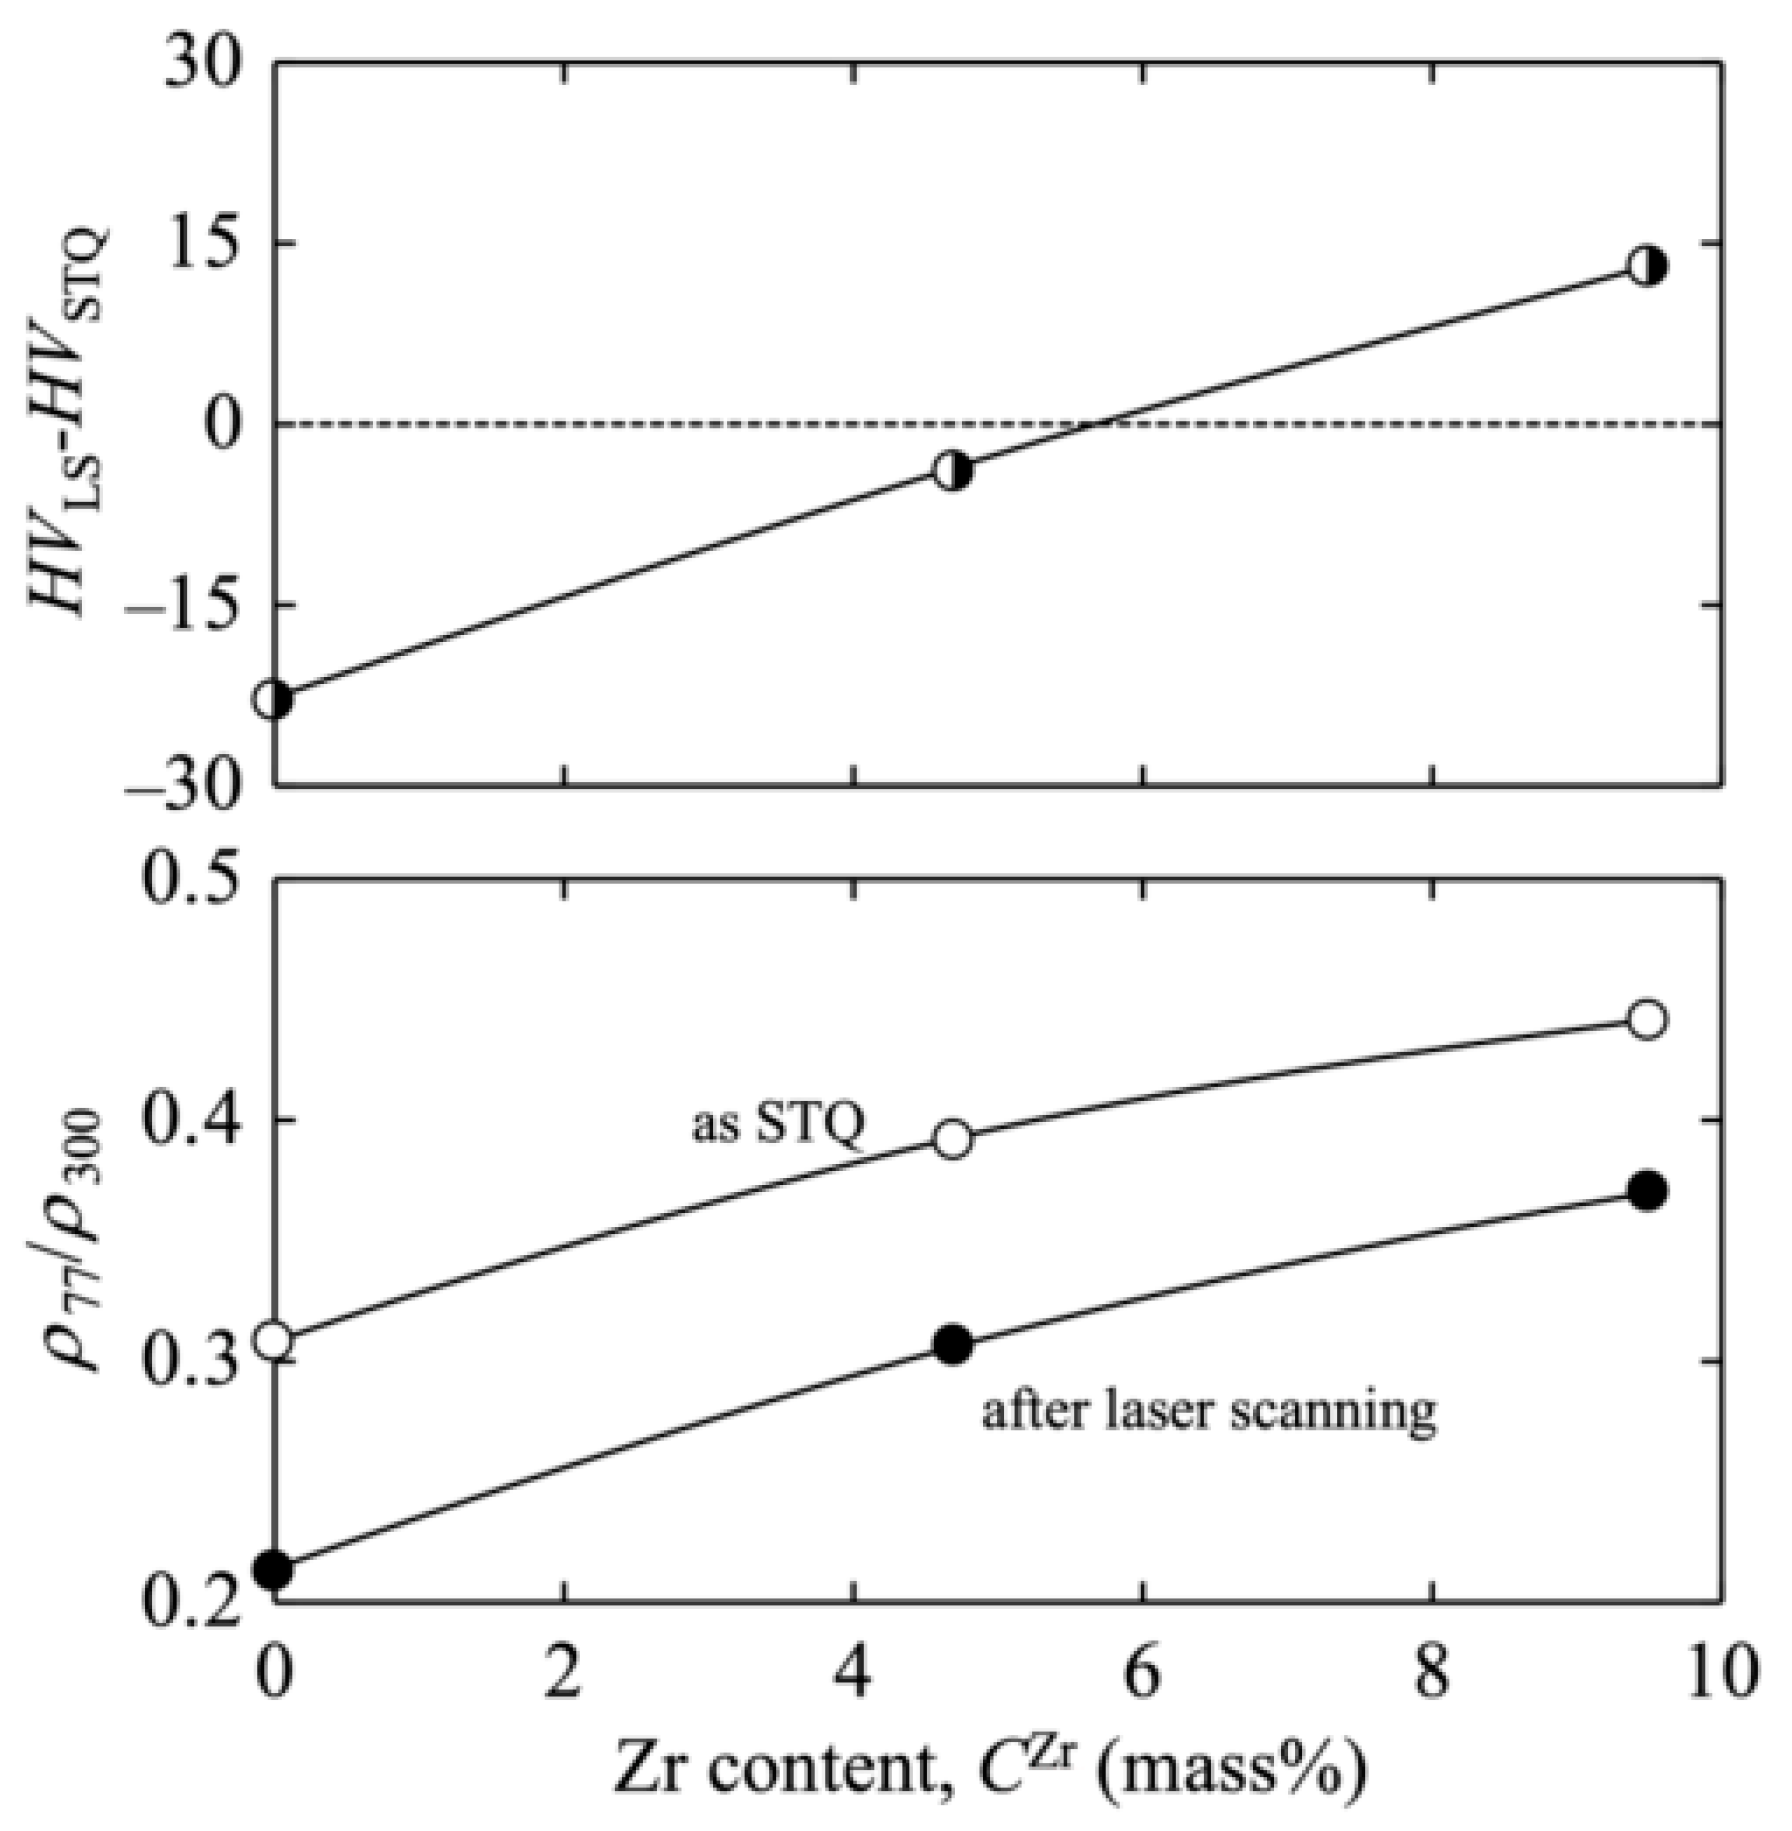
  • Laser scanning clearly led to a greater number of precipitates, compared with isothermal ageing at 673 or 773 K, though the absolute amount of precipitation was very small. The change in HV implied coarsening as well as an increase in the amount of precipitates. A broad view of all the results indicates that laser scanning does not lead to substantial changes in the phase and mechanical properties of the alloys. Thus, the results of the present study indicate that the investigated alloys are thermally stable and that the Ti-xmass%Zr-1mass%Fe (x = 0, 5, 10) system is a good candidate for PBF.

Author Contributions

Conceptualization, methodology, writing—original draft preparation, project administration, M.U.; investigation, C.T.H.; writing—review and editing, M.I. and T.N. All authors have read and agreed to the published version of the manuscript.

Funding

This work was financially supported by Grants-in-Aid for Scientific Research (21H05197) from the Ministry of Education, Culture, Sports, Science and Technology (MEXT) of Japan and the Light Metal Educational Foundation, Inc. This work was partially supported by CREST-Nanomechanics: Elucidation of macroscale mechanical properties based on understanding nanoscale dynamics for innovative mechanical materials [grant number JPMJCR2194] from the Japan Science and Technology Agency (JST).

Institutional Review Board Statement

Not applicable.

Informed Consent Statement

Not applicable.

Data Availability Statement

Not applicable.

Acknowledgments

We are grateful to Kota Kimura, Nanako Kosaka, and Tomotaka Wakaiki for specimen preparation and their support in collecting the data.

Conflicts of Interest

The authors declare that they have no known competing financial interests or personal relationships that could have influenced the work reported in this paper.

References

  1. Gepreel, M.A.-H.; Niinomi, M. Biocompatibility of Ti-alloys for long-term implantation. J. Mech. Behav. Biomed. Mater. 2013, 20, 407–415. [Google Scholar] [CrossRef]
  2. Long, M.; Rack, H.J. Titanium alloys in total joint replacement—A materials science perspective. Biomaterials 1998, 19, 1621–1639. [Google Scholar] [CrossRef]
  3. Niinomi, M. Recent research and development in titanium alloys for biomedical applications and healthcare goods. Sci. Technol. Adv. Mater. 2003, 4, 445–454. [Google Scholar] [CrossRef] [Green Version]
  4. Niinomi, M.; Nakai, M.; Hieda, J. Development of new metallic alloys for biomedical applications. Acta Biomater. 2012, 8, 3888–3903. [Google Scholar] [CrossRef] [PubMed]
  5. Niinomi, M.; Nakai, M. Titanium-based biomaterials for preventing stress shielding between implant devices and bone. Int. J. Biomater. 2011, 11, 836587. [Google Scholar] [CrossRef] [PubMed] [Green Version]
  6. Zhang, Y.; Wu, L.; Guo, X.; Kane, S.; Deng, Y.; Jung, Y.-G.; Lee, J.-H.; Zhan, J. Additive manufacturing of metallic materials. J. Mater. Eng. Perform. 2018, 27, 1–13. [Google Scholar] [CrossRef] [Green Version]
  7. Yan, C.; Hao, L.; Hussein, A.; Young, P. Ti–6Al–4V triply periodic minimal surface structures for bone implants fabricated via selective laser melting. J. Mech. Behav. Biomed. Mater. 2015, 51, 61–73. [Google Scholar] [CrossRef] [Green Version]
  8. Wieding, J.; Wolf, A.; Bader, R. Numerical optimization of open-porous bone scaffold structures to match the elastic properties of human cortical bone. J. Mech. Behav. Biomed. Mater. 2014, 37, 56–68. [Google Scholar] [CrossRef] [PubMed]
  9. Ueda, M.; Ikeda, M.; Mori, S.; Doi, K.; Kitagaki, H.; Terauchi, S. Mechanical properties of additively manufactured porous titanium with sub-millimetre structural units. Mater. Trans. 2019, 60, 1792–1798. [Google Scholar] [CrossRef] [Green Version]
  10. Chen, J.; Fabijanic, D.; Zhang, T.; Lui, E.-W.; Brandt, M.; Xu, W. Deciphering the transformation pathway in laser powder-bed fusion additive manufacturing of Ti-6Al-4V alloy. Addit. Manuf. 2022, 58, 103041. [Google Scholar] [CrossRef]
  11. Krajňák, T.; Janeček, M.; Kozlík, J.; Preisler, D.; Stráský, J.; Brázda, M.; Kout, J.; Halmešová, K.; Džugan, J. Influence of the thermal history on the phase composition of laser directed energy deposited Ti-8.5 wt% Mo alloy. Mater. Des. 2022, 222, 111049. [Google Scholar] [CrossRef]
  12. Murray, J.-L. Ti-Zr (Titanium-Zirconium). In Phase Diagrams of Binary Titanium Alloys; ASM International: Metals Park, OH, USA, 1987; pp. 340–345. [Google Scholar]
  13. Xu, T.; Zhang, S.; Cui, S.-L.N.; Cao, L.; Wan, Y. Precipitation behaviour during the βα/ω phase transformation and its effect in the mechanical performance of a Ti-15Mo-2.7Nb-0.2Si alloy. Sci. Rep. 2019, 9, 17628. [Google Scholar] [CrossRef] [PubMed] [Green Version]
  14. Ikeda, M.; Ueda, M.; Matsunaga, R.; Ogawa, M.; Niinomi, M. Isothermal Aging Behavior of Beta Titanium-Manganese Alloys. Mater. Trans. 2009, 50, 2737–2743. [Google Scholar] [CrossRef] [Green Version]
  15. Nath, P.; Marandi, L.; Sen, I. Processing-microstructure-property correlation in thermo-mechanically processed Ti-6Al-4V alloys: A comparative study between conventional and novel approaches. J. Alloys Compd. 2022, 927, 167039. [Google Scholar] [CrossRef]
  16. Komatsu, S.; Ikeda, M.; Sugimoto, T.; Kamei, K.; Maesaki, O.; Kojima, M. Aging behaviour of Ti-15Mo-5Zr and Ti-15Mo-5Zr-3Al alloy up to 573 K. Mater. Sci. Eng. A 1996, 213, 61–65. [Google Scholar] [CrossRef]
  17. Sharma, D.; Parfitt, D.; Chen, B.; Roebuck, B.; Venero, D.-A.; Kada, S.-R.; Fabijanic, D.; Fitzpatrick, M.-E. Influence of cooling rate on the precipitation kinetics of nanoscale isothermal ω-phase in metastable β-Ti alloy, Ti-5Al-5Mo-5V-3Cr. J. Alloys Compd. 2021, 859, 157822. [Google Scholar] [CrossRef]
  18. Abe, H.; Komatsu, S.; Hamaoka, M.; Ikeda, M.; Sakurai, T. Effects of room temperature pre-aging and Cu addition on 448 K isothermal aging behaviour of Al-1%Mg₂Si alloys. J. JILM 2006, 56, 88–93. [Google Scholar] [CrossRef]
  19. Ikeda, M.; Komatsu, S.; Sugimoto, T.; Kamei, K. Reverse Transformation of α” and Initial β Decomposition in Quenched Ti-Nb Binary Alloys. J. Jpn. Inst. Met. 1989, 53, 664–671. [Google Scholar] [CrossRef] [Green Version]
  20. Okamoto, H. Fe-Ti (Iron-Titanium). J. Phase Equilibria 1996, 17, 369. [Google Scholar] [CrossRef]
  21. Nakajima, H.; Koiwa, M. Diffusion in Titanium. ISIJ Int. 1991, 31, 757–766. [Google Scholar] [CrossRef] [Green Version]
  22. Komatsu, S.; Fujikawa, S. Electrical resistivity of light metals and alloys-Its measurement, interpretation and application. J. JILM 1997, 47, 170–181. [Google Scholar] [CrossRef] [Green Version]
  23. Komatsu, S.; Tatematsu, K.; Murakami, Y.; Kajiyama, T.; Matsuo, M.; Muramatsu, T. Application of Mattiessen’s rule to resistivity measurement and behaviours of Fe and Si in A1050 rolled sheets. J. JILM 1985, 35, 526–533. [Google Scholar] [CrossRef] [Green Version]
Figure 1. Vickers hardness of Ti-xmass%Zr-1mass%Fe alloys (x = 0, 5, 10) as STQ state.
Crystals 13 00568 g001
Figure 2. X-ray diffraction patterns of Ti-xmass%Zr-1mass%Fe alloys (x = 0, 5, 10) as STQ state. The peaks of Si are from the powder attached to the surface as a standard.
Crystals 13 00568 g002
Figure 3. Changes in diffraction angles of 11 2 ¯ 0 , 10 1 ¯ 3 , and 11 2 ¯ 2 peaks with Zr content as the STQ state.
Crystals 13 00568 g003
Figure 4. Optical micrographs of Ti-xmass%Zr-1mass%Fe alloys (x = 0, 5, 10) as STQ state and after ageing at 673 K and 773 K for 18 ks.
Crystals 13 00568 g004
Figure 5. X-ray diffraction patterns of Ti-xmass%Zr-1mass%Fe alloys (x = 0, 5, 10) after isothermal ageing at 673 K and 773 K. The ageing was performed cumulatively on the same specimen.
Crystals 13 00568 g005
Figure 6. Changes in electrical resistivities at 77 K and 300 K (ρ77, ρ300) in Ti-xmass%Zr-1mass%Fe alloys (x = 0, 5, 10) during the isothermal ageing at 673 K and 773 K.
Crystals 13 00568 g006
Figure 7. Changes in Vickers hardness and electrical resistivity ratio (ρ77/ρ300) in Ti-xmass%Zr-1mass%Fe alloys (x = 0, 5, 10) during the ageing at 673 K and 773 K.
Crystals 13 00568 g007
Figure 8. Optical micrographs of surfaces after the laser scanning in (a) 0Zr, (b) 5Zr, and (c) 10Zr of Ti-Zr-Fe alloys. (d), (e), and (f) topographic 3D images of (a), (b), and (c), respectively.
Crystals 13 00568 g008
Figure 9. Change in Vickers hardness caused by the laser scanning, and electrical resistivity ratio (ρ77/ρ300) before/after the laser scanning in Ti-xmass%Zr-1mass%Fe alloys (x = 0, 5, 10).
Crystals 13 00568 g009
Table 1. Chemical composition of the obtained alloys.
AlloysComposition (mass%)
ZrFeTiON
Ti-0Zr-1Fe-1.0Bal.0.060.005
Ti-5Zr-1Fe4.70.9Bal.0.040.001
Ti-10Zr-1Fe9.51.0Bal.0.090.002
Disclaimer/Publisher’s Note: The statements, opinions and data contained in all publications are solely those of the individual author(s) and contributor(s) and not of MDPI and/or the editor(s). MDPI and/or the editor(s) disclaim responsibility for any injury to people or property resulting from any ideas, methods, instructions or products referred to in the content.

