
Effect of Magnesium Dopant on the Grain Boundary Stability of Nanocrystalline Aluminum Powders during Cryomilling

1
Department of Mechanical Engineering, University of Nevada, Reno, NV 89557, USA
2
Department of Chemical and Materials Engineering, University of Nevada, Reno, NV 89557, USA
*
Author to whom correspondence should be addressed.
Crystals 2023, 13(3), 541; https://doi.org/10.3390/cryst13030541
Submission received: 17 February 2023
/
Revised: 14 March 2023
/
Accepted: 20 March 2023
/
Published: 21 March 2023
(This article belongs to the Special Issue State-of-the-Art Magnesium Alloys)
Abstract
:In this investigation, pure aluminum (Al) powders were cryomilled with and without magnesium dopants to study (a) the effect of cryomilling time on the crystallite size and (b) the effect of magnesium dopant on Al to achieve grain boundary stability. The cryomilling process was carried out using liquid nitrogen for different durations. The characterization of the cryomilled powders was carried out using scanning electron microscopy (SEM), transmission electron microscopy (TEM), and X-ray diffraction (XRD) to understand the particle morphology, crystallite size, and elemental composition. The results demonstrated that the size of the crystallites in both Al and Mg-doped Al powders reduces as the cryomilling duration increases. The results also indicated that the preferential segregation of Mg dopant at the grain boundaries of Al provides stability to the cryomilled powders at elevated temperatures. This article discusses the mechanism for the changes in crystallite size and the effect of the Mg dopant on the grain boundary stability in Al powders.
1. Introduction
Over the past decades, researchers have been working with conventional polycrystalline materials for various structural and industrial applications. However, with the advancement in manufacturing technologies and material science, researchers now have a far better understanding of materials and their properties. With these advancements, varied materials are now being used in novel applications. Therefore, there is a constant and demanding requirement to improve the mechanical properties of these materials. The bulk mechanical properties of a material can be changed by altering the grain structure. In the case of crystalline materials, these properties are governed mainly by the dislocation movement through the grain structure. This deformation mechanism is more pronounced in ultra-fine grain (UFG) structures [1]. The bulk mechanical properties can improve significantly upon further reducing the grain structure in the nanoscale range, as described by the classical Hall-Petch Equation (1).
According to this relationship, the material’s internal stress, σy (MPa), increases with the decrease in the crystallite size, d (m). Here, σ0 (MPa) is the material constant for dislocation movement starting stress, and k (MPa.m1/2) is the strengthening constant. It is important to note that this reduction becomes very significant below 100 nm grain size since the internal stress is inversely proportional to the square root of crystallite size. This gives superior properties to such materials. It is equally important to note that this synergistic behavior reduces beyond 10 nm due to amorphous grain boundaries now constituting a significant portion of the material [2].
Nanocrystalline (NC) materials comprise single or multiphase solids with an average crystallite size less than 100 nm [3]. As a result of this NC structure, huge volume fractions of dislocations accumulate near the grain boundaries, which disrupt the dislocation motion and induce internal stresses [4]. This provides superior properties to NC materials as compared with conventional materials. Recent studies on NC materials have shown significant improvements in mechanical properties such as high tensile strength [5,6,7], high hardness [8,9,10], excellent fatigue resistance [11,12,13], and superior wear resistance [14,15,16,17,18]. These outstanding properties are due to the large volumes of dislocation piled up at the grain boundaries. Therefore, reducing the grain structure of metals can significantly improve their performance. Owing to their superior performance, NC materials are often used in varied applications such as structural [19], aerospace [20], nuclear [21], biomedical [22,23], chemical [24], and automotive [25] industries. With structural applications such as in the aerospace and automotive industries, NC metal made up of lightweight metals (e.g., aluminum (Al), magnesium (Mg), etc.) offers a much better strength-to-weight ratio. However, not all parts of an aerospace structure can be entirely made up of NC metal. Therefore, metal parts such as parts of the wings, fuselage, and fasteners can be separately manufactured and installed on an existing aircraft using various mechanical methods such as ultrasonic-assisted soldering [26,27], stepped mechanical clinching [28,29,30], and the flat rivet clinch process [30]. NC metals can also be produced using powder processing techniques such as spark plasma sintering (SPS) [31,32], hot isostatic pressing (HIP) [33], and even additive manufacturing methods such as SLS (selective laser sintering) [34,35].
Even though the NC materials possess superior mechanical properties, their usage in real-world applications is still limited by the inherent issue of such small grain sizes. NC materials are often unstable due to the large volume of high-energy grain boundaries piled up in a small region. Thus, the grain structure is susceptible to grain coarsening on the application of temperature or over an extended period [36]. In the NC grain boundary region, the size of the crystallites is tiny, and thus they have an enormous grain boundary volume. To compensate for the mismatch between the neighboring grains, atoms are often moved from their regular lattice locations, resulting in high-energy structures. As a result, grain boundaries have more stored energy than grain interiors. The grain boundaries try to become thermodynamically stable by increasing the grain size since a coarse grain boundary possesses less stored energy due to a smaller boundary region when compared with an NC grain structure. Therefore, NC materials readily undergo grain coarsening at much lower temperatures, making them quite unstable [37]. To retain the properties, the excess energy of the grain boundaries of NC materials must be stabilized without affecting the crystallite size. Recent studies have shown that the interfacial energy at the grain boundaries can be lowered by preferential doping of the grain boundaries with secondary phase dopants. These secondary phase dopants segregate at the high-energy grain boundaries and stabilize them. The secondary phase material sitting at the grain boundaries has been shown to help in pinning the grain boundaries, thus reducing the effect of grain coarsening on the NC materials [38,39].
In the current investigation, the cryomilling process was utilized to reduce the crystallite size of the powders. Mg was used as a dopant to stabilize the high-energy grain boundaries. The morphology, elemental composition, and crystallite size evolution were then studied using scanning electron microscopy (SEM), transmission electron microscopy (TEM), and X-ray diffraction (XRD). This article also discusses the inherent mechanisms during the cryomilling process and the effect of cryomilling time on the changes in crystallite size. The article also examines the influence of the Mg dopant on the stability of high-energy grain boundaries in NC Al powders.
2. Materials and Methods
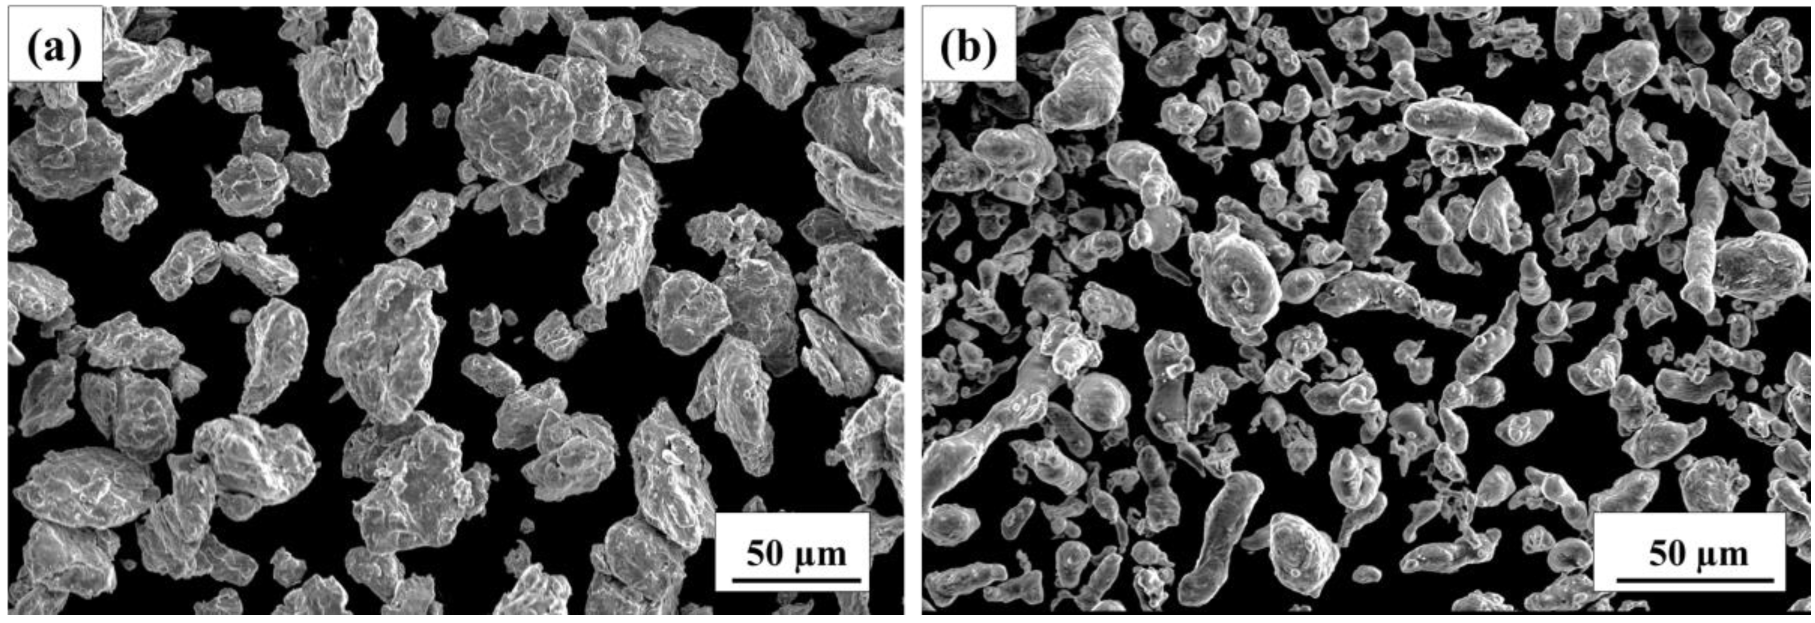
The present work uses commercially pure, gas-atomized, Al powder and Mg powders with 99.5% and 99.8% purity from Alfa Aesar (Haverhill, MA, USA). Both the as-received metal powders have particle sizes less than 45 µm. In the current work, the powders with no dopants added are referred to as ‘pure’. Figure 1 shows the secondary electron SEM micrograph of the as-received pure Mg and Al powders. The SEM micrographs show that the pure Mg powder particles are irregularly shaped with rough surface textures. On the contrary, pure Al powder has particles of different sizes with irregular cylindrical shape morphology and a much smoother surface texture. The powders were stored inside a nitrogen environment glove box to prevent oxidation.
For the cryomilling process, the powders were measured out and blended inside a mixing container by hand-shaking the container inside the nitrogen environment glove box. The powders are blended before the cryomilling because, during the startup of the milling process, some of the powders are blown out of the attrition chamber when the liquid nitrogen goes in with a 22-psi pressure. If the powder were not appropriately blended, either Al or Mg powders may be blown out selectively, disturbing the weight ratio of the mixture. For a proper blend, if any powders are blown out, it will still be a mixture of Al-5 wt.% Mg powders, which preserves the weight ratio. Figure 2 presents the schematic diagram of the experimental method, showing the pre-mixing of powders and the cryomilling process. The volume of the attrition chamber used for cryomilling was around 1400 cubic cm, which has the maximum capacity to cryomill with a maximum of 3 kg of milling media. The loading process for the attrition chamber was also carried out inside a glove box. First, a few layers of stainless steel (SS) balls measuring 6.3 mm in diameter were added to the chamber, followed by a 100 g blended mixture of Al (95 wt.%) and 5 wt.% of Mg powders, and then the remaining milling media, ensuring a ball-to-powder ratio of 30:1. During the cryomilling process, 0.1 wt.% of stearic acid (C18H36O2) was added to prevent the agglomeration of powders. Finally, the attrition chamber is loaded onto the milling frame of a customized Union Process 01-ST attritor mill to perform cryomilling. To maintain the powder at cryogenic temperatures during the cryomilling process, the inlet to the chamber was connected to a liquid nitrogen tank to ensure a continuous supply. The chamber outlet was directed to a waste collection bin to safely capture exhaust powders. The cryomilling was carried out for 2, 4, 6, and 8 h at −190 °C at 180 rpm. Once the milling process was completed and the attrition chamber was warmed up enough (around −10 °C to 4 °C) to handle it safely, the milling chamber was moved inside the glove box. The powders were then extracted in a nitrogen environment and later analyzed using various characterization techniques.
To characterize the powders, the unmilled and cryomilled pure Al and Al-5 wt.% Mg powders were analyzed using an SEM (FEI Quanta 600 FEG) at 10 kV for multiple magnification levels to study the morphology of the cryomilled powders. Energy dispersive X-ray spectroscopy (EDX) analysis was also performed on the powder samples using SEM. TEM (JEOL 2800 STEM FE gun) coupled with dual EDX detectors was used for examining the crystal structure, crystallite size, and elemental composition of the powder particles at the nanoscale. To prepare the TEM sample, dry powders were dispersed onto an ultrathin carbon type A, 400-mesh Cu grid and placed onto the TEM sample holder. The high-resolution TEM images obtained from the powdered samples were examined using ImageJ software to calculate the d-spacing from the fringe pattern. To analyze a fringe pattern, the image is converted into Fast Fourier Transform (FFT), and bright spots are selected. This image is then converted using inverse FFT, which provides a high-contrast image that can be analyzed to determine d-spacing. This d-spacing can provide information regarding the crystallographic plane for the specific bright spots in the diffraction pattern.
The crystallite size and composition of the powders were determined using a Bruker D8 advanced X-ray diffractometer. The characteristic peaks in the XRD plots were analyzed and compared with the standard to determine the composition of the powders. Any change in crystallite size or introduction of strains as a result of the cryomilling process results in the broadening of the XRD peaks. According to the Williamson-Hall equation [40], the total broadening () for an XRD peak is the arithmetic sum of broadening occurring due to decrease in crystallite size and broadening due to strain in the material as given by Equation (2).
where (nm) is the strain of the material, θ (rad) is Bragg’s angle, λ (nm) is the wavelength of the X-ray, D (nm) is the crystallite size, and K is the Scherrer’s constant. The above equation results in a straight line when is plotted against . The slope of the straight line plotted between and is and its y-intercept is . The broadening of XRD peaks due to a reduction in crystallite size can be assessed by calculating the Full Width at Half Maximum (FWHM) and putting it into the equation. The value of the λ (wavelength of X-ray) is 0.154178 nm for the Cu tube in XRD, and K is 0.94 for pure aluminum as it has a cubic symmetry. This study used a linear fitting approach to find the FWHM for the first 5 peaks. This approach also yields the corresponding strain for each of the powder samples, which is useful in case of highly strained samples.
To study the effect of elevated temperature on grain coarsening, the cryomilled powders were annealed at varying temperatures. The annealing process was carried out under vacuum conditions inside a ThermoFisher Scientific Lindberg/Blue M LGO Tube Furnace at 300 °C, 400 °C, 500 °C, and 550 °C for an hour.
3. Results and Discussion
3.1. Powder Structure and Morphology Analysis
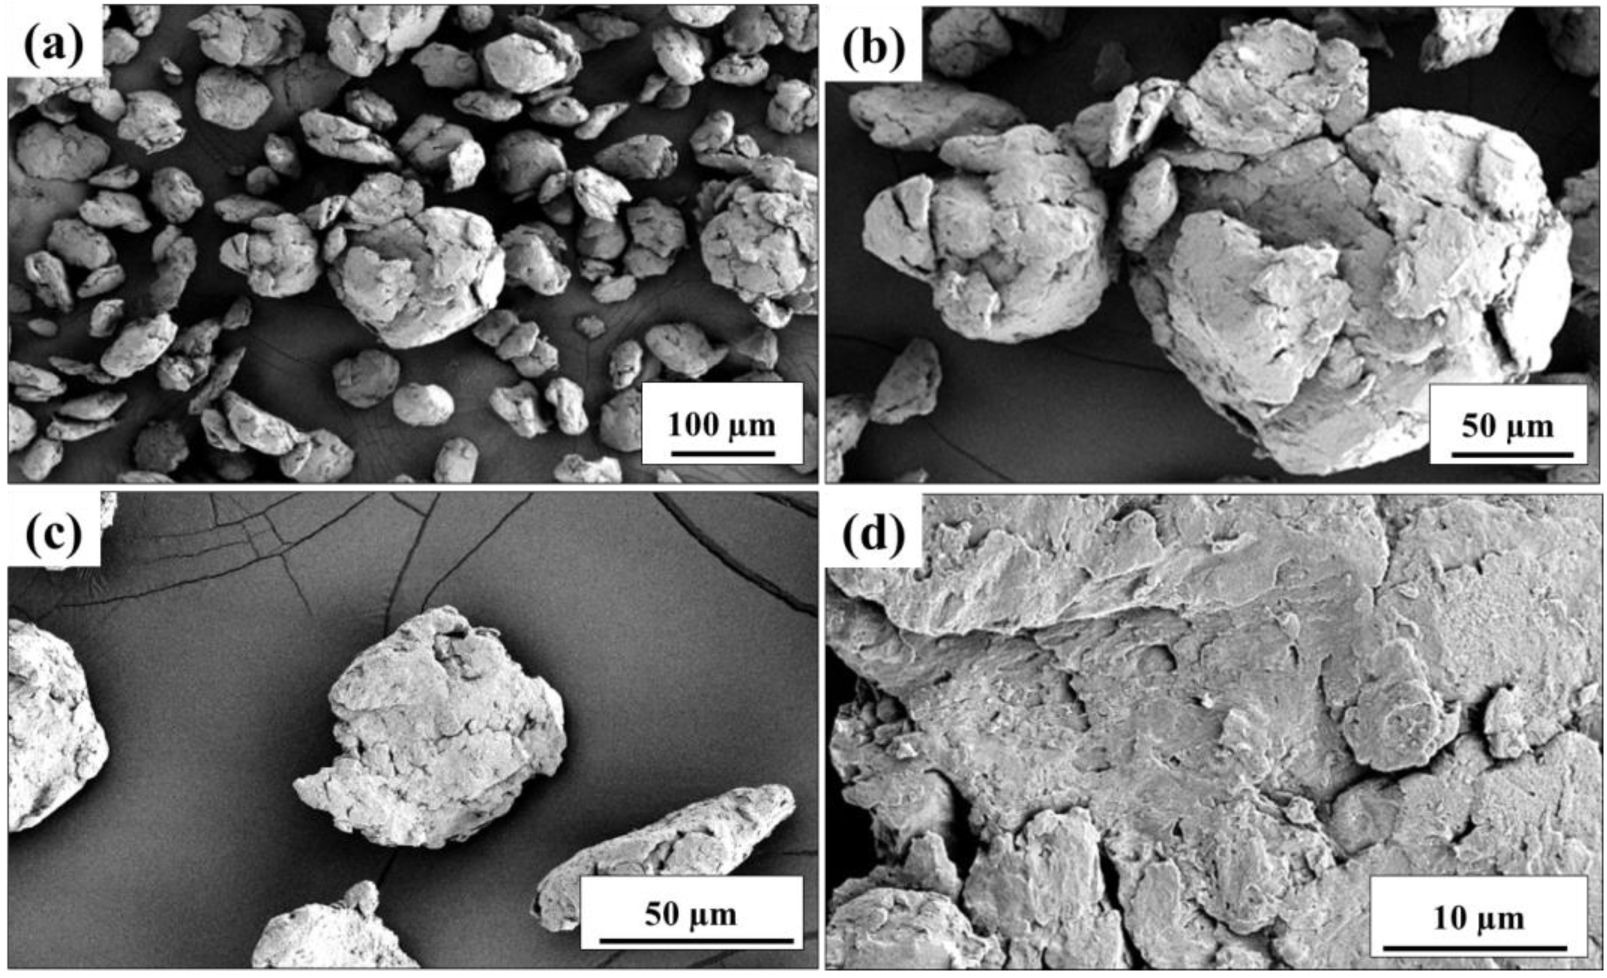
The powder particles are repeatedly sheared, cold-welded, and refractured during the cryomilling process due to the impact forces of the SS milling media [41]. Cryomilling suppresses the dynamic recovery and recrystallization of the grains at cryogenic temperatures, which facilitates grain refinement much faster than other attrition-based methods, such as high-energy ball milling [42,43]. During the milling process, the physical shape and structure of the powders change considerably. The irregular-shaped Al and Mg particles are flattened repeatedly, and a few particles agglomerate together to form a few larger particles, as shown in Figure 3a. The particle morphology after cryomilling shows fractured cold-welded particles and their fragments, which are comparably rounder with protruding rougher edges surfaces. These features significantly differ from those of the as-received powders, which have a cylindrical shape and a smoother surface texture. The close-up view of the individual particle in Figure 3b shows that the bond between these agglomerate particles is strong, and a few loosely bonded particles protrude from the surface. These loosely bonded flattened particles are often sheared away during cryomilling to form much finer particles of varying dimensions, as shown in Figure 3c. Figure 3d shows the surface texture of one of the cryomilled powder particles. The surface evidently indicates a lot of shearing crack marks, micropores, and cold-welding joints formed due to the cryomilling process.
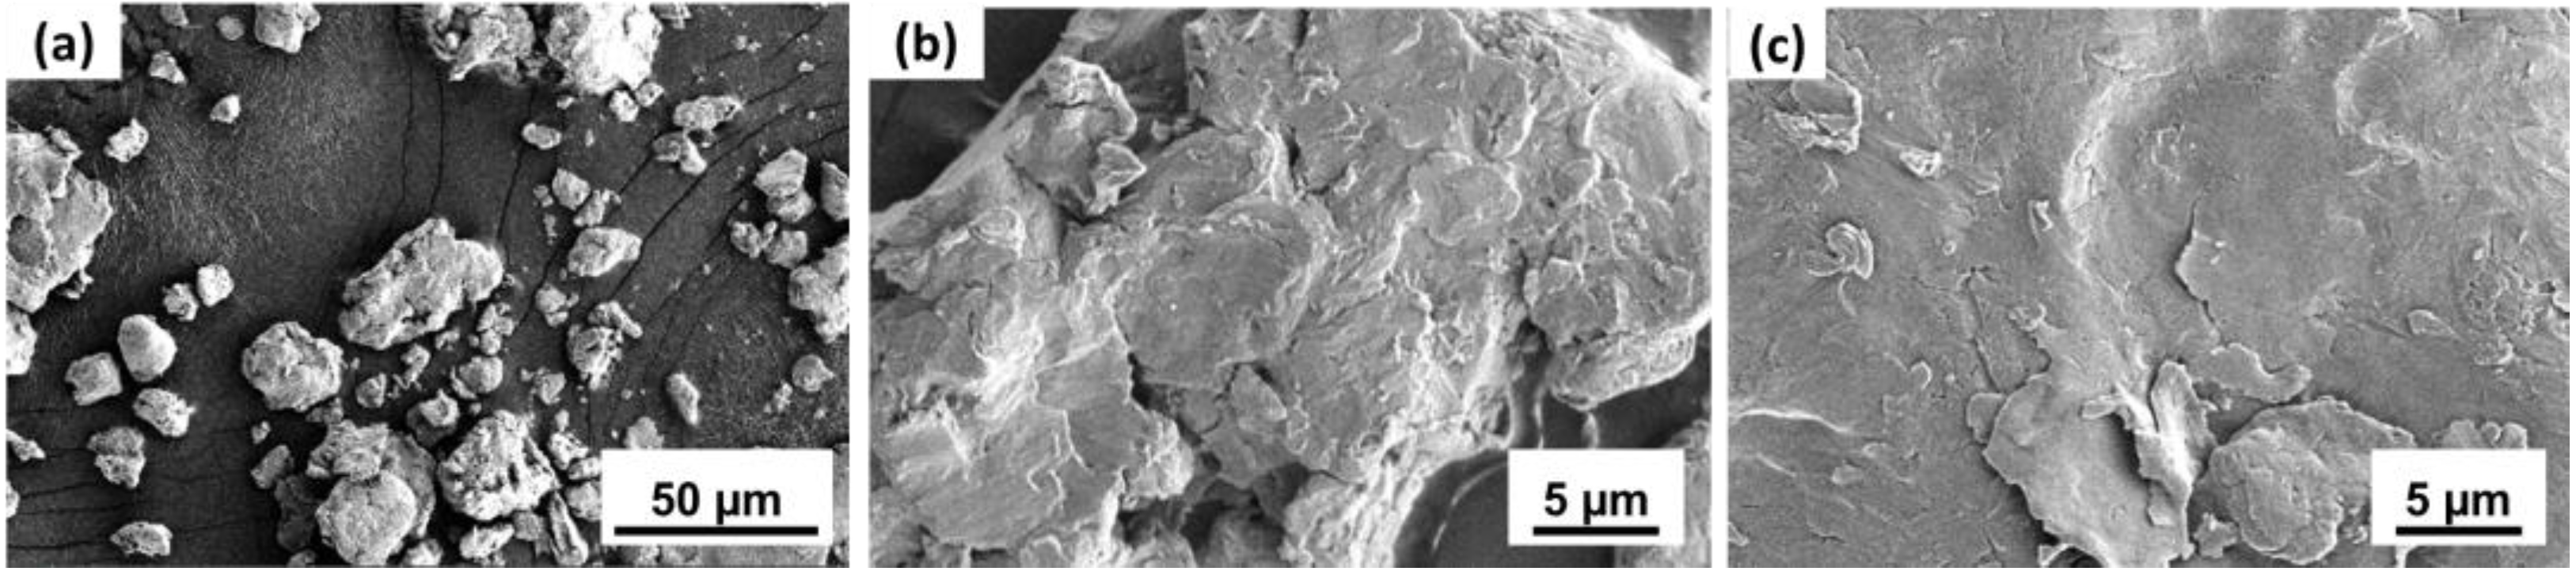
Like the pure Al powders, the Al-5 wt.% Mg powders were also cryomilling for 8 h. However, the resultant physical morphology and structure of these powders are a bit different from the pure Al cryomilled particles. Figure 4a shows the SEM of the cryomilled Al-5 wt.% Mg powder particles after 8 h of cryomilling. It can be observed that the particles have undergone shearing and cold welding, though they show much less agglomeration to form larger ball-like structures. Instead, the particles are broken down into much finer particle sizes than pure Al particles. Compared to pure Al, which showed smooth, plastically deformed particle fragments, the Al-5 wt.% Mg shows much more brittle shearing and fracturing of the particles. This is because the dopant Mg present at high-energy grain boundaries hinders dislocation movement, leading to restricted plastic deformation and brittle modes of fracture.
Another critical observation derived from cryomilled powders is that the shearing and cold welding occurring during the cryomilling process are functions of the cryomilling time. Figure 4b shows the surface features of Al-5 wt.% Mg powder particles cryomilled for 8 h. The surface reveals shearing marks and cold-welded fragments of the cryomilled powders. However, for Al-5 wt.% Mg powder cryomilled for 2 h, much fewer shearing marks and cold-welded fragments can be seen compared with 8 h cryomilled powders, as shown in Figure 4c. This observation is obvious yet essential because the repeated shearing and fracturing create a lot of strain energy in the grains. These highly strained grains help reduce the crystallite size of the powders. Therefore, the crystallite size decreases with the increase in cryomilling time up to a certain limit, beyond which there is a minor to insignificant change in crystallite size due to the dominance of the agglomeration phenomenon [44].
The particle morphology studies revealed the surface and textural features of the cryomilled particles. Further, EDX investigations were also conducted using SEM on cryomilled powders to understand their elemental composition. Figure 5a shows the SEM-EDX plot for Al-5 wt.% Mg powder particles cryomilled for 8 h. The plot shows the characteristic elemental peaks for Al and Mg, confirming the presence of Mg in individual particles. The absence of any other major elemental peak also confirms no contamination of the metal powders during or after the cryomilling process. Figure 5b shows the EDX area mapping for an Al-5 wt.% Mg powder particle. The figure shows the presence of trace amounts of oxygen all over the particle surface, indicating minimal surface oxidation. The presence of Mg all over the powder particle confirms the presence of Mg in a representative milled particle, reassuring the cryomilling process’s efficiency in mixing the powders.
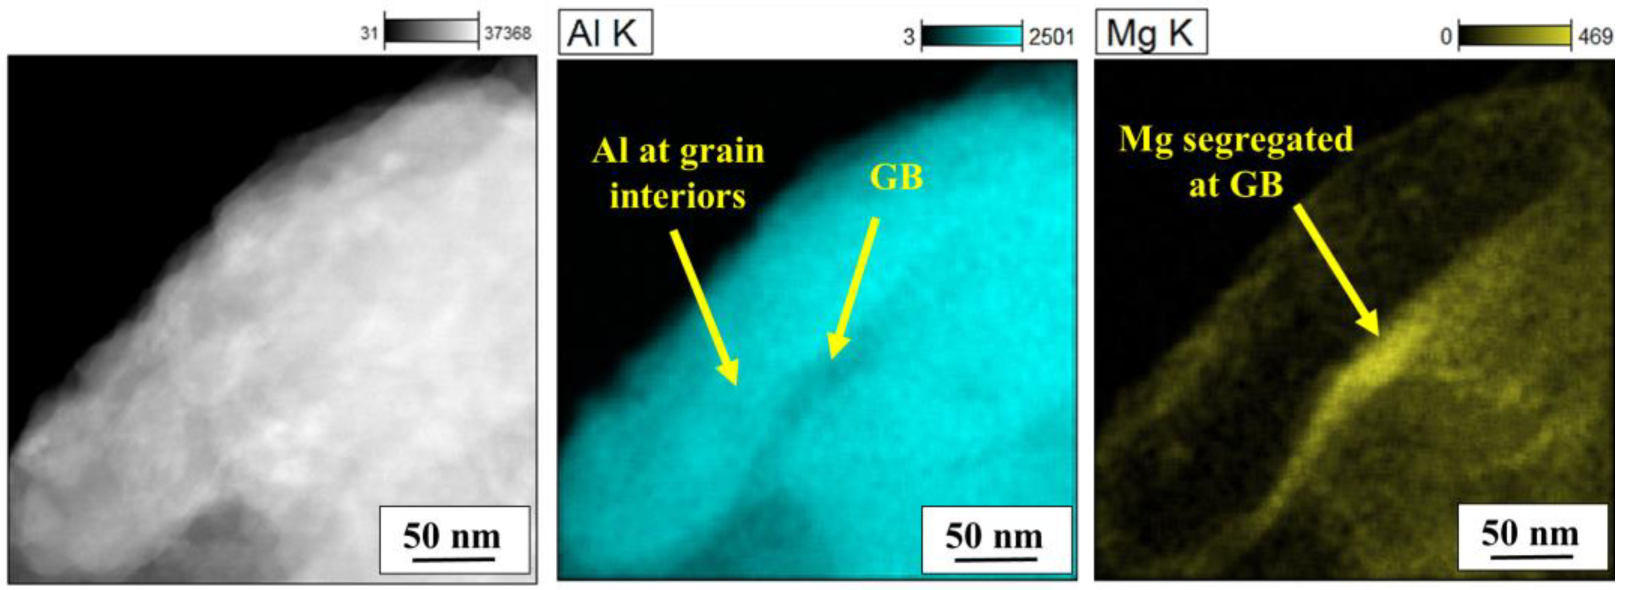
Table 1 shows the EDX elemental evaluation for 2, 4, 6, and 8 h cryomilled Al-5 wt.% Mg powder samples using SEM and TEM. The results suggest that the added Mg powders are uniformly mixed with the pure Al and present at the required concentration of around 5% in each cryomilled agglomerated particle, despite the variation in cryomilling durations. The results obtained using EDX for 40–50 µm size particles for all the test samples in SEM were mainly in line with the EDX conducted using TEM for a single particle. Figure 6 shows the TEM-EDX elemental mapping of the Al and Mg in the 8 h cryomilled Al-5 wt.% Mg powder particles. It can be observed that Al is uniformly distributed over the interior of the grain, whereas the maximum concentration of Mg is present at the grain boundaries. This preferential segregation of the Mg dopant at the grain boundaries occurs to stabilize the high-energy grain boundaries thermodynamically. Once the Mg sits at the grain boundaries, the overall energy of the grain boundaries is neutralized, forming a much more stable NC structure [45].
3.2. Crystallite Size Analysis
The crystallite size is one of the most important characteristic features of NC materials. Typically, any material is considered NC if the mean crystallite size is below 100 nm. However, the aim is always to reduce the crystallite size as much as possible to get a superlative enhancement in mechanical properties. The crystallite size was determined for all the powder samples using the XRD characterization technique by analyzing their resultant XRD plot. Figure 7a shows the XRD plots for unmilled pure Al and Al-5Mg cryomilled for different milling durations. The sharp peaks in the obtained XRD patterns indicate that the powder samples are crystalline. Each of the characteristic peaks in the spectra corresponds to a different lattice plane. Figure 7b highlights the broadening of the XRD peaks with the increasing cryomilling duration. Generally, the broadening of XRD peaks indicates either an increase in the lattice strain, a reduction in the crystallite size, or both, as per the Williamson-Hall equation [40]. In the current work, the powder samples are cryogenically milled, which is a very high strain rate process; therefore, the particles undergo a lot of straining as well as crystallite size reduction. This can be determined by using the Williamson-Hall equation for each XRD plot and analyzing the fitted equation. For Al and Al-5 wt.% Mg, the linearly fitted curve had a high correlation coefficient (r2) value, indicating that the curve is fitted accurately. Therefore, the crystallite size and lattice strains can be calculated using this method by determining the plot’s slope and intercept. To calculate the crystallite size using the Williamson-Hall method, the required FWHM value can be determined by fitting the XRD plot and measuring the FWHM. Substituting the values of FWHM in Williamson-Hall Equation (2) gives a plot that is linearly fitted to give out the equation of a line. Now, the crystallite size can be calculated by substituting the intercept value, whereas the lattice strain can be calculated from the slope of the line. For the current work, Scherrer’s constant K value for the equation is 0.94, as the particles are spherical with cubic symmetry [46], and the wavelength (λ) for the characteristic X-ray from the Cu radiation tube is 1.541178 Å. The instrumental broadening of the XRD equipment was taken as 0.05. This value is subtracted from the FWHM to calculate the crystallite size for all the XRD plots.
Figure 7c compares the crystallite size variation for pure Al with that of Al-5 wt.% Mg with the increase in cryomilling duration. The pure Al powders showed a reduction of nearly 61.4% in crystallite size from 249 nm for unmilled pure Al powders to 96 nm after 8 h of cryomilling, whereas for 8 h cryomilled Al-5 wt.% Mg powders, the crystallite size is reduced by nearly 87.1% to a value of 32 nm as compared with unmilled pure Al. This reduction in crystallite size is attributed to the presence of Mg dopant, which segregates at the high-energy grain boundaries and prevents grain coarsening. The Mg at the grain boundaries acts as pinning sites and hinders the dislocation motion, enhancing the process efficiency by reducing the crystallite size to a much higher level than pure Al. Therefore, the crystallite size reduction rate for Al-5 wt.% Mg is much higher than that for pure Al, which indicates that the nanocrystallinity could be achieved much quicker with the addition of the Mg dopant. Apart from decreasing the crystallite size, the cryomilling process is a very high strain rate process where the powder particles readily deform, shear, and weld together, which induces a lot of strain in the particles. Figure 7d presents the variation in strain on the cryomilled sample with the increasing cryomilling duration. The strains for the 2 h cryomilled pure Al and Al-5Mg samples are 0.00154 and 0.00157, respectively. The strain shows an increasing trend with the increasing cryomilling duration (decreasing crystallite size). The strains for the 8 h cryomilled pure Al and Al-5Mg samples are 0.0020 and 0.0021, respectively.
The XRD pattern gives the powder specimen’s average crystal size and strain. However, the samples were examined using the selected area diffraction pattern (SADP) technique in TEM to determine the degree of polycrystallinity, crystal structure, lattice parameters, and size of a single crystallite. Figure 8a shows a bright-field TEM image for the pure unmilled single Al powder particle. The inset image shows the SADP for the corresponding particle. The bright and distinctly sharp spots in the specific pattern occurring at regular distances indicate that the corresponding powder is crystalline in nature, and the diffraction pattern is close to a single crystal of pure Al. There are a few less bright spots in the diffraction pattern that come from more than one crystallite in the diffraction area. Figure 8b shows the bright-field TEM image for the 8 h cryomilled pure Al powder particle. The inset image shows the SADP for the corresponding particle shown in the bright field image. The bright spots with a concentric ringed pattern indicate the polycrystalline nature of the cryomilled pure Al powders, suggesting even more crystals in the diffraction region. It can be inferred that the reduced crystallite size allows for the accommodation of several crystallites as compared with unmilled powders.
The Al-5 wt.% Mg samples were also analyzed using the SADP technique in TEM to determine the effect of the cryomilling duration on the polycrystalline nature of the Al-5 wt.% Mg powders. Figure 9a–d shows the bright-field TEM image for Al-5 wt.% Mg powders cryomilled for 2, 4, 6, and 8 h. The inset image of each of the bright field images shows the SADP for the corresponding cryomilled powder particle. It is observed that the SADP for 2 h cryomilled powders (Figure 9a) shows a few bright spots; however, these spots form more concentric rings as the cryomilling duration increases, as seen in Figure 9b–d. The results show relatively bright spots with a few concentric circles, suggesting the polycrystalline nature of the cryomilled powder particles with some preferred orientation of the grains, similar to that of cryomilled pure Al powder particles. The presence of concentric rings indicates the diffraction of several crystals in the diffraction region. Therefore, it can be concluded that crystals in cryomilled powders are substantially smaller, allowing for many more crystallites in a smaller diffraction region. The presence of nano-sized crystals in the same diffraction region accounts for a few fewer bright spots in the SADP.
The SADP obtained in TEM can also be used to calculate the interplanar spacing. Each bright spot in the diffraction pattern corresponds to a particular crystallographic plane. The dark field imaging of these bright spots shows the presence of crystallites, which can be measured using the ImageJ software. However, since TEM’s maximum field of view (FOV) is typically very small, the current dark field imaging is for a tiny evaluation area. In the present work, the authors have evaluated the crystallite size of the smallest resolvable crystallite visible in the FOV. To measure the crystallite size of powders in the dark field images, a reference line can be drawn on the image scale bar to establish a reference scale for the ImageJ application in terms of the pixel size of the image and the TEM scale bar on the image. Now, this reference scaling can be used to measure the size of each of the bright spots. Figure 10a-c shows the dark-field images for different crystallographic planes for 8 h cryomilled pure Al powders. Figure 10d–f also shows the dark-field images for different crystallographic planes for 8 h cryomilled Al-5 wt.% Mg powders. The measurements of these bright spots give the crystallite sizes for pure Al powders as 18 nm for (111), 22 nm for (200), and 16 nm for (220). The crystallite sizes for Al-5 wt.% Mg were determined as 17 nm for (111), 12 nm for (200), and 14 nm for (220). Therefore, as determined using TEM, the average crystallite sizes are 19 nm and 14 nm for pure Al and Al-5 wt.% Mg in 8 h cryomilled powder particles, respectively.
The crystallite sizes determined from the XRD plots gave an average of the crystallite sizes for the powder sample, whereas the TEM can measure the size of an individual crystallite. Therefore, the crystallite size calculations from XRD are compared with those of individual crystallite measurements from the TEM to quantify and validate the results. Table 2 compares the crystallite sizes as determined using XRD and TEM for pure Al and Al-5 wt.% Mg for different cryomilling durations. The determined crystallite size of unmilled pure Al using TEM is 67 nm, reducing to 19 nm after 8 h of cryomilling. The decrement in the crystallite size follows a similar trend as seen in the XRD, where it decreases with the increase in cryomilling duration. The crystallite sizes for Al-5 wt.% Mg also show a similar trend, where they reduced from 18 nm for 2 h of cryomilling to 14 nm for 8 h of cryomilling. Therefore, the comparative evaluation indicates that the crystallite size changes for both characterization techniques are in accordance with each other. Nevertheless, it is also essential to understand that since the XRD results give an average measure of crystallite sizes, it is always better to use XRD results to indicate the reduction in crystallite size.
3.3. Grain Boundary Stabilization at Elevated Temperatures
During the processing of cryomilled NC metal powders to make bulk components, the grain structure is generally very susceptible to grain coarsening. Powder processing techniques such as SPS, HIP, and other metal laser processing methods such as SLS can cause drastic changes in grain structures due to high temperatures during processing. In the case of cryomilled powders, the crystallite size of the powders is comparatively much smaller than alloys manufactured using other methods, thereby increasing the grain boundary energy. Since the grain boundary energy is high, it is thermodynamically favorable for the grains to readily undergo coarsening to reach a lower energy state and become stable [47]. Therefore, any NC metal powder is much more sensitive to any change in temperature. Apart from the crystallite size reduction, the cryomilling process also induces a lot of internal stresses in the powders due to repeated fracturing and cold welding of the particles. At elevated temperatures, the grain structure is relieved from these compressive stresses. Therefore, crystallites may undergo crystallite growth or recrystallization to give a coarser grain structure and poor mechanical properties.
To make a functional component with NC metal powders, they are required to sustain elevated temperatures for the manufacturing process and during the lifetime of application. To determine the overall effect of elevated temperatures on the gain boundary stabilization of the cryomilled powders, they were subjected to annealing in a vacuum environment at varying temperatures. The samples were annealed for an hour at 300 °C, 400 °C, 500 °C, and 550 °C, followed by cooling inside the furnace. After the annealing process, the XRD technique was used to determine the crystallite sizes of the annealed powder samples. Figure 11a shows the XRD plots for the pure Al and Al-5 wt.% Mg samples annealed at different temperatures. The results show the variation in XRD plots and peak intensities with an increase in the annealing temperature for both powder samples. Taking a section of the XRD plot and observing the (111) peaks for 300 °C and 550 °C for both the powder samples clearly shows that the peaks are shrinking with the increase in annealing temperature (Figure 11b). Shrinking of the peak indicates decreasing FWHM for each peak, which gives a higher crystallite size. Therefore, both pure Al and Al-5 wt.% Mg samples have undergone coarsening to some extent. Figure 11c presents the crystallite size analysis for the pure Al and Al-5 wt.% Mg samples for different annealing temperatures compared with the 8 h cryomilled samples. The results show that the crystallite size of the pure Al sample increased from 96 nm to 241 nm after an hour of annealing at 550 °C, which is very close to the crystallite size of the as-received unmilled sample. Therefore, at 550 °C, the pure Al sample undergoes complete grain coarsening and loses all the NC properties. Even at 300 °C, the pure Al sample undergoes rapid annealing and coarsening to attain a crystallite size of 132 nm, which is already beyond the NC range, and therefore, the material loses its NC properties. On the contrary, for the Al-5 wt.% Mg powder samples, the crystallite size gradually increases from 32 nm to 55 nm for annealing at 300 °C, to 76 nm at 400 °C, to 97 nm at 500 °C, finally reaching a value of 120 nm at 550 °C. At 300 °C, the Al-5 wt.% Mg samples show very little grain coarsening as compared with the pure Al sample. This is due to the Zenner pinning effect of the Mg present at the grain boundaries, which hinders the motion of the dislocations and therefore prevents the grain growth. The Mg added during the cryomilling process also preferentially segregates at the high-energy grain boundaries to lower their energy. Several molecular dynamics simulation studies have shown that dopant Mg can preferentially segregate at the grain boundaries, which can help to reduce the grain boundary energy and cause the Zenner pinning effect [37,47].
The results showed that the crystallite sizes increased for both the pure Al and Al-5 wt.% Mg powders upon annealing. However, it is essential to note that the melting point of pure Al is around 660 °C (1221 °F) and that of pure Mg is around 650 °C (1202 °F). Therefore, in typical high-temperature applications for aluminum, the materials are subjected to maximum temperatures of about 200 to 300 °C. Since the crystallite size for Al-5 wt.% Mg is still very well within the NC range, it will show much superior properties. It is also important to note that the NC powders are subjected to heat for less than an hour during the manufacturing process for a bulk sample, which further minimizes the chances of grain coarsening. For instance, a pure Al sample can yield 99 to 100% dense bulk components with just 15 min of heat exposure at 500 °C [45]. Thus, this study ensures that during the manufacturing of bulk samples using SPS or HIP, there will be limited grain coarsening as a result of elevated temperatures, and the resultant bulk component will still possess the characteristic superior properties of NC materials such as high strength, hardness, etc., which will be useful in various structural applications.
4. Conclusions
The current study demonstrates the NC Al-Mg powders’ manufacturing process using cryomilling to reduce their crystallite size. The magnesium dopant added during the cryomilling process segregates at the high-energy grain boundaries to lower its energy and stabilize its grain boundaries. This Mg segregation hinders the dislocation motion and thus increases the internal stresses that help improve the mechanical properties. The comparative analysis of the crystallite size properties for NC pure Al and NC Al-Mg helps understand the effect of the Mg dopant on restricting grain growth. Therefore, the following conclusions can be drawn from the current study:
- After 8 h of cryomilling, the pure Al powders showed a 61.4% reduction in crystallite size, whereas the Al-5 wt.% Mg powders reduced by 87.1% in crystallite size as compared to unmilled pure Al.
- EDX elemental mapping results showed the preferential segregation of the Mg dopant at the high-energy grain boundaries, which thermodynamically stabilizes the grain boundaries. The presence of Mg at the grain boundaries also helps in pinning the grain boundaries, preventing grain coarsening.
- Grain coarsening occurs with increased annealing temperatures for pure Al and Al-5 wt.% Mg samples. The Al-5 wt.% Mg cryomilled samples showed less grain coarsening than pure Al cryomilled samples due to the Zenner pinning effect, which restricted the grain growth and prevented grain coarsening.
Author Contributions
Conceptualization, M.M. and P.L.M.; methodology, A.K.K.; experimentation and analysis, A.K.K.; writing—original draft preparation, A.K.K.; writing—review and editing, A.K.K. and P.L.M.; supervision, M.M. and P.L.M.; funding acquisition, M.M. and P.L.M. All authors have read and agreed to the published version of the manuscript.
Funding
The authors acknowledge the financial support from the US Department of Energy (DOE) within the project number DE-EE0009116.
Data Availability Statement
Not applicable.
Acknowledgments
The authors acknowledge the Department of Mechanical Engineering, University of Nevada, Reno, for providing all research facilities. This work made use of the University of Utah shared facilities of the Micron Technology Foundation Inc. Microscopy Suite sponsored by the College of Engineering, Health Sciences Center, Office of the Vice President for Research, and the Utah Science Technology and Research (USTAR) initiative of the State of Utah. This work made use of the University of Utah USTAR shared facilities, which are supported, in part, by the MRSEC Program of the NSF under Award No. DMR-1121252. The support of the National Science Foundation (CHE-1429768) for the purchase of the powder diffractometer is gratefully acknowledged.
Conflicts of Interest
On behalf of all authors, the corresponding author states that there is no conflict of interest.
References
- Prangnell, P.; Bowen, J.R.; Apps, P. Ultra-fine grain structures in aluminium alloys by severe deformation processing. Mater. Sci. Eng. A 2004, 375–377, 178–185. [Google Scholar] [CrossRef]
- Kushwaha, A.K.; John, M.; Misra, M.; Menezes, P.L. Nanocrystalline Materials: Synthesis, Characterization, Properties, and Applications. Crystals 2021, 11, 1317. [Google Scholar] [CrossRef]
- Birringer, R. Nanocrystalline materials. Mater. Sci. Eng. A 1989, 117, 33–43. [Google Scholar] [CrossRef]
- Wei, Y.; Bower, A.F.; Gao, H. Enhanced strain-rate sensitivity in fcc nanocrystals due to grain-boundary diffusion and sliding. Acta Mater. 2008, 56, 1741–1752. [Google Scholar] [CrossRef]
- Ertorer, O.; Topping, T.; Li, Y.; Moss, W.; Lavernia, E.J. Enhanced tensile strength and high ductility in cryomilled commercially pure titanium. Scr. Mater. 2009, 60, 586–589. [Google Scholar] [CrossRef]
- Meyers, M.A.; Mishra, A.; Benson, D.J. Mechanical properties of nanocrystalline materials. Prog. Mater. Sci. 2006, 51, 427–556. [Google Scholar] [CrossRef]
- Zhang, P.; Zhang, J.; Li, J.; Liu, G.; Wu, K.; Wang, Y.; Sun, J. Microstructural evolution, mechanical properties and deformation mechanisms of nanocrystalline Cu thin films alloyed with Zr. Acta Mater. 2014, 76, 221–237. [Google Scholar] [CrossRef]
- Qiu, X. Microstructure, hardness and corrosion resistance of Al2CoCrCuFeNiTix high-entropy alloy coatings prepared by rapid solidification. J. Alloys Compd. 2018, 735, 359–364. [Google Scholar] [CrossRef]
- Hardness and Strain Rate Sensitivity of Nanocrystalline Cu—ScienceDirect. Available online: https://www.sciencedirect.com/science/article/pii/S1359646206001242?via%3Dihub (accessed on 30 April 2022).
- Suryanarayana, C. Nanocrystalline materials. Int. Mater. Rev. 1995, 40, 41–64. [Google Scholar] [CrossRef]
- Hanlon, T.; Tabachnikova, E.; Suresh, S. Fatigue behavior of nanocrystalline metals and alloys. Int. J. Fatigue 2005, 27, 1147–1158. [Google Scholar] [CrossRef]
- An, X.; Lin, Q.; Wu, S.; Zhang, Z. Improved Fatigue Strengths of Nanocrystalline Cu and Cu–Al Alloys. Mater. Res. Lett. 2015, 3, 135–141. [Google Scholar] [CrossRef] [Green Version]
- Lu, L.; Pan, Q.; Hattar, K.; Boyce, B.L. Fatigue and fracture of nanostructured metals and alloys. MRS Bull. 2021, 46, 258–264. [Google Scholar] [CrossRef]
- Liu, J.; Zhou, X.; Zheng, X.; Cui, H.; Zhang, J. Tribological behavior of cold-sprayed nanocrystalline and conventional copper coatings. Appl. Surf. Sci. 2012, 258, 7490–7496. [Google Scholar] [CrossRef]
- Zhao, Y.; Xu, J.; Peng, S. Synthesis and evaluation of TaC nanocrystalline coating with excellent wear resistance, corrosion resistance, and biocompatibility. Ceram. Int. 2021, 47, 20032–20044. [Google Scholar] [CrossRef]
- Peng, R.; Fu, L.; Zhou, L. Improved wear resistance by phase transformation of surface nanocrystalline 1090 steel prepared by sandblasting technique. Appl. Surf. Sci. 2016, 388, 406–411. [Google Scholar] [CrossRef]
- Amanov, A.; Cho, I.-S.; Kim, D.-E.; Pyun, Y.-S. Fretting wear and friction reduction of CP titanium and Ti–6Al-4V alloy by ultrasonic nanocrystalline surface modification. Surf. Coat. Technol. 2012, 207, 135–142. [Google Scholar] [CrossRef]
- Li, Y.; Hou, C.; Cao, L.; Liu, C.; Liang, S.; Tang, F.; Song, X.; Nie, Z. Excellent wear resistance of multicomponent nanocrystalline W—Cu based composite. J. Alloys Compd. 2021, 861, 158627. [Google Scholar] [CrossRef]
- Gil Sevillano, J.; Aldazabal, J. Ductilization of nanocrystalline materials for structural applications. Scr. Mater. 2004, 51, 795–800. [Google Scholar] [CrossRef]
- Koch, C.C.; Langdon, T.G.; Lavernia, E.J. Bulk Nanostructured Materials. Met. Mater. Trans. A 2017, 48, 5181–5199. [Google Scholar] [CrossRef] [Green Version]
- Xu, H.; He, L.-L.; Pei, Y.-F.; Jiang, C.-Z.; Li, W.-Q.; Xiao, X.-H. Recent progress of radiation response in nanostructured tungsten for nuclear application. Tungsten 2021, 3, 20–37. [Google Scholar] [CrossRef]
- Li, H.; Wang, P.; Wen, C. Recent Progress on Nanocrystalline Metallic Materials for Biomedical Applications. Nanomaterials 2022, 12, 2111. [Google Scholar] [CrossRef] [PubMed]
- Kushwaha, A.K.; Rahman, H.; Hart, D.; Hughes, B.; Saldana, D.A.; Zollars, C.; Rajak, D.K.; Menezes, P.L. 3—Fundamentals of stereolithography: Techniques, properties, and applications. In Tribology of Additively Manufactured Materials; Kumar, P., Misra, M., Menezes, P.L., Eds.; Elsevier: Amsterdam, The Netherlands, 2022; pp. 87–106. [Google Scholar] [CrossRef]
- Peng, B.L.; Dhar, N.; Liu, H.L.; Tam, K.C. Chemistry and applications of nanocrystalline cellulose and its derivatives: A nanotechnology perspective. Can. J. Chem. Eng. 2011, 89, 1191–1206. [Google Scholar] [CrossRef]
- Eskandari, M.; Najafizadeh, A.; Kermanpur, A.; Karimi, M. Potential application of nanocrystalline 301 austenitic stainless steel in lightweight vehicle structures. Mater. Des. 2009, 30, 3869–3872. [Google Scholar] [CrossRef]
- Li, H.; Yi, R.; Chen, C. Microstructure and mechanical performance of dissimilar material joints of 2024Al and SiO2 glass by ultrasonic assisted soldering with Cu interlayer. J. Mater. Res. Technol. 2022, 18, 3227–3239. [Google Scholar] [CrossRef]
- Li, H.; Li, Y.; Chen, C. Microstructure and formation mechanism of Al2O3/Zn5Al/2024Al joint by ultrasonic assisted soldering process. J. Manuf. Process. 2022, 83, 313–324. [Google Scholar] [CrossRef]
- Zhang, X.; Chen, C. Experimental investigation of joining aluminum alloy sheets by stepped mechanical clinching. J. Mater. Res. Technol. 2022, 19, 566–577. [Google Scholar] [CrossRef]
- Ran, X.; Chen, C.; Zhang, H.; Ouyang, Y. Investigation of the clinching process with rectangle punch. Thin-Walled Struct. 2021, 166, 108034. [Google Scholar] [CrossRef]
- Shi, C.; Li, H.; Chen, C.; Ouyang, Y.; Qin, D. Experimental investigation of the flat clinch–rivet process. Thin-Walled Struct. 2021, 171, 108612. [Google Scholar] [CrossRef]
- Munir, Z.A.; Anselmi-Tamburini, U.; Ohyanagi, M. The effect of electric field and pressure on the synthesis and consolidation of materials: A review of the spark plasma sintering method. J. Mater. Sci. 2006, 41, 763–777. [Google Scholar] [CrossRef]
- Yang, Y.F.; Qian, M. 13—Spark plasma sintering and hot pressing of titanium and titanium alloys. In Titanium Powder Metallurgy; Qian, M., (Sam) Froes, F.H., Eds.; Butterworth-Heinemann: Boston, MA, USA, 2015; pp. 219–235. [Google Scholar] [CrossRef]
- Roy, D.; Chakraborty, S.; Gupta, A.; BasuMallick, A.; Scattergood, R.; Koch, C.C. Synergistic effect of Nb and Zr additions on the structure-property relationships of nanocrystalline Cu processed by mechanical alloying and hot pressing. J. Alloys Compd. 2020, 854, 157174. [Google Scholar] [CrossRef]
- AlMangour, B.; Grzesiak, D.; Yang, J.-M. Nanocrystalline TiC-reinforced H13 steel matrix nanocomposites fabricated by selective laser melting. Mater. Des. 2016, 96, 150–161. [Google Scholar] [CrossRef]
- Kushwaha, A.K.; Rahman, H.; Slater, E.; Patel, R.; Evangelista, C.; Austin, E.; Tompkins, E.; McCarroll, A.; Rajak, D.K.; Menezes, P.L. 1—Powder bed fusion–based additive manufacturing: SLS, SLM, SHS, and DMLS. In Tribology of Additively Manufactured Materials; Kumar, P., Misra, M., Menezes, P.L., Eds.; Elsevier: Amsterdam, The Netherlands, 2022; pp. 1–37. [Google Scholar] [CrossRef]
- Malow, T.; Koch, C.C. Thermal Stability of Nanocrystalline Materials. Mater. Sci. Forum 1996, 225–227, 595–604. [Google Scholar] [CrossRef]
- Hohl, J.; Kumar, P.; Misra, M.; Menezes, P.; Mushongera, L.T. Thermodynamic stabilization of nanocrystalline aluminum. J. Mater. Sci. 2021, 56, 14611–14623. [Google Scholar] [CrossRef]
- Kazemi, A.; Yang, S. Effects of magnesium dopants on grain boundary migration in aluminum-magnesium alloys. Comput. Mater. Sci. 2020, 188, 110130. [Google Scholar] [CrossRef]
- Xu, W.; Zhang, B.; Du, K.; Li, X.; Lu, K. Thermally stable nanostructured Al-Mg alloy with relaxed grain boundaries. Acta Mater. 2022, 226, 117640. [Google Scholar] [CrossRef]
- Mote, V.; Purushotham, Y.; Dole, B. Williamson-Hall analysis in estimation of lattice strain in nanometer-sized ZnO particles. J. Theor. Appl. Phys. 2012, 6, 6. [Google Scholar] [CrossRef] [Green Version]
- Kumar, N.; Biswas, K. Cryomilling: An environment friendly approach of preparation large quantity ultra refined pure aluminium nanoparticles. J. Mater. Res. Technol. 2019, 8, 63–74. [Google Scholar] [CrossRef]
- Travessa, D.N.; Silva, M.J.; Cardoso, K.R. Niobium Carbide-Reinforced Al Matrix Composites Produced by High-Energy Ball Milling. Met. Mater. Trans. B 2017, 48, 1754–1762. [Google Scholar] [CrossRef]
- Kumar, N.; Tiwary, C.S.; Biswas, K. Preparation of nanocrystalline high-entropy alloys via cryomilling of cast ingots. J. Mater. Sci. 2018, 53, 13411–13423. [Google Scholar] [CrossRef]
- Guan, D.; Gao, J.; Rainforth, W.M. Effect of cryomilling time on microstructure evolution and hardness of cryomilled AZ31 powders. Mater. Charact. 2021, 178, 111311. [Google Scholar] [CrossRef]
- Kushwaha, A.K.; Misra, M.; Menezes, P.L. Manufacturing Bulk Nanocrystalline Al-3Mg Components Using Cryomilling and Spark Plasma Sintering. Nanomaterials 2022, 12, 3618. [Google Scholar] [CrossRef] [PubMed]
- Kushwaha, A.K.; Maccione, R.; John, M.; Lanka, S.; Misra, M.; Menezes, P.L. Influence of Cryomilling on Crystallite Size of Aluminum Powder and Spark Plasma Sintered Component. Nanomaterials 2022, 12, 551. [Google Scholar] [CrossRef] [PubMed]
- Ye, W.; Hohl, J.; Misra, M.; Liao, Y.; Mushongera, L.T. Grain boundary relaxation in doped nano-grained aluminum. Mater. Today Commun. 2021, 29, 102808. [Google Scholar] [CrossRef]
Figure 1.
SEM shows the particle morphology of as-received (a) Mg powders and (b) Al powders.

Figure 2.
Schematic diagram of the experimental method showing the blending of powders and the cryomilling process.
Figure 2.
Schematic diagram of the experimental method showing the blending of powders and the cryomilling process.

Figure 3.
SEM of pure Al powders showing the (a) particle morphology, (b) particle agglomeration to form larger particles, (c) sheared fragments, and (d) surface texture after 8 h of cryomilling.
Figure 3.
SEM of pure Al powders showing the (a) particle morphology, (b) particle agglomeration to form larger particles, (c) sheared fragments, and (d) surface texture after 8 h of cryomilling.

Figure 4.
SEM image showing the (a) particle morphology and (b) surface features for 8 h cryomilled Al-5 wt.% Mg powders in comparison with (c) surface features for 2 h cryomilled Al-5 wt.% Mg powders.
Figure 4.
SEM image showing the (a) particle morphology and (b) surface features for 8 h cryomilled Al-5 wt.% Mg powders in comparison with (c) surface features for 2 h cryomilled Al-5 wt.% Mg powders.

Figure 5.
(a) SEM-EDX plot and (b) the EDX elemental area mapping for 8 h cryomilled Al-5% Mg powders.
Figure 5.
(a) SEM-EDX plot and (b) the EDX elemental area mapping for 8 h cryomilled Al-5% Mg powders.

Figure 6.
TEM-EDX elemental mapping of the 8 h cryomilled Al-5 wt.% Mg samples showing the segregation of Mg at the grain boundary.
Figure 6.
TEM-EDX elemental mapping of the 8 h cryomilled Al-5 wt.% Mg samples showing the segregation of Mg at the grain boundary.

Figure 7.
XRD results showing the effect of increasing cryomilling duration on (a) XRD plots and (b) peak broadening of Al-5Mg powders. The plots show the changes in (c) crystallite sizes and (d) strains with the increasing cryomilling duration for Al and Al-5Mg powders.
Figure 7.
XRD results showing the effect of increasing cryomilling duration on (a) XRD plots and (b) peak broadening of Al-5Mg powders. The plots show the changes in (c) crystallite sizes and (d) strains with the increasing cryomilling duration for Al and Al-5Mg powders.

Figure 8.
TEM results showing bright-field images and the corresponding SADP (inset image) for (a) unmilled (b) 8 h cryomilled pure Al samples.
Figure 8.
TEM results showing bright-field images and the corresponding SADP (inset image) for (a) unmilled (b) 8 h cryomilled pure Al samples.

Figure 9.
TEM results showing bright-field images and the corresponding SADP (inset image) for (a) 2 h, (b) 4 h, (c) 6 h, and (d) 8 h cryomilled Al-5 wt.% Mg samples.
Figure 9.
TEM results showing bright-field images and the corresponding SADP (inset image) for (a) 2 h, (b) 4 h, (c) 6 h, and (d) 8 h cryomilled Al-5 wt.% Mg samples.

Figure 10.
TEM results showing dark-field images for the (a) (111) plane, (b) (200) plane, and (c) (220) plane spots for 8 h cryomilled pure Al powders, and (d) (111) plane, (e) (200) plane, and (f) (220) plane spot for 8 h cryomilled Al-5 wt.% Mg powders obtained from the SADP.
Figure 10.
TEM results showing dark-field images for the (a) (111) plane, (b) (200) plane, and (c) (220) plane spots for 8 h cryomilled pure Al powders, and (d) (111) plane, (e) (200) plane, and (f) (220) plane spot for 8 h cryomilled Al-5 wt.% Mg powders obtained from the SADP.

Figure 11.
XRD results for 8 h cryomilled pure Al and AL-5% Mg annealed powders showing (a) the variation in XRD plots, (b) the shrinkage of the (111) peaks, and (c) the increase in crystallite size with increasing annealing temperature.
Figure 11.
XRD results for 8 h cryomilled pure Al and AL-5% Mg annealed powders showing (a) the variation in XRD plots, (b) the shrinkage of the (111) peaks, and (c) the increase in crystallite size with increasing annealing temperature.


Table 1.
Comparison of EDX elemental analysis of the Al-5 wt.% Mg powders using SEM and TEM for different cryomilling durations.
Table 1.
Comparison of EDX elemental analysis of the Al-5 wt.% Mg powders using SEM and TEM for different cryomilling durations.
| Cryomilling Time | Characterization Mode | Element | Weight % | Error % |
|---|---|---|---|---|
| 2 h | SEM-EDX | Al | 93.84 | ±2.06 |
| Mg | 6.16 | ±1.98 | ||
| TEM-EDX | Al | 84.34 | ±0.62 | |
| Mg | 9.14 | ±0.37 | ||
| 4 h | SEM-EDX | Al | 95.60 | ±1.78 |
| Mg | 4.40 | ±2.04 | ||
| TEM-EDX | Al | 93.22 | ±0.04 | |
| Mg | 4.55 | ±0.20 | ||
| 6 h | SEM-EDX | Al | 95.28 | ±1.83 |
| Mg | 4.72 | ±2.03 | ||
| TEM-EDX | Al | 92.51 | ±0.20 | |
| Mg | 5.39 | ±0.05 | ||
| 8 h | SEM-EDX | Al | 93.93 | ±2.05 |
| Mg | 6.07 | ±1.99 | ||
| TEM-EDX | Al | 92.27 | ±0.19 | |
| Mg | 5.17 | ±0.03 |
Table 2.
Comparison of determined crystallite size for pure Al and Al-5 wt.% Mg powders using XRD and TEM.
Table 2.
Comparison of determined crystallite size for pure Al and Al-5 wt.% Mg powders using XRD and TEM.
| Sample | Cryomilling Time (hours) | LXRD (nm) * | LTEM (nm) * |
|---|---|---|---|
| Pure Al | Unmilled | 249 | 67 |
| 2 h | 201 | 27 | |
| 4 h | 165 | 26 | |
| 6 h | 129 | 23 | |
| 8 h | 96 | 19 | |
| Al-5 wt.% Mg | 2 h | 76 | 18 |
| 4 h | 54 | 16 | |
| 6 h | 44 | 16 | |
| 8 h | 32 | 14 |
* LXRD and LTEM are the determined crystallite sizes using XRD and TEM.
Disclaimer/Publisher’s Note: The statements, opinions and data contained in all publications are solely those of the individual author(s) and contributor(s) and not of MDPI and/or the editor(s). MDPI and/or the editor(s) disclaim responsibility for any injury to people or property resulting from any ideas, methods, instructions or products referred to in the content. |
© 2023 by the authors. Licensee MDPI, Basel, Switzerland. This article is an open access article distributed under the terms and conditions of the Creative Commons Attribution (CC BY) license (https://creativecommons.org/licenses/by/4.0/).
Share and Cite
MDPI and ACS Style
Kushwaha, A.K.; Misra, M.; Menezes, P.L. Effect of Magnesium Dopant on the Grain Boundary Stability of Nanocrystalline Aluminum Powders during Cryomilling. Crystals 2023, 13, 541. https://doi.org/10.3390/cryst13030541
AMA Style
Kushwaha AK, Misra M, Menezes PL. Effect of Magnesium Dopant on the Grain Boundary Stability of Nanocrystalline Aluminum Powders during Cryomilling. Crystals. 2023; 13(3):541. https://doi.org/10.3390/cryst13030541
Chicago/Turabian StyleKushwaha, Amanendra K., Manoranjan Misra, and Pradeep L. Menezes. 2023. "Effect of Magnesium Dopant on the Grain Boundary Stability of Nanocrystalline Aluminum Powders during Cryomilling" Crystals 13, no. 3: 541. https://doi.org/10.3390/cryst13030541
Note that from the first issue of 2016, this journal uses article numbers instead of page numbers. See further details here.