1. Introduction
Silicon carbide (SiC) has higher thermal resistance and mechanical strength compared to existing semiconductor materials, such as silicon (Si) and gallium arsenide (GaAs), as well as high-temperature, high-frequency, and dielectric properties and environmental resistance [
1,
2]. In addition, valence control of electrons and holes can be easily accomplished by introducing impurities. In addition, SiC has a wide band range (e.g., a 6N-SiC single crystal has a band range of about 3.0 eV and a 4H-SiC single crystal of about 3.26 eV). Due to these results, SiC has attracted attention as a semiconductor material for the next generation of power devices [
3]. The most common method used to study the structural perfection of single crystals, including the study of stacking faults (SFs), is X-ray diffraction analysis [
4,
5]. X-ray diffraction analysis determines the structure and composition of a sample and the distribution of defects by area. Unlike electrons, X-ray quanta have a much greater depth of penetration into crystals, which makes it possible to obtain information on the density of defects in the crystal volume. X-ray methods allow the detection of individual dislocations, the mosaic structure of blocks, stacking faults [
6,
7], and mechanical stresses at the interfaces of two media (for example, dielectric–semiconductor) [
8].
X-ray diffraction analysis is used to study metals [
9], alloys, minerals, inorganic and organic compounds, polymers, amorphous materials, liquids and gases, molecules of proteins, nucleic acids, etc. [
10]. X-ray diffraction analysis is the main method used to determine crystal structure [
11,
12]. It gives the most information when we study crystals. This is caused by the fact that crystals have strict periodicity in their structure and represent a diffraction lattice created by nature for X-rays. However, X-ray diffraction analysis also provides valuable information when we study bodies with less ordered structures, such as liquids, amorphous bodies, liquid crystals, polymers, and others. The corresponding problem can be solved based on the numerous atomic structures that have already been deciphered: the X-ray diffraction patterns of polycrystalline substances [
13]—for example, alloyed steel, alloys, ores, or lunar soil—make it possible to determine the crystalline compositions of these substances; i.e., to undertake phase analysis.
To solve such problems, it is undoubtedly necessary to consider the elements of the kinematic theory of X-ray diffraction of crystals, including inelastic and elastic scattering [
14,
15], electron scattering [
16], atom scattering, unit cell scattering, regular attenuation of reflexes, and the intensity of reflections from polycrystalline samples. At the same time, it should be noted that the information about the structure is related to the analysis of the intensities of reflexes, since their locations are determined only according to the sizes of the unit cell, whereas the intensities depend on the locations of atoms and the diffraction angle [
17].
X-ray diffraction analysis is the most important method used to study stacking faults. Diffraction research methods provide the most complete data on the density (probability) of stacking faults. The basics of such methods are presented in detail in the work by Warren [
18]. In later work by researchers, methods for modeling diffractograms of crystals with stacking faults were developed. In this work, the experimental profile of the lines is considered and presented as an instrumental broadening convolution. This is a broadening because of the micro-distortions of the packaging and lattice defects and the dispersity in the crystallites. Consideration of the reference (the diffractogram of the annealed powders) makes it possible to determine the profile of such complete physical broadening. The work by Warren [
18] shows how the influences of the dispersity in crystallites, the lattice micro-distortions, and the concentration (probability) of stacking faults on the broadening of the lines are distributed. This was carried out based on the differing dependency of the width on the angle 2θ and the hkl indices. Disordered stacking faults in HCP crystals lead to selective (depending on the hkl indices) additional broadening of the lines. Warren’s work demonstrates that the peculiarities of X-ray diffraction in relation to stacking faults, which allow the determination of their concentration, can be considered within the framework of complex theories, even for the simplest FCC and BCC structures [
19].
The methods developed by Warren have been applied in a relatively small number of studies. For example, the authors of [
20] developed and used a geometric method for the analysis of the pattern of X-ray diffraction for crystals with an arbitrary atomic lattice containing stacking faults and thin plates of microtwins. The technique presented by the authors takes into account the effect of changing the interplane distance along the line of the intersection for planes with a stacking fault or microtwin. This approach significantly simplifies the analysis of diffraction effects and their summation during the transition to polycrystalline objects. The sizes of microtwins and genuine blocks of martensitic crystals of Fe–Ni alloys containing from 10 to 33% Ni were studied. The paper demonstrates that the considered theory can be used for analyzing experimental diffraction patterns, as well as for the further development of methods for diffraction studies of the structures of metals and alloys. The authors of [
21] observed the phase transition of BCC → FCC (ferrite → austenite) for the high-nitrogen NC system Fe–Cr–Mn–N. Using the provisions laid out in [
18], the authors tracked the accumulation of deformation defects in the stacking.
In [
22], the profiles of diffraction lines for a single-crystal Zr and a Zr-2.5Nb tube were measured and analyzed. The measurements were carried out before and after irradiation in a nuclear reactor. The irradiation caused damage in the form of prismatic dislocation loops. In all cases, the Fourier analysis of the deconvolutive peak using the Warren and Averbach method showed that the value of the distortion component (microdeformation) did not agree with the dislocation density measured by transmission electron microscopy. The discrepancy may have been related to a decrease in the deformation energy from the dipoles on opposite sides of the prismatic dislocation loops and the alignment of the loops, which would have reduced the average deformation in the same way as polygonization or the formation of subgrain boundaries.
Two austenitic stainless steels (SSs) have been designed in such a way as to demonstrate the maximum possible difference in the stacking fault energy (SFE) while meeting technical requirements.
Neutron diffraction and the electron backscattering diffraction analysis using scanning electron microscopy were used for the quantitative measurement of the stacking fault width and deformation twinning in [
23]. The measurements were carried out during the deformation at room temperature. The conducted research obtained new data on the sizes of stacking faults and the twinning process for austenitic stainless steels.
The current techniques for solving the problem of X-ray diffraction with crystals with a face-centered lattice do not make it possible to solve the problem for such crystals containing different types of stacking faults. However, some problems can be solved using modern technology. Such problems include the difficulty in determining the nature and structure of stacking faults in single crystals. It is also difficult to determine the peculiarities of the intensity contrast from the plane of stacking faults and the partial and stair-rod dislocations that limit these stacking faults. Modern methods make it possible to calculate the diffraction effects of the axis of the thin plates of twin, new phases, as well as other variations in defective structures. It these modern methods could be improved, a number of complex, urgent tasks related to the calculation of X-ray diffraction for crystals with a face-centered lattice containing stacking faults of various types could be solved.
In this regard, it is extremely important to create a new technique that would make it possible to calculate the diffraction effects of the axis of the thin plates of twin, new phases, as well as other variations in defective structures. This would make it possible to determine the nature and structure of stacking faults in silicon carbide single crystals, the peculiarities of the intensity contrast from the SD plane, and the partial and vertex dislocations limiting the SD.
The previously proposed methods [
13,
24] do not make it possible to do this.
Most of the methods used for this purpose are based on [
12,
13,
24], which assume that observed diffraction patterns are caused by random stacking faults in a crystal. In reality, however, the condition of randomness for stacking faults may be violated. Thus, the formation of various martensitic [
25] and polytypic [
26] structures and Laves phases [
27] is directly associated with the ordered stacking faults.
The purpose of this study was to develop a technique that would make it possible to calculate the diffraction effects of the axis of the thin plates of twin, new phases, as well as other variations in defective structures.
2. Materials and Methods
In the first stage, a diffraction pattern was calculated to obtain data on the concentrations of stacking faults and the nature of their locations. This pattern took into account the mutual arrangement of defects.
To enter the correlation parameters for the arrangement of the stacking faults, the intensity of diffracted rays was determined through the coordinates of the defects. Next, the diffraction pattern was calculated in the case of a correlation between the nearest stacking faults. A basic diffraction equation was obtained to determine the correlations in the arrangement of any given number of stacking faults. The method was implemented for crystals with an initial face-centered cubic (FCC) structure.
The proposed method was based on the introduction of correlations to the arrangement of close-packed layers while operating with 32 order matrices.
In the second stage, a practical calculation was performed according to the developed method based on physically real models of the defective structure. The number of correlation parameters was reduced in the calculation.
The description of the defective structure according to the above procedure required the correlation of three single-layer stacking faults. For the said transition, a mechanism of ordered double exchange in crystals was proposed, the elementary act of which was equivalent to the formation of a three-layer stacking fault. In this case, the correlation was introduced in the arrangement of the three-layer stacking faults with their preferred arrangement in three layers. With this choice of the elementary stacking fault, the correlation distance decreased from 3 to 1. The intensity of diffracted beams was expressed as a function of the coordinates of the non-single-layer stacking faults; specifically, of certain groups selected as elementary shear stacking faults. Instead of the general numbering of single-layer stacking faults, the numbering of elementary groups was introduced, and for each group, its own numbering of single-layer stacking faults was employed.
The following was obtained using the calculation for a twin FCC crystal (silicon carbide): when the initial FCC crystal contained sections with both normal and twin orientations, another acute maximum appeared in the position corresponding to the twin FCC structure at ξ = 120°. For the twin silicon carbide (SiC) FCC crystal, which underwent a partial transition to the 6H structure, two sharp peaks were found at the positions of the normal and twin FCC structures and expanded maxima at the position of the 6H phase.
These mechanisms should obviously be such that the Bragg law can always be applied through their adjustment to a particular case of diffraction in crystals. Further, the general laws were used for gases and liquids, solid amorphous bodies, and crystals with an imperfect structure.
This objective was addressed based on modern methods of X-ray diffraction analysis through the use of differential equations (transformations and Fourier transforms), construction of the Ewald sphere, mathematical analysis, mathematical logic, and mathematical modeling (complex Markov chain).
3. Results and Discussion
Due to the regular, correct arrangement of atoms, the diffraction phenomenon in crystals is especially clearly expressed [
28] and controlled by simple laws, creating numerous possibilities for its practical use.
Let us consider the communities of randomly arranged atoms in the X-ray beam. These atoms emit waves through scattering, and these waves, interfering with each other, generate the diffracted radiation [
29], the intensity of which usually changes along with the change in the observation direction. These changes are related to the atomic structure of a substance, and the goal was to establish the laws of this dependency. These laws should obviously be such that the Bragg law can always be applied through their adjustment to particular cases of diffraction in crystals [
30]. Further, the general laws were used for gases and liquids, solid amorphous bodies, and crystals with an imperfect structure.
A body consisting of N atoms, the positions of which are fixed by vectors x1, x2, … xn laid from some arbitrary beginning, was used. f1, f2, … fn are the scattering factors corresponding to different N atoms. The amplitude of the wave scattered by the n atom is fn times the amplitude of the wave scattered by the isolated electron, which we took to be 1. It was assumed that the object was small enough and that the absorption in it could be neglected; i.e., radiation of the same amplitude falls on each atom.
S0 and
S are unit vectors parallel to the incident beam and the direction of observation, respectively. The amplitude of the wave resulting from the addition of
N elementary waves is:
The initial phase is the elementary wave phase, which would be scattered by an electron placed at the origin of the object space.
3.1. Ewald Structure
The general theory of diffraction can be strongly simplified by introducing the idea of the opposite space. In the particular case of a crystal, this is the space of the reverse lattice [
31]. The reverse space point is associated with each detected diffraction act as follows. It is the end of the vector
s resulting from the beginning such that:
.
Vector
s is directed along the bisector of the angle formed by vectors
S and
S0, and its absolute value is as follows:
where 2
θ is the angle between vectors
S and
S0.
If each single diffraction act corresponds to a point of reverse space, then those diffraction acts at this point in this space—i.e., vector s—correspond to it, and the bisector of the angle between S and S0 has the direction s, and this diffraction angle is associated with the wavelength in Equation (2).
Equation (1) can be rewritten as follows:
The result of a single diffraction act is thus a function of the single vector s. The diffraction phenomenon can be clearly defined for all kinds of experimental conditions involving the functions A(s) using the function of a point in reverse space. Equation (3) allows this to be calculated for any substance for which the atomic structure is known.
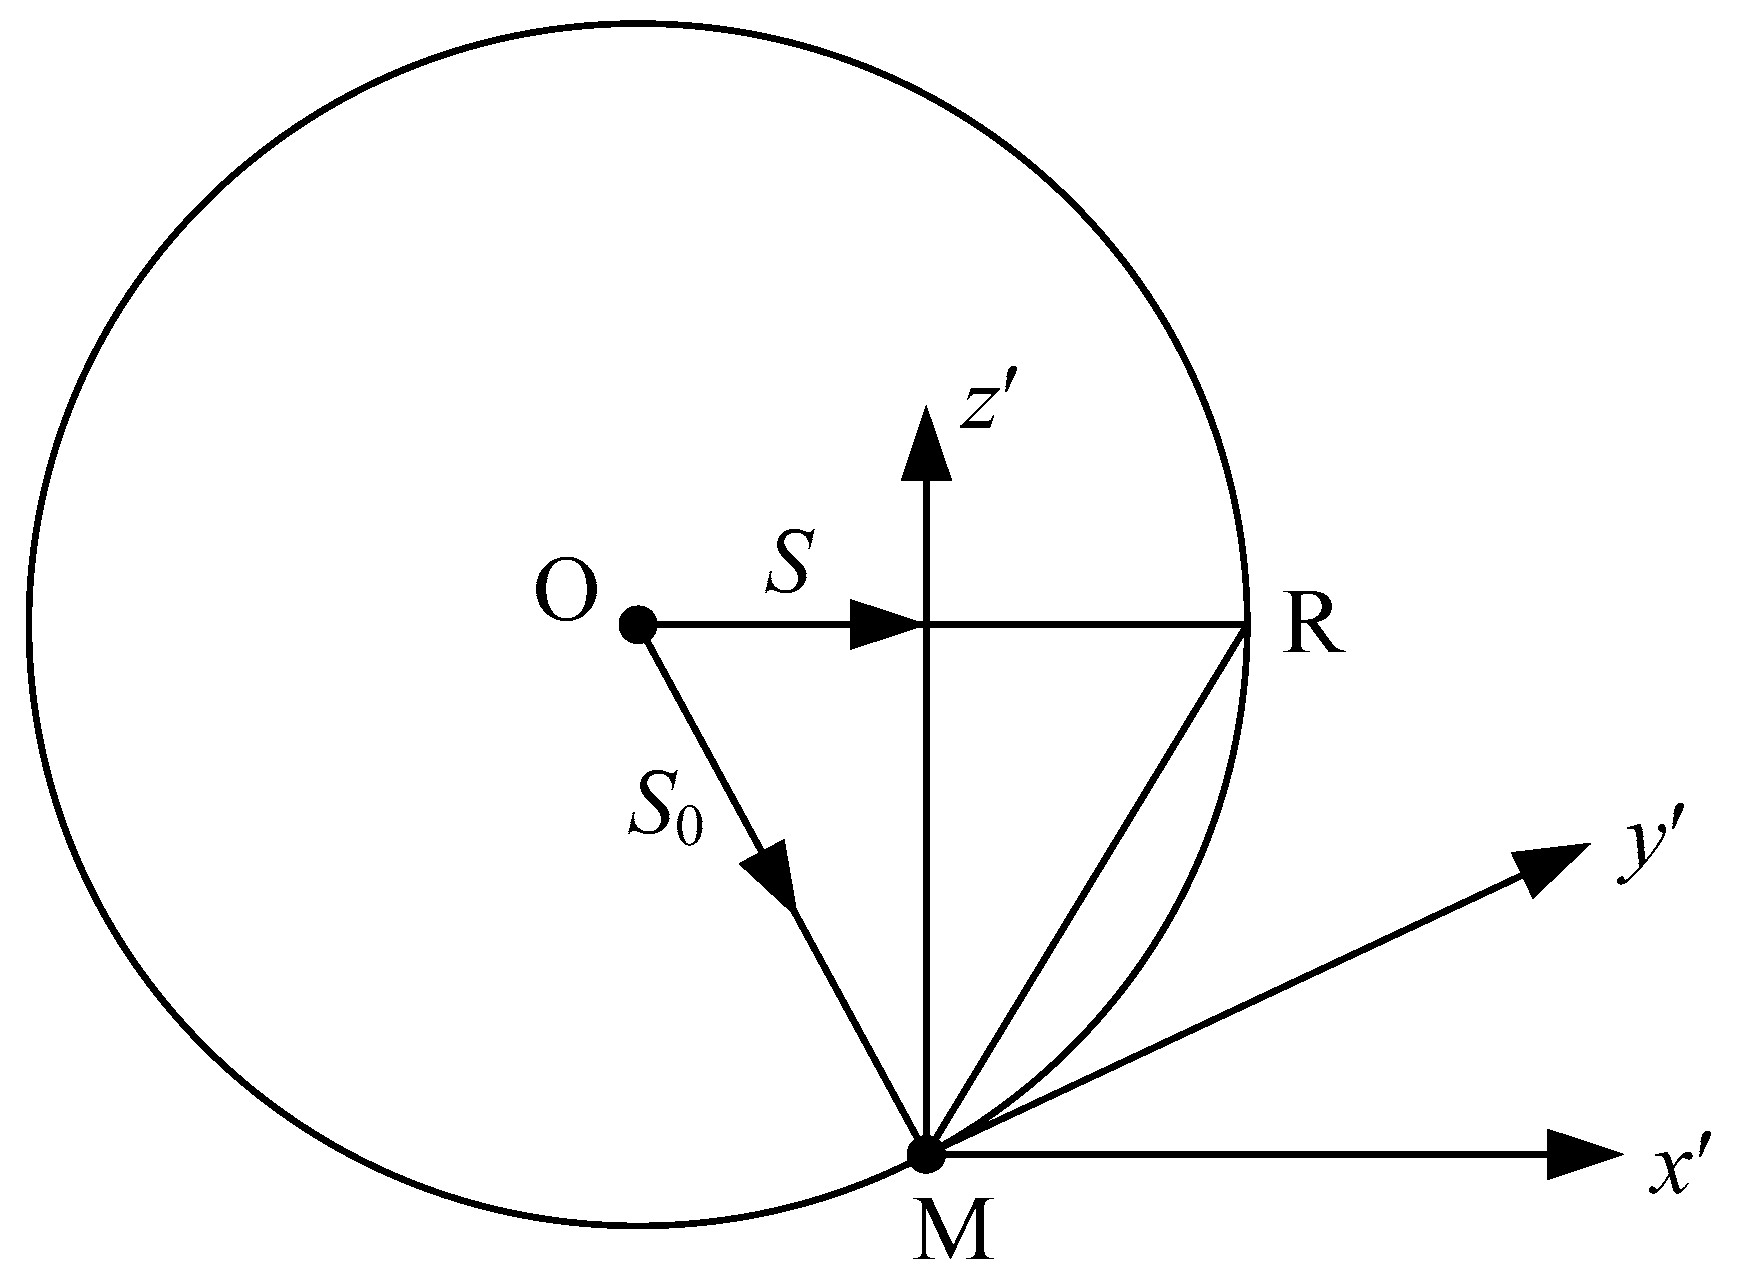
If a beam parallel to the direction vector
S0 with a wavelength of
λ falls on this stationary body, then a diffraction pattern can be obtained using the Ewald construction [
32] (
Figure 1). Then, we need to cross out in reverse space the Ewald sphere of radius
centered at point O so that
. Point
M is the origin of the inverse space.
The observation direction S corresponds to the point R in the Ewald sphere such that . The amplitude of the diffracted radiation is determined from the value of the function A(s) at point R, where s is the vector MR.
To observe the diffraction in different directions of space is to record the changes A(s) on the surface of the Ewald sphere. It is this Ewald construction that is applied to crystals using the reverse lattice of the crystal.
It is possible to generalize the definition of an object without considering each atom individually. We can introduce in object space the point function—
p(
x) function—which is the electron density at the end of the vector
x. This is the number of electrons contained in a small elementary volume surrounding the end of the vector
x, which is divided by this small volume (reduced to the unit volume). The total amplitude of diffraction
A(
s) can be found using Equation (1) by adding the waves scattered by all electrons of the object:
where the integral is taken over the entire space of the object.
Equation (4) is equivalent to Equation (3) if the centers of individual atoms
x1,
x2, …
xn are introduced into it. Since atoms are considered impermeable, each point where
ρ(
x) is not zero is in the electronic cloud of one of the
N atoms. The value
ρ(
x) is the sum of the functions
ρn(
x −
xn) expressing the density at the points of the electron cloud of the
nth atom, the center of which is
xn,
The integral in Equation (4) can be represented with the following sum:
The integral equals fn, thus resulting in Equation (3).
Instead of this classical definition of electron density, it would be more correct to consider ρ(x) as the sum of the squares of the modules of the wave functions of all electrons in the object.
Equation (4) can be easily interpreted in the language of mathematical theory (Fourier transformations). This theory has now become an indispensable working tool in both theoretical and practical studies of X-ray diffraction [
33].
Equation (4) has the following verbal expression: function
A(
s) is the Fourier transform of function
ρ(
x). The main property of the Fourier transform is that
ρ(
x) is derived from
A(
s) using an equation analogous to Equation (4):
where only the exponent index changes the sign. The integral in Equation (5) is taken over the entire inverse space, and in Equation (4) it is taken over the entire space of the object.
If the object is a crystal, then ρ(x) is a triple periodic function (more precisely, periodic for each of the three dimensions of space). The transform of the periodic function is zero at all points in the inverse space, except for the inverse lattice nodes, where it takes the value of the structural amplitude associated with that node. The whole kinematic theory of X-ray diffraction in crystals is derived from here.
It is critical to know the diffraction amplitudes to properly interpret the experiment. There are no methods that can be used to determine the relative phases of waves diffracted in different directions in space; it is only possible to measure their intensity. Therefore, the only element of Equations (3) and (4) that is of experimental interest is the module of this complex number, the square of which will be the intensity value.
3.2. Scattering Capacity of the Object under Study (Electron Scattering Intensity)
In all theoretical calculations and their practical applications, it is convenient to use the concept of the scattering ability of the studied object [
34]. It was possible to assume that the object was small enough, so absorption was not significant here. Let us replace the object with one free electron while maintaining the previous experimental conditions; then, the scattering power of the object defined as
IN(
s) is the ratio between the emission intensities scattered by the object and the number of free electrons. According to another definition, this is the effective number of free electrons that, scattering independently of each other, produce the same effect under test conditions as the object. The scattering ability refers to an atom if an object consists of
N atoms and, more generally, to an elementary motif (grouping) if the object consists of
N identical motifs (groupings, such as molecules or crystal cells). This single (per unit) scattering capacity is denoted as
I(
s):
If
F(
s) is the structural factor of the motif (the scattering factor of an atom or the structural factor of a molecule or cell), then the following function can be introduced:
The function J(s) can be called the interference function, since it would be equal to 1 for any vector s if the particles scattered incoherent waves; any other meaning for it is determined by the interference of the scattered waves.
After the theoretical calculations, the expression
I(
s) was obtained as a function of
s for various diffraction cases. It is possible to determine the scattering intensity by first determining the value of the corresponding vector
s and then multiplying the unit of scattering power by the number of motifs (the effective number; i.e., the real number multiplied by the absorption coefficient) and by the electron scattering intensity under test conditions; the latter is characterized by Thomson formulas [
35].
If the structure of an object is known or assumed, then it is always possible to calculate
A(
s) using Equation (4), from which:
It is not possible to directly move from this equation to Equation (5), since the latter includes not only amplitudes but also wave phases that cannot be observed. This is the main source of difficulties in determining crystal structures, but these difficulties increase significantly when we study disordered structures. If it were possible to find a function expressing both amplitude and phase at any point in the reverse space, then X-rays would represent a real microscope with a very high resolution, which would allow the reproduction of genuine images of objects’ structures; however, the diffraction pattern is not sufficient to lead to this result. In the most general case, and without any help from the outside, the diffraction patterns make it possible to determine the structure of an object.
3.3. Diffraction Pattern and the Nature of the Location of Stacking Faults
In order to obtain reliable information from experiments on the concentration of stacking faults and the nature of their location, it is necessary to theoretically calculate the diffraction pattern, taking into account the faults’ mutual reduction and alignment. To solve this problem, a method based on the introduction of correlations for the positions of close-packed layers must be used, and it is necessary to operate with matrices of the order 2s−1 (s is the correlation range required to describe the defective structure). However, in many cases, the correlation range can be lowered by moving from correlations at the locations of the close-packed layers to correlations at the locations of the stacking faults themselves. For example, sections of the 18R phase with Zhdanov symbols in the 3C phase can be represented either as interlayers with the application of close-packed layers according to the ABCABABCABCBCABCAC law inside the main ABC sequences or as portions of the original structure with single-layer (subtraction-type) stacking faults in each sixth layer. The description of the transition 3C→18R first requires consideration of the correlations in the arrangement of at least six layers (s = 6), while a description using the second method only requires consideration of the correlations in the arrangement of the nearest stacking faults, assuming that the faults are predominantly formed five layers apart.
3.4. Basic Diffraction Equation
To enter the correlation parameters for the arrangement of stacking faults, it was necessary to express the intensity of the diffracted beams passing through the coordinates of the defects. A diffraction pattern has previously been calculated for the case of correlations between the nearest stacking faults. The basic diffraction equation for correlations in the arrangement of any given number of stacking faults was obtained. The method was developed for crystals with the original face-centered cubic (FCC) structure [
36].
The expression for the intensity of the rays diffracted from a large single crystal through stacking fault coordinates was first obtained by Landau L.D. [
37] and has the form:
where
C is the interference function for the two-dimensional crystal,
mk is the number of the layer in which the
k stacking fault is located,
ξ = 2πh3/3,
h3 is the variable along the reverse lattice axis coinciding with the direction of node diffusion,
φ0 = 2π(
H − K)
/3, and
H and
K are the reflex indices on hexagonal axes.
A new summation variable
p = k − k’ can be used. At constant
p, the difference between the coordinates determined as
mk–
mk+pmay take different values. By averaging over
k and considering that the crystal, although large, has a finite size
L and, therefore,
N stacking faults, we obtain:
where
f = N/L is the fraction of defective layers;
Ppt is the probability that, between the first and (
p + 1) single-layer stacking faults in an arbitrary sequence (
p + 1) of single-layer stacking faults, there is a distance of
t layers;
C’ =
Csin
2φo/sin
21/2 (
ξ +
φo); cs is the complex conjugate; and 〈…〉 is the averaging sign.
3.5. Application of Correlations in Arrangements of Single-Layer Stacking Faults
Calculation of
Ppt requires considering the correlations between the locations of single-layer stacking faults. The presence of a correlation between single-layer defects means that the probability of single-layer defects occurring in a given layer depends on the relative position of the defect considered from among the previous single-layer defects. Therefore, we can introduce the probability
that a single-layer stacking fault will appear in a given plane, provided that the first adjacent defect is at a distance of
i1 layers, the second is at a distance
is from the first, and so on, until, finally, the
s neighbor is at a distance
is from the
x − 1 neighbor. The considered events turn out to be connected in a complex Markov chain. It can be reduced to a simple chain if the probability
is presented as the probability of transition from the configuration of single-layer stacking faults described by indices (
isi
s−1…
i2) to the configuration (
is−1iε−2…
i2i1):
where
i = (
is−1is−2…
i1),
j = (
js−1 js−2…
j1), and (
s−1) indicates member configurations.
Obviously, Pij ≠ 0 only for is−2 = is−1, is-3 = is-2, …i1 = i2.
The desired probability
Ppt is expressed through the introduced transient probabilities as follows:
under the condition that (
k1 +
l1 + … +
n1 +
j1 =
t), where
fi is the relative fraction of the
i configuration, and
k1,
l1, …
n1,
j1 is the distance between the last two single-layer stacking faults in the corresponding (
s−1) membered configurations.
Considering that the summation in Equation (10) for
t is equivalent to removing the condition given in Equation (9), we obtain:
Here, the matrices F and Q are introduced, for which the following condition applies: (F)ij = fj; (Q)ij = Pij exp [i(ξ − φ0)j1]. The matrix F consists of similar rows. In the case of correlation with one single-layer stacking fault, the matrix Q has the same form, since the probability that the two nearest and adjacent single-layer stacking faults are located at a distance j will not depend on the distance i from the first neighbor to the next single-layer stacking fault Pij = Pj. In general, a correction in s single-layer stacking faults may limit the number of preferred (or ordered) configurations of three or more single-layer stacking faults and, therefore, limit the number of rows in the Q matrix other than those for all other configurations.
Using the known trace property of matrices
, it is easy to get rid of all similar rows in matrices
P and
Q except for one row. Thus, the trace of the matrix will not change if one of the equal rows (let it be the
nth row) is subtracted from all other rows. Then, the corresponding columns can be applied to the column with the number
n. As a result, we get:
where
F1 is the matrix with only one row other than zero and
Q1 is the matrix with
R + 1 rows other than zero (
R is the number of ordered configurations of three or more single-layer stacking faults). The trace of the matrix does not change even when rearranging rows and then rearranging the corresponding columns. Therefore, it is possible to place all the zero rows of matrices
F1 and
Q1 as the top rows. When multiplying such matrices, only the first
R + 1 elements of the rows are important. Therefore, matrices
F1 and
Q1 can be considered square matrices of the order
R + 1. In the future, any matrix after the specified transformations will be denoted by a letter with index (1).
Let us determine the sum
using the following expression:
where
μm is the coefficient of decomposition of a characteristic polynomial |
Eλ − Q1|.
Considering Equations (7) and (13), the desired expression for the intensity of diffracted rays can be written as follows:
The expression for the elements of the matrix F using the entered transient probabilities can be obtained from the obvious matrix equality FP = F or F1P1 = F1.
3.6. Analysis of Diffraction Effects during Transitions
The total fraction of defective layers
f is determined with the formula
f = 1
/, where
is the average distance between adjacent single-layer stacking faults:
where (
T)
ij =
j1δ
ij, (
PT)
ij =
Pijj1.
Thus, all unknown values in Equation (8) are expressed using the entered transition probabilities, thereby solving the problem in general. By specifying different models for the defective structure—i.e., the matrix Q1—it is possible to determine their theoretical distributions for the intensity of ray reflection in reverse space.
Thus, in the case of correlation for one single-layer stacking fault, the matrix
Q, as mentioned above, consists of the same rows. After describing the transformations, we can see that the matrix
Q contains one element:
In this case,
R = 0, a|
E−Q1| = 1 −
A. Then:
This equation coincides with Equation (12), which has been used to analyze diffraction effects at the transitions 3C→2H and 3C→18R observed in various iron-manganese steels. Note that, when considering the 3C→18 transition, we need to operate with 32 order matrices.
However, when solving problems where the correlation extends to a larger number of single-layer stacking faults, the method proposed herein turns out to be cumbersome. In such cases, simpler solutions can be obtained if, based on physically real models of the defective structure, the number of correlation parameters is reduced.
3.7. FCC Crystal Studies
Let us study, as an example, an FCC crystal that has partially undergone a phase transition to the 6
H phase. Due to the close-packed planes, we can see that the 6
H structure can be considered as the initial FCC structure, in which three normal and three defective layers alternate. Description of such a defective structure using the method described above requires consideration of the correlation between the three single-layer stacking faults. For this transition in crystals, a mechanism of ordered double exchange can be proposed, the elementary act of which is equivalent to forming a three-layer stacking fault. In this case, it is justified to introduce the correlation for a distribution of not single- but three-layer stacking faults, assuming their preferred location through three layers. With this choice of the elementary stacking fault, the correlation range is reduced from three to one. A detailed analysis of multi-layer stacking faults in the formation of polytypes has been undertaken by Landau L. D. [
38].
Thus, it is advantageous to express the intensity of diffracted beams as a function of the coordinates of not the single-layer stacking faults but their defined groupings selected as elementary shear stacking faults.
Instead of the general numbering of single-layer stacking faults, we can introduce the numbering of elementary groups and, in each group, our own numbering of single-layer stacking faults. Then, for the number
k of randomly selected single-layer stacking fault, we have:
where
n and
n’ are the numbers of the last “integer” groups lying between the zero and
k single-layer stacking faults, respectively;
g(
i) is the number of single-layer stacking faults in the
ith group;
r(
n + 1); and
r(
n’ + 1) indicates the numbers of single-layer stacking faults in the (
n + 1) and (
n’ + 1) groups, respectively.
For the coordinates of the
k and
k’ single-layer stacking faults, the following is true:
where
mn+1 and
mn′+1 are the coordinates of the beginning of the (
n + 1) and (
n′ + 1) groups, and
mr and
mr′ are the coordinates of the
r single-layer stacking fault in the (
n + 1) group and the
r′ single-layer stacking fault in the (
n′ + 1) group.
Equations (17) and (18) can be substituted into Equation (8). Thus, the summation of
k and
k’ is replaced by the summation of
n,
n′,
r, and
r′.
Let us replace
n = n′ + p in Equation (13) and average by
n’:
Here, f = N′/L, where N′ is the number of elementary groups in the crystal.
3.8. Diffraction Effects for Models of Defective Structures
After averaging over n′, the value g(i) becomes the representation of the number of single-layer stacking faults in the ith group of an arbitrary sequence from the p + 1 group. By giving the concept of the “elementary group” a specific meaning and considering the necessary correlation, it is possible to calculate diffractive effects for a wide class of models of defective structures using Equation (20). This fact may be illustrated based on a model of ordered multi-layer stacking faults.
It is possible to consider the formation of regions in the original FCC crystal with a structure using Zhdanov’s symbols (abcd). It is not difficult to see that the new phase is equivalent to the FCC structure, in which, after a normal layer, there are b defective layers, then c normal layers, and then, again, d defective layers. The formation of such a phase can be considered as a corresponding ordering of multi-layer stacking faults with thickness h in b and d layers. We can use the following probabilities: β1 is the probability of there being multi-layer stacking faults with h = b, provided that that the closest multi-layer stacking fault lies at a distance of a layers and has a thickness of h = d. β2 is the probability of there being multi-layer stacking faults with h = d, provided that the closest multi-layer stacking fault lies at a distance of c layers and has a thickness of h = b. Then, α1 and α2 are the probabilities of the independent appearance of a multi-layer stacking fault with h = b and h = d, respectively (in the absence of the ordering β1 = α1 and β2 = α2).
Let us introduce the probability
Ppt(h1, h2, …, hp+1) that, in the sequence
p + 1 of multi-layer stacking faults, the first has a thickness
h1, the second
h2, etc. (
hi = b, d), while, between the beginning of the first and the
p + 1 multi-layer stacking faults, there is a distance of
t layers (
mp+1 −
m1 = t). Using this and considering that, in this case,
g(i) = hi and
mr = r, we can rewrite Equation (20) as follows:
is the probability of there being multi-layer stacking faults with thickness
hj at a distance of
xi layers after the multi-layer stacking faults with thickness
hi; this probability is easily expressed with the introduced probabilities (
β1, β2, α1, α2) and
, the relative fraction of multi-layer stacking faults in the layers. Then:
By substituting Equations (22)–(24) into Equation (21) and using the equality in Equation (13), we get:
where
μm are coefficients of the characteristic polynomial of matrix
A; (*) is the complexly conjugate value; and
are functions of the introduced probabilities
α1,
α2, β1, and
β2. The calculation of these values using Equation (14) does not cause any complications. The relative fractions of multi-layer stacking faults
fb and
fd can be determined using an obvious system of equations:
Further, let us define
f as the inverse of the average distance between the beginnings of the nearest multi-layer stacking faults:
Thus, all unknown values in Equation (25) are expressed through the introduced probabilities and the problem in its general form may be considered solved.
3.9. Diffraction Effects
Let us check with a specific example whether the model of ordered multi-layer stacking faults causes diffraction effects in the formation of sections of a new phase. For this purpose, the above 3
C − 6
H transition can be employed. In this case,
b = d = h = 3 and
a = c = l = 3. Without specifying the values
h and
l from Equations (23) and (24), we obtain the following expression for the intensity of diffracted rays:
where
β is the probability of multi-layer stacking faults, provided that the nearest multi-layer stacking fault lies at a distance of
l layers, and
α is the probability of the independent appearance of a multi-layer stacking fault. At
h = 1, Equation (29) turns into Equation (16), and at
h = 1 and α =
β, it turns into the equation for chaotic single-layer stacking faults (intrinsic stacking faults) [
39]. The analysis in Equation (29) still shows that, at
h = 3 and
l = 3, the intensity distribution has the form of a curve with six maxima per period (0°
≤ ξ < 360°). At
ξ = 240°, the point corresponding to the correct position of the diffraction maximum of the initial FCC phase, the denominator turns to zero. Using the formula for the value of a polynomial near the root:
We get =I (α, β) δ (ξ–240°), where δ(ξ–240°) is the delta function.
Therefore, in the considered model, the peak of the initial phase is not broadened or shifted.
3.10. Calculation of the FCC Twinned SiC Crystal
In the example of the calculation for the twin SiC FCC crystal, two sharp peaks at the positions of the normal and twin FCC structures and widened maxima at the position of the 6H phase were found for the case of the original crystal that transformed into the 6H structure.
It was noted that one of the expanded maxima of the new 6H structure is superimposed on this maximum. The remaining extended maxima lie in positions characteristic of phase 6H: ξ = 0, 60, 120, 180, and 300°. If the original FCC crystal contains regions with both normal and twin orientations, then another acute maximum at the position corresponding to the twin FCC structure at ξ = 120° will obviously appear.
Equations (20)–(29) were used for the calculation. Equation (20) can be used to calculate the diffraction effects for a wide class of defective structure models. As an example, the 3C − 6H transition discussed above provides the diffraction effects for the model of ordered multi-layer stacking faults resulting from the formation of new phase regions. The use of several transformations made it possible to obtain Equations (20)–(29).
Therefore, the developed technique for X-ray diffraction investigation of stacking faults in silicon carbide using the broadening of successive series of diffraction maxima enables the reliable determination of the concentration of stacking faults and its variations during different structural transformations. It is possible to compare this technique with the existing method used for such investigations. This will require separate research, which is to be performed at the next stage when conducting complex experiments in the field of X-ray diffraction in crystals with a face-centered lattice relating to other alloys. An important aspect of further experiments with stacking faults will be the joint use of transmission electron microscopy and diffraction methods. This will allow the development of modern approaches to the calculation of theoretical diffraction patterns for crystals with planar defects. Based on the results of the performed experiments, a mathematical model will be obtained that can be used to determine the concentration values for stacking faults and the thickness of silicon carbide plates, which can be compared with the calculated values obtained using known theoretical methods.
4. Conclusions
A technique was obtained that allows the calculation of the diffraction effects of the axis of the thin plates of twin, new phases, as well as other variations in defective structures.
The calculation for a twin FCC crystal showed that there are regions with both normal and twin orientations and, obviously, another acute maximum appears at the position corresponding to the twin FCC structure at ξ = 120°. These calculations were in full agreement with the experiments, where, for the case of the original twin silicon carbide (SiC) FCC crystal, which was partially transformed into the 6H structure, two sharp peaks were found at the positions of the normal and twin FCC structures, along with expanded maxima at the position of the 6H phase.
Equation (29) was used for the calculations. Therefore, in the considered model, the peak of the initial phase was not expanded or shifted. It was noted that one of the expanded maxima for the new 6H structure was superimposed on this maximum. The remaining extended maxima lay in positions characteristic of phase 6H: ξ = 0, 60, 120, 180, and 300°.
Stacking faults located in twin silicon carbide FCC crystals are located at an angle to the X-ray beam, leading to intensity contrast in the form of wide bands in the negative contrast without intensity beats. Stacking faults demonstrate negative intensity contrasts that gradually fall into the background as the stacking fault layer moves deeper into the single crystal. In cases of two or more closely spaced stacking faults, the intensity contrast for one stacking fault decays due to the superimposition of the intensity contrast from the other stacking fault.
The proposed method makes it possible to determine the nature and structure of stacking faults by identifying the partial and vertex dislocations limiting them in a twin FCC crystal based on X-ray diffraction analysis.
The proposed method makes it possible to calculate the diffraction effects of the thin plate axis of twin, new phases, as well as other variations in defective structures.


 ,
, 
