
Crystallographic, Structural, and Electrical Properties of W6+ Substituted with Mo6+ in Crystalline Phases such as TTB Structure

 ,
,  ,
,  , and
, and
Abstract
:1. Introduction
2. Experimental Section
2.1. Ceramic Sample Synthesis
2.2. Characterization Techniques
3. Results and Discussion
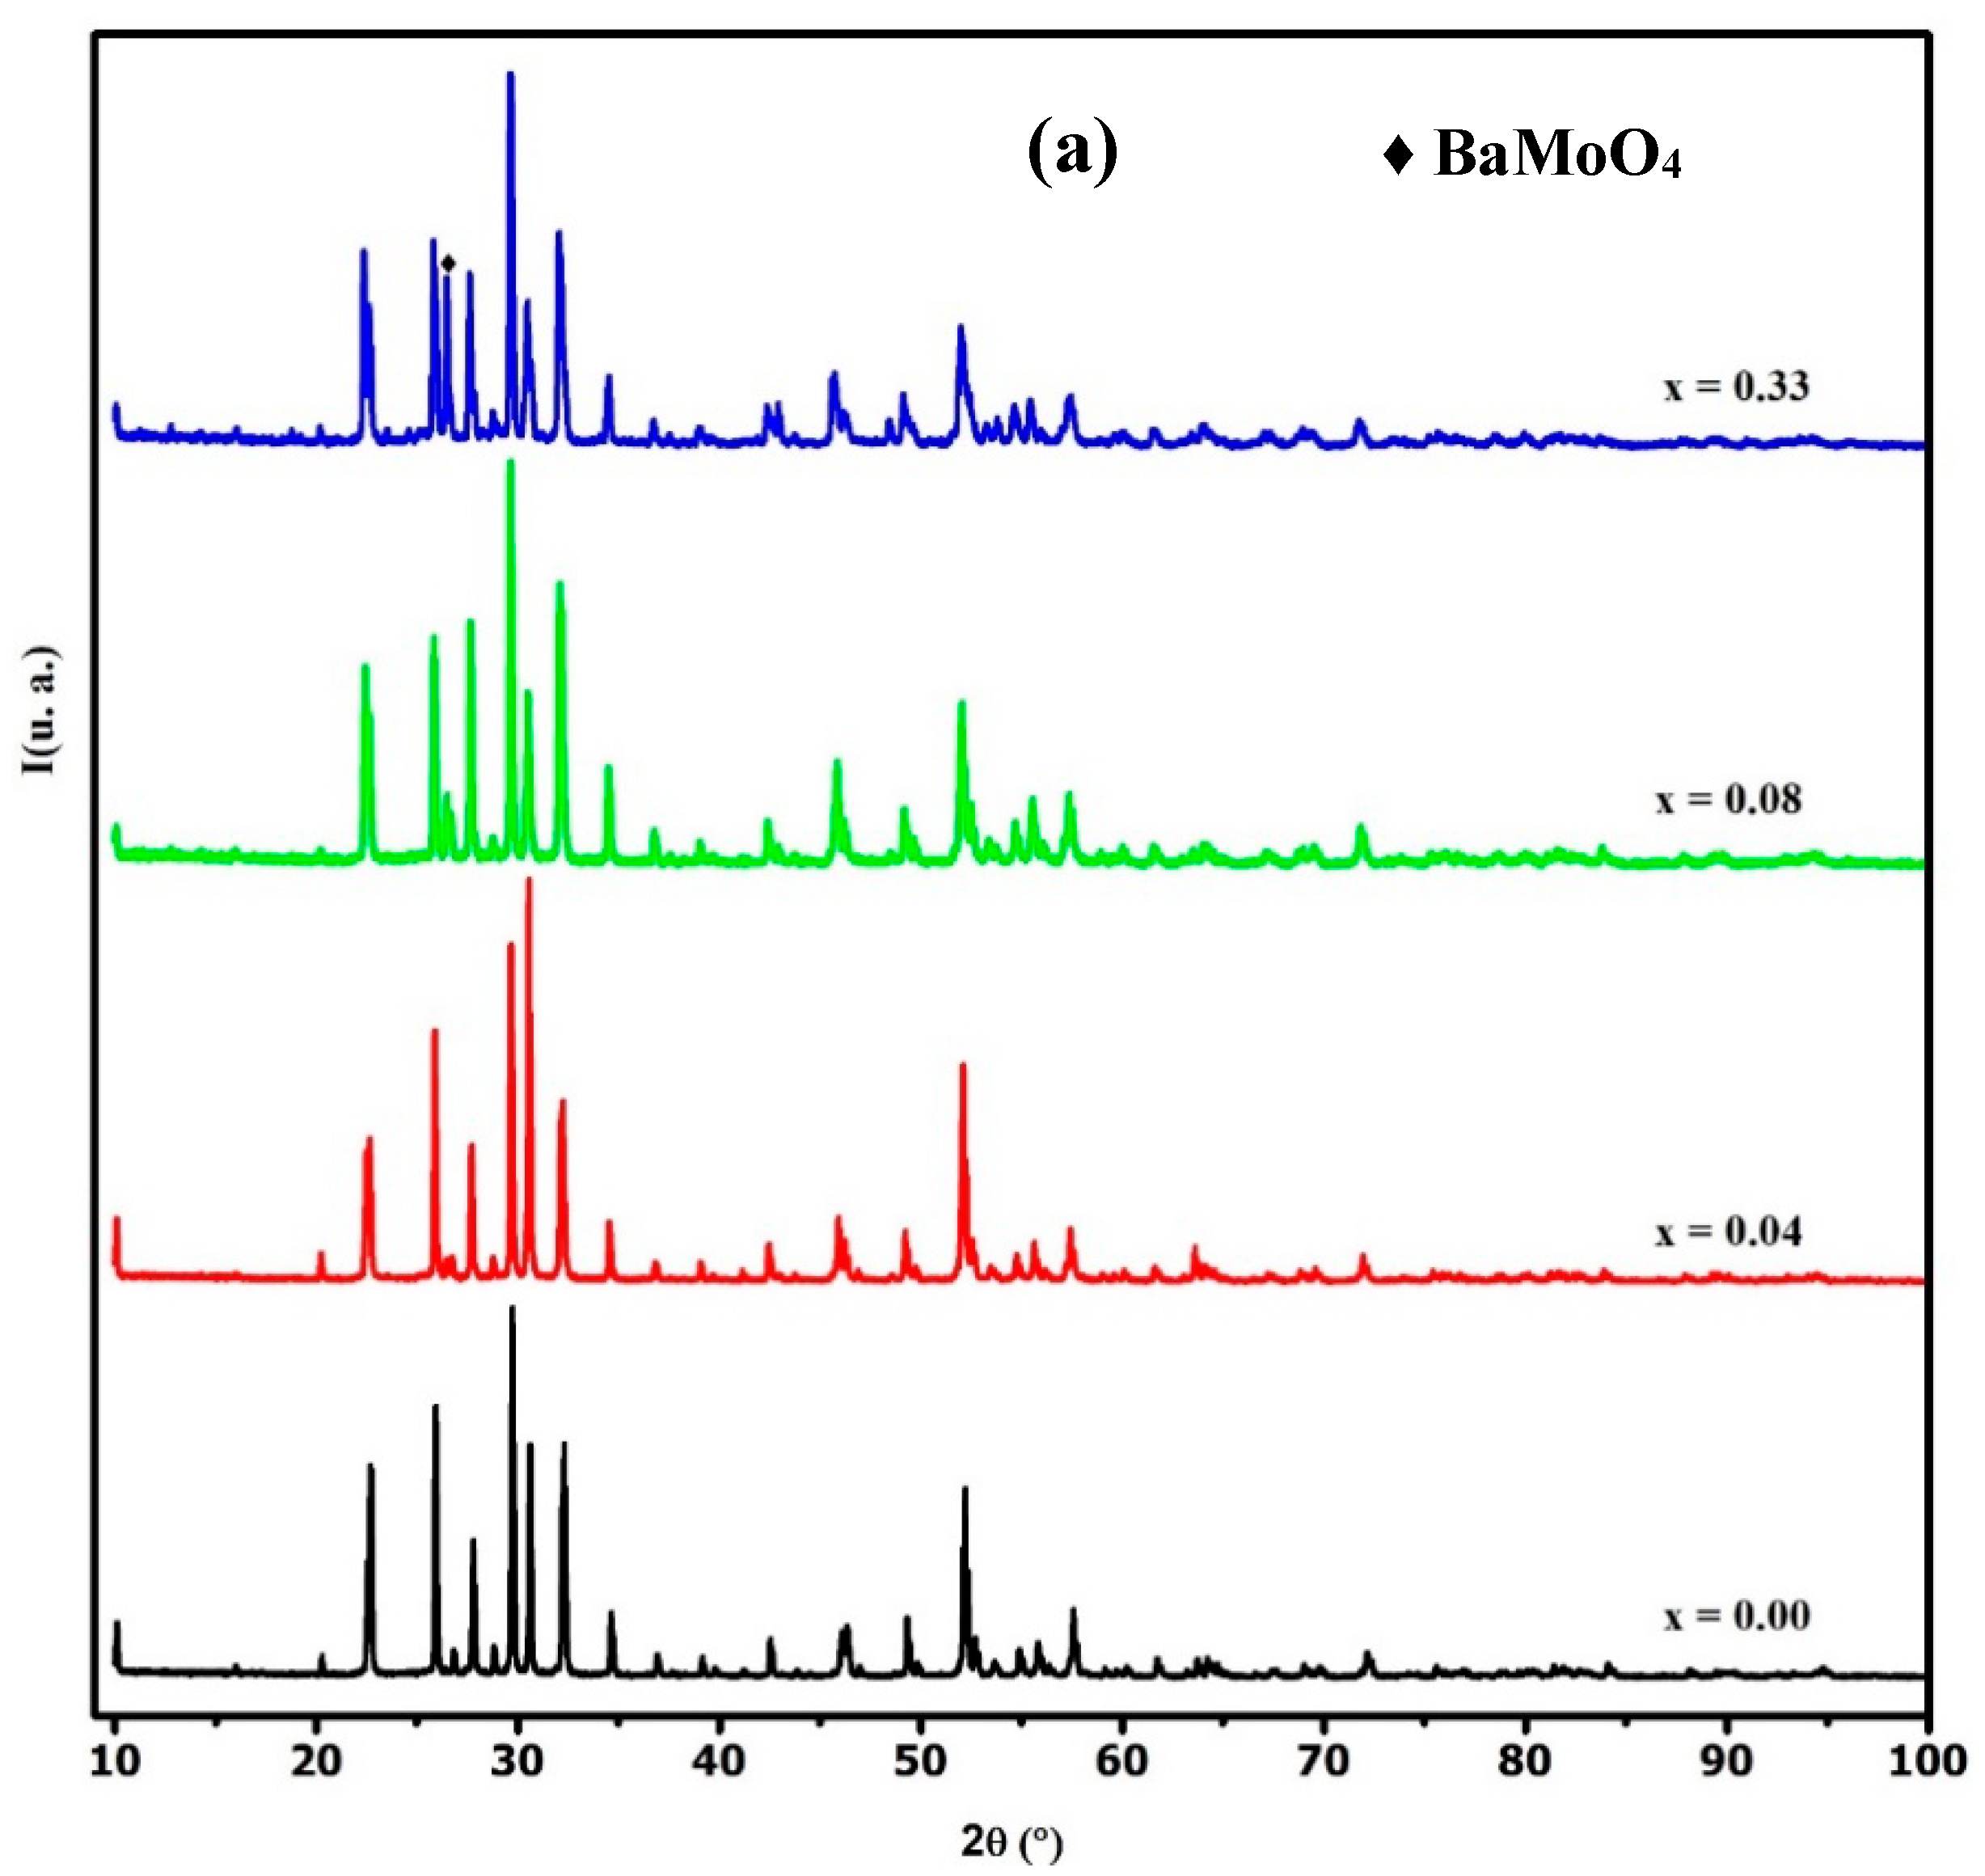
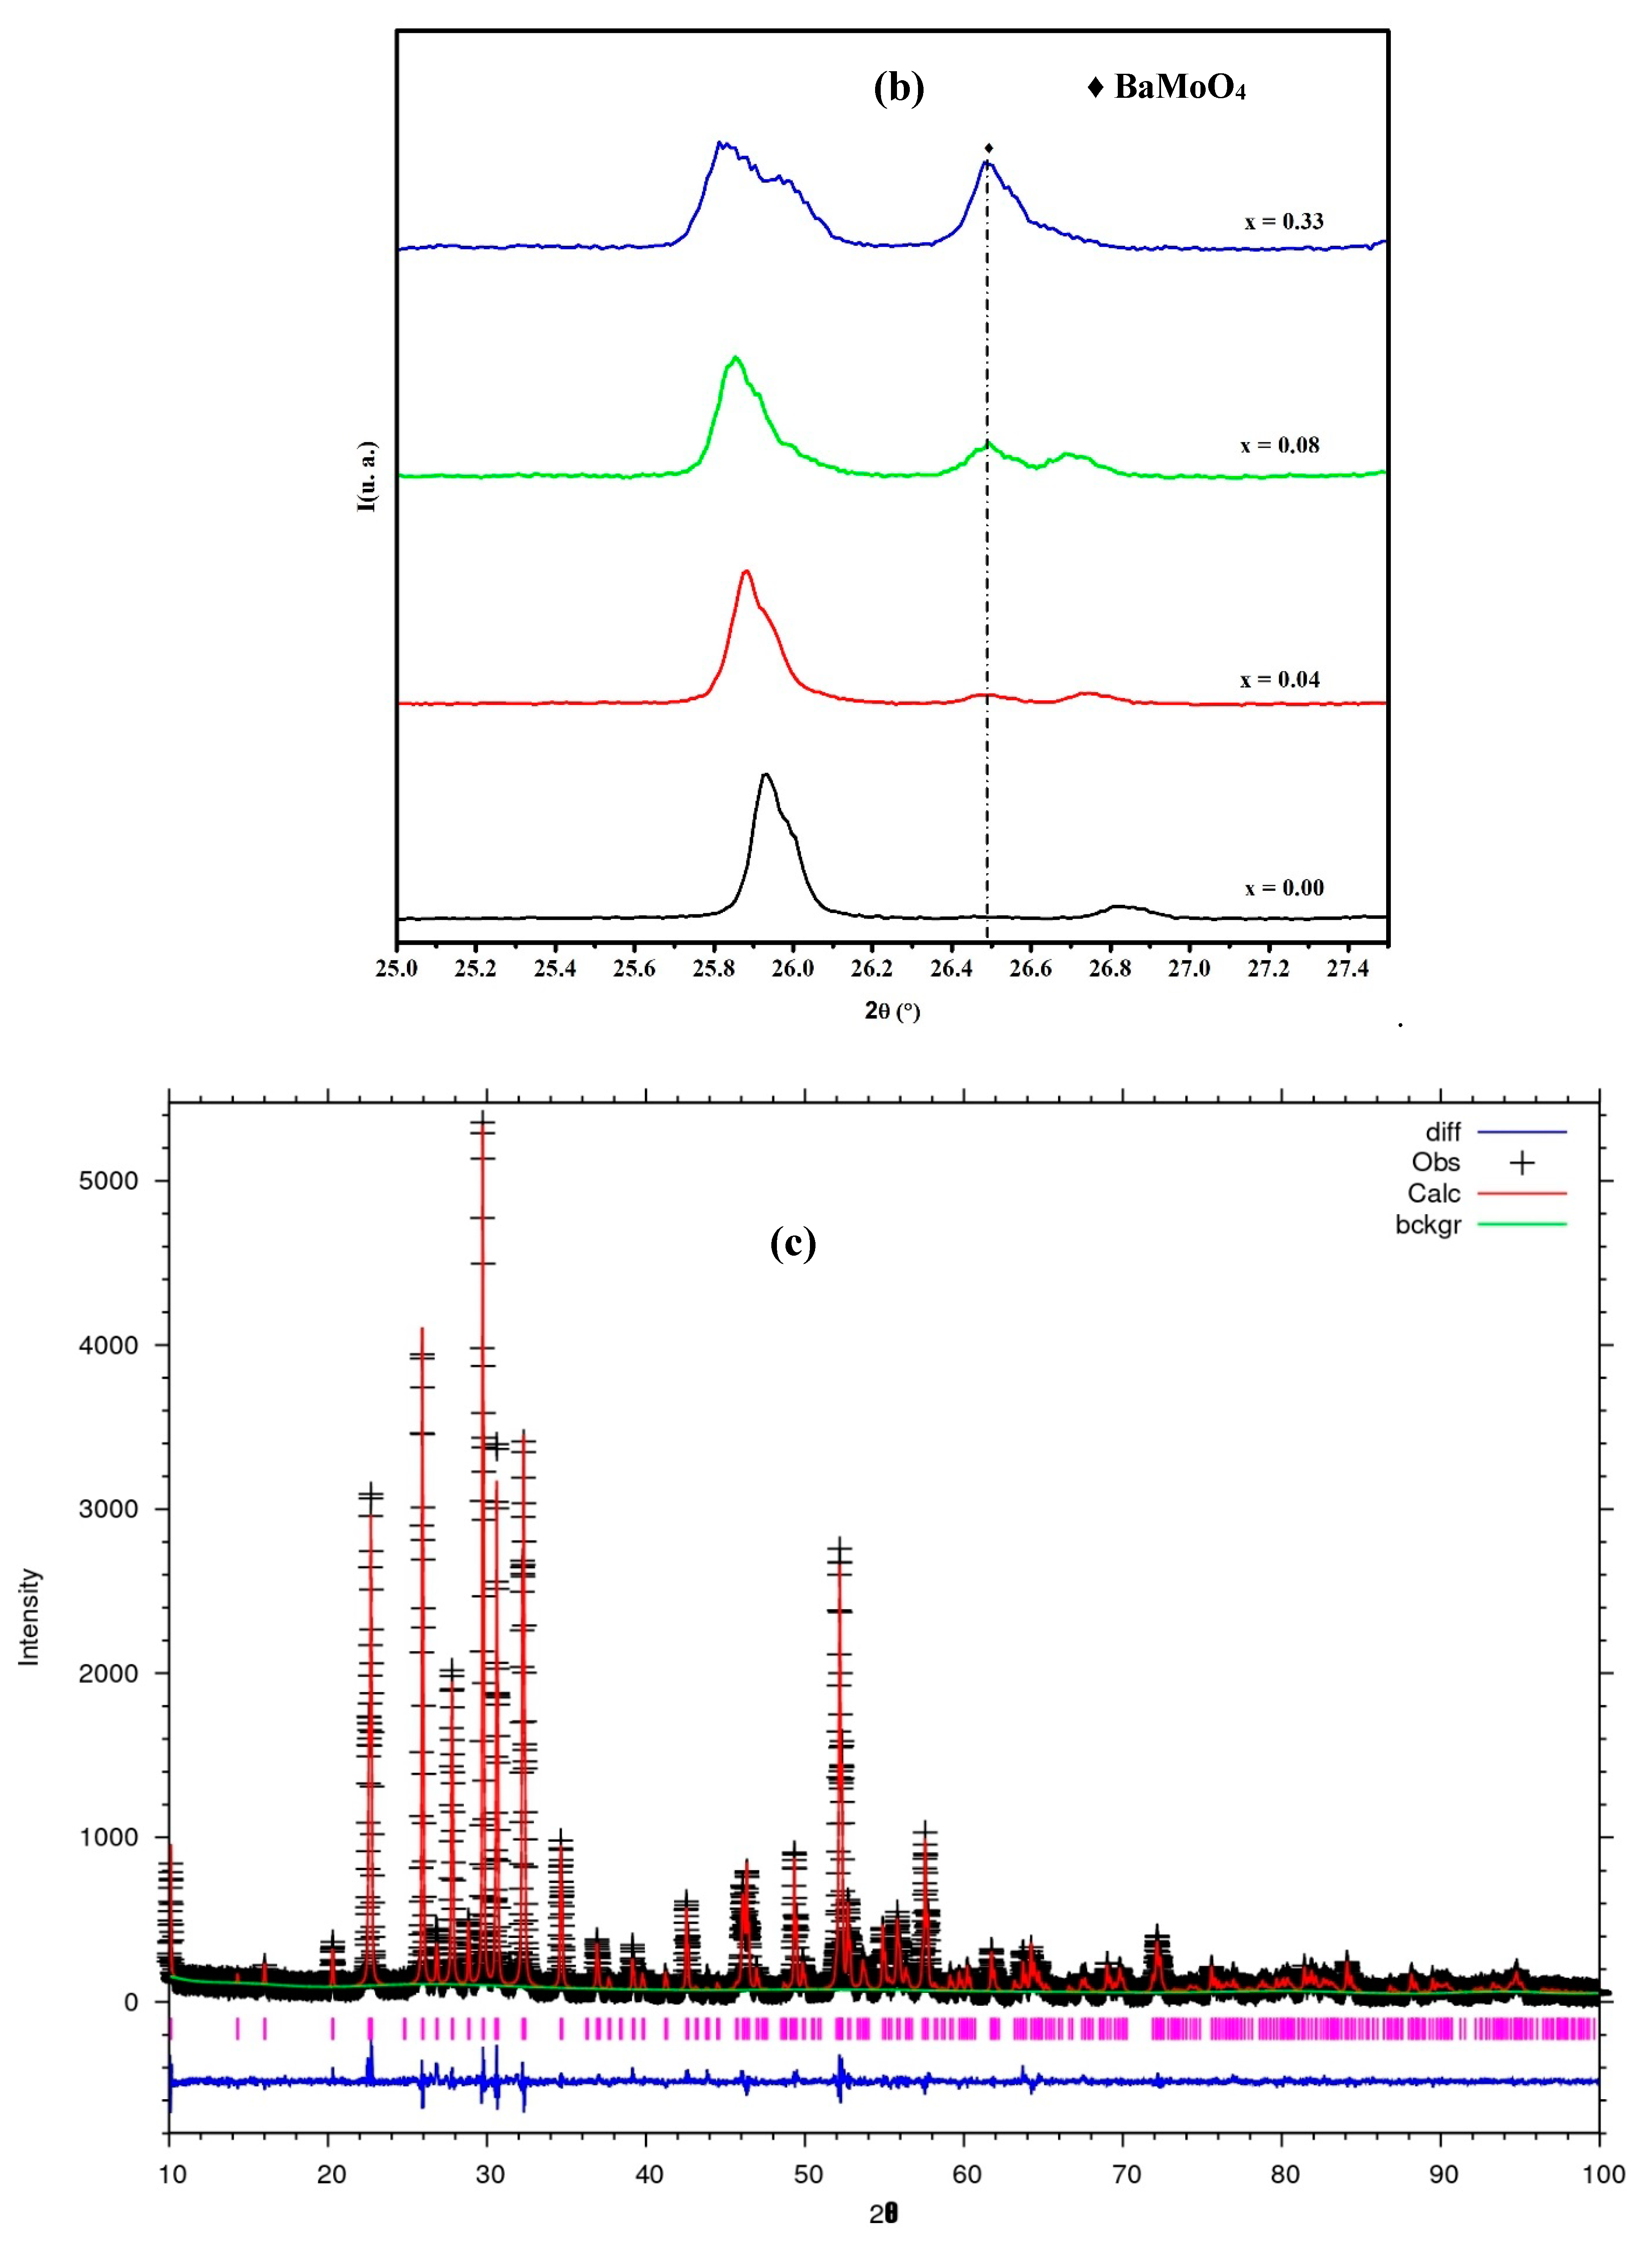
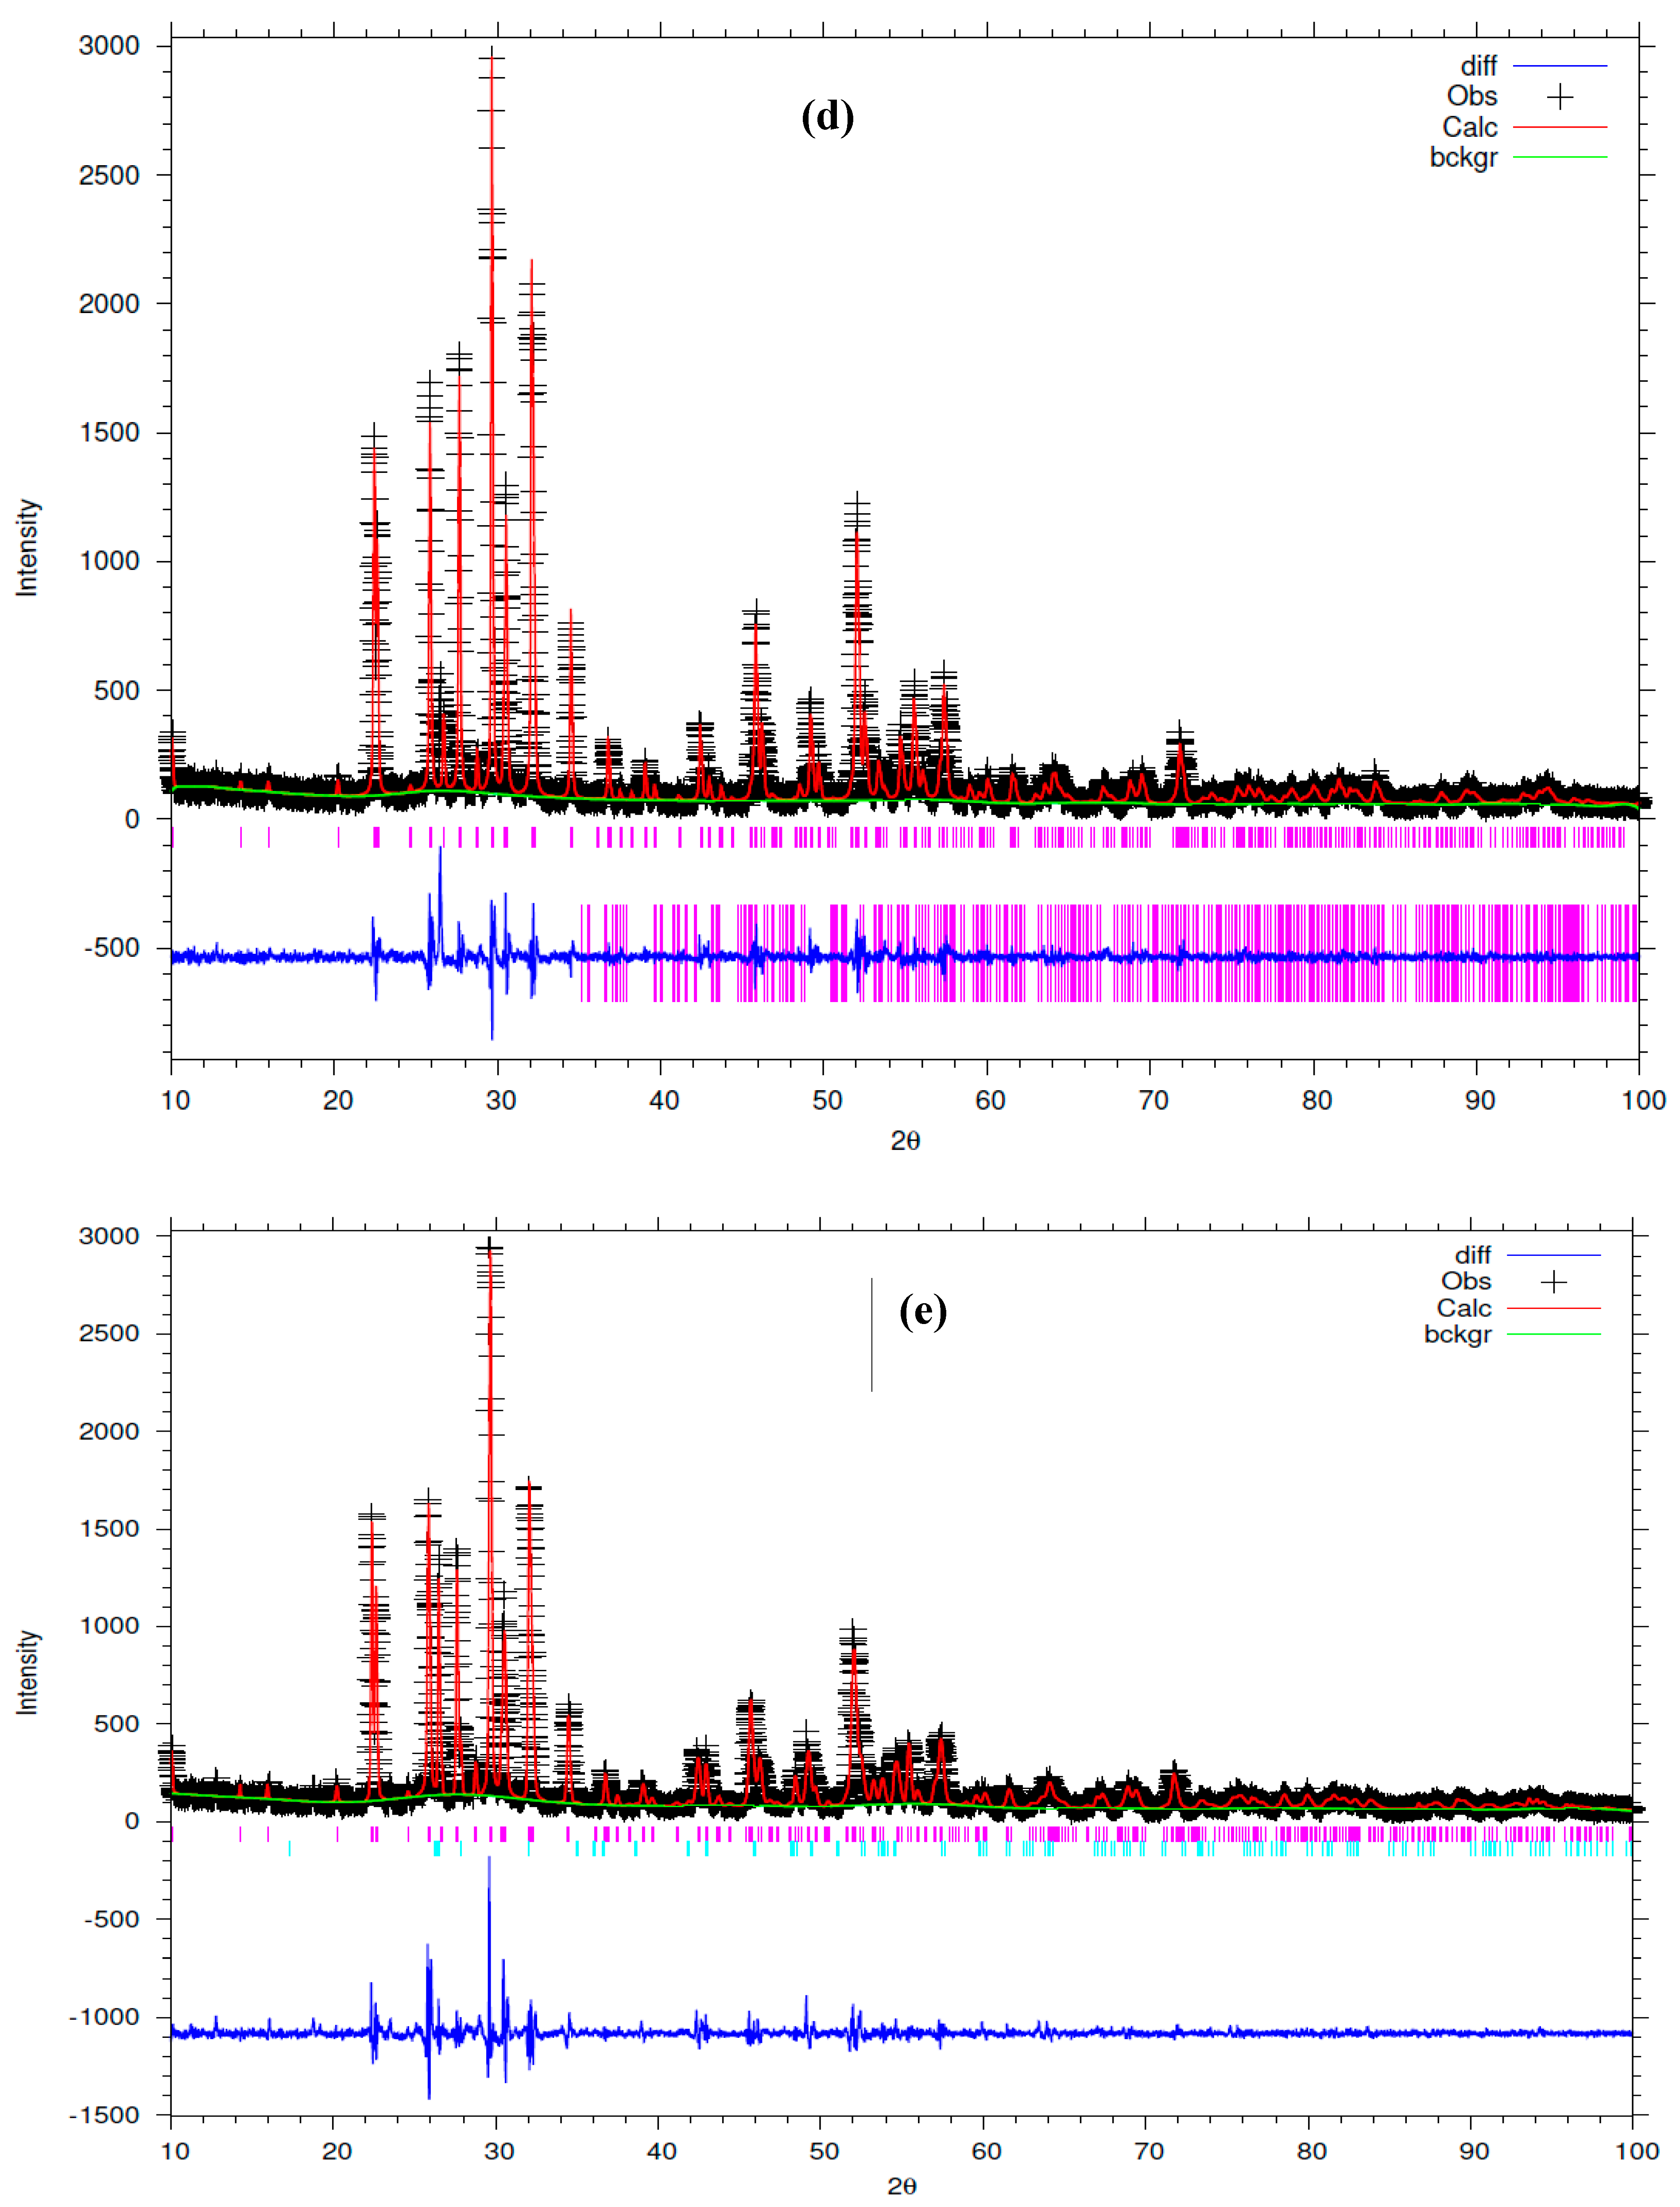
3.1. X-ray Diffractograms
3.2. Characterization with Raman Spectroscopy
3.3. Dielectric Analysis
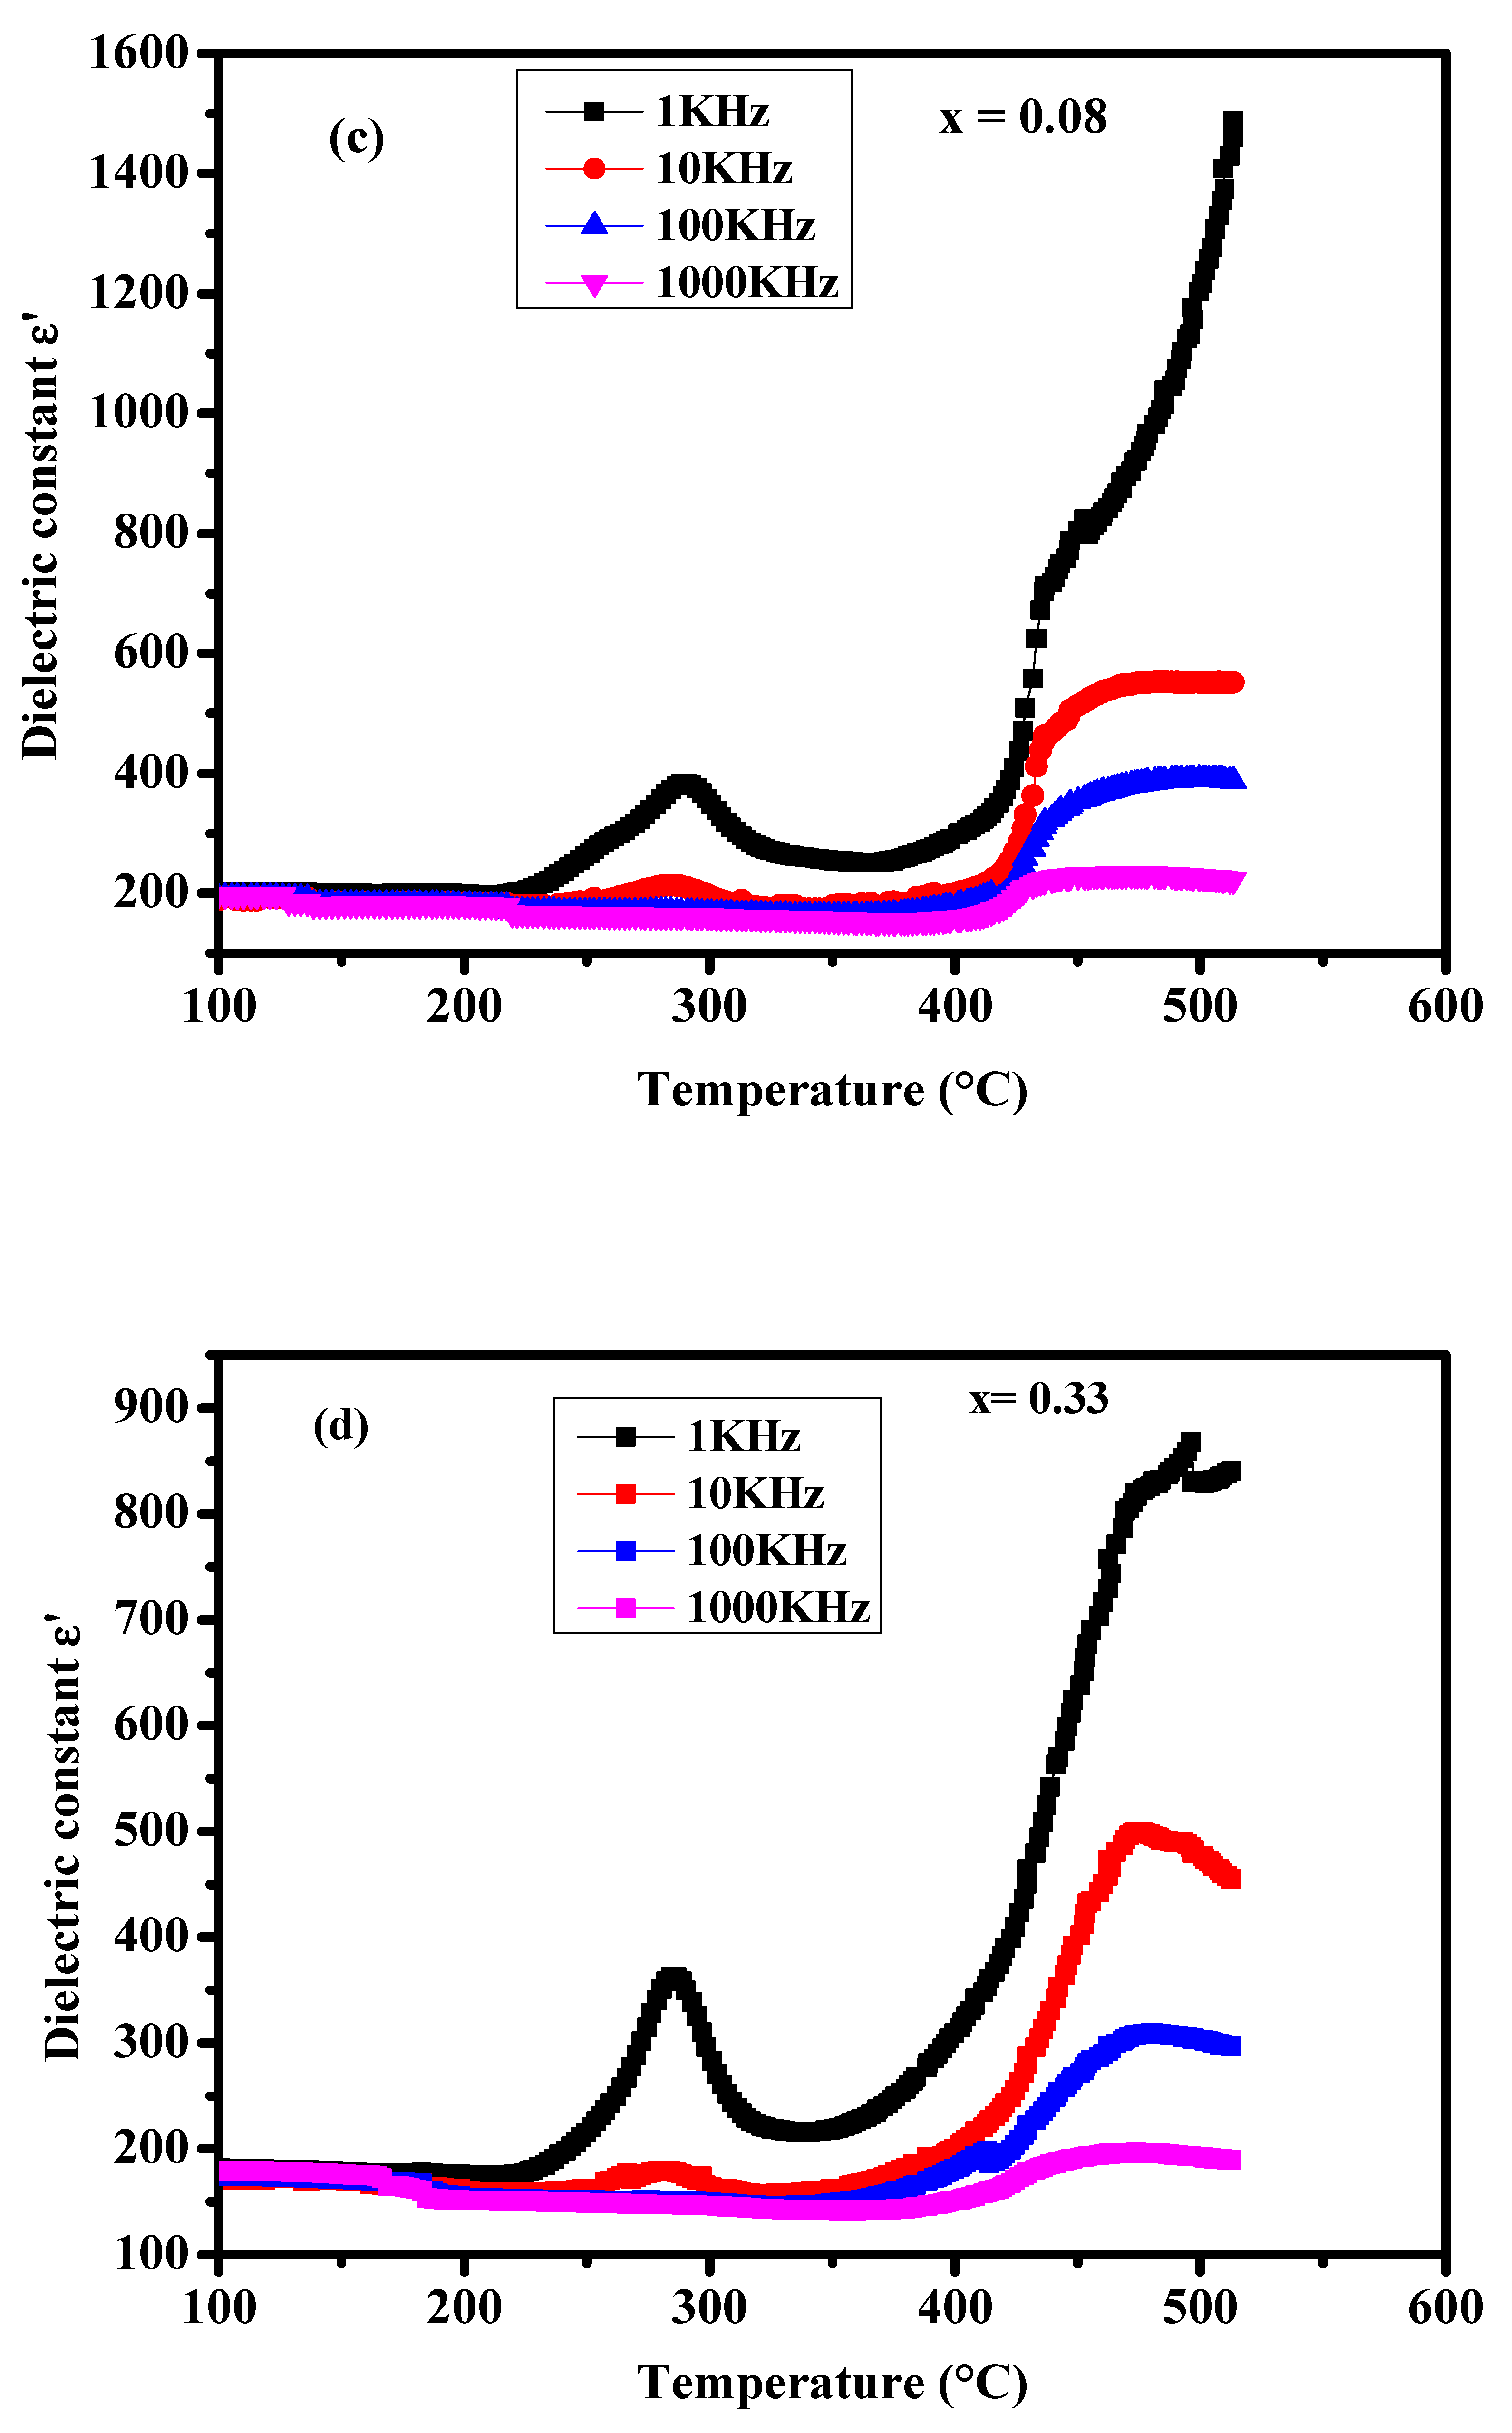
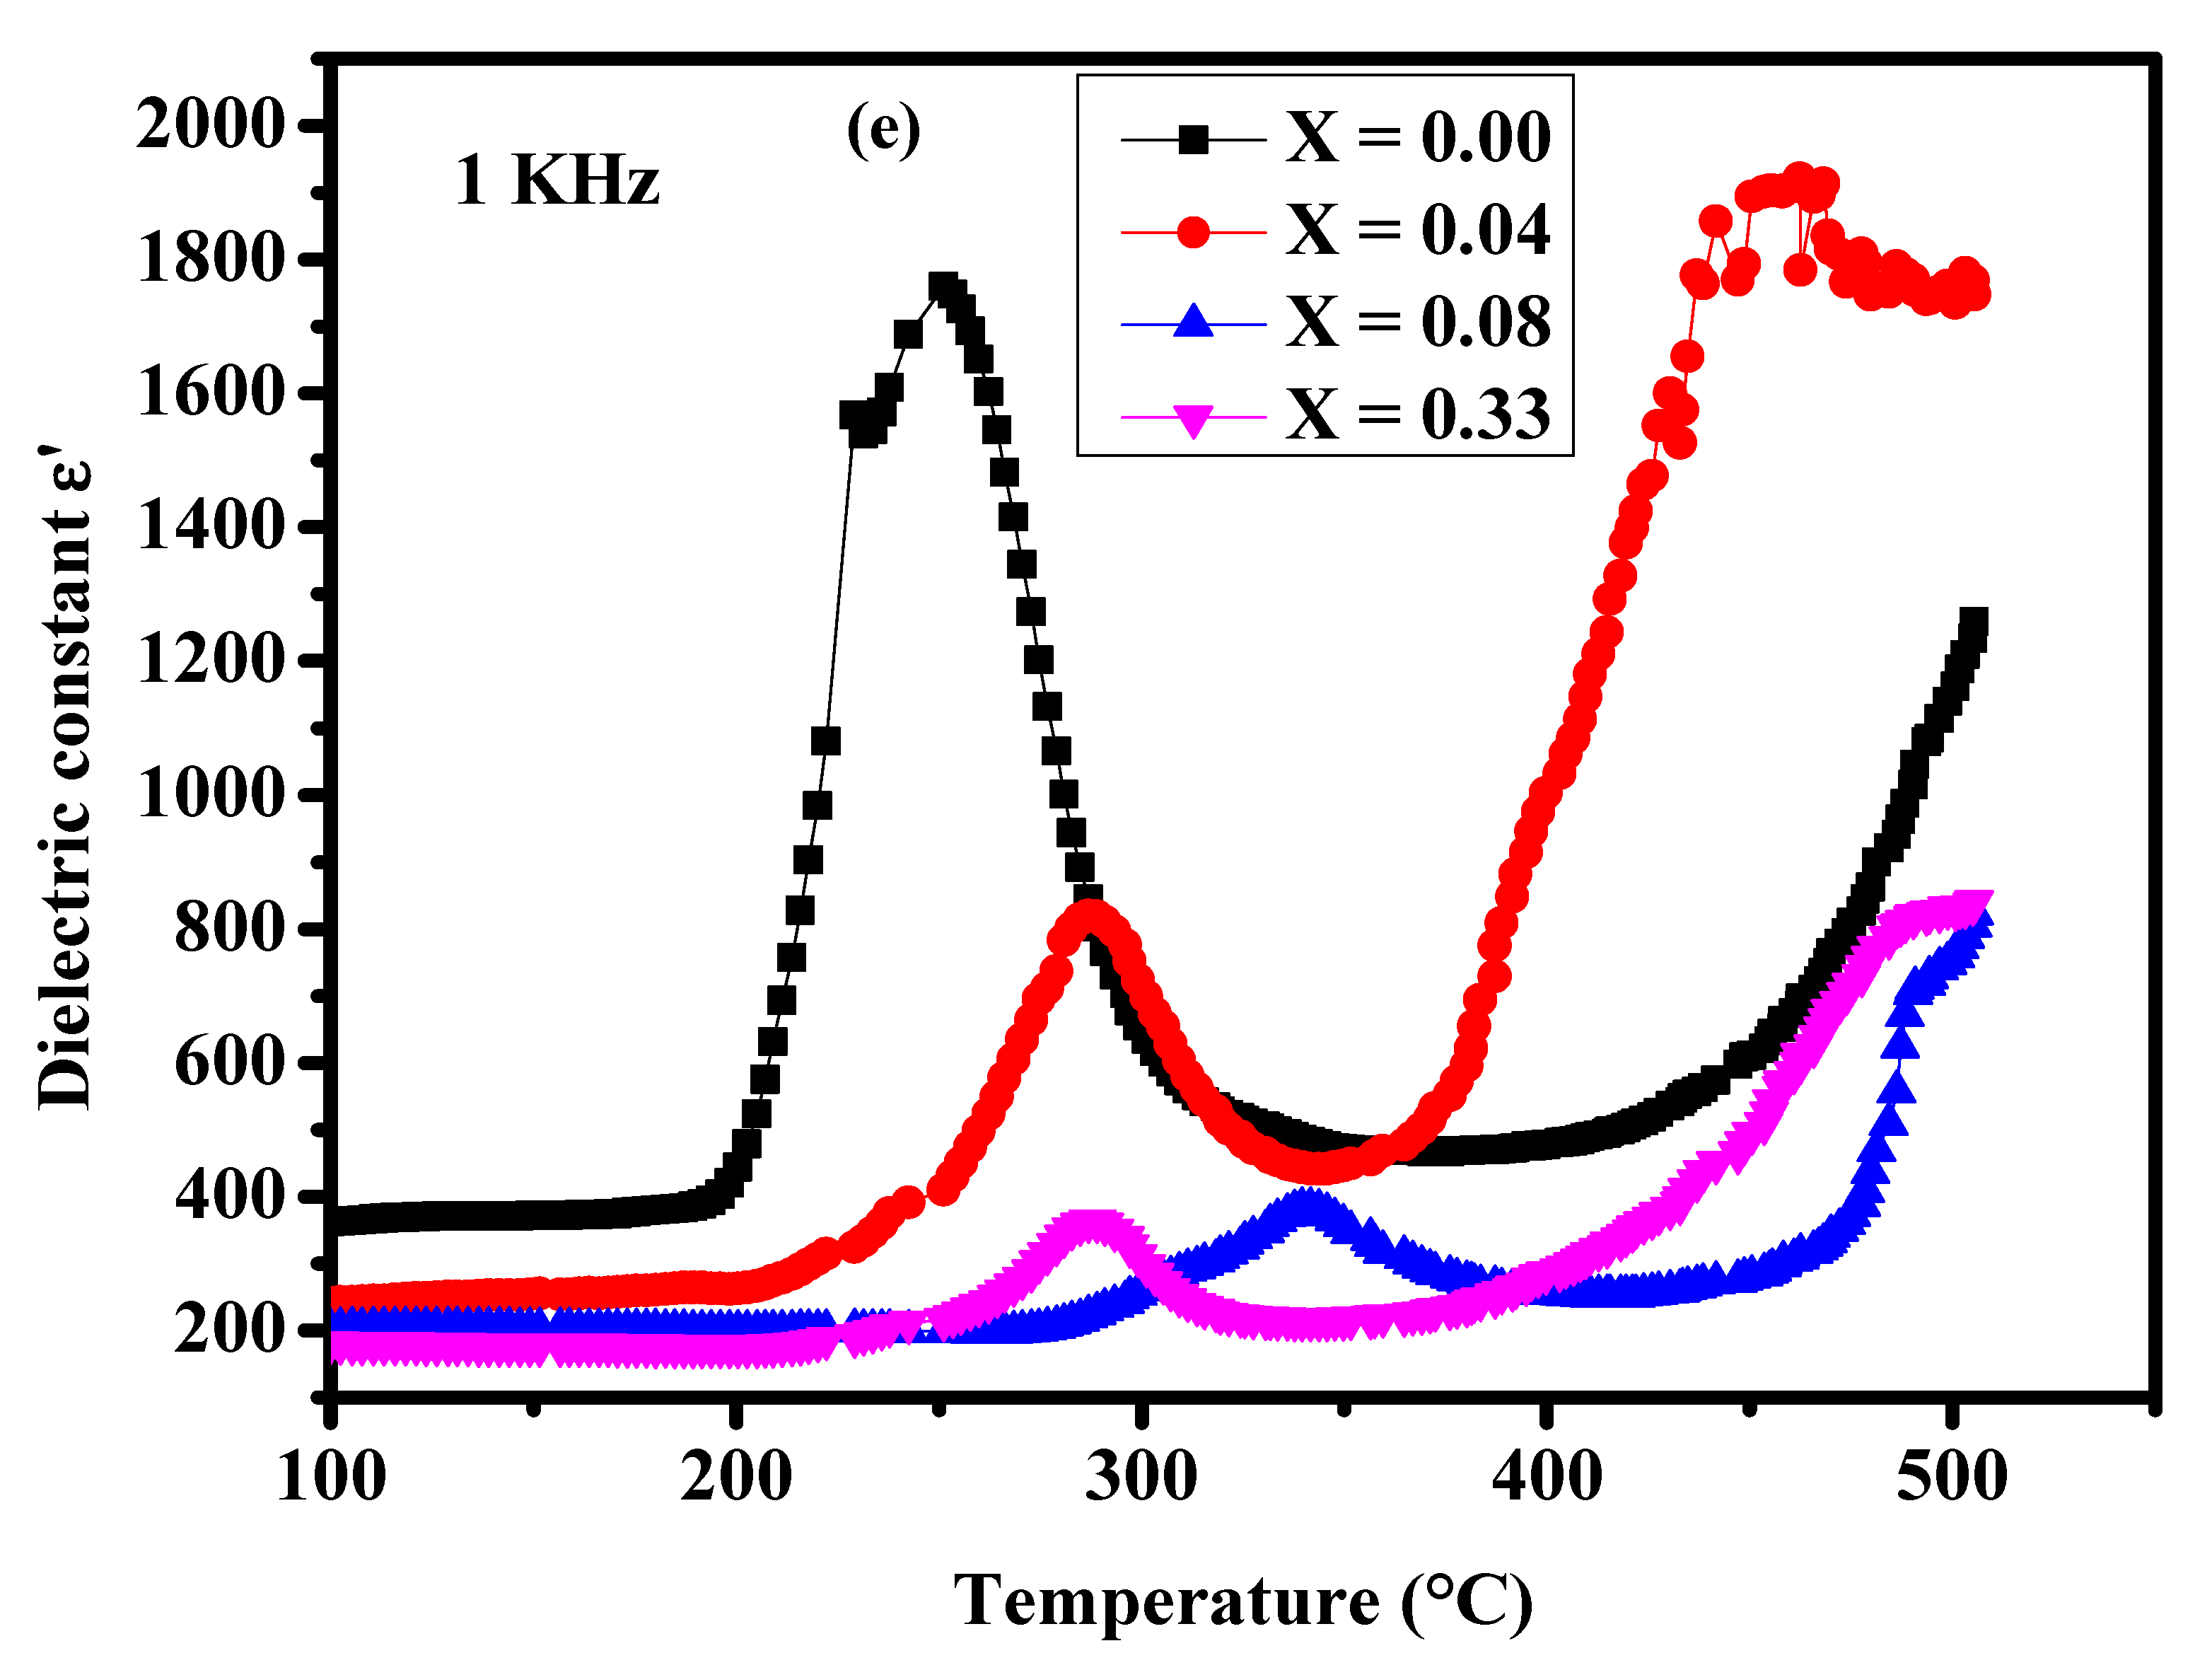
3.3.1. Evolution of Dielectric Permittivity () with Temperature
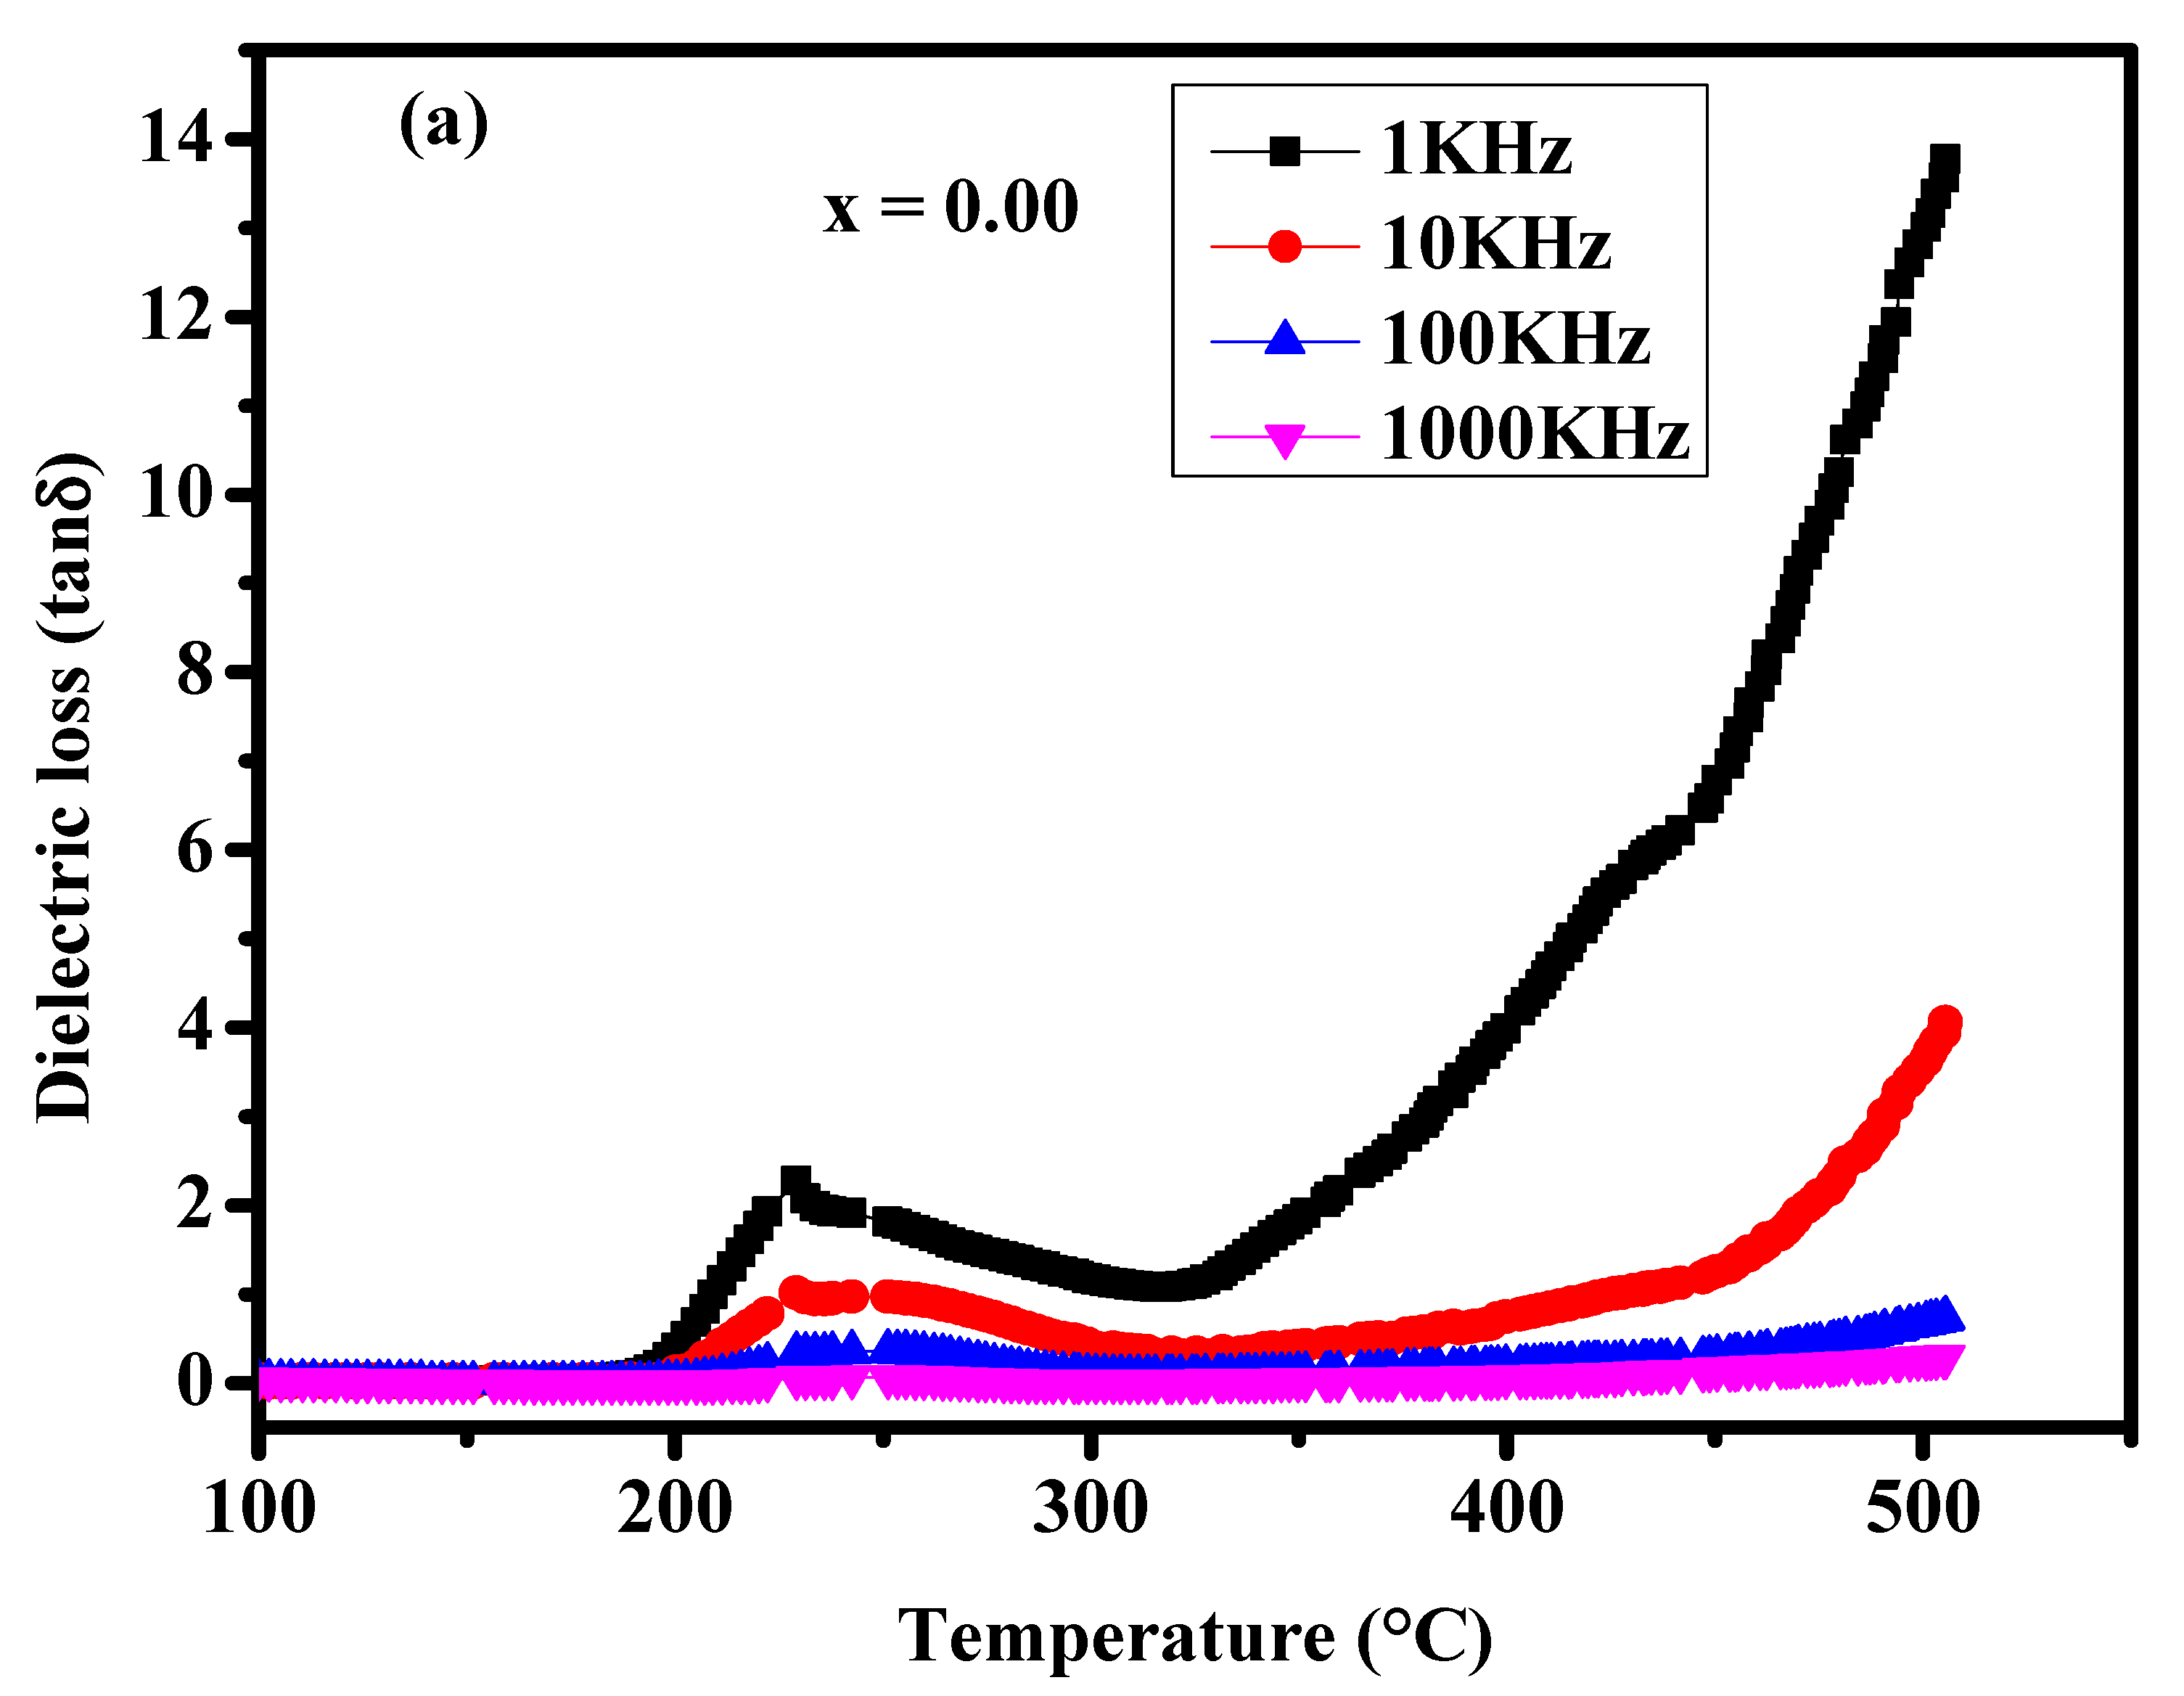
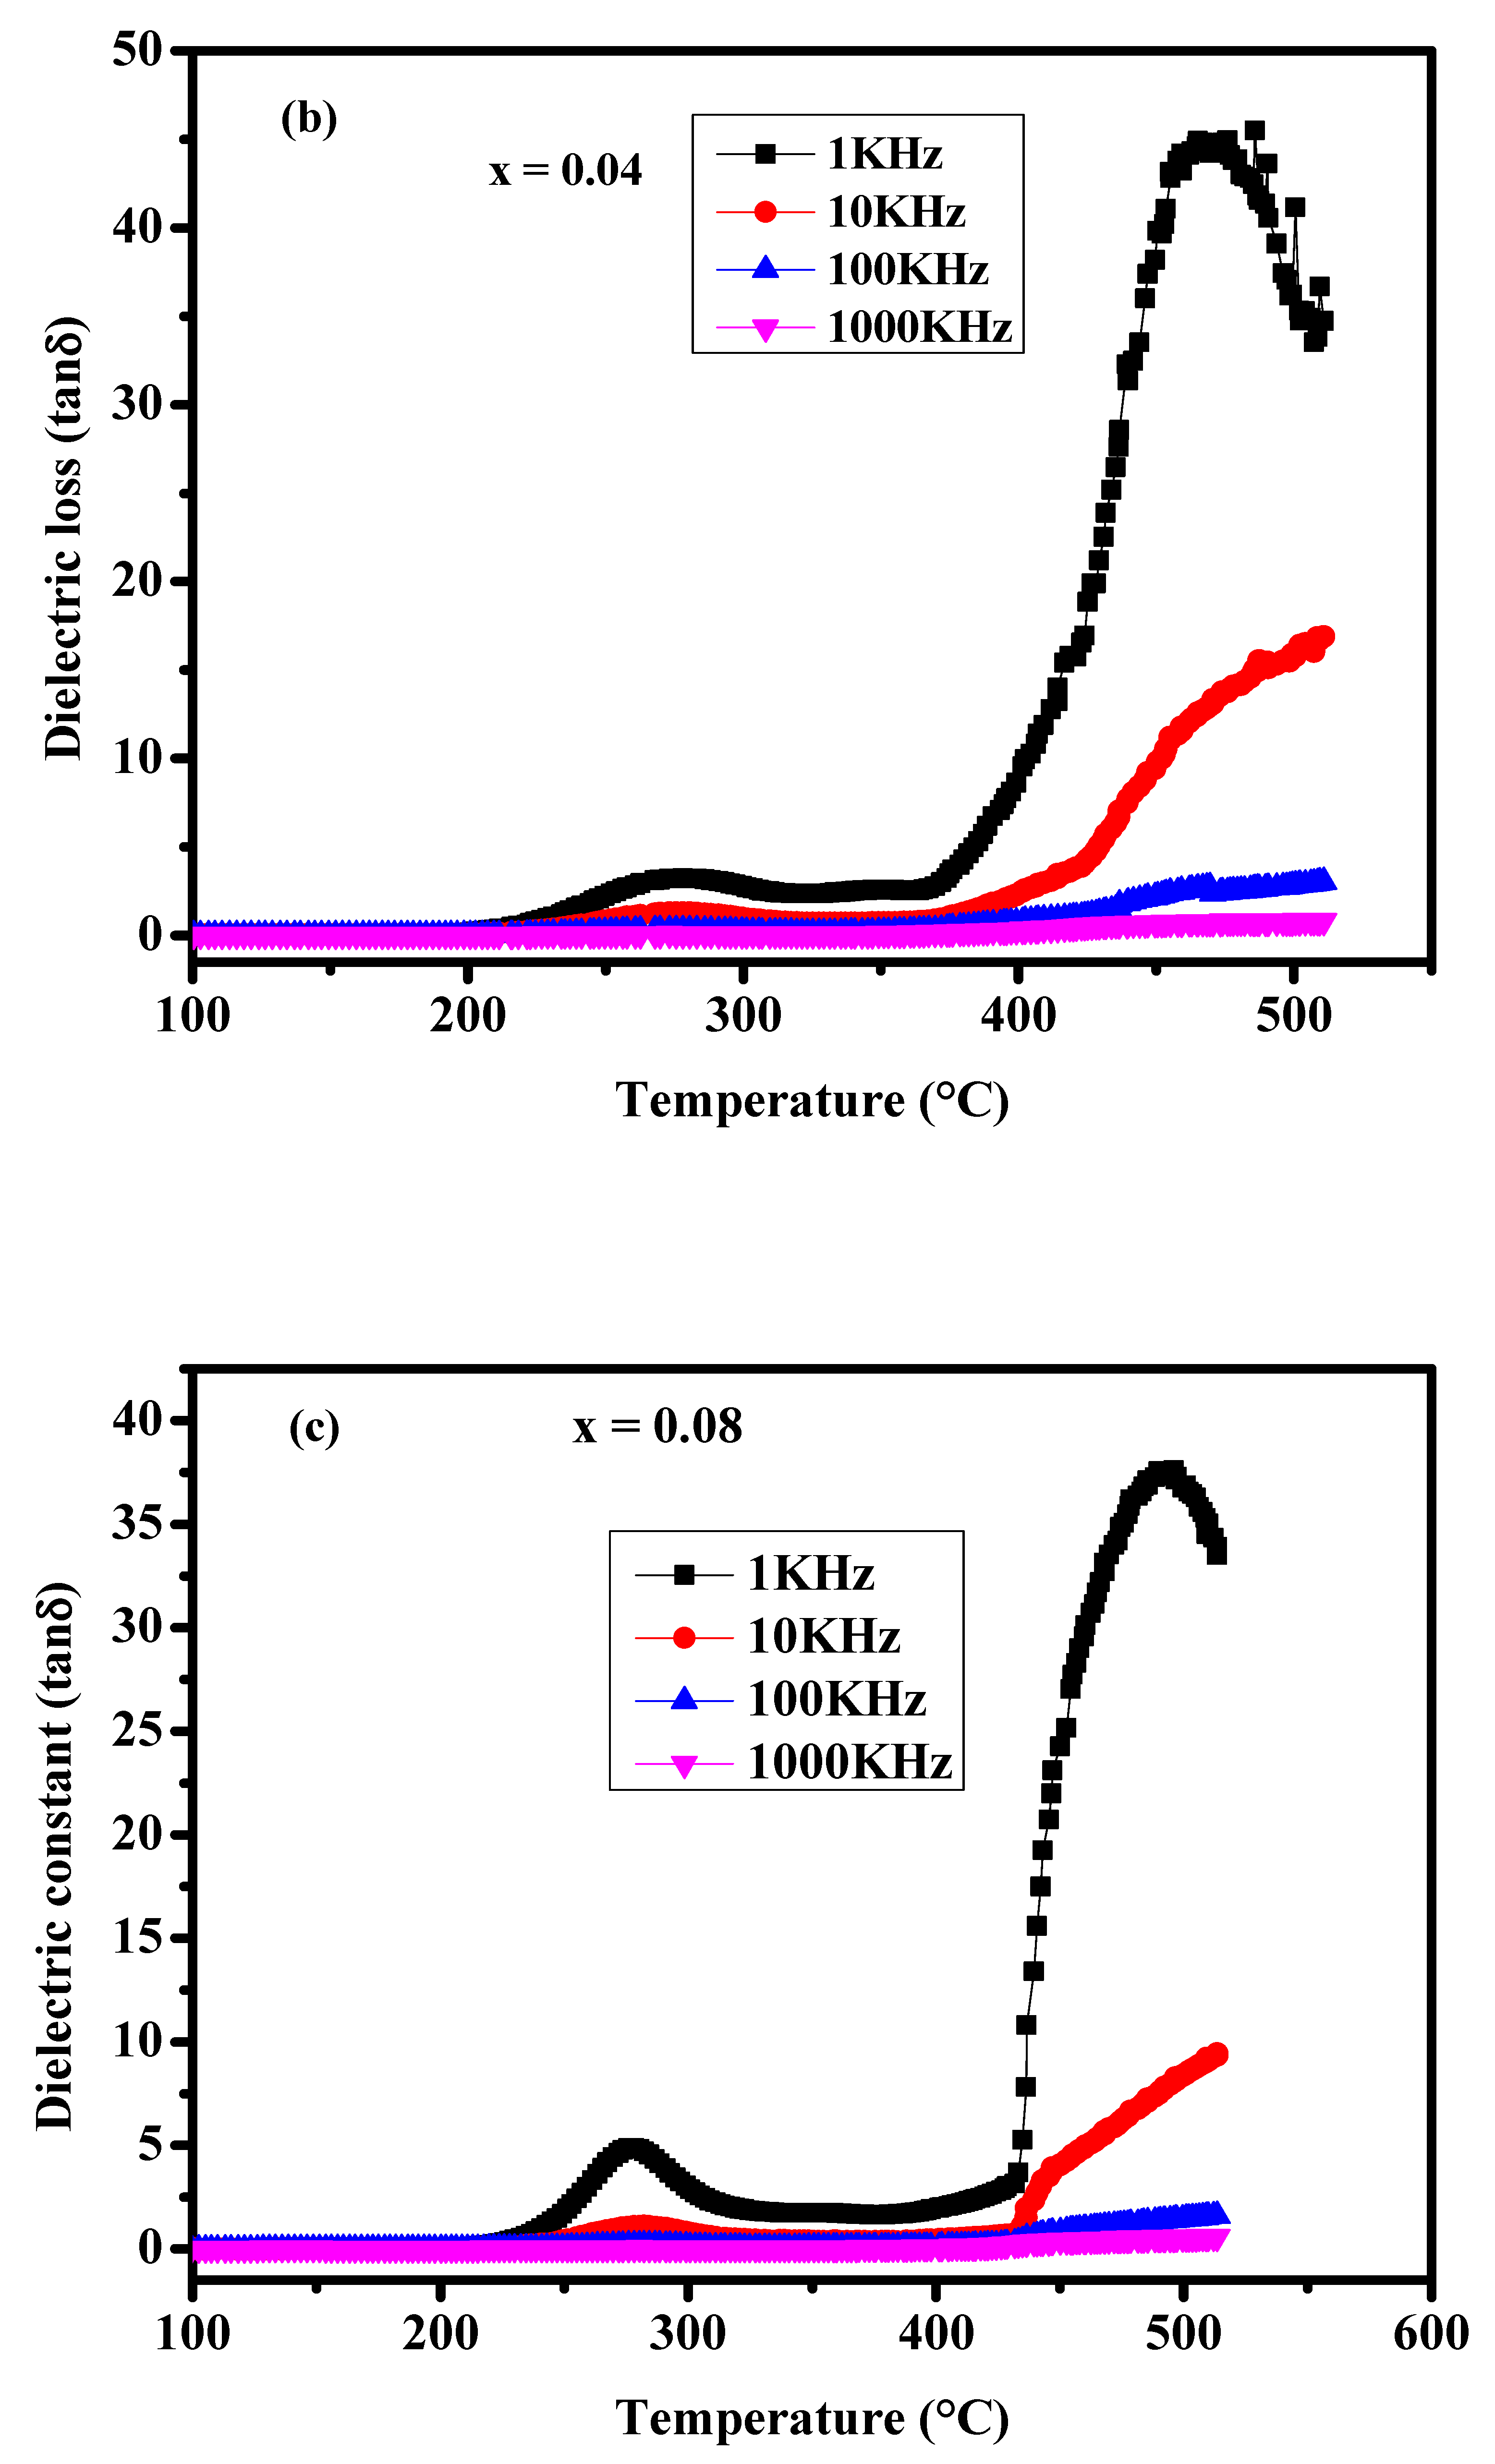
3.3.2. Evolution of Dielectric Losses (tanδ) with Temperature
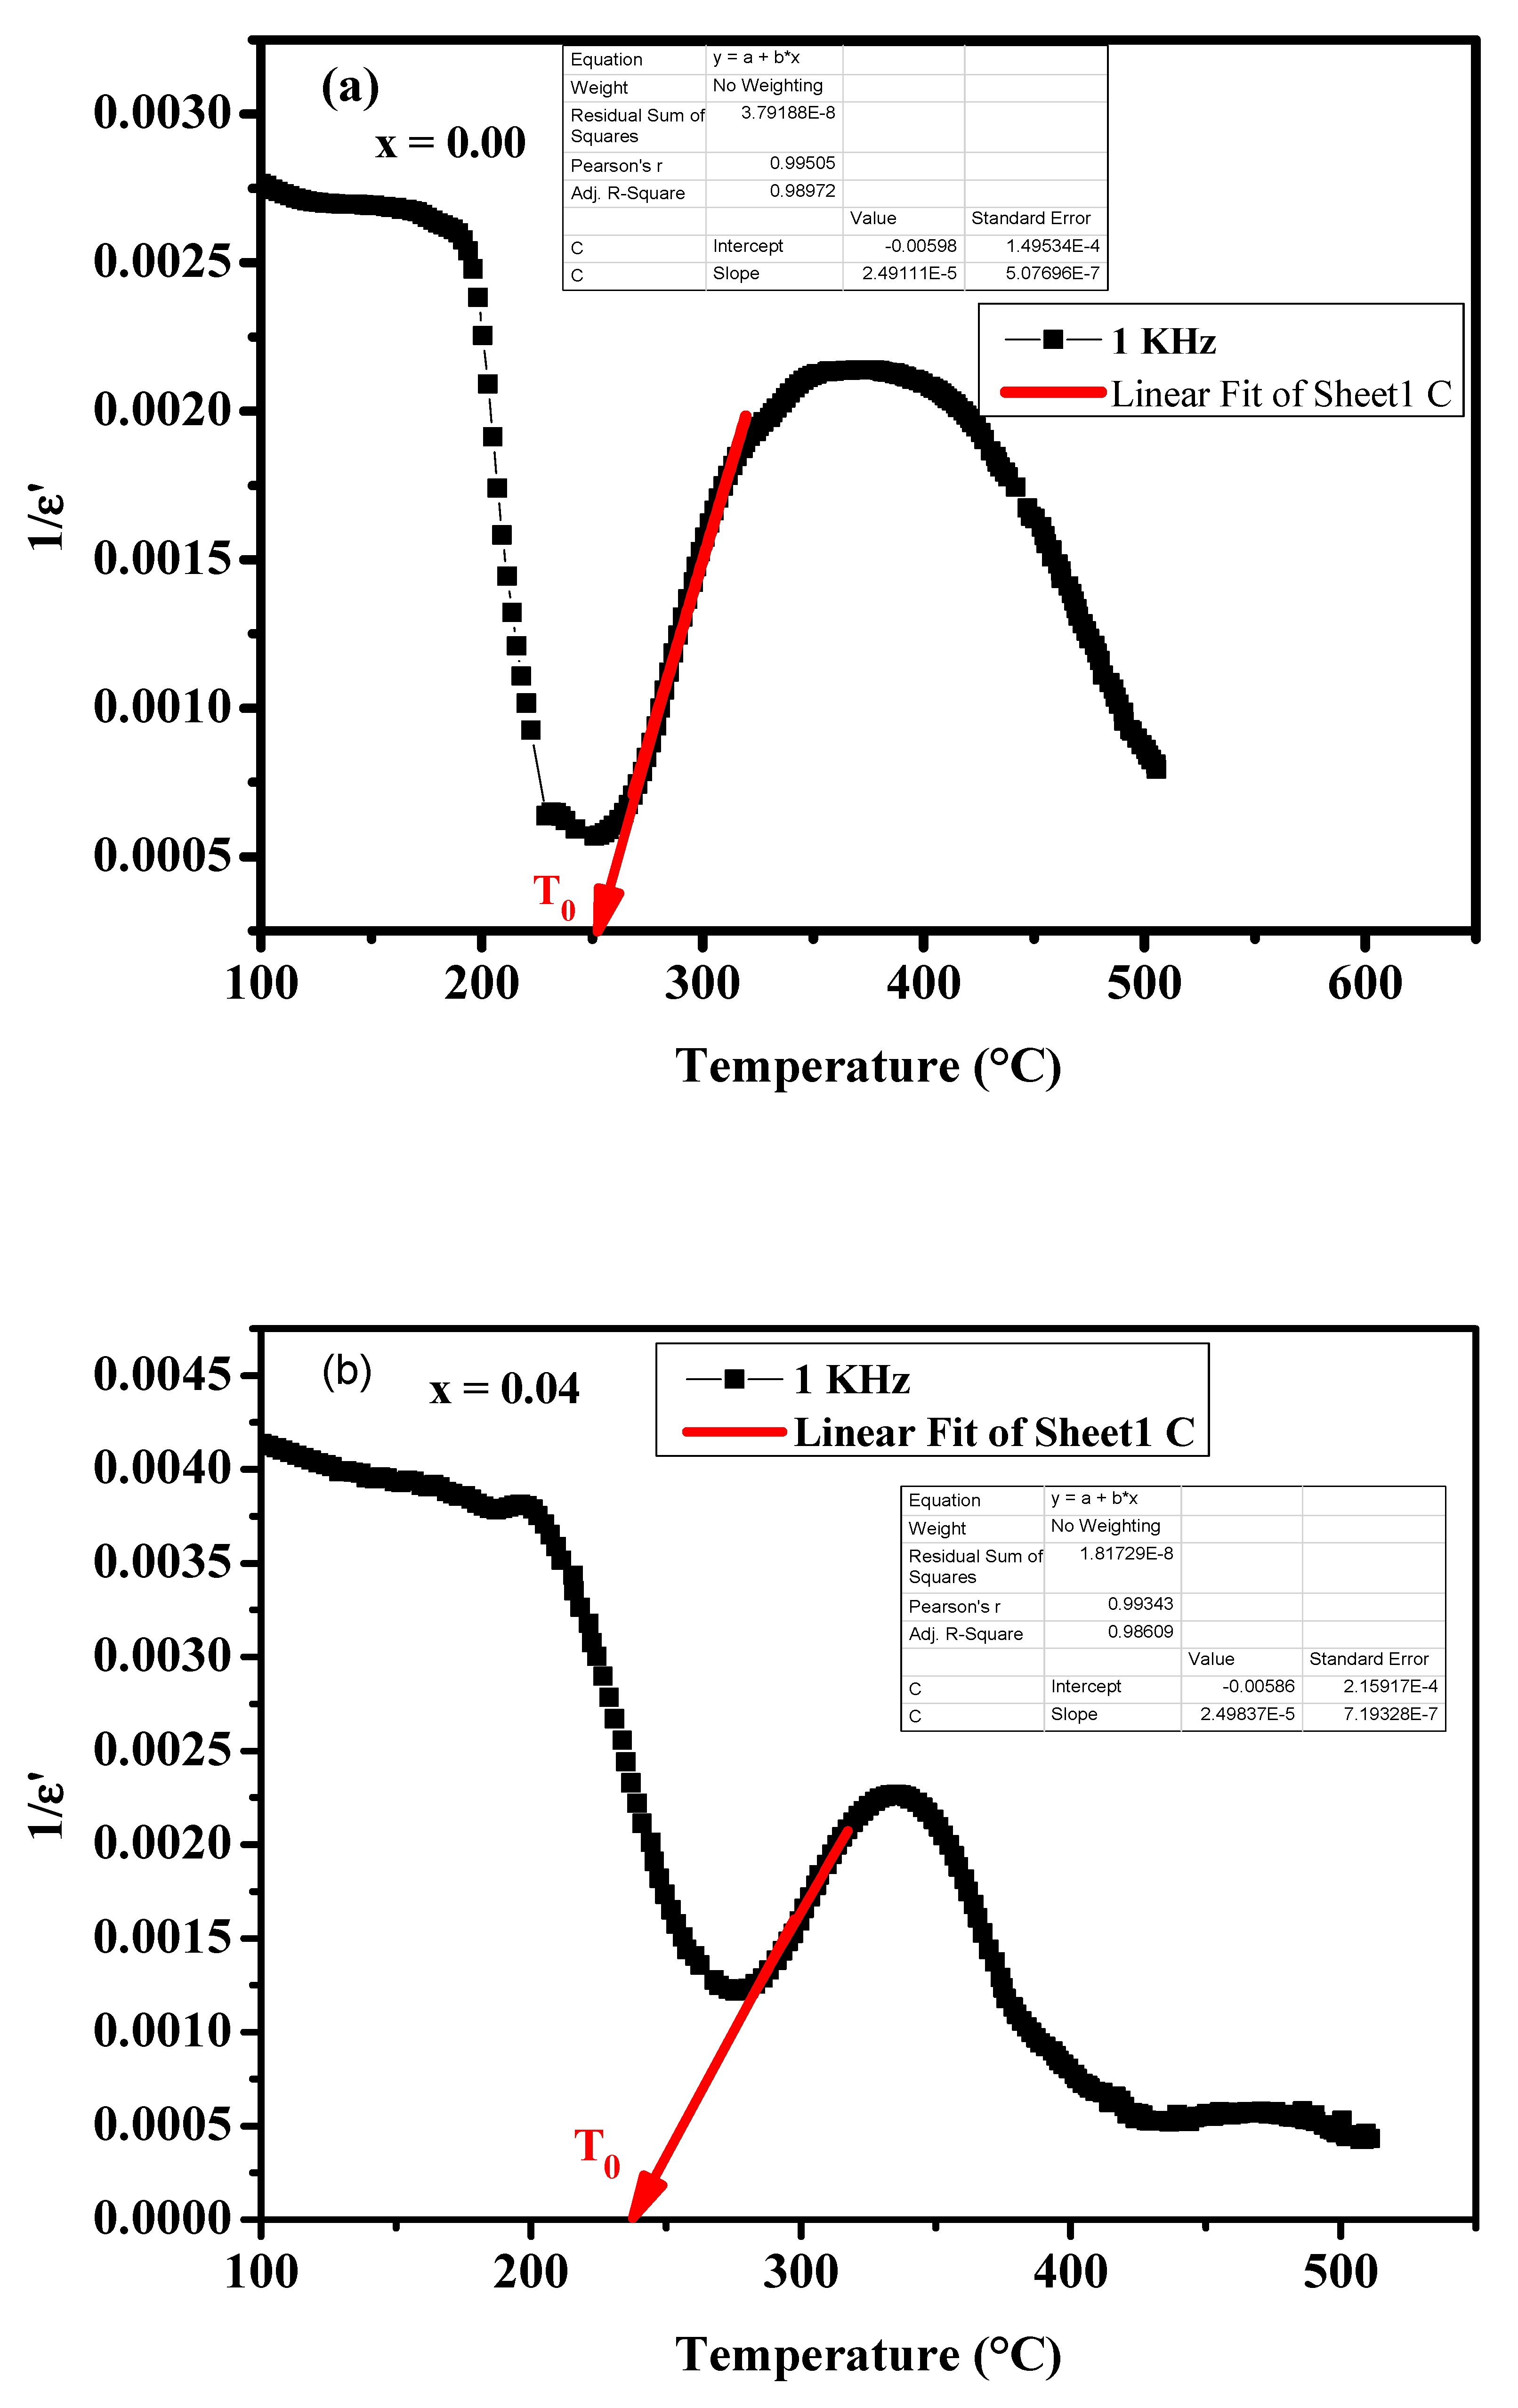
3.3.3. Phase Transition Order
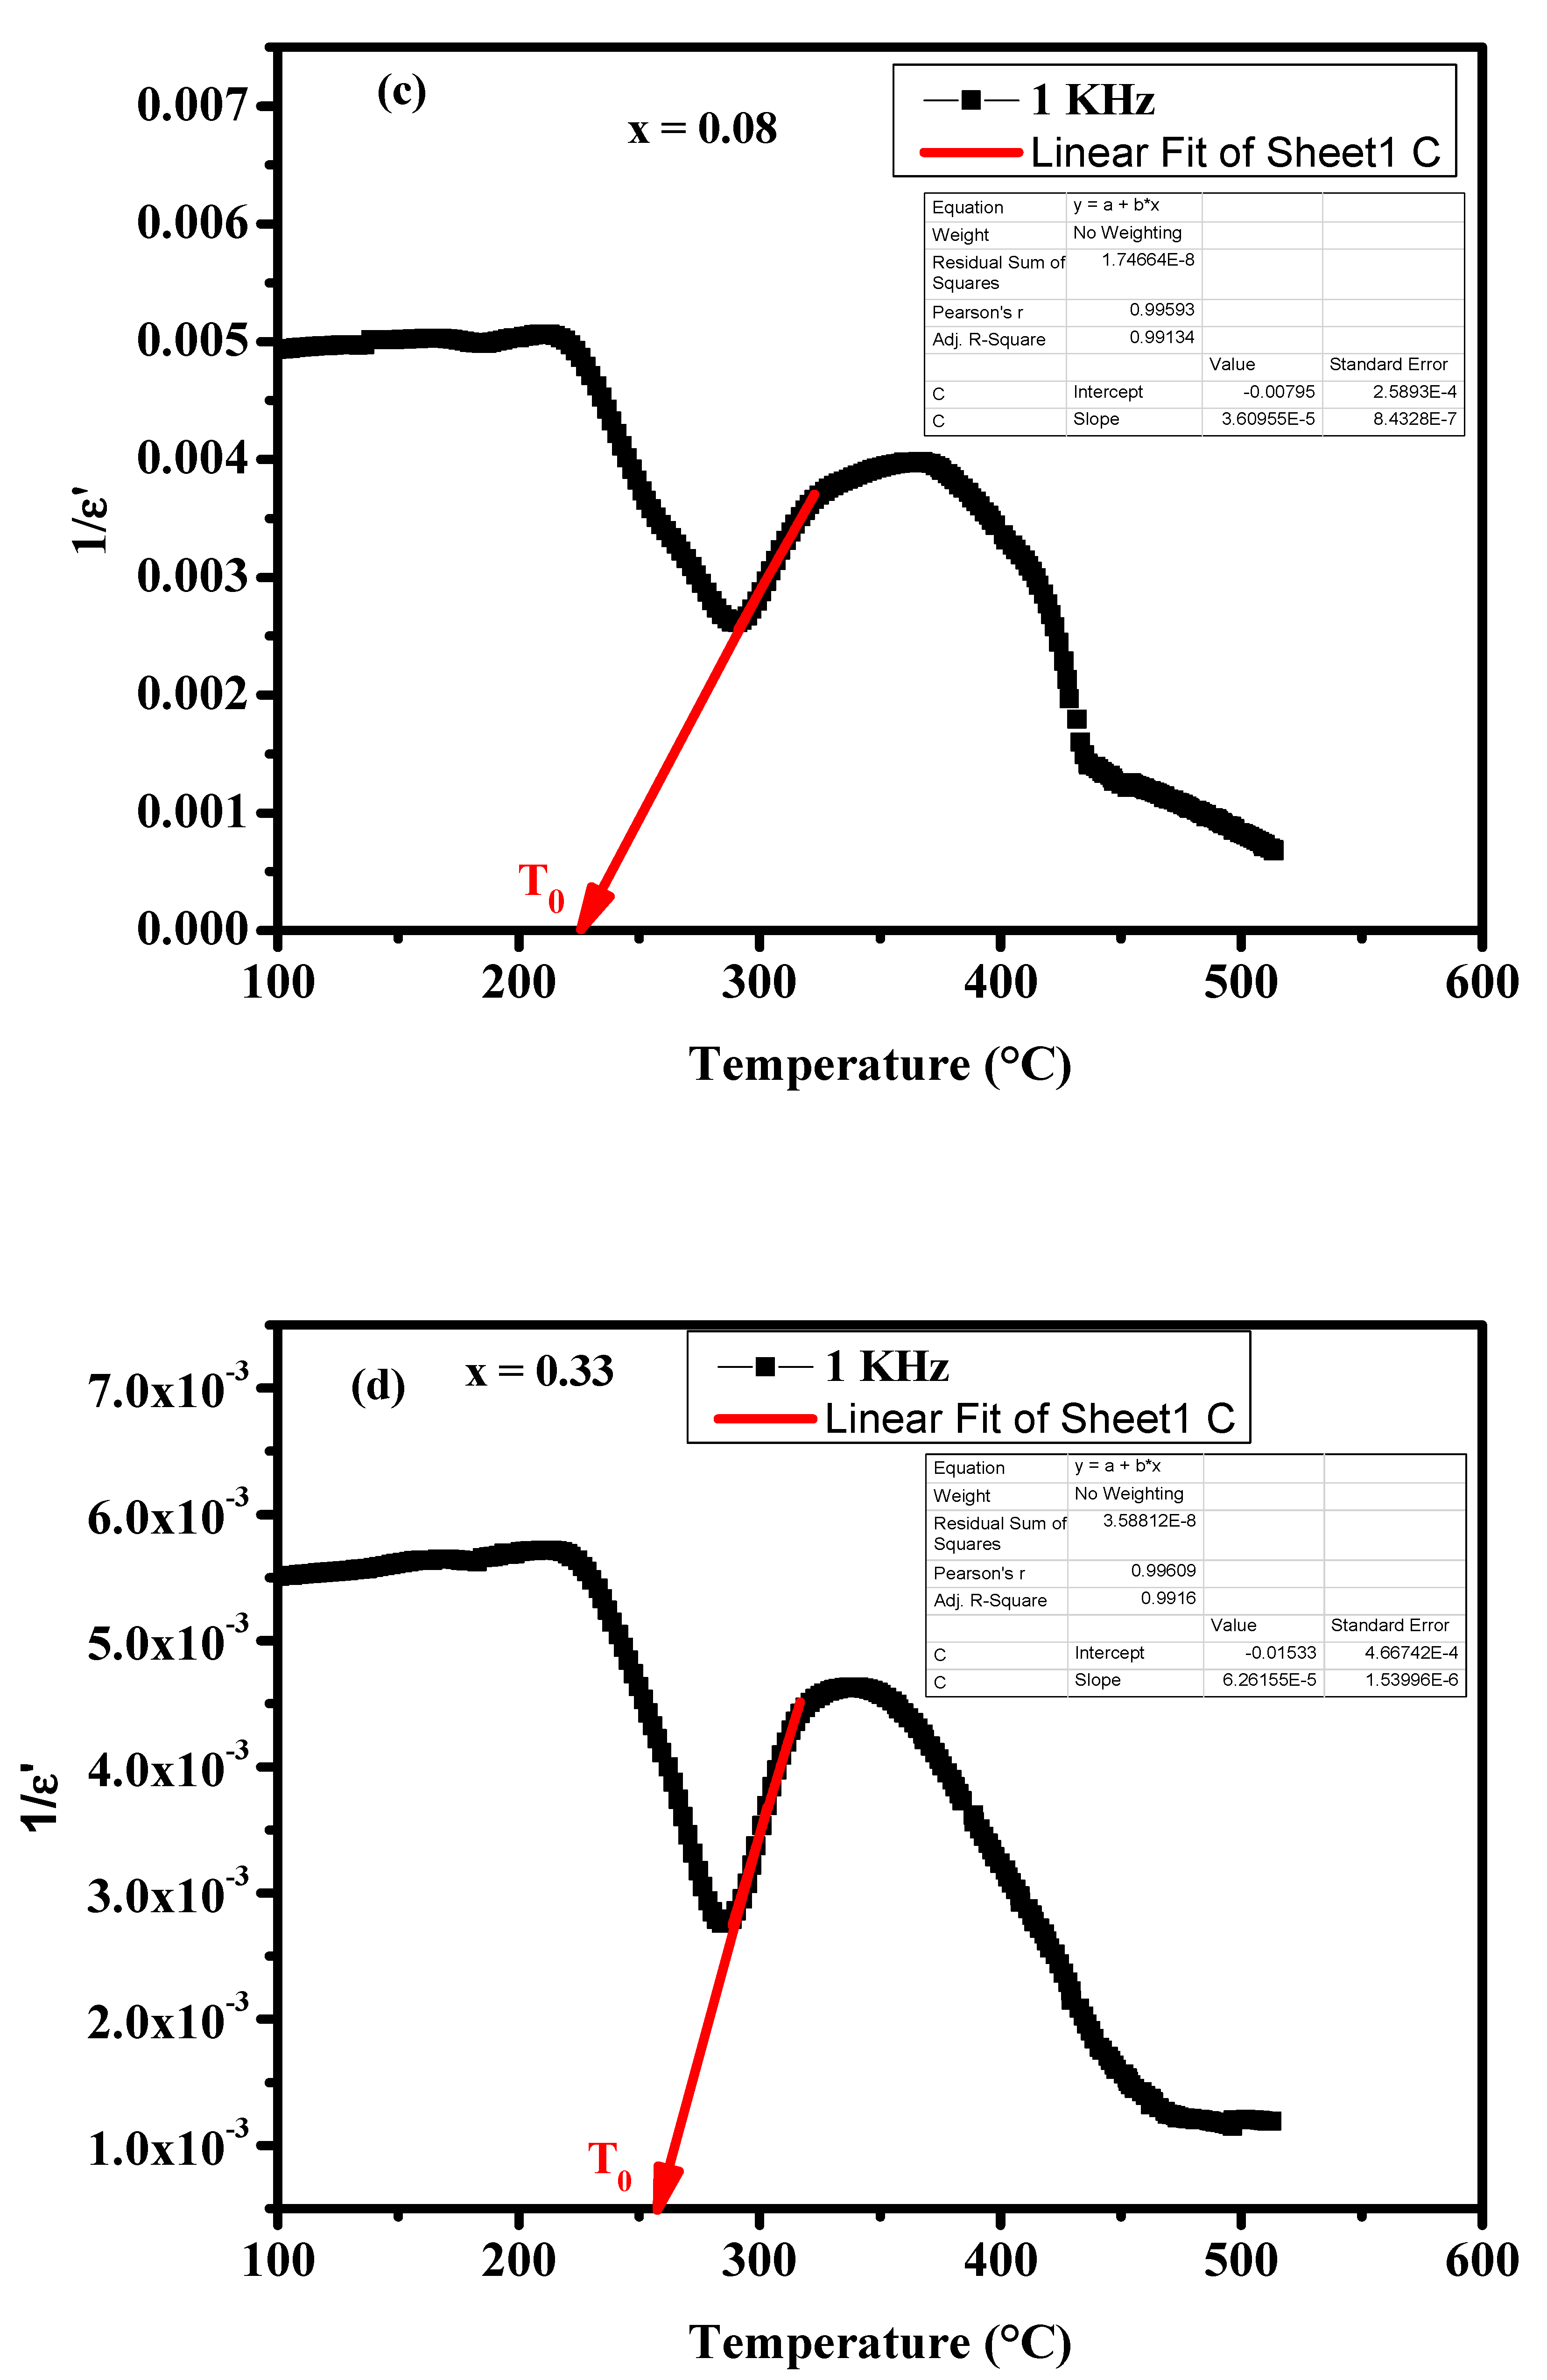
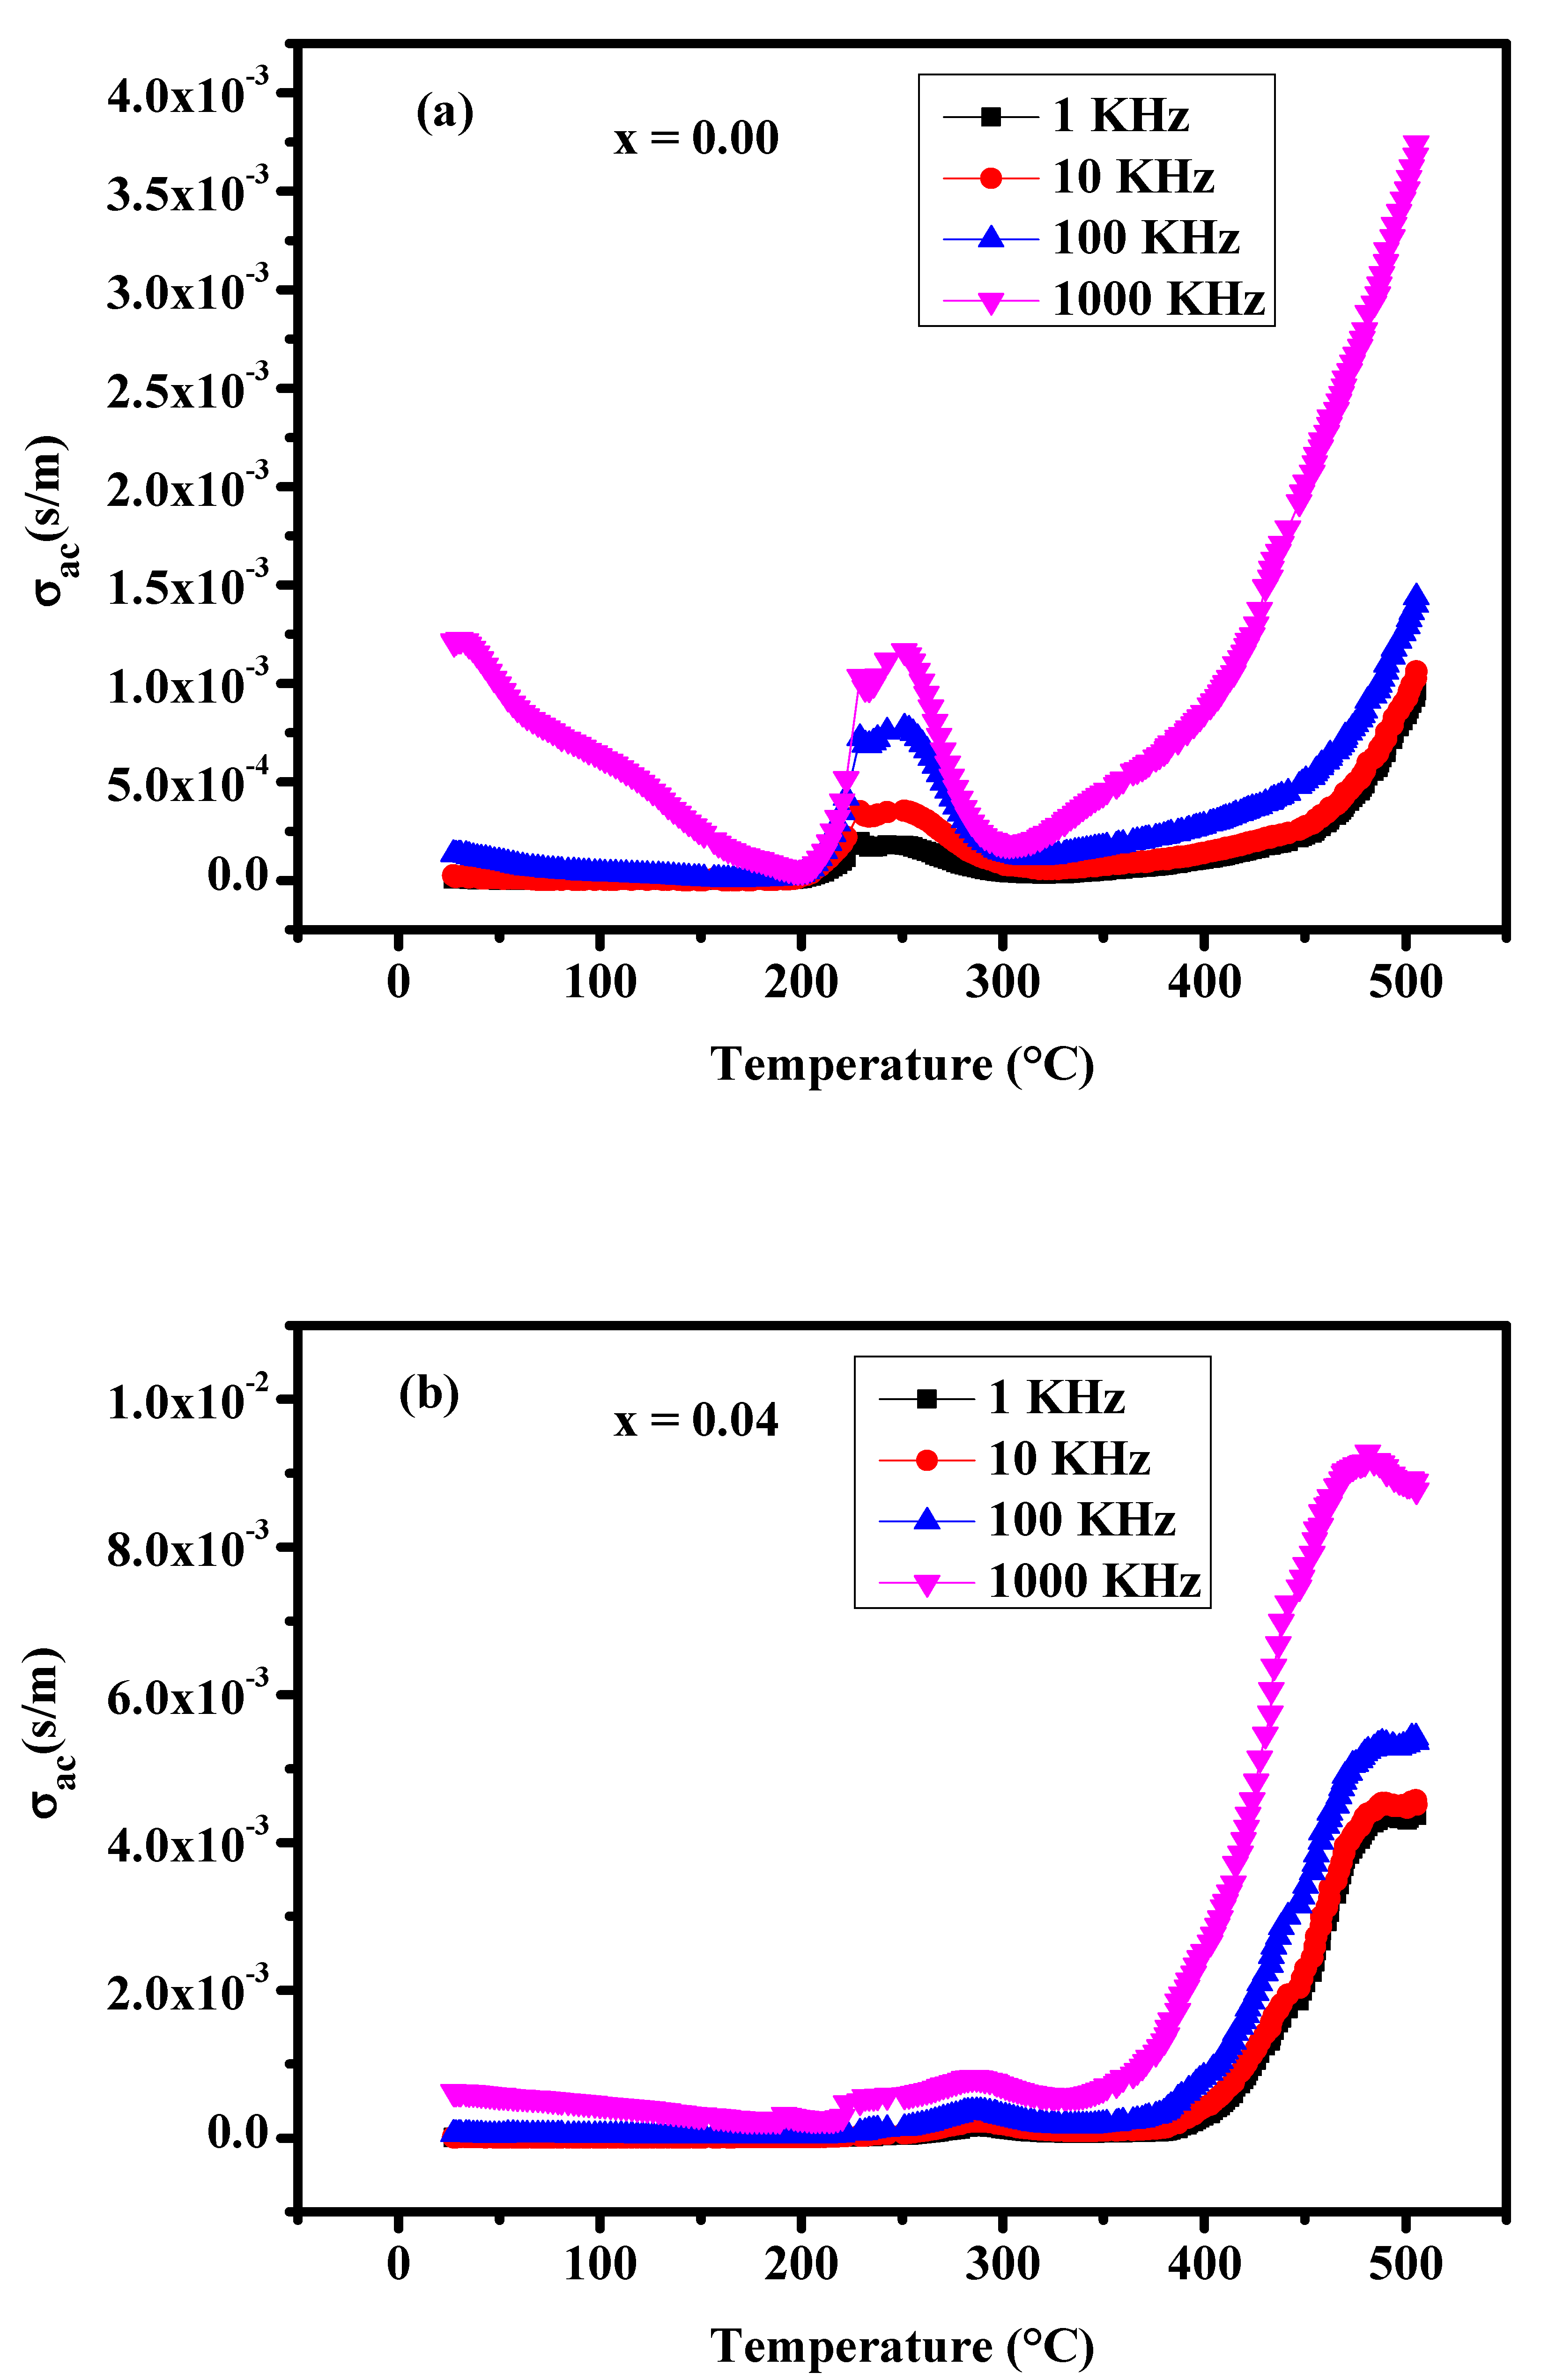
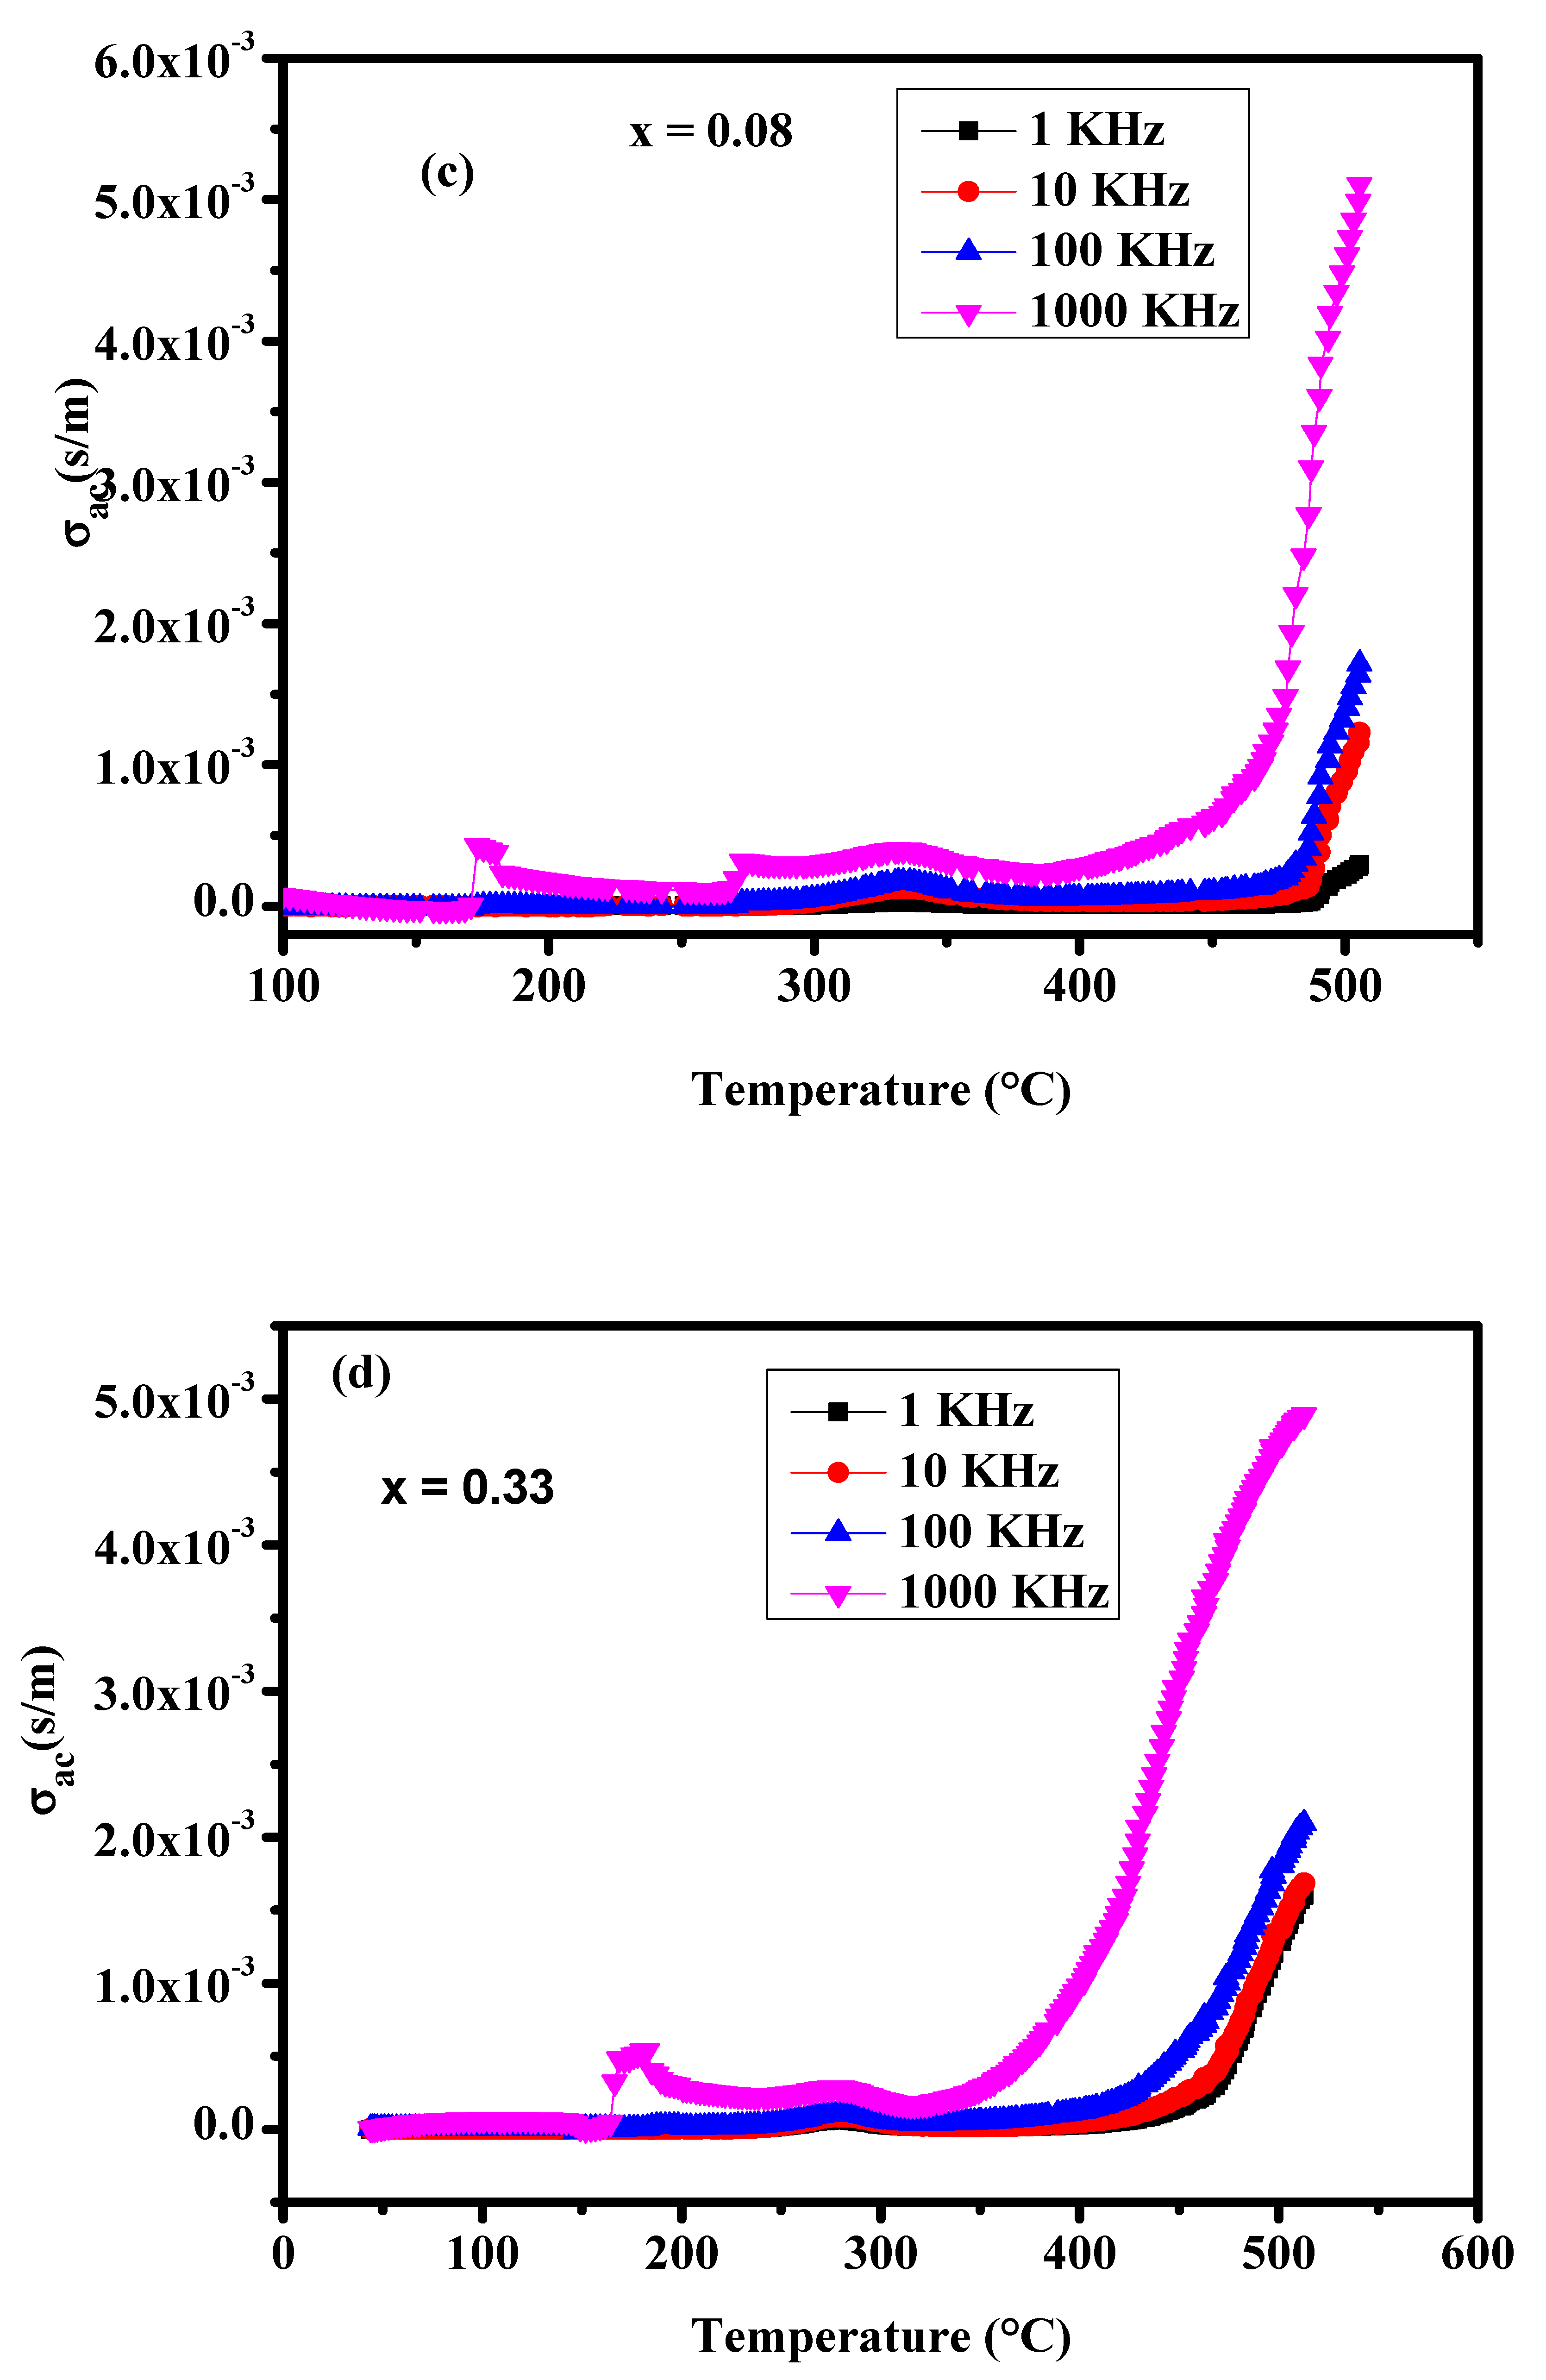
3.3.4. Study of the Conductivity in the Solid Solution
4. Conclusions
Author Contributions
Funding
Institutional Review Board Statement
Informed Consent Statement
Data Availability Statement
Acknowledgments
Conflicts of Interest
References
- Lanfredi, S.; Gênova, D.H.; Brito, I.A.; Lima, A.R.; Nobre, M.A. Structural characterization and Curie temperature determination of a sodium strontium niobate ferroelectric nanostructured powder. J. Solid-State Chem. 2011, 184, 990–1000. [Google Scholar] [CrossRef]
- Li, L.; Yang, B.; Chao, X.; Wu, D.; Wei, L.; Yang, Z. Effects of preparation method on the microstructure and electrical properties of tungsten bronze structure Sr2NaNb5O15 ceramics. Ceram. Int. 2019, 45, 558–565. [Google Scholar] [CrossRef]
- Josse, M.; Bidault, O.; Roulland, F.; Castel, E.; Simon, A.; Michau, D.; Von der Mühll, R.; Nguyen, O.; Maglione, M. The Ba2LnFeNb4O15 “tetragonal tungsten bronze”: Towards RT composite multiferroics. Solid State Sci. 2009, 11, 1118–1123. [Google Scholar] [CrossRef] [Green Version]
- Belarbi, M.; Tamraoui, Y.; Manoun, B.; Cantaluppi, A.; Gagou, Y.; Taibi, K.; El Marssi, M.; Lahmar, A. Structural, dielectric and energy storage properties of Neodymium niobate with tetragonal tungsten bronze structure. Phys. B Condens. Matter 2021, 618, 413185. [Google Scholar] [CrossRef]
- Lanfredi, S.; Praxedes, F.R.; Ivashita, F.F.; Paesano, A., Jr.; Nobre, M.A.L. Suppression of ferroelectric phase-transition in niobates via solid solution formation. Mater. Lett. 2019, 254, 85–88. [Google Scholar] [CrossRef]
- Botella, P.; Solsona, B.; Garcia-Gonzalez, E.; Gonzalez-Calbet, J.M.; Lopez Nieto, J.M. The hydrothermal synthesis of tetragonal tungsten bronze-based catalysts for the selective oxidation of hydrocarbons. Chem. Comm. 2007, 47, 5040–5042. [Google Scholar] [CrossRef]
- Yang, B.; Hao, S.; Yang, P.; Wei, L.; Yang, Z. Relaxor behavior and energy storage density induced by B-sites substitutions in (Ca0.28Ba0.72)2.1Na0.8Nb5O15 Tungsten bronze ceramics. Ceram. Int. 2018, 44, 8832–8841. [Google Scholar] [CrossRef]
- Shimizu, K.; Kato, H.; Kobayashi, M.; Kakihana, M. Synthesis and photocatalytic properties of tetragonal tungsten bronze type oxynitrides. Appl. Catal. B Environm. 2017, 206, 444–448. [Google Scholar] [CrossRef]
- Jindal, S.; Vasishth, A.; Devi, S.; Anand, G. A review on tungsten bronze ferroelectric ceramics as electrically tunable devices. Integr. Ferroelectr. 2018, 186, 1–9. [Google Scholar] [CrossRef]
- Thummavichai, K.; Xia, Y.; Zhu, Y. Recent progress in chromogenic research of tungsten oxides towards energy-related applications. Progress Mater. Sci. 2017, 88, 281–324. [Google Scholar] [CrossRef]
- Abrahams, S.C.; Jamieson, P.B.; Bernstein, J.L. Ferroelectric Tungsten Bronze-Type Crystal Structures. III. Potassium Lithium Niobate K(6−x−y)Li(4+x)Nb(10+y)O30. J. Chem. Phys. 1971, 54, 2355–2363. [Google Scholar] [CrossRef]
- Lanfredi, S.; Brito, I.A.O.; Polini, C.; Nobre, M.A.L. Deriving the magnitude of niobium off-center displacement in ferroelectric niobates from infrared spectroscopy. J. Appl. Spectrosc. 2012, 79, 254–260. [Google Scholar] [CrossRef]
- El, H.; Belghiti, A.; Simon, A.; Gravereau, P.; Villesuzanne, A.; Elaatmani, M.; Ravez, J. Ferroelectric and crystallographic properties of the Sr2− xK1+ xNb5O15−xFx solid solution. Sol. State Sci. 2002, 4, 933–940. [Google Scholar]
- Reau, J.M.; Elouadi, B.; Ravez, J.; Hagenmuller, P. Influence de la substitution tungstene-niobium sur les proprie´ te´ s cristallographiques et die´ lectriques de la solution solide de compositions limitesBa2. 50−xNa2xNb5O15 (0, 23 ≤ x ≤ 0, 60). Le systeme BaNb2O6(NaNbO3)2(WO3)2a1050 ° C. J. Solid State Chem. 1975, 15, 18–23. [Google Scholar] [CrossRef]
- Neqali, A.; Belboukhari, A.; Bensaid, H.; El Bouari, A.; Bih, L.; Alimoussa, A.; Habouti, S.; Mezzane, D. Diffuse phase transition and impedance spectroscopy analysis of Ba2.15−x Na0.7+ xNb5− xW x O15 (x = 0.25) ferroelectric ceramic. Appl. Phys. A 2016, 122, 1–8. [Google Scholar] [CrossRef]
- Chen, X.M.; Yang, J.S. Dielectric characteristics of ceramics in BaO–Nd2O3–TiO2–Ta2O5 system. J. Eur. Ceram. Soc. 1999, 19, 139–142. [Google Scholar] [CrossRef]
- Chen, X.M.; Liu, C.L.; Yang, J.S.; Wu, Y.J. Some Tungsten–Bronze Compounds in the BaO–Nd2O3–TiO2–Ta2O5 System. J. Solid State Chem. 1999, 148, 438–441. [Google Scholar] [CrossRef]
- Irvine, P.R.; Irvine, J.T.S. Synthesis and electrical characterisation of the tetragonal tungsten bronze type phases,(Ba/Sr/Ca/La)0.6MxNb1-xO3-δ (M = Mg, Ni, Mn, Cr, Fe, In, Sn): Evaluation as potential anode materials for solid oxide fuel cells. Solid State Ion. 1999, 124, 61–72. [Google Scholar]
- Simon, A.; Ravez, J. Solid-state chemistry and non-linear properties of tetragonal tungsten bronzes materials. C.R. Chim. 2006, 9, 1268–1276. [Google Scholar] [CrossRef]
- Stennett, M.C.; Miles, G.C.; Sharman, J.; Reaney, I.M.; West, A.R. A new family of ferroelectric tetragonal tungsten bronze phases, Ba2MTi2X3O15. J. Eur. Ceram. Soc. 2005, 25, 2471–2475. [Google Scholar] [CrossRef]
- Stennett, M.C.; Reaney, I.M.; Miles, G.C.; Woodward, D.I.; West, A.R.; Kirk, C.A.; Levin, I. Dielectric and structural studies of Ba2MTi2Nb3O15 (BMTNO15, M= Bi3+, La3+, Nd3+, Sm3+, Gd3+) tetragonal tungsten bronze-structured ceramics. J. Appl. Phys. 2007, 101, 4114. [Google Scholar] [CrossRef]
- Arnold, D.C.; Morrison, F.D. B-cation effects in relaxor and ferroelectric tetragonal tungsten bronzes. J. Mater. Chem. 2009, 19, 6485–6488. [Google Scholar] [CrossRef]
- Zu, X.; Fu, M.; Stennett, M.C.; Villarinho, P.M.; Levin, I.; Randall, C.A.; Gardner, J.; Morrison, F.D.; Reaney, I.M. A crystal-chemical framework for relaxor versus normal ferroelectric behavior in tetragonal tungsten bronzes. Chem. Matter 2015, 27, 3250–3261. [Google Scholar]
- Hu, C.; Fang, L.; Peng, X.; Li, C.; Wu, B.; Liu, L. Dielectric and ferroelectric properties of tungsten bronze ferroelectrics in SrO–Pr2O3–TiO2–Nb2O5 system. Mater. Chem. Phys. 2010, 121, 114–117. [Google Scholar] [CrossRef]
- Miller, A.J.; Rotaru, A.; Arnold, D.C.; Morrison, F.D. Effect of local A-strain on dipole stability in A6GaNb9O30 (A = Ba, Sr, Ca) tetragonal tungsten bronze relaxor dielectrics. Dalton Trans. 2015, 44, 10738–10745. [Google Scholar] [CrossRef] [Green Version]
- Available online: https://materials.springer.com/bp/docs/978-3-540-31353-3 (accessed on 1 January 2005).
- González-Abreu, Y.; Peláiz-Barranco, A.; Suarez-Gonzalez, L.C.; Guerra, J.D.S. Effects of polarons and oxygen vacancies on dielectric relaxation and electrical conductivity behavior in a lead-free relaxor ferroelectric. J. Alloys Compd. 2019, 787, 140–144. [Google Scholar] [CrossRef]
- Rotaru, A.; Arnold, D.C.; Daoud-Aladine, A.; Morrison, F.D. Origin and stability of the dipolar response in a family of tetragonal tungsten bronze relaxors. Phys. Rev. B 2011, 83, 184302. [Google Scholar] [CrossRef] [Green Version]
- Damjanovic, D. Ferroelectric, dielectric and piezoelectric properties of ferroelectric thin films and ceramics. Rep. Prog. Phys. 1998, 61, 1267. [Google Scholar] [CrossRef] [Green Version]
- Rotaru, A.; Schiemer, J.A.; Carpenter, M.A. Elastic and anelastic relaxations accompanying relaxor dielectric behaviour of Ba6GaNb9O30 tetragonal tungsten bronze from resonant ultrasound spectroscopy. J. Therm. Anal. Calorim. 2016, 124, 571–583. [Google Scholar] [CrossRef] [Green Version]
- Chchiyai, Z.; El Bachraoui, F.; Tamraoui, Y.; Bih, L.; Lahmar, A.; Alami, J.; Manoun, B. Design, structural evolution, optical, electrical and dielectric properties of perovskite ceramics Ba1-xBixTi1-xFexO3 (0 ≤ x ≤ 0.8). Mater. Chem. Phys. 2021, 273, 125096. [Google Scholar] [CrossRef]
- Das, B.C.; Hossain, A.A. Rietveld refined structure, ferroelectric, magnetic and magnetoelectric response of Gd-substituted Ni-Cu-Zn ferrite and Ca, Zr co-doped BaTiO3 multiferroic composites. J. Alloys Compd. 2021, 867, 159068. [Google Scholar] [CrossRef]
- Sanjuán, M.L.; Kuhn, A.; Azcondo, M.T.; García-Alvarado, F. Proton and Deuteron Exchange in TTB-Like Na1.2Nb1.2W0.8O6: Structural Characterization and Spectroscopic Study. Eur. J. Inorg. Chem. 2008, 2008, 49–58. [Google Scholar] [CrossRef]
- Ikeda, T.; Haraguchi, T.; Onodera, Y.; Saito, T. Some compounds of tungsten-bronze type A6B10O30 (B = Nb, Ti or Nb, W). Jpn. J. Appl. Phys. 1971, 10, 987–994. [Google Scholar] [CrossRef]
- Adachi, M.; Akishige, Y.; Asahi, T.; Deguchi, K.; Gesi, K.; Hasebe, K.; Hikita, T.; Ikeda, T.; Iwata, Y.; Komukae, M.; et al. “Ba3Na3MoNb9O30” in “Ferroelectric and Related Substances” Landolt-Börnstein—Group III Condensed Matter 36A2. Available online: https://materials.springer.com/bp/docs/978-3-540-31349-6 (accessed on 3 February 2023).
- Marinder, B.-O. Phases in the NaNbO3-Nb2O5-WO3 System: Derivation of Complex Structures by Twinning, Fourling and Anti-phase-Boundary Operations on the ReO3. Ph.D. Thesis, Stockholm University, Stockholm, Sweden, 1986. [Google Scholar]
- Sundberg, M.; Marinder, B.-O. High resolution electron microscopy study in the NaNbO3- Nb2O5- WO3 system. J. Solid State Chem. 1990, 84, 23–38. [Google Scholar] [CrossRef]
- Bouillaud, Y.; Bonnin, F. Stoechiométrie du métaniobate de sodium. Bull. Soc. Fr. Miner. Crist. 1965, 88, 700–701. [Google Scholar] [CrossRef]
- Blasse, G.; dePauw, A.D.M. Crystal structure of some Li Me5+ Me6+ O6 compounds. J. Inorg. Nucl. Chem. 1970, 32, 3960–3961. [Google Scholar] [CrossRef]
- Thakre, O.B.; Chincholkar, V.S. New Compounds Of The A + B 5+ B 6+ O 6 2- Type I Structure. Curr. Sci. 1972, 41, 735–736. [Google Scholar]
- Michel, C.; Groult, D.; Deschanvres, A.; Raveau, B. Proprietes d’echange d’ions des pyrochlores AB2O6—II Evolution thermique des pyrochlores AMWO6. H2O (A = Li, Na, Ag; M = Nb, Ta, Sb). J. Inorg. Nucl. Chem. 1975, 37, 251–255. [Google Scholar] [CrossRef]
- Kuhn, A.; Bashir, H.; Dos Santos, A.L.; Acosta, J.L.; GarciaAlvarado, F. New protonic solid electrolyte with tetragonal tungsten bronze structure obtained through ionic exchange. J. Solid State Chem. 2004, 177, 2366–2372. [Google Scholar] [CrossRef]
- Kuhn, A.; Azcondo, M.T.; Amador, U.; Boulahya, K.; Sobrados, I.; Sanz, J.; García-Alvarado, F. Structural Characterization and NMR Study of NaNbWO6 and Its Proton-Exchanged Derivatives. Inorg. Chem. 2007, 46, 5390–5397. [Google Scholar] [CrossRef] [PubMed]
- Es-soufi, H.; Bih, H.; Bih, L.; Rajesh, R.; Lima, A.R.F.; Sayyed, M.I.; Mezher, R. Rietveld Refinement, Structural Characterization, and Methylene Blue Adsorption of the New Compound Ba0. 54Na0. 46Nb1. 29W0. 37O5. Crystals 2022, 12, 1695. [Google Scholar] [CrossRef]
- Toby, B.H.; Von Dreele, R.B. GSAS-II: The genesis of a modern open-source all purpose crystallography software package. J. Appl. Crystallogr. 2013, 46, 544–549. [Google Scholar] [CrossRef]
- Vaitkus, A.; Merkys, A.; Gražulis, S. Validation of the Crystallography Open Database using the Crystallographic Information Framework. J. Appl. Crystallogr. 2021, 54, 661–672. [Google Scholar] [CrossRef] [PubMed]
- Sebastian, M.T. Dielectric Materials for Wireless Communication, 1st ed.; Elsevier Science: Amsterdam, The Netherlands, 2008. [Google Scholar]
- Yanalak, G.; Ozen, A.; Sarılmaz, A.; Keles, A.; Aslan, E.; Ozel, F.; Patir, I.H. Scheelite-type BaMoO4 and BaWO4 based dye sensitized photocatalytic hydrogen evolution by water splitting. J. Phys. Chem. Solids 2022, 168, 110821. [Google Scholar] [CrossRef]
- Nobrega, F.A.C.; Abreu, R.F.; Colares, D.D.M.; Silva, M.A.S.; do Carmo, F.F.; Abreu, T.O.; do Nascimento, J.P.C.; Sales, J.C.; Silva, R.S.; Goes, J.C.; et al. Influence of the addition of CaTiO3 on the microwave dielectric properties of the BaMoO4 matrix. Mater. Chem. Phys. 2022, 289, 126478. [Google Scholar] [CrossRef]
- Shannon, R.D. Revised effective ionic radii and systematic studies of interatomic distances in halides and chalcogenides. Acta Crystallogr. Sect. A Cryst. Phys. Diffr. Theor. Gen. Crystallogr. 1976, 32, 751–767. [Google Scholar] [CrossRef]
- Xu, S.; Peng, Z.; Shi, H.; Chao, X.; Wu, D.; Liang, P.; Yang, Z. Electrical conduction behavior in nonstoichiometric BaBixNb5O15±δ tungsten bronze ceramics. Ceram. Int. 2021, 47, 22382–22389. [Google Scholar] [CrossRef]
- Wilde, R.E. Raman spectrum of Sr0.61Ba0.39Nb2O6. J. Raman Spectrosc. 1991, 22, 321. [Google Scholar] [CrossRef]
- Liu, G.; Zhang, S.; Jiang, W.; Cao, W. Losses in ferroelectric materials. Mater. Sci. Eng. R Rep. 2015, 89, 1–48. [Google Scholar] [CrossRef] [Green Version]
- Jebli, M.; Rayssi, C.; Dhahri, J.; Henda, M.B.; Belmabrouk, H.; Bajahzar, A. Structural and morphological studies, and temperature/frequency dependence of electrical conductivity of Ba 0.97La 0.02 Ti 1− xNb4x/5O3 perovskite ceramics. RSC Adv. 2021, 11, 23664–23678. [Google Scholar] [CrossRef]
- Krupska-Klimczak, M.; Jankowska-Sumara, I.; Gwizd, P.; Koralewski, M.; Soszyński, A. Composition-Related Dielectric, Ferroelectric and Electrocaloric Properties of Pb5Ge3O11 Single Crystals Modified by Ba Ions. Materials 2023, 16, 413. [Google Scholar] [CrossRef] [PubMed]
- Lines, M.E.; Glass, A.M. Principles and Applications of Ferroelectrics and Related Materials; Oxford University Press Inc.: New York, NY, USA, 1977. [Google Scholar]
- Dolgos, M.; Adem, U.; Wan, X.; Xu, Z.; Bell, A.J.; Comyn, T.P.; Stevenson, T.; Bennett, J.; Claridge, J.B.; Rosseinsky, M.J. Chemical control of octahedral tilting and off-axis A cation displacement allows ferroelectric switching in a bismuth-based perovskite. Chem. Sci. 2012, 3, 1426–1435. [Google Scholar] [CrossRef]
- Godara, S.; Kumar, B. Effect of Ba–Nb co-doping on the structural, dielectric, magnetic and ferroelectric properties of BiFeO3 nanoparticles. Ceram. Int. 2015, 41, 6912–6919. [Google Scholar] [CrossRef]
- Connolly, T.F.; Hawkins, D.T. Tungsten Bronze Type and Layer Structure Oxides. Ferroelectr. Lit. Index 1974, 161–174. [Google Scholar] [CrossRef]
- Neurgaonkar, R.R.; Oliver, J.R.; Cross, L.E. Ferroelectric properties of tetragonal tungsten bronze single crystals. Ferroelectrics 1984, 56, 1035. [Google Scholar] [CrossRef]
- Gagou, Y.; Dellis, J.L.; El Marssi, M.; Lukyanchuk, I.; Mezzane, D.; Elaatmani, M. Ferroelectric Phases in Rare-Earth TTB Ferroelectric Compounds Pb2(1-x) K(1 + x)GdxNb5O15. Ferroelectrics 2007, 359, 94–98. [Google Scholar] [CrossRef]
- Taifi, E.; Lukyanchuk, I.; El Amraoui, Y.; Mezzane, D.; Gagou, Y. Monte Carlo study of ferroelectric properties of tetragonal tungsten bronze compounds. Ferroelectrics 2010, 397, 1–8. [Google Scholar] [CrossRef]
- Duan, R.G.; Kuntz, J.D.; Garay, J.E.; Mukherjee, A.K. Metal-like electrical conductivity in ceramic nano-composite. Scr. Mater. 2004, 50, 1309–1313. [Google Scholar] [CrossRef]
- Khaliullina, A.; Meshcherskikh, A.; Pankratov, A.; Dunyushkina, L. Effect of Sr Deficiency on Electrical Conductivity of Yb-Doped Strontium Zirconate. Materials 2022, 15, 4126. [Google Scholar] [CrossRef]
- Hossen, M.B.; Alam, M.S.; Eman, N.M.; Shirin, N.J. Thermal response of dielectric, impedance and modulus spectroscopy study of NCZA bulk ceramics. Phase Transit. 2019, 92, 719–729. [Google Scholar] [CrossRef]


| Composition | x = 0.04 | x = 0.08 | x = 0.33 |
|---|---|---|---|
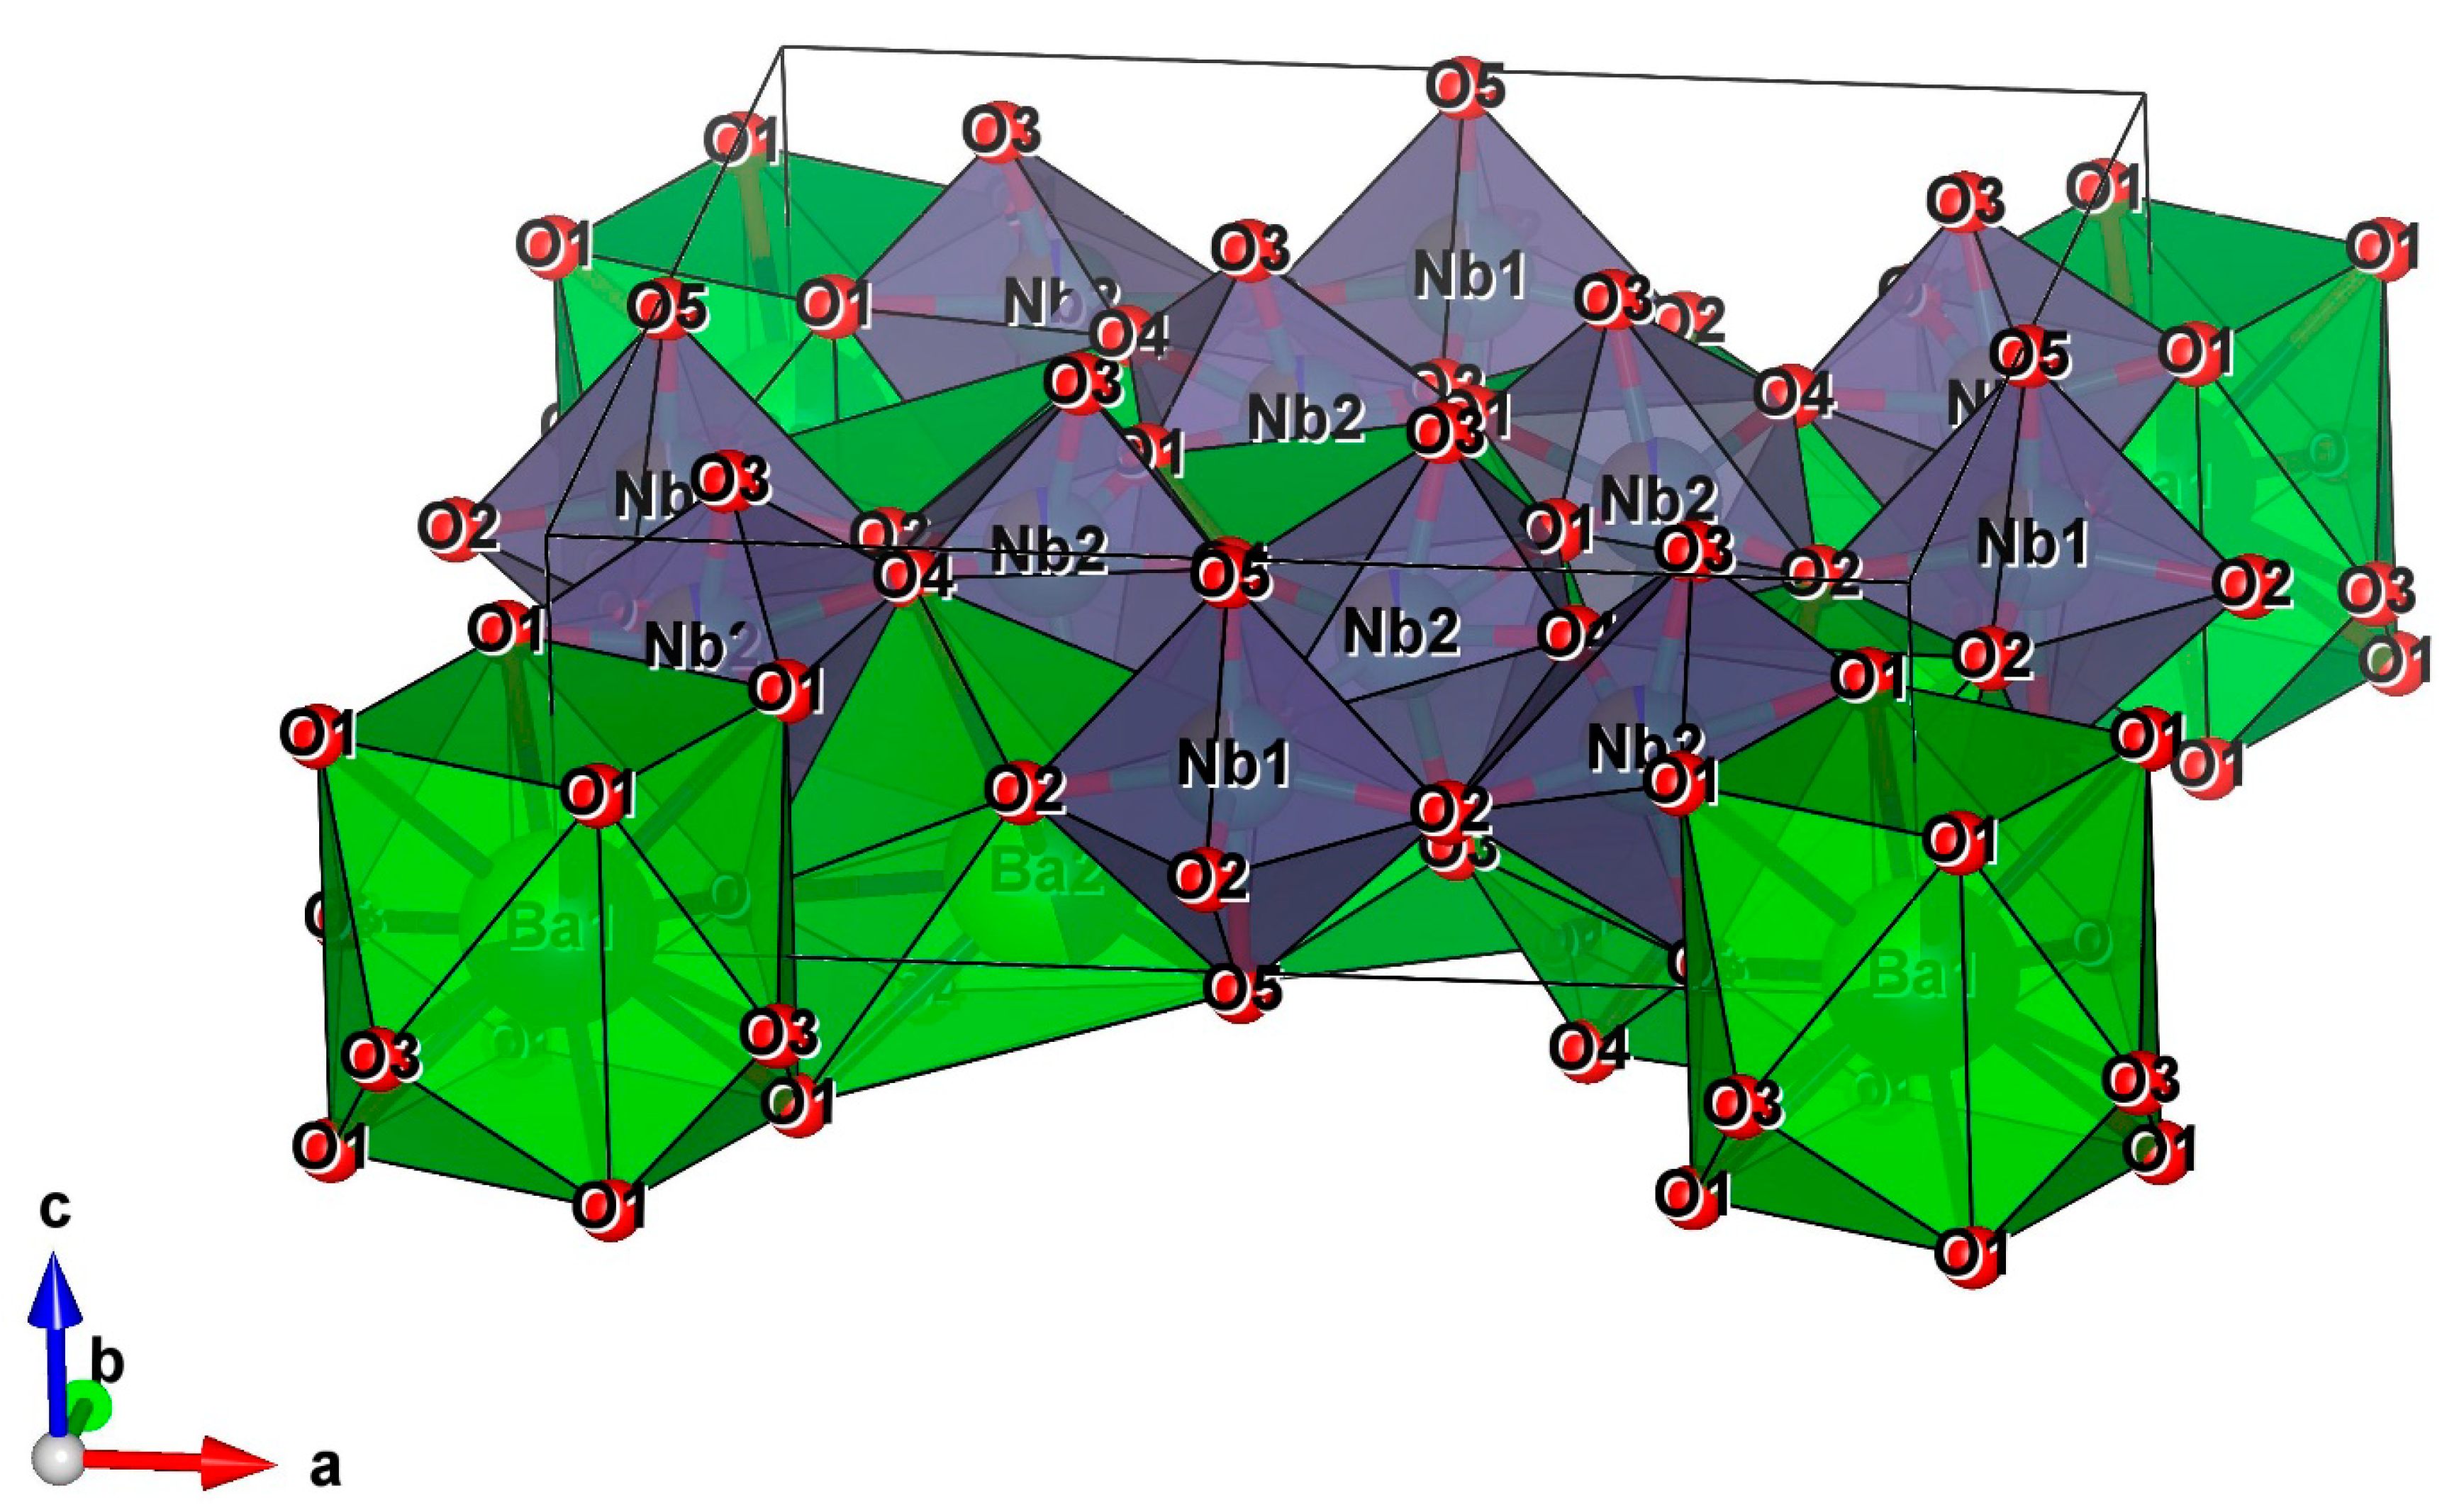
| Symmetry | Tetragonal | Tetragonal | Phase 1: Tetragonal; Phase 2: Tetragonal |
| Space Group | P4bm | P4bm | Phase 1: P4bm Phase 2: I 41/a |
| Z | 6 | 6 | Phase 1: 6 Phase 2: 4 |
| Lattice Parameters (Å) | a = b = 12.40430 (10); c = 3.95059 (6) | a = b = 12.41525 (12); c = 3.95844 (7) | Phase 1: a = b = 12.41681 (17); c = 3.97203 (8) Phase 2: a = b = 5.59091 (22); c = 12.8173 (7) |
| Volume (Å3) | 607.865 (15) | 610.146 (15) | Phase 1: 612.396 (21) Phase 2: 400.65 (4) |
| Calculated Density (g/cm3) | 5.729 | 5.698 | Phase 1: 5.272 Phase 2: 4.928 |
| Chemical Formula Weight (g/mol) | 349.52 | 348.96 | Phase 1: 324.02 Phase 2: 297.27 |
| Rp | 7.79 | 9.51 | 10.11 |
| Rwp | 10.48 | 12.69 | 13.26 |
| χ2 | 1.837 | 2.249 | 2.744 |
| GOF | 1.36 | 1.50 | 1.66 |
| Composition | Atom | Wyckoff | x | y | z | Occupation | Uiso |
|---|---|---|---|---|---|---|---|
| X = 0.04 | Ba1 | 2a | 0 | 0 | 0.05 | 0.716 | 0.800 (12) |
| Na1 | 2a | 0 | 0 | 0.05 | 0.284 | 0.800 (12) | |
| Ba2 | 4c | 0.17310 (15) | 0.67310 (15) | 0.01270 (15) | 0.454 | 0.0524 (9) | |
| Na2 | 4c | 0.17310 (15) | 0.67310 (15) | 0.01270 (15) | 0.546 | 0.0524 (9) | |
| Nb1 | 2b | 0 | 0.5 | 0.5 | 0.82 | 0.0301 (9) | |
| W1 | 2b | 0 | 0.5 | 0.5 | 0.039 | 0.09 | |
| Mo1 | 2b | 0 | 0.5 | 0.5 | 0.125 | 0.03077 | |
| Nb2 | 8d | 0.07581 (8) | 0.20922 (8) | 0.50822 (8) | 0.761 | 0.2105 (19) | |
| W2 | 8d | 0.07581 (8) | 0.20922 (8) | 0.50822 (8) | 0.239 | 0.00555 | |
| O1 | 8d | 0.1337 (9) | 0.0825 (8) | 0.446 (10) | 1 | 0.1174 (30) | |
| O2 | 8d | 0.3543 (8) | 0.0126 (10) | 0.402 (9) | 1 | 0.1174 (30) | |
| O3 | 8d | 0.0473 (10) | 0.1997 (8) | 0.065 (7) | 1 | 0.1174 (30) | |
| O4 | 4c | 0.294 | 0.794 | 0.575 | 1 | 0.1174 (30) | |
| O5 | 2b | 0 | 0.5 | −0.02 | 1 | 0.65 (6) | |
| X = 0.08 | Ba1 | 2a | 0 | 0 | 0.05 | 0.716 | 0.800 (11) |
| Na1 | 2a | 0 | 0 | 0.05 | 0.284 | 0.800 (11) | |
| Ba2 | 4c | 0.17347 (13) | 0.67347 (13) | 0.01308 (13) | 0.454 | 0.0204 (7) | |
| Na2 | 4c | 0.17347 (13) | 0.67347 (13) | 0.01308 (13) | 0.546 | 0.0069 (7) | |
| Nb1 | 2b | 0 | 0.5 | 0.5 | 0.75 | 0.0332 (8) | |
| Mo1 | 2b | 0 | 0.5 | 0.5 | 0.25 | 0.0329 (8) | |
| Nb2 | 8d | 0.07595 (9) | 0.20935 (9) | 0.50835 (9) | 0.761 | 0.01819 (34) | |
| W2 | 8d | 0.07595 (9) | 0.20935 (9) | 0.50835 (9) | 0.239 | 0.79798 (34) | |
| O1 | 8d | 0.1567 (9) | 0.0724 (10) | 0.535 (12) | 1 | 0.1116 (16) | |
| O2 | 8d | 0.3447 (6) | 0.0140 (6) | 0.519 (12) | 1 | 0.0092 (16) | |
| O3 | 8d | 0.0560 (7) | 0.2038 (6) | 0.032 (7) | 1 | 0.0287 (16) | |
| O4 | 4c | 0.2844 (7) | 0.7844 (7) | 0.581 (5) | 1 | 0.0190 (16) | |
| O5 | 2b | 0 | 0.5 | −0.02 | 1 | 0.0532 (16) | |
| X = 0.33 | Ba1 | 2a | 0 | 0 | 0.05 | 0.716 | 0.800 (13) |
| Na1 | 2a | 0 | 0 | 0.05 | 0.284 | 0.800 (13) | |
| Ba2 | 4c | 0.17500 (19) | 0.67500 (19) | 0.01460 (19) | 0.454 | 0.0239 (10) | |
| Na2 | 4c | 0.17500 (19) | 0.67500 (19) | 0.01460 (19) | 0.546 | 0.0239 (10) | |
| Nb1 | 2b | 0 | 0.5 | 0.5 | 0.82 | 0.0328 (12) | |
| Mo1 | 2b | 0 | 0.5 | 0.5 | 0.164 | 0.0328 (12) | |
| Nb2 | 8d | 0.07176 (13) | 0.21142 (14) | 0.4854 (16) | 0.761 | 0.0324 (4) | |
| Mo2 | 8d | 0.07176 (13) | 0.21142 (14) | 0.4854 (16) | 0.20775 | 0.0324 (4) | |
| W2 | 8d | 0.07176 (13) | 0.21142 (14) | 0.4854 (16) | 0.03125 | 0.0324 (4) | |
| O1 | 8d | 0.1609 (8) | 0.0615 (8) | 0.568 (4) | 1 | 0.0294 (21) | |
| O2 | 8d | 0.3426 (8) | 0.0055 (8) | 0.411 (5) | 1 | 0.0294 (21) | |
| O3 | 8d | 0.1022 (8) | 0.1772 (8) | −0.069 (5) | 1 | 0.0294 (21) | |
| O4 | 4c | 0.2860 (8) | 0.7860 (8) | 0.582 (5) | 1 | 0.0078 (21) | |
| O5 | 2b | 0 | 0.5 | −0.045 (12) | 1 | 0.0078 (21) | |
| BaMoO4 | Ba | 4b | 0 | 0.25 | 0.625 | 1 | −0.0085 (11) |
| Mo | 4a | 0 | 0.25 | 0.125 | 1 | 0.0402 (27) | |
| O | 16f | 0.175 (8) | 0.203 (12) | 0.0231 (26) | 1 | 0.08796 |
| Composition | 0.04 | 0.08 | 0.33 |
|---|---|---|---|
| Principal Interatomic Distances (Å) Ba1/Na1–O | |||
| Ba1/Na1–O1 | 3.080 × 4 | 2.8773 × 4 | 2.8705 × 4 |
| Ba1/Na1–O1 | 2.501 × 4 | 2.9578 × 4 | 2.9678 × 4 |
| Ba1/Na1–O3 | 2.546 × 4 | 2.650 × 4 | 2.5836 × 4 |
| (Ba1/Na1–O) | 2.709 | 2.8283 | 2.88073 |
| Principal Interatomic Distances (Å) Ba2/Na2–O | |||
| Ba2/Na2–O1 | 3.465 × 2 | - | - |
| Ba2/Na2–O1 | 3.153 × 2 | - | - |
| Ba2/Na2–O2 | 3.145 × 2 | 2.826 × 2 | 2.6375 × 2 |
| Ba2/Na2–O2 | 2.539 × 2 | - | - |
| Ba2/Na2–O4 | 2.7364 × 2 | 2.593 × 2 | 2.5984 × 2 |
| Ba2/Na2–O4 | 3.0713 × 2 | 2.9797 | |
| (Ba2/Na2–O) | 3.0182 | 2.7095 | 2.7385 |
| Principal Interatomic Distances (Å) Nb1/W1/Mo1–O | |||
| Nb1/W1/Mo1–O2 | 1.855 × 4 | 1.9374 × 4 | 1.9873 × 4 |
| Nb1/W1/Mo1–O5 | 2.05431 | 1.9001 | 1.8073 |
| Nb1/W1/Mo1–O5 | 1.89629 | 2.0584 | 2.1648 |
| (Nb1/W1/Mo1–O) | 1.93519 | 1.9353 | 1.9864 |
| Principal Interatomic Distances (Å) Nb2/W2/Mo2–O | |||
| Nb2/W2/Mo2–O1 | 1.745 | 1.9572 | 2.1904 |
| Nb2/W2/Mo2–O1 | 2.190 | 1.9766 | - |
| Nb2/W2/Mo2–O2 | 2.340 | - | 1.9133 |
| Nb2/W2/Mo2–O3 | 1.791 | 1.9030 | 1.8591 |
| Nb2/W2/Mo2–O3 | 2.230 | 2.0887 | 2.2743 |
| Nb2/W2/Mo2–O4 | 1.9451 | - | 2.0308 |
| Nb2/W2/Mo2–O | 2.0402 | 1.9813 | 2.0535 |
| Band Position (cm−1) | Assignment |
|---|---|
| 485→115 | Octahedra (Mo/W/NbO6) or cation translation vibrations (Ba2+, Na+) |
| 650→485 | Mo/W/Nb–O stretching vibrations caused by deformation |
| 840→650 | Mo/W/Nb-O bonds |
| Composition | Tc | εr′max 1 KHz | εr′max 10 KHz | εr′max 100 KHz | εr′max 1000 KHz |
|---|---|---|---|---|---|
| 0.00 | 250.84 | 1770.90 | 668.33 | 408.37 | 328.97 |
| 0.04 | 276.57 | 844.84 | 342.88 | 242.48 | 222.40 |
| 0.08 | 288.36 | 399.49 | 235.21 | 191.40 | 174.97 |
| 0.33 | 285.48 | 369.48 | 189.51 | 161.58 | 155.37 |
| Composition | Tc | T0 | C |
|---|---|---|---|
| x = 0.00 | 250.84 | 253.18 | 40.16 × 10³ |
| x = 0.04 | 276.57 | 237.68 | 40.00 × 10³ |
| x = 0.08 | 288.36 | 225.70 | 27.70 × 10³ |
| x = 0.33 | 285.48 | 257.57 | 15.92 × 10³ |
Disclaimer/Publisher’s Note: The statements, opinions and data contained in all publications are solely those of the individual author(s) and contributor(s) and not of MDPI and/or the editor(s). MDPI and/or the editor(s) disclaim responsibility for any injury to people or property resulting from any ideas, methods, instructions or products referred to in the content. |
© 2023 by the authors. Licensee MDPI, Basel, Switzerland. This article is an open access article distributed under the terms and conditions of the Creative Commons Attribution (CC BY) license (https://creativecommons.org/licenses/by/4.0/).
Share and Cite
Es-soufi, H.; Sayyed, M.I.; Almuqrin, A.H.; Rajesh, R.; Lima, A.R.F.; Bih, H.; Bih, L. Crystallographic, Structural, and Electrical Properties of W6+ Substituted with Mo6+ in Crystalline Phases such as TTB Structure. Crystals 2023, 13, 483. https://doi.org/10.3390/cryst13030483
Es-soufi H, Sayyed MI, Almuqrin AH, Rajesh R, Lima ARF, Bih H, Bih L. Crystallographic, Structural, and Electrical Properties of W6+ Substituted with Mo6+ in Crystalline Phases such as TTB Structure. Crystals. 2023; 13(3):483. https://doi.org/10.3390/cryst13030483
Chicago/Turabian StyleEs-soufi, Hicham, M. I. Sayyed, Aljawhara H. Almuqrin, Raman Rajesh, Alan Rogerio Ferreira Lima, Hssain Bih, and Lahcen Bih. 2023. "Crystallographic, Structural, and Electrical Properties of W6+ Substituted with Mo6+ in Crystalline Phases such as TTB Structure" Crystals 13, no. 3: 483. https://doi.org/10.3390/cryst13030483