
Comparative Study on Gemmological Characteristics and Luminescence of Colorless and Yellow Scapolites

1
School of Gemology, China University of Geosciences, Beijing 100083, China
2
Beijing Key Laboratory of Materials Utilization of Nonmetallic Minerals and Solid Wastes, National Laboratory of Mineral Materials, School of Materials Sciences and Technology, China University of Geosciences, Beijing 100083, China
*
Authors to whom correspondence should be addressed.
Crystals 2023, 13(3), 462; https://doi.org/10.3390/cryst13030462
Submission received: 15 February 2023
/
Revised: 5 March 2023
/
Accepted: 6 March 2023
/
Published: 8 March 2023
(This article belongs to the Section Mineralogical Crystallography and Biomineralization)
Abstract
:The orange fluorescence of scapolite has been confirmed to be caused by (S2)−, but the frequent blue fluorescence in gem-quality scapolite has not been well explained. An energy dispersive X-ray fluorescence spectrometer (XRF), electron probe microanalyzer (EPMA), X-ray powder diffractometer (XRD), Fourier transform infrared spectrometer (FTIR), Raman spectrometer, ultraviolet-visible spectrophotometer, fluorescence spectrometer, and conventional gemological test methods were used to study the gemological characteristics, chemical composition, coloration mechanism, spectral characteristics, and luminescence of colorless and yellow scapolite. The results show that both yellow and colorless scapolites are mizzonite and that they share the same gemological and spectroscopic characteristics. The results of XRD, FIRT, and Raman spectra show that the yellow scapolite has the same structure as the colorless scapolite. The yellow color of scapolite is caused by Fe3+ and when the Fe content is low it is colorless. Yellow scapolite has about three times the Fe content of colorless scapolite. Under the excitation of long-wave and short-wave ultraviolet light, scapolite forms a strong and wide excitation peak in the blue-violet region centered at approximately 410 nm, which is due to the 4f1 → 5d1 of Ce3+, resulting in blue fluorescence.
1. Introduction
Scapolite is a feldspathoid mineral. Feldspathoid is a kind of framework silicate with a similar chemical composition to feldspar. Different from feldspar, the Si:Al value of these minerals is less than three, and the structure is more open, with larger voids that can accommodate large radius cations and larger additional anions. They are produced under conditions rich in alkali and poor in silicon and do not coexist with quartz. For example, nepheline, leucite, etc. Since the discovery of gem-grade scapolite in Myanmar, various colors of scapolites have been found all over the world. Currently, known origins are Madagascar, Mozambique, Tanzania, Brazil, Canada, et al. [1,2]. Scapolites are rich in color, and common colors are colorless, yellow, purple, and pink, in addition to orange, green, blue, and so on [1]. Marialite (Na4Al3Si9O24Cl) and meionite (Ca4Al6Si6O24CO3) are two end-member minerals of scapolite [3,4]. They are completely homogeneous, and the intermediate minerals are mizzonite and leicolite. The value of Me% (Me% = (Ca + Sr)/(Ca + Sr + Na + K) × 100%) is generally used as a criterion to distinguish the types of scapolite. When the value of Me% is 0~20%, it is marialite; when the value of Me% is 20~50%, it is leicolite; when the value of Me% is 50~80%, it is mizzonite; when the value of Me% is 80~100%, it is meionite [5].
Previous research on scapolite has mainly focused on geochemistry, crystal structure, spectroscopic properties, luminescence, coloration mechanism, etc., while the research on the gemological characteristics of scapolite is relatively less. Scapolite is rich in the halogen element Cl, but unlike other chlorine-containing minerals, scapolite contains almost no OH, so its chemical composition can be used as a tracer for Cl and CO2 content, instead of relying on fH2O [6,7]. Zeng et al. used the combination of halogen geochemistry and other fluid tracers (such as B and Sr isotopes) in cristobalite to study the origin and evolution of fluids in magmatic-hydrothermal systems [8]. The crystal structure of scapolite was first proposed by Pauling [9]. Schiebold and Seumel [10] and then Paike [11] improved this result and proposed that there are two space groups, I4/m and P42/n, in scapolite. Finally, Antao proposed that the type of space group of scapolite depends on Me%. When Me% is 18~90%, it is P42/n, otherwise it is I4/m [12]. The infrared spectra of scapolite were systematically investigated by Wehrenberg et al. They classified the infrared spectra of scapolite into three vibrational modes. The first one is the vibration caused by carbonate ions; the second one is the vibration caused by discrete tetrahedra, which is stable and does not vary with chemical composition; the third one is the structural mode, whose wave number varies with the chemical composition [13]. Swayze complemented the study of the vibration caused by HCO3− and HSO4− in the mid-infrared region of scapolite [14]. Elken et al. found that the luminescence intensity of the scapolite after heat treatment at 1000 °C is enhanced 117-fold, and this enhancement is very stable, indicating that the scapolite is an excellent luminescent material. At the same time, he found that the crystal structure of scapolite did not change significantly before and after heat treatment. Therefore, he presumed that the reason for the enhanced luminescence of scapolite was the conversion of SO32− and SO42− into (S2)− [15], and Blumentritt also proved in subsequent studies that the orange fluorescence of scapolite was indeed caused by (S2)− [16]. Choudhary et al. analyzed the UV-visible spectrum of purple scapolite and found that purple scapolite had a broad absorption peak centered at 550 nm, which was the absorption peak of Fe. Therefore, they feel that Fe plays a decisive role in the formation of the purple color of scapolite [2]. As a minority gemstone, the gemological characteristics and coloration mechanism of scapolite still lack systematic research. The study of its infrared spectra and Raman spectra is not complete, and the peak position of scapolite Raman spectra still lack a systematic and comprehensive assignment. Therefore, the study on the coloration mechanism and spectral characteristics of different color scapolite may be helpful to better identify and distinguish them in the future.
In this paper, the gemological characteristics and appearance characteristics of the samples were studied by conventional gemological testing methods. The spectral characteristics and crystal structure of scapolites were analyzed by an XRD, an infrared spectrometer, and a Raman spectrometer. The coloration mechanisms of different color scapolites were studied by UV-Vis spectrophotometer. The chemical composition of scapolite was studied by EPMA and XRF. The fluorescence of scapolite was tested and analyzed by a fluorescence spectrometer. The above work summarizes the gemological characteristics, spectroscopic characteristics, and coloration mechanism of yellow scapolite, improves the related research of scapolite, and provides a theoretical basis for the future identification of scapolite. In addition, the origin of blue fluorescence of natural gem-grade scapolite is discussed for the first time, which expands our understanding of scapolite.
2. Materials and Methods
2.1. Materials
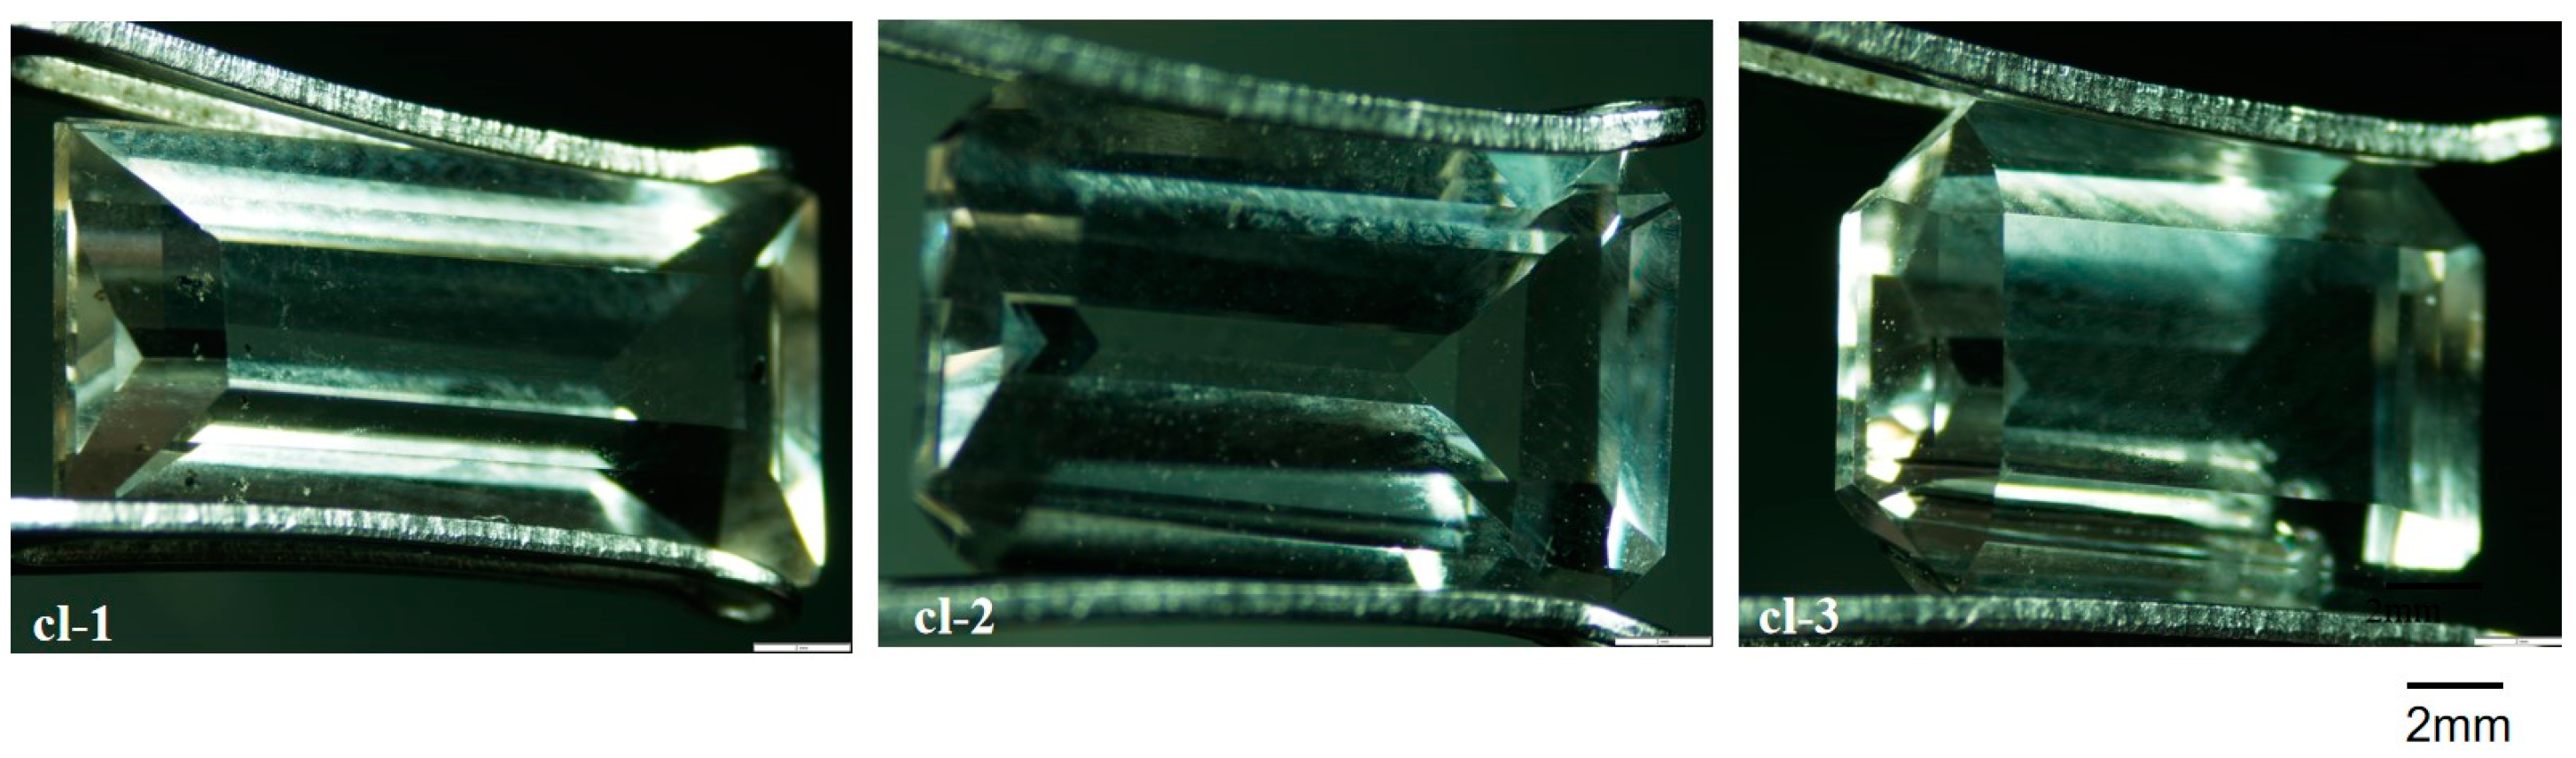
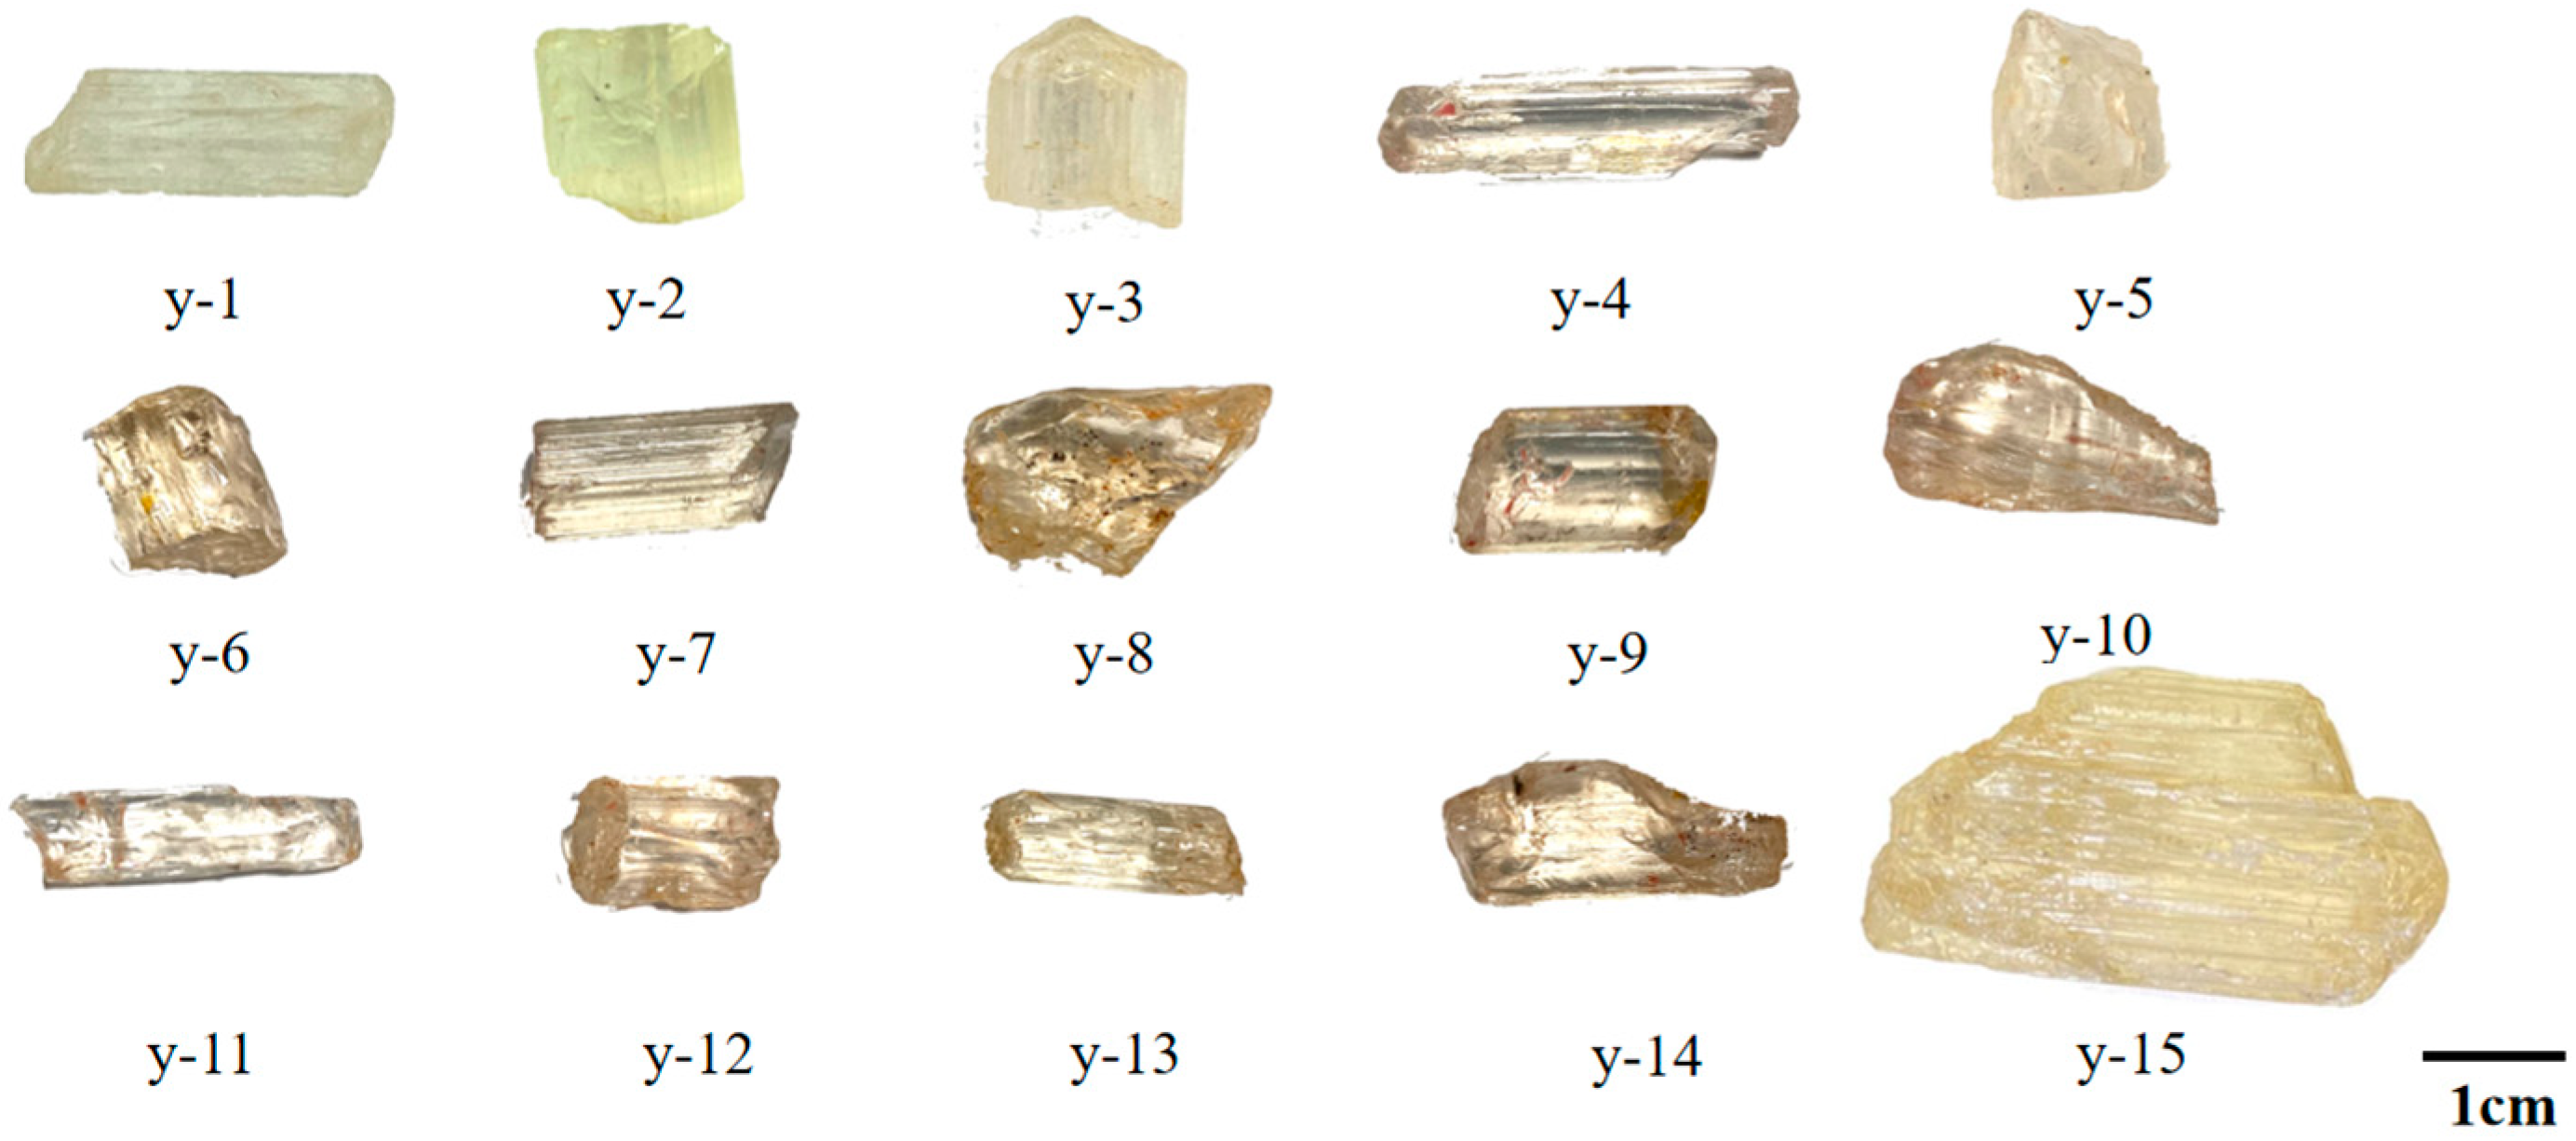
The common colorless, yellow scapolites on the market were selected. Samples were from the original stone suppliers. Yellow scapolites were from Mozambique in Africa, and colorless scapolites were from Madagascar. The sample numbers were cl-1~3 and y-1~15, respectively. As shown in Figure 1 and Figure 2, the colorless samples are carved gems, and the yellow are the original stones. The colorless samples are smaller in size, and the yellow samples are larger. Each sample has at least one polished surface.
2.2. Methods
Using a gem polarizing mirror, refractometer, specific gravity scale, and so on, to test the lightness, axiality, refractive index, birefringence, and specific gravity. The surface and internal characteristics of the scapolites were observed using a GI-MP22 gemological microscope.
In order to obtain the composition of colorless and yellow scapolite and the content of rare earth elements, XRF, EMPA, and ICP-MS were used, respectively.
The EDX-7000 X-ray fluorescence spectrometer produced by Shimadzu Company of Japan (Kyoto, Japan) was used for semi-quantitative component detection of the sample. The main experimental conditions are as follows: experimental voltage 50 kV; direct current 833 μA; collimator 5 mm (colorless sample 1 mm); vacuum atmosphere; the element analysis range is 11Na~92U.
The main elements of the samples were determined by a JXA-8230 electron microprobe (EPMA, Joel, Japan) of the Beida Microfabrication Laboratory. The main experimental conditions are as follows: an accelerating voltage of 15 kV; a beam current of 50.4 nA; and a beam diameter of 5 μm.
ICP-MS is a very common and effective test method for detecting trace elements in minerals [17]. The trace elements in the columnar powder samples were determined by the Agilent-7700 (Agilent, America) ICP-MS of the sci-go testing mechanism.
It is necessary to compare the spectral characteristics and crystal structure of colorless and yellow cristobalite, so we used an XRD, a Raman spectrometer, and an infrared spectrometer.
The crystal structure of the sample was determined by the Smart Lab X-ray diffractometer (D8 Focus, XBruker, Germany) of the School of Materials, China University of Geosciences (Beijing, China). The main experimental conditions are as follows: voltage 45 kV; scanning speed 10°/min; scan range 5~80°.
The Vcctor33 Fourier transform infrared spectrometer produced by Brucker in Germany (Bremen, Germany) was used to test by the direct reflection method. The experimental conditions were as follows: a test range of 400~2000 cm−1; a resolution of 4 cm−1; a sample scan time of 32 s.
The Raman spectra of the samples were measured by an HR-Evolution microlaser Raman spectrometer produced by HORIBA, Kyoto, Japan. The test conditions were as follows: the measurement range was 100~1600 cm−1; the integration time was 3 s; the laser wavelength was 532 nm. The test environment was as follows: room temperature 18 °C, humidity: 33%, 220 V, 10 A.
UV-Vis is necessary for discussing the coloration mechanism of yellow scapolite. The samples were tested by UV-3000 ultraviolet-visible spectrophotometer produced by Shimadzu, Japan. Test conditions were as follows: the test method was transmission; the wavelength range was 300~800 nm; the scanning speed was medium speed; the slit width was 20; the atmosphere was a vacuum.
In order to analyze the luminescence of colorless and yellow scapolite, we used a fluorescence spectrometer. The FLS920 series of fully functional steady-state/transient fluorescence spectrometers produced by the Edinburgh Company (Edinburgh, UK) of China University of Geosciences (Beijing) was used. The experimental conditions were as follows: the excitation light source was a 450 W xenon lamp; the voltage was 450 V; the measuring wavelength range was 380–750 nm; the scanning speed was 240 nm/min.
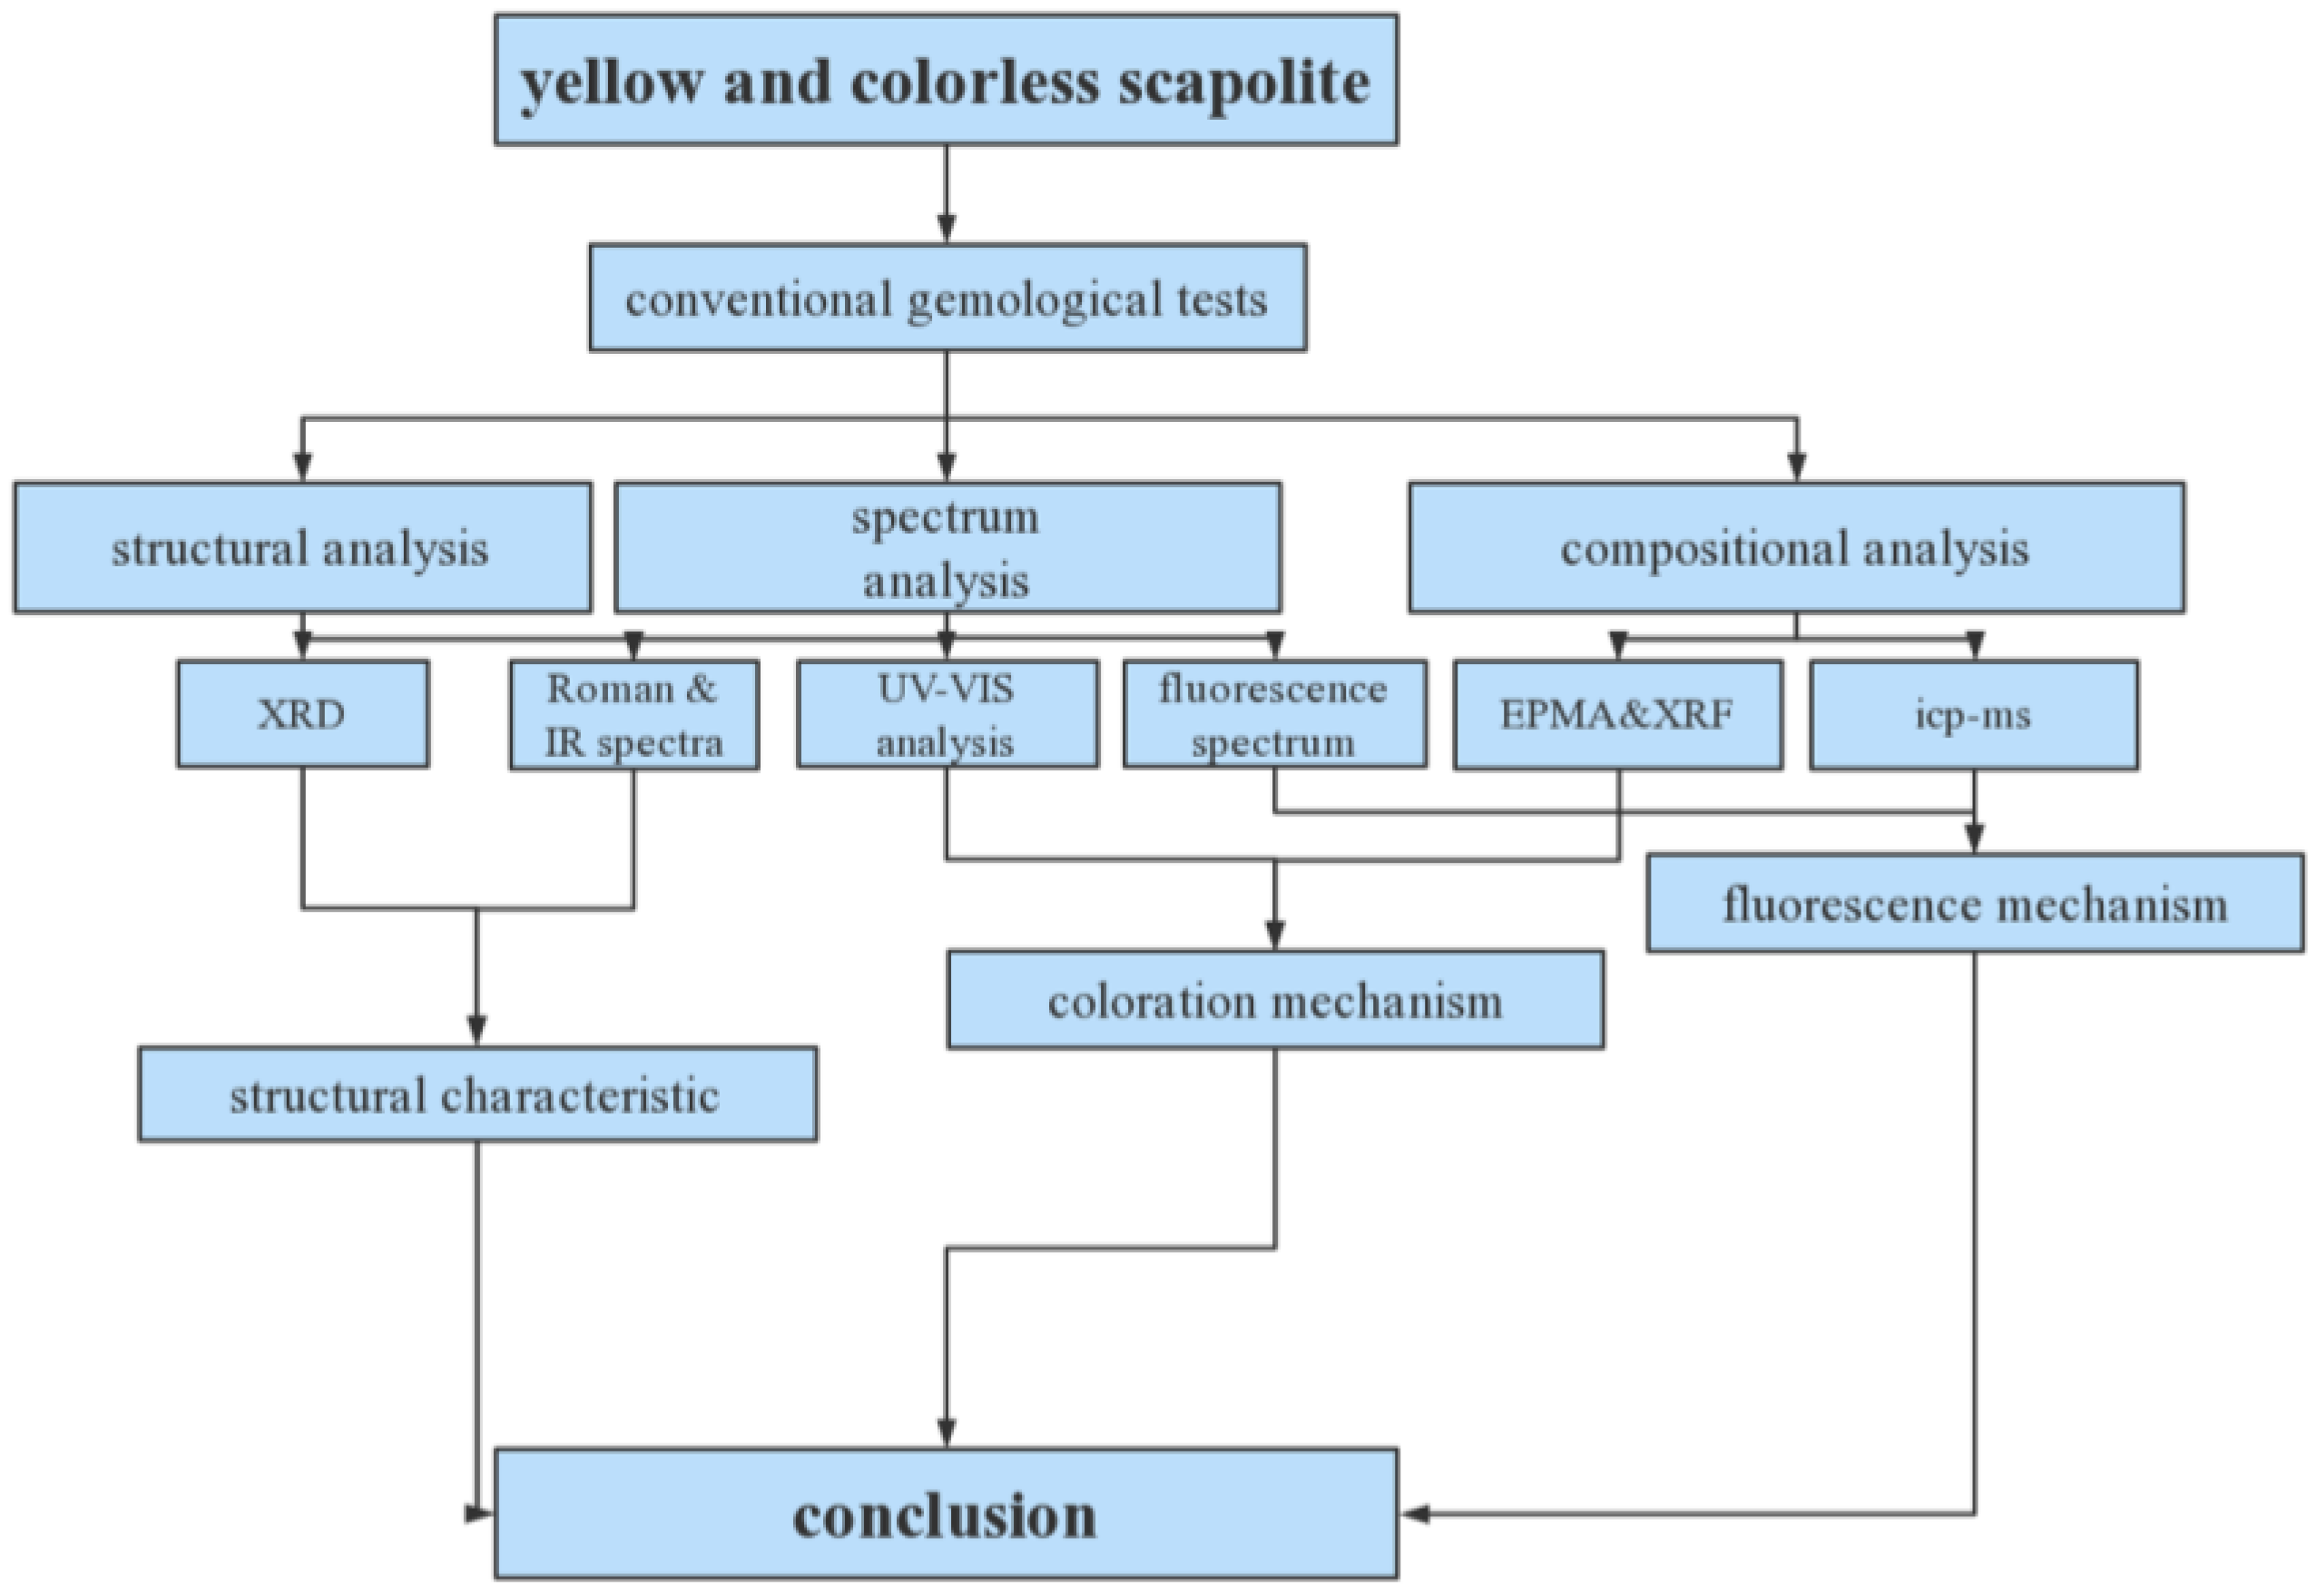
The following flow chart (Figure 3) shows the various tests performed and the results obtained.
3. Results and Discussion
3.1. Conventional Gemological Features
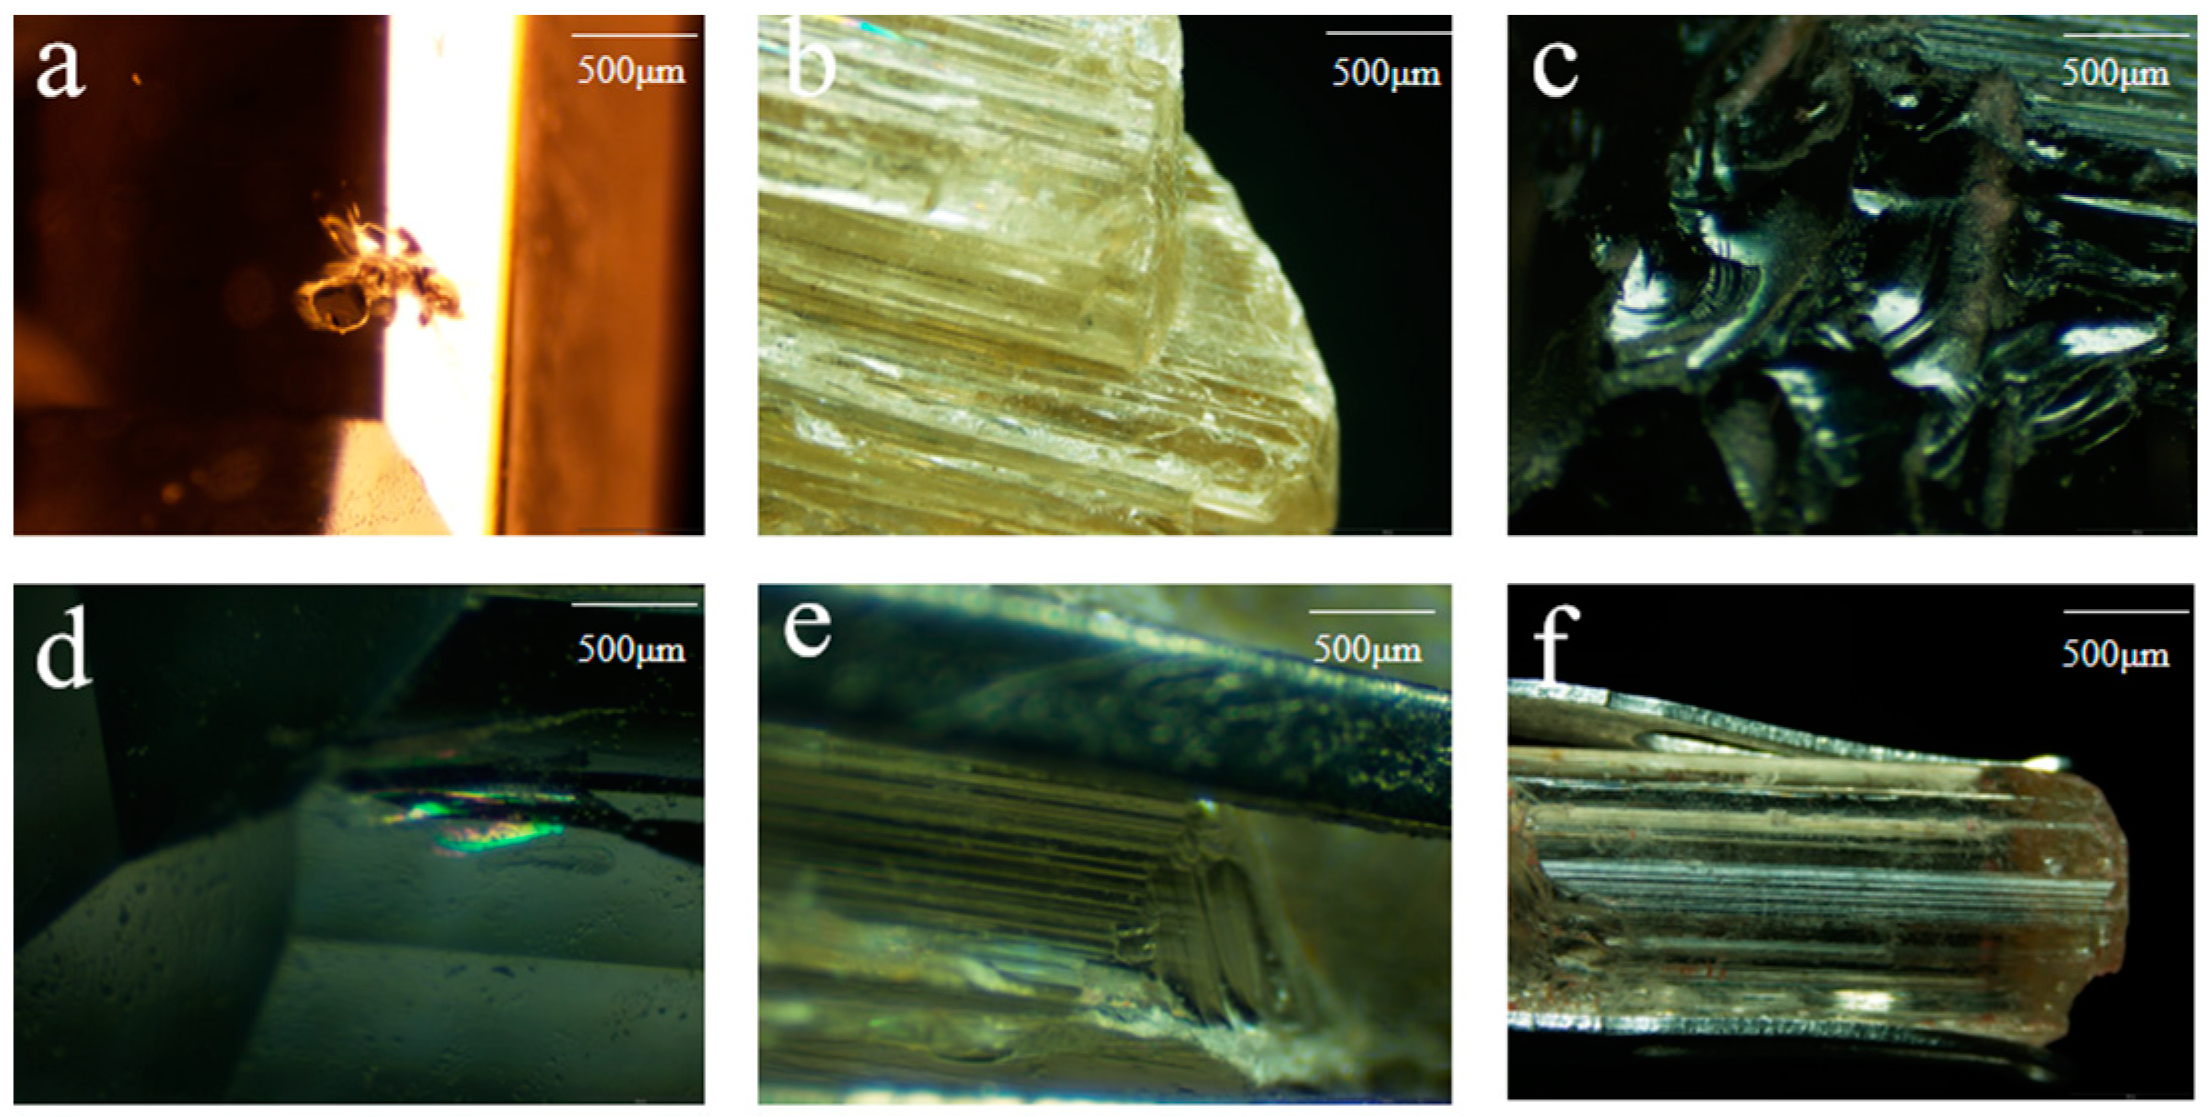
The colorless samples cl-1~3 are carved gemstones with a glassy luster, good transparency, and visible black mineral inclusions inside (Figure 4a), the halo can also be seen at the healing crack (Figure 4d). The rest of the samples are original stones, glass to grease luster, good transparency, the phenomenon of parallel connection can be seen on the surface (Figure 4b), the development of a shell-like fracture (Figure 4c), the complete cylindrical cleavage can be seen (Figure 4e), and the columnar longitudinal lines are very developed (Figure 4f).
The samples rotate 360° under orthogonal polarization, and there are four bright and four dark phenomena. The ‘black cross’ interferogram can be seen under the cone light microscope, which is a uniaxial crystal heterogeneity. As shown in Table 1, the refractive index range is roughly 1.54–1.56, the maximum refractive index of colorless and yellow samples exceeds 1.560, and the birefringence is above 0.014. In general, meionite (Me) has a higher refractive index than marialite (Ma), and as Me% increases, the refractive index increases accordingly [18,19,20,21]. The specific gravity of the two colors of scapolite is basically the same, and the specific gravity of both colorless and yellow samples is 2.63–2.65. There is a direct relationship between the specific gravity and composition of scapolite. In the two end-member minerals of scapolite, the proportion of meionite (Me) is larger than that of marialite (Ma) [16,19]. The content of meionite in scapolite increases, and the specific gravity increases accordingly. Based on the above experimental results, the content of meionite in the colorless and yellow scapolite in this paper should be similar. Subsequent EPMA experimental results can also prove this view.
3.2. Composition and Crystal Structure Analysis of Scapolite
3.2.1. X-ray Fluorescence Spectrum and EPMA Analysis
EPMA is a very important method in quantitative analysis of mineral composition [22,23]. As shown in the supporting document (shown in Tables S1 and S2 see supplementary materials), XRF test results show that the main components of scapolite are Si and Al, in addition to Na, Ca, Fe, K, S, Sr, Br, and trace Mn, Cu, Zn, Rb, Pb, etc. The EPMA data show that the contents of Al2O3 and SiO2 in colorless and yellow scapolite are very close. The contents of Al2O3 are 16.185% and 15.83%, respectively, and the contents of SiO2 are 65.355% and 66.490%, respectively. The content of Na2O in colorless scapolite is 5.32%, which is significantly higher than that in yellow scapolite (1.48%). However, the content of CaO in yellow scapolite is 8.635%, which is higher than that in colorless scapolite (6.39%), which is also the reason for the large difference in Me% between the two. Through calculation, the Me% of colorless scapolite cl-2 is 51.10%, and the Me% of yellow scapolite y-1 is 77.30%, which belongs to mizzonite. This is also the reason why the two have little difference in specific gravity, refractive index, and birefringence. It is worth noting that there are differences in the Fe content between colorless and yellow scapolite. The Fe content in yellow scapolite is nearly three times that of colorless scapolite; therefore, the difference in Fe content will be a breakthrough for us to discuss the color difference of scapolite. The relevant content will be discussed in more detail in the UV-Vis section.
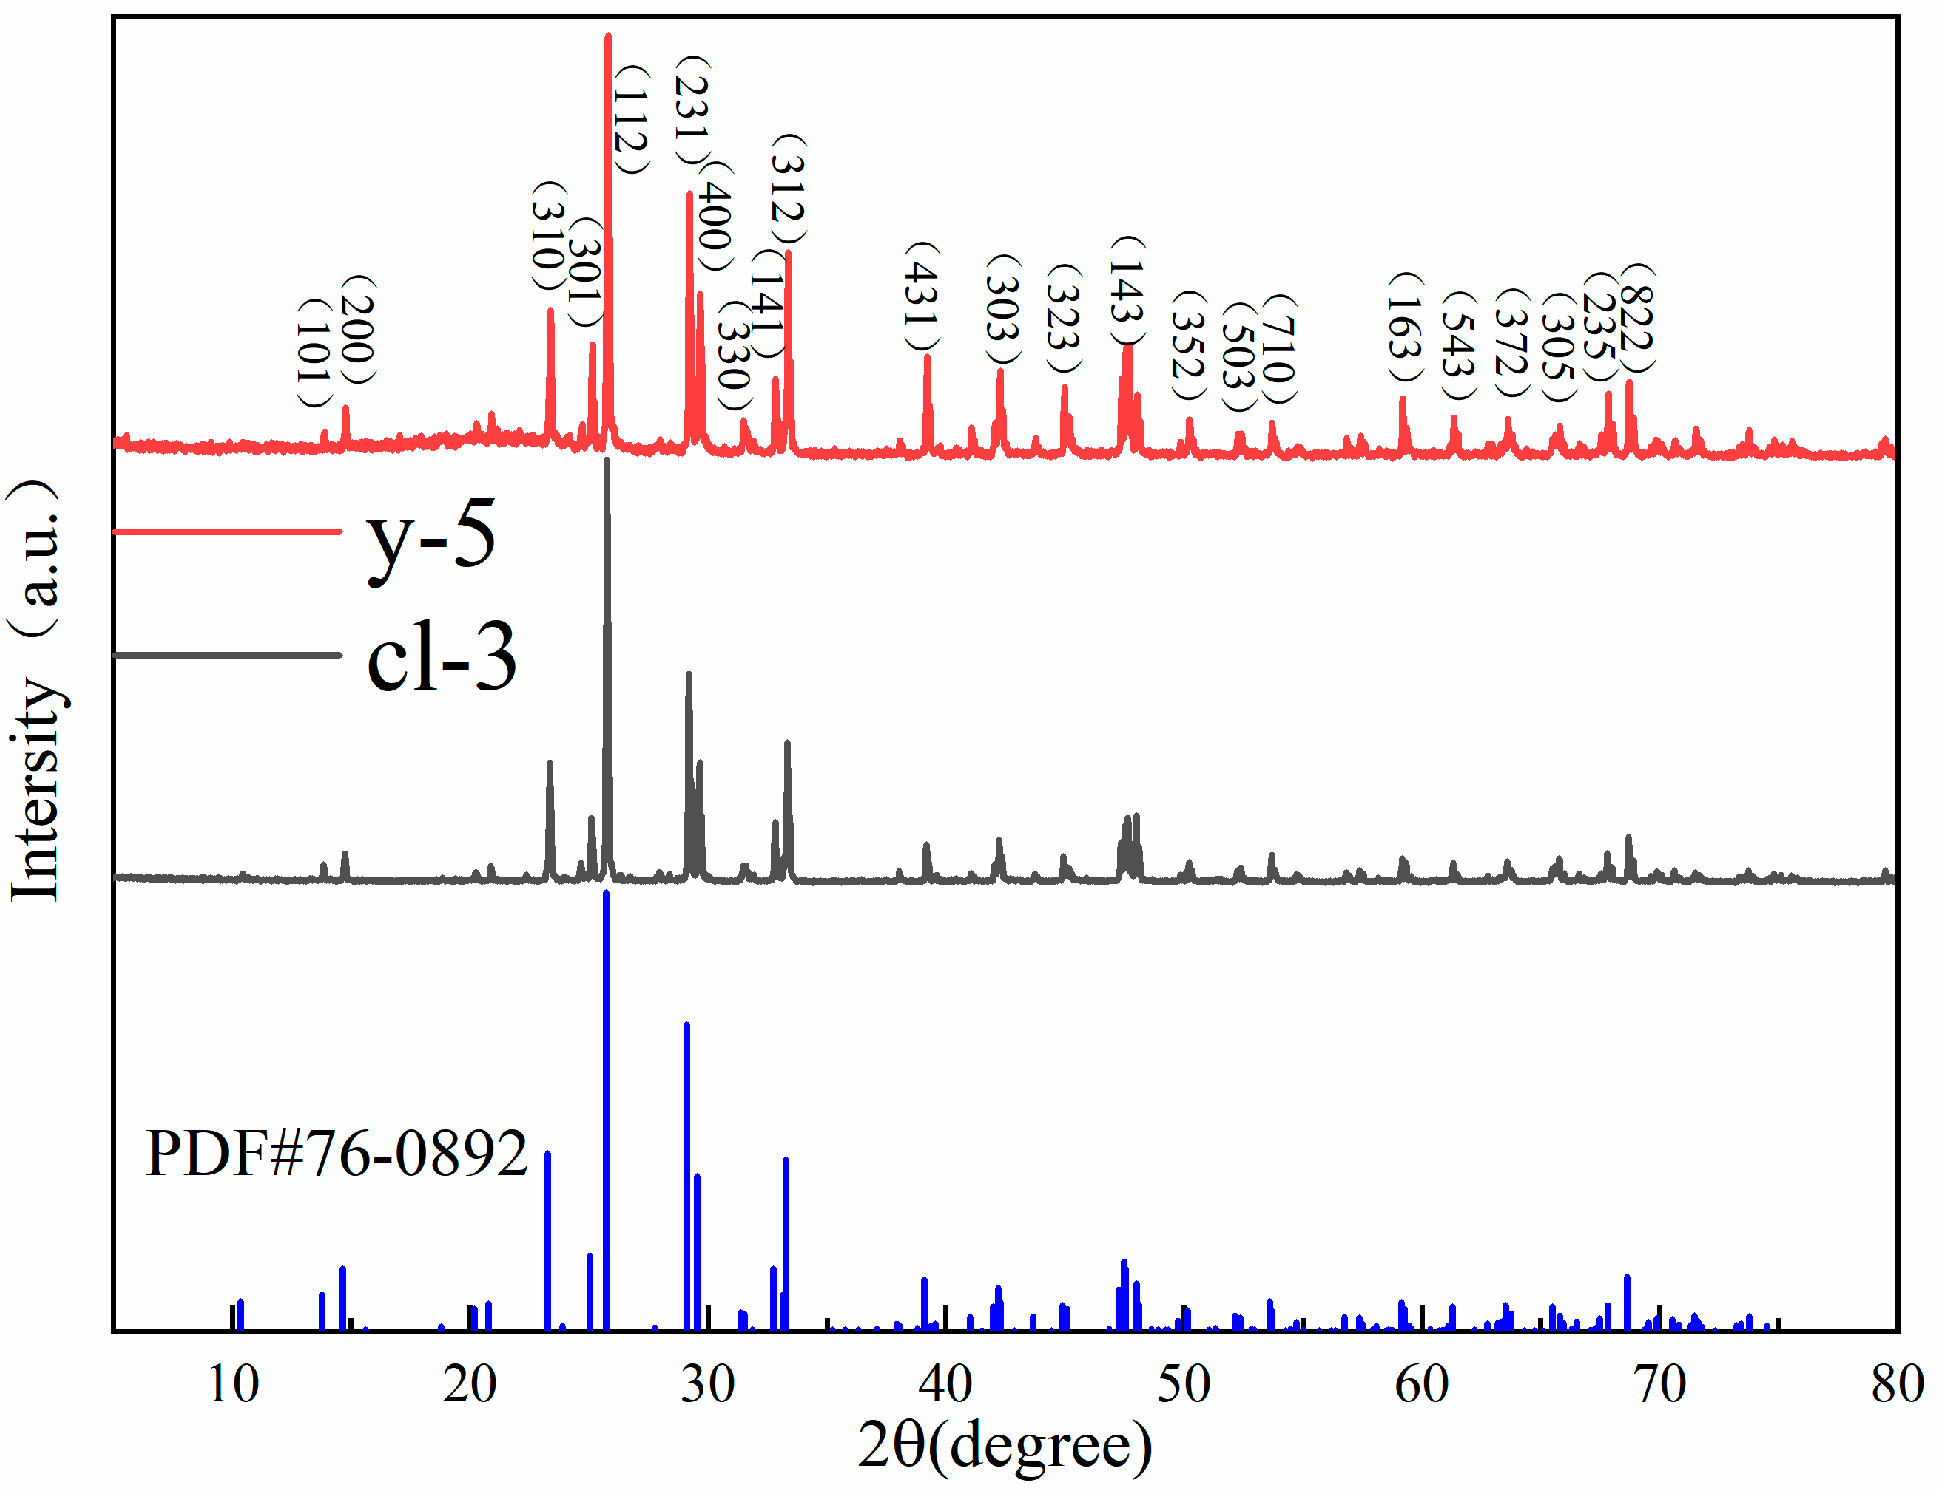
3.2.2. XRD Analysis
As shown in Figure 5, the XRD patterns of colorless and yellow scapolite are basically consistent with the standard card PDF # 76-0892. This indicates that there is no structural difference between scapolites of different colors. The XRD peak of the sample is sharp, which indicates that scapolite has high crystallinity. The strongest diffraction peak of scapolite is 25.779° in 2-Theta, followed by 23.367°, 25.100°, 29.264°, 29.652°, 32.833°, and 33.350°. In addition, there is a densely arranged diffraction peak group between 47° and 48.5°. The space group of yellow scapolite y-5 is P42/n, the unit cell parameters are a0 = b0 = 1.2060 nm, c0 = 0.7579 nm, α = β = γ= 90°, and the unit cell volume is 1.10241 nm3. The space group of colorless scapolite cl-3 is P42/n, and the unit cell parameters are a0 = b0 = 1.2045 nm, c0 = 0.7564 nm, α = β = γ = 90°, and the unit cell volume is 1.09728 nm3. Elena et al. found that the unit cell parameter a0 in scapolite is positively correlated with the value of Me% [24]. Therefore, the reason for the unit cell parameters between the two scapolites is the different Me% values. According to the results of XRF and EPMA, the Me% value in yellow samples is higher than that in colorless samples, so the a0 value of y-5 is higher than that of cl-3.
3.3. Spectroscopy Analysis of Scapolite
3.3.1. Infrared Spectra Analysis
The scapolite samples of two colors were tested by infrared spectroscopy. The reflection method and transmission method were used to test the scapolite samples, and the infrared spectral characteristics of different colors were compared.
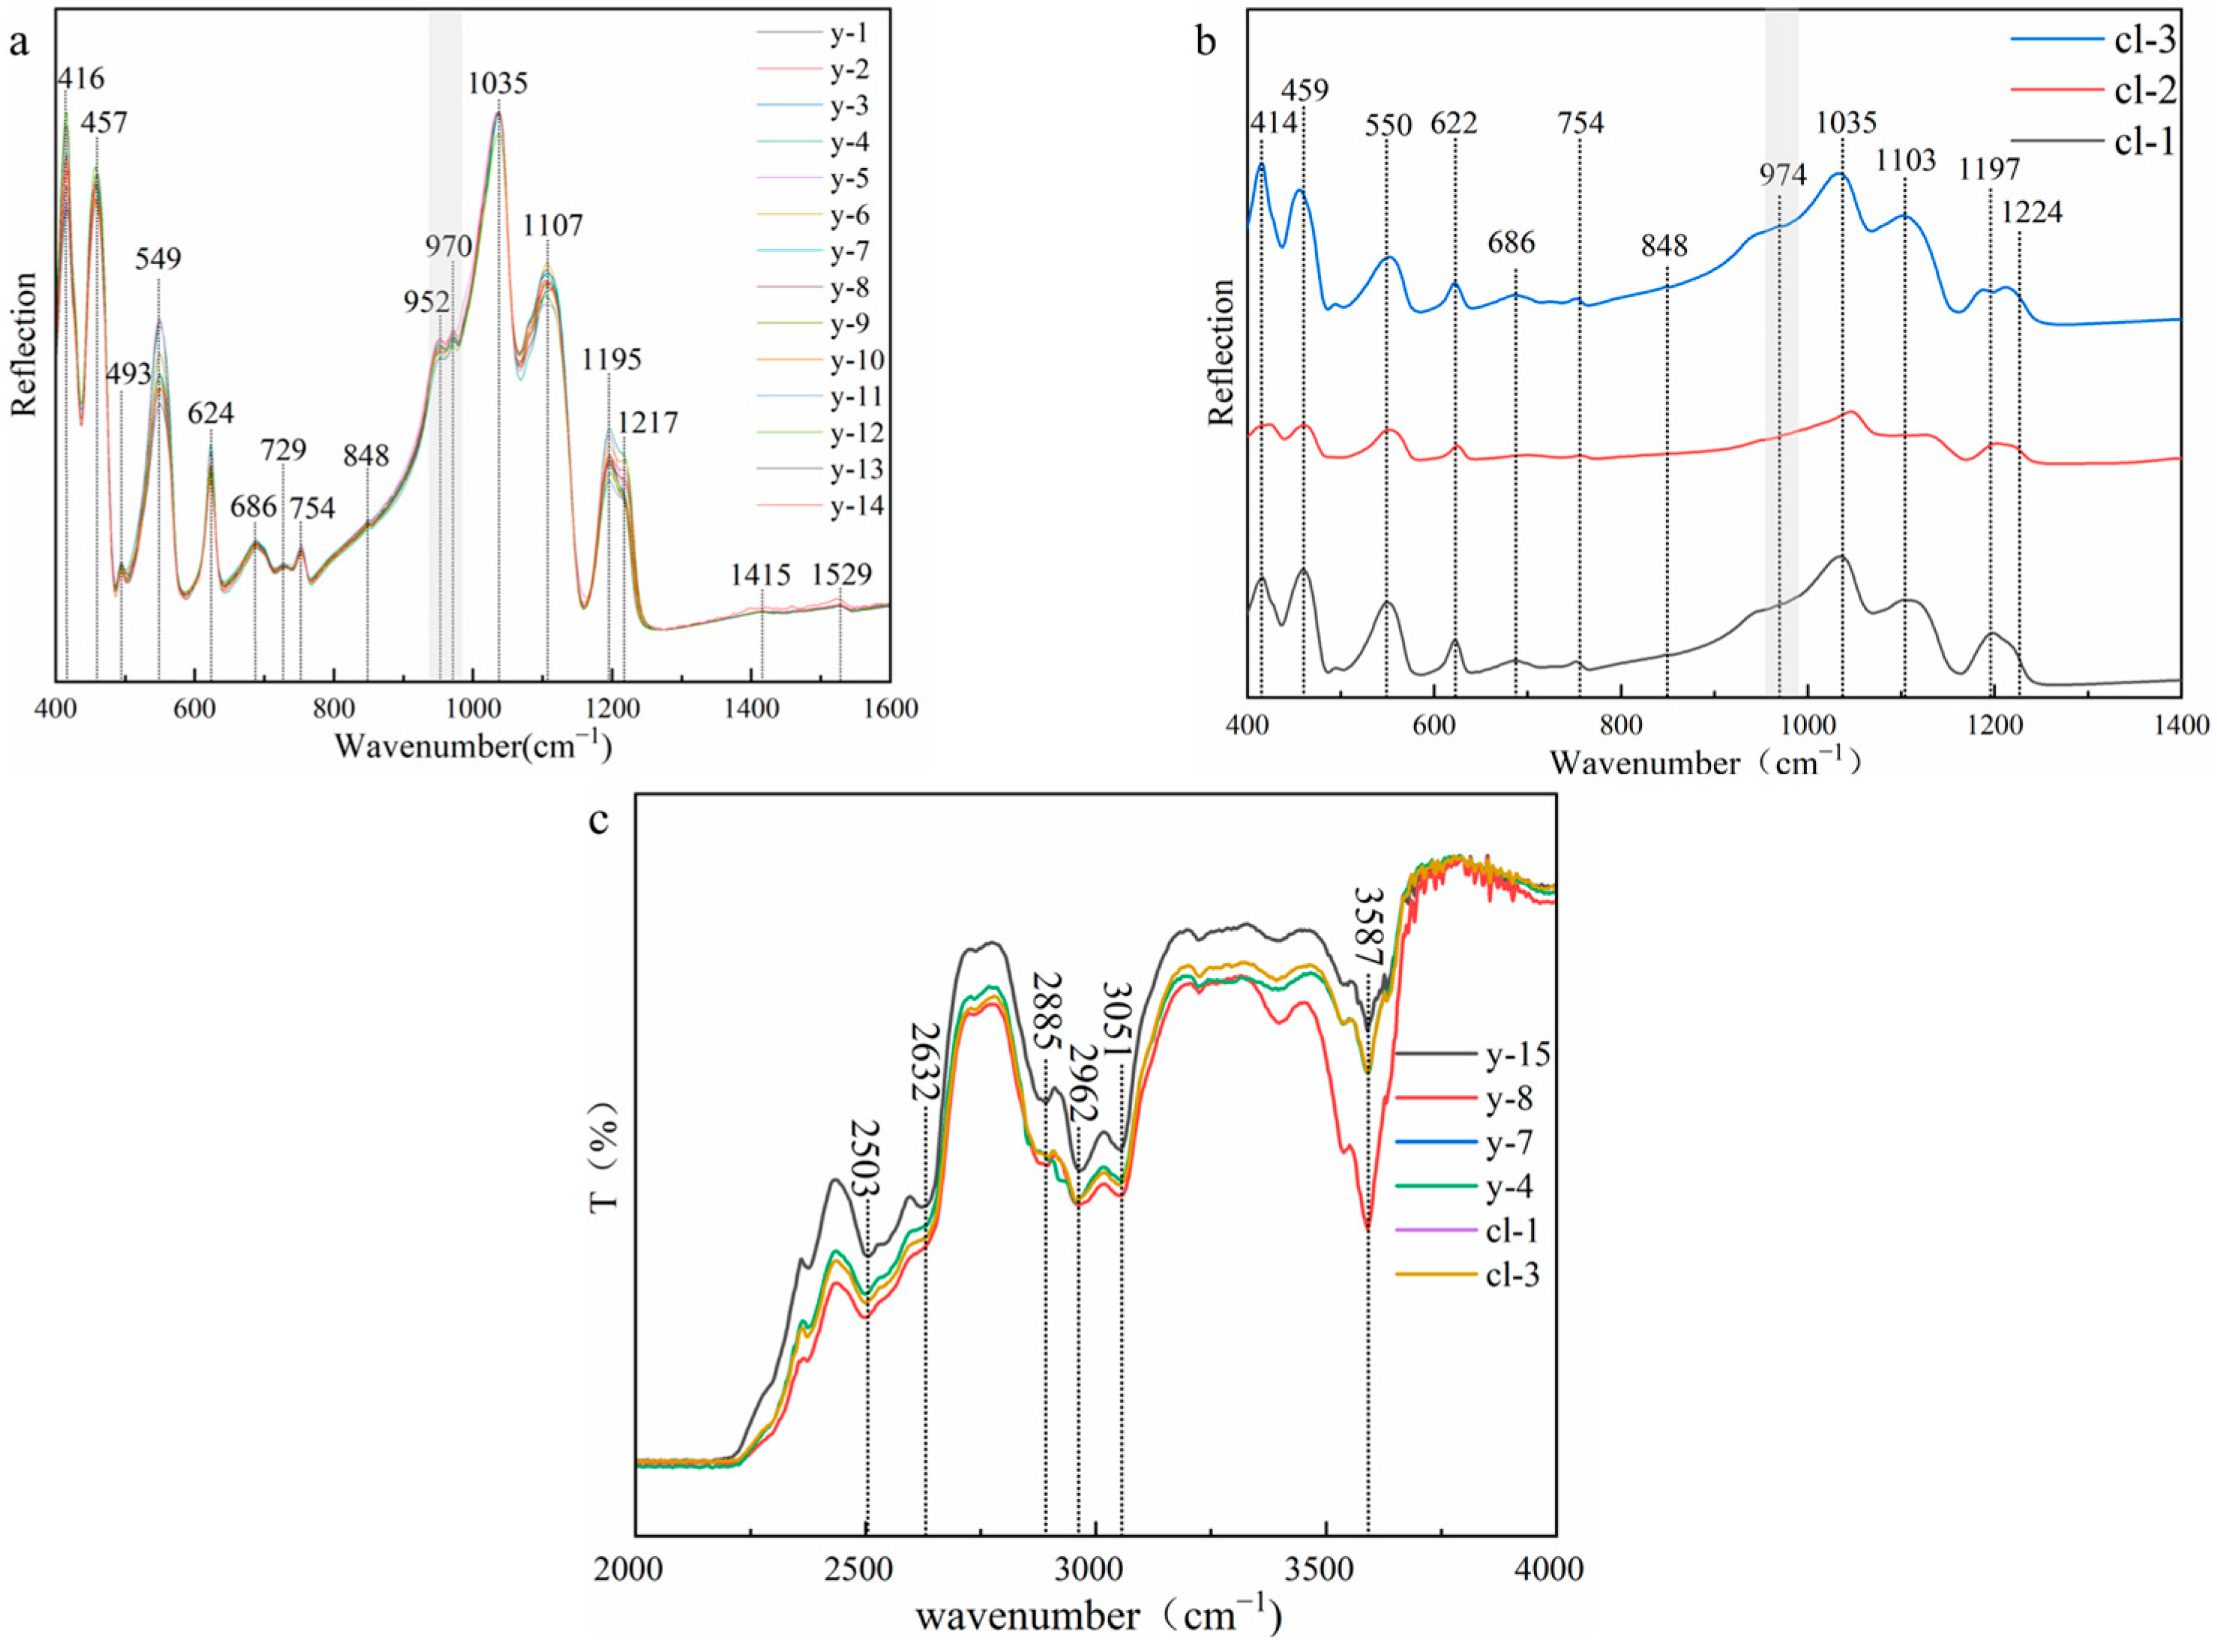
Figure 6 shows that all samples show the typical infrared spectral characteristics of scapolite, which is consistent with card #R040043 in the RRUFF database. To prevent the difference caused by different crystallographic orientations during the test, the direction selected during the test is perpendicular to the crystal axis c axis. The absorption peak near 414 cm−1 is caused by the bending vibration of Si-O-Si (Al). The absorption peaks at 457 cm−1, 493 cm−1, and 549 cm−1 are caused by the coupling of the bending vibration of O-Si-O and the stretching vibration of Ca (Na)-O. Except for the weak absorption peak near 493 cm−1, the other absorption peaks are sharp and strong. The absorption peak at 622 cm−1 is caused by the bending vibration of O-Si(Al)-O. The absorption peak at 686 cm−1 is the absorption peak of CO32− [24], which is directly related to the content of meionite. The intensity of this absorption peak in colorless and yellow cristobalite is weak. The 729 cm−1 and 750 cm−1 are caused by the stretching vibration of Si-Al (Si), and the absorption peaks are weak. The absorption peaks at 848 cm−1, 1415 cm−1, and 1523 cm−1 are also the characteristic absorption peaks of CO32−, which are caused by the bending vibration of CO32− and the asymmetric stretching vibration of CO32−, respectively [3,14]. These absorption peaks are very weak and almost invisible, and the absorption peak at 1523 cm−1 will decrease with the increase in the Me% value [25], which also indicates that the value of Me% in the experimental sample is relatively high. The absorption peaks at 950 cm−1, 970 cm−1, and 1035 cm−1 are caused by the stretching vibration of Si (Al)-O. It is worth noting that the absorption peaks of the yellow sample are split into two absorption peaks at 950 cm−1 and 970 cm−1, while the colorless sample has only one weak vibration. The absorption peak at 1035 cm−1 is related to Si-O, while the absorption peak at 950 cm−1 depends on Al-O [13], so this may be related to the content of Al in the colorless sample. The degree of substitution of Al for Si is greater than that of yellow samples. The absorption peaks 1107 cm−1, 1195 cm−1, and 1217 cm−1 are strong and sharp [13] and are caused by the stretching vibration of Si-O.
The test range of the transmission method is 2000–4000 cm−1. From the experimental results, the spectra of the colorless sample and the yellow sample are consistent. The absorption peaks at 2503 cm−1 and 2632 cm−1 are both absorption peaks of carbonate, which are caused by the symmetric and antisymmetric stretching vibration of CO32−. The absorption peaks at 2885 cm−1 and 2962 cm−1 are attributed to the first-order frequency doubling peak of CO32− antisymmetric stretching vibration. The absorption peak at 3051 cm−1 is attributed to the stretching vibration of M-OH. 3587 cm−1 and is caused by the symmetric stretching vibration of O-H [24].
3.3.2. Raman Spectra Analysis
The Raman spectra of two color scapolites were tested, and the experimental results are shown in Figure 7. The results show that the Raman spectra of colorless and yellow samples are completely consistent, which is consistent with # R040043 in RRUFF. Unlike the study of infrared spectroscopy, scapolite has not received enough attention in the study of Raman spectroscopy. There is a lack of research on Raman spectroscopy and its peak assignment in the literature. Therefore, this paper will combine the previous research, synthesize the above crystal structure research, and analyze and assign its peak position with reference to the framework silicate.
There are eleven obvious absorption peaks in the range of 100–1500 cm−1, including two strong absorption peaks, six moderate absorption peaks, and three weak absorption peaks. Predecessors have carried out a lot of research on the Raman spectra of silicate minerals. You et al. found that the Raman peaks below 400 cm−1 corresponded to the vibration of M-O and the lattice vibration mode between lattice skeletons [26].
Therefore, the absorption peaks of 108 cm−1, 162 cm−1, 263 cm−1, 300 cm−1, 336 cm−1, and 360 cm−1 in scapolite are attributed to the vibration of M-O and lattice vibration between lattice skeletons. The Raman peak in the range of 400–800 cm−1 is the bending vibration or stretching vibration of the bridge oxygen (Si-O-Si) between the silicon-oxygen tetrahedrons. Mysen [27] and McMillan et al. [28,29] proposed that the absorption peak at 464 cm−1 is the bending vibration of bridge oxygen in the silicon-oxygen tetrahedral structural unit, so the absorption peak at 459 cm−1 in scapolite should be attributed to the bending vibration of Si-O-Si. There is also an absorption peak from 500–550 cm−1 for nepheline and sodalite, which are also feldspathoids minerals. Pan et al. calculated it using the Dmol3DFT quantum mechanics program. The results show that it is caused by the bending vibration of Si-Obr [30]. Therefore, it is speculated that the spectral peak of scapolite at 537 cm−1 belongs to the bending vibration of Si-Obr. Pan et al. found that the absorption peak in the range of 700–800 cm−1 was caused by the symmetric stretching vibration caused by the non-bridging oxygen of AlⅣ-Onb tetracoordinate aluminum [30]. Therefore, the absorption peak at 773 cm−1 in scapolite should be attributed to the symmetric stretching vibration caused by the non-bridging oxygen of AlⅣ-Onb tetracoordinate aluminum. Previous studies have shown that the absorption peak in the range of 800–1200 cm−1 is caused by the non-bridging oxygen symmetric stretching vibration between Si-Onb of the silicon-oxygen tetrahedron [31,32], and the characteristic peak will have a significant left shift as AlⅣ enters the silicate skeleton. The sodalite, which belongs to the same group as scapolite, has an absorption peak of 992 cm−1, and the nepheline, which is also a feldspathoids mineral, has an absorption peak of 982 cm−1 and 1103 cm−1 [30]. Therefore, the absorption peaks at 990 cm−1 and 1110 cm−1 should be attributed to the non-bridge oxygen symmetric stretching vibration between Si-Onb. Based on the above discussion, the spectral peaks of scapolite are summarized in Table 2.
3.3.3. UV-Vis Analysis
There are few studies on the coloration mechanism of scapolite. Choudhary et al. proposed that the absorption band of purple scapolite at 550 nm is produced by Fe3+, which is also the reason why scapolite is purple [2]. However, there is still a lack of complete analysis and research on the coloration mechanism of yellow scapolite. Because scapolite is a feldspathoids mineral and has a similar structure to feldspar, the analysis of the coloring mechanism of scapolite in this paper mainly refers to the previous research results on the coloring mechanism of feldspar.
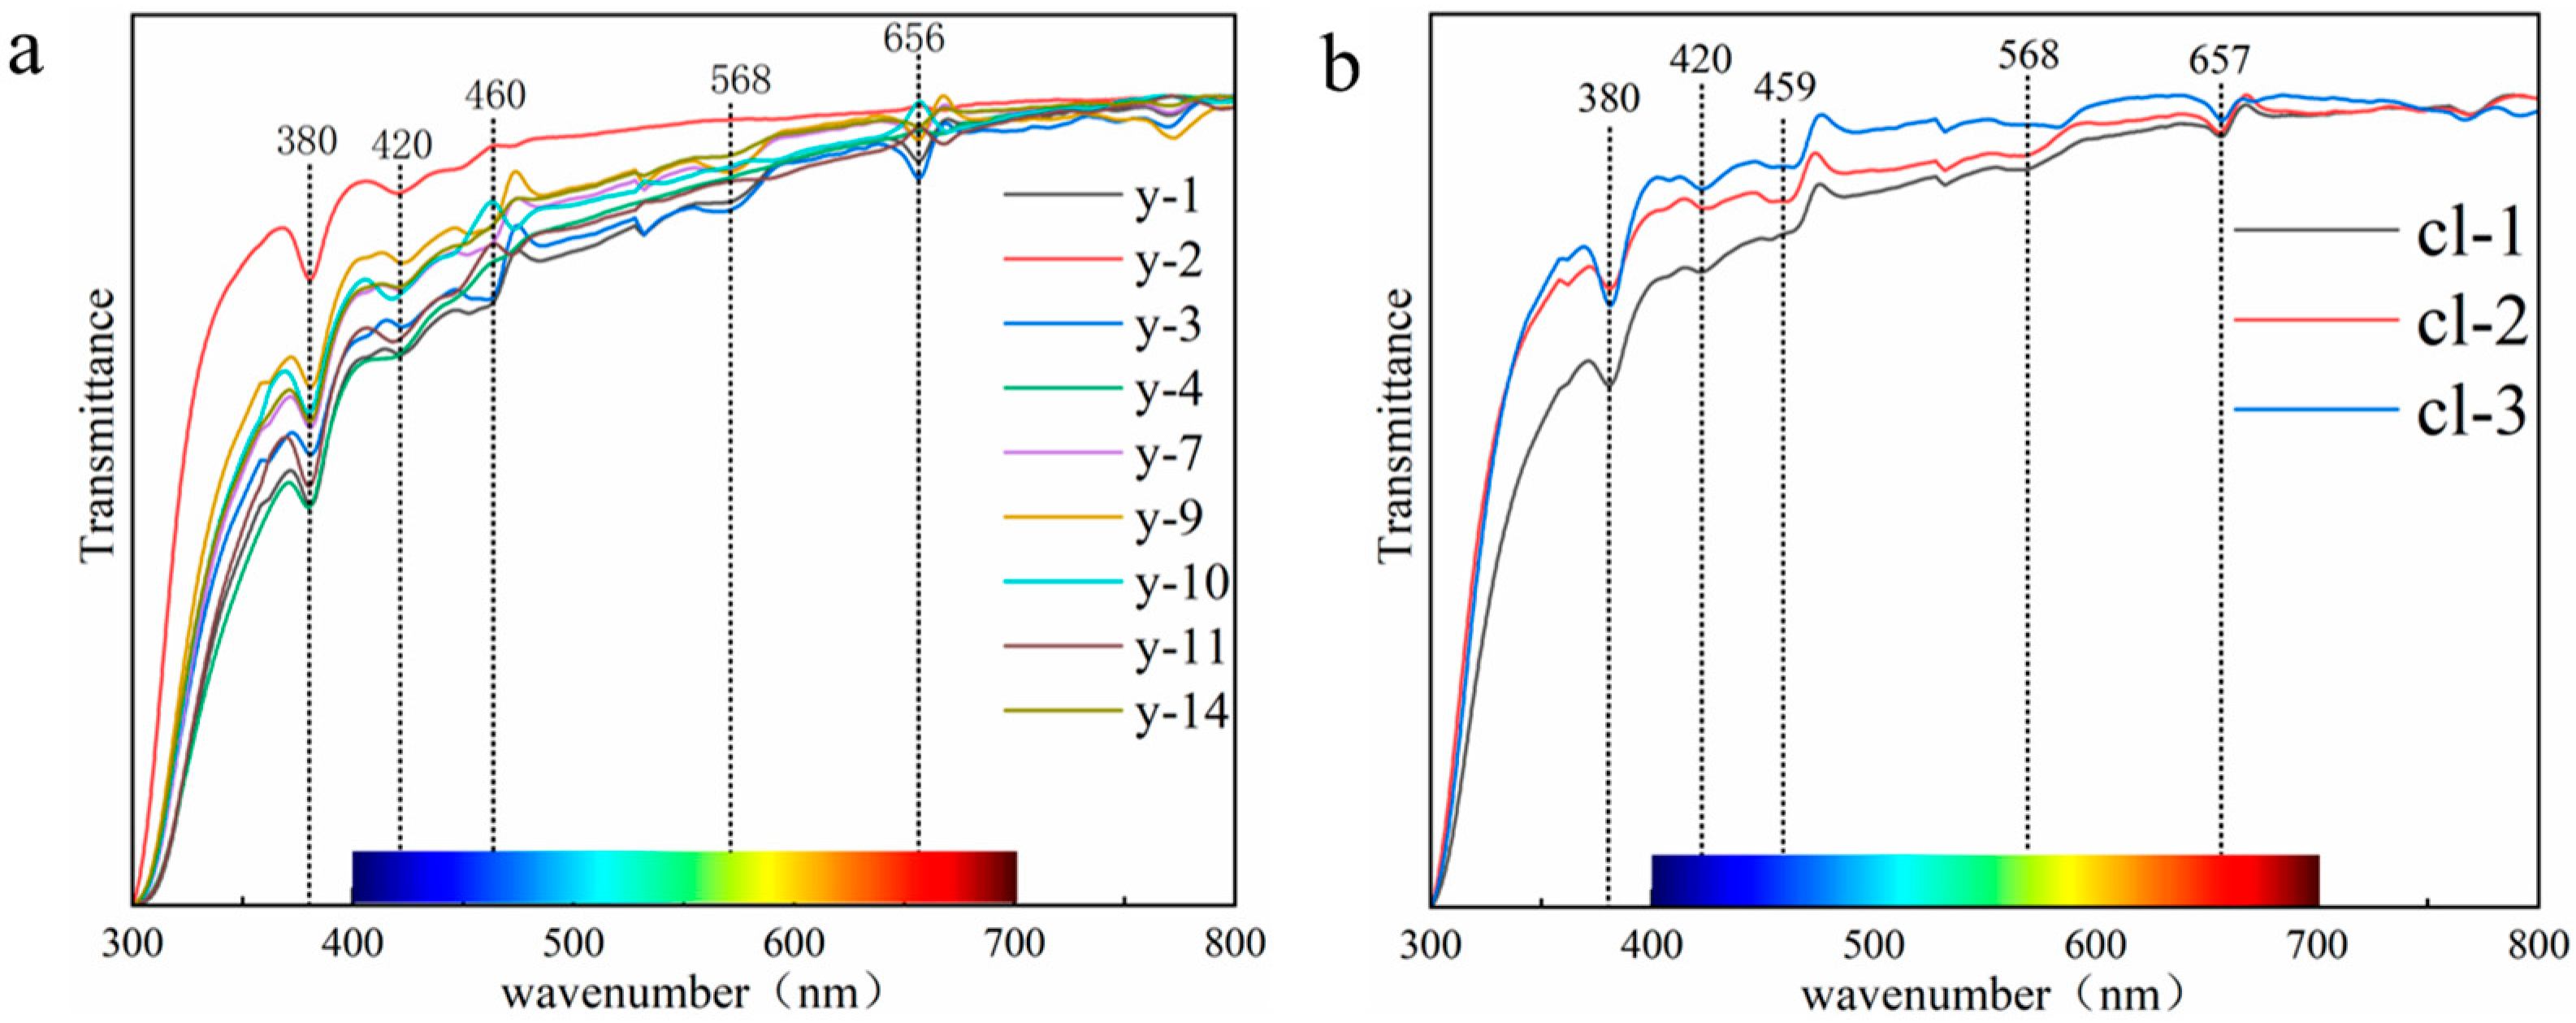
As shown in Figure 8, the experimental results show that the absorption spectra of colorless and yellow scapolite are almost the same, and the main absorption bands of scapolite exist near 380 nm, 420 nm, 530 nm, and 657 nm. Fe3+ in the framework silicate will replace Al and Si in the backbone of the structure, causing absorption peaks near 377 nm, 417 nm, 442 nm, and 483 nm [33]. The electronic configuration of Fe3+ is 3d5, and there is only one sixfold degenerate ground state energy level 6A1. Therefore, scapolite has a narrow absorption band at 380 nm, which is caused by the 6A1→4E(4D) transition of Fe3+. The full width at half maximum of the absorption band at 420 nm is wider, which is caused by 6A1→4T2(4D) of Fe3+. The absorption at 460 nm is caused by the 6A1→4A14E(4G) transition [34,35]. The red labradorite found in the United States contains a much higher Cu content than ordinary feldspar, which also gives it an absorption peak at 569 nm [36]. The red feldspar treated by Cu diffusion found in the market has absorption peaks at 565 nm and 660 nm [37]. Therefore, the absorption peaks at 568 nm and 657 nm in scapolite are related to the trace Cu element contained in it, which is produced by Cu→Cu+. Of course, from Figure 7, we can easily see that the absorption of the blue-purple region is significantly stronger than that of the red region, so scapolites will show yellow. Therefore, we prefer that Fe3+ is the chromophore of the yellow scapolite, while Cu is almost ineffective.
Through the above discussion, combined with the results of component analysis, we put forward a point of view. The scapolite is yellow because it contains a certain amount of Fe. For example, the Fe content in the yellow sample y-1 in this paper is 0.32%. When the Fe content is low, it is colorless. For example, the Fe content in the colorless sample cl-2 in this paper is 0.11%. This view can be supported by previous studies—Yellow feldspar contains more Fe than colorless feldspar, which makes the two colors different [38]. Based on the above discussion, the yellow color of scapolite is caused by the combination of Fe3+ and Cu, in which Fe3+ plays a decisive role, which is the main reason for the yellow color of scapolite, and the role of Cu needs further study.
3.4. Luminescence Properties of Scapolite
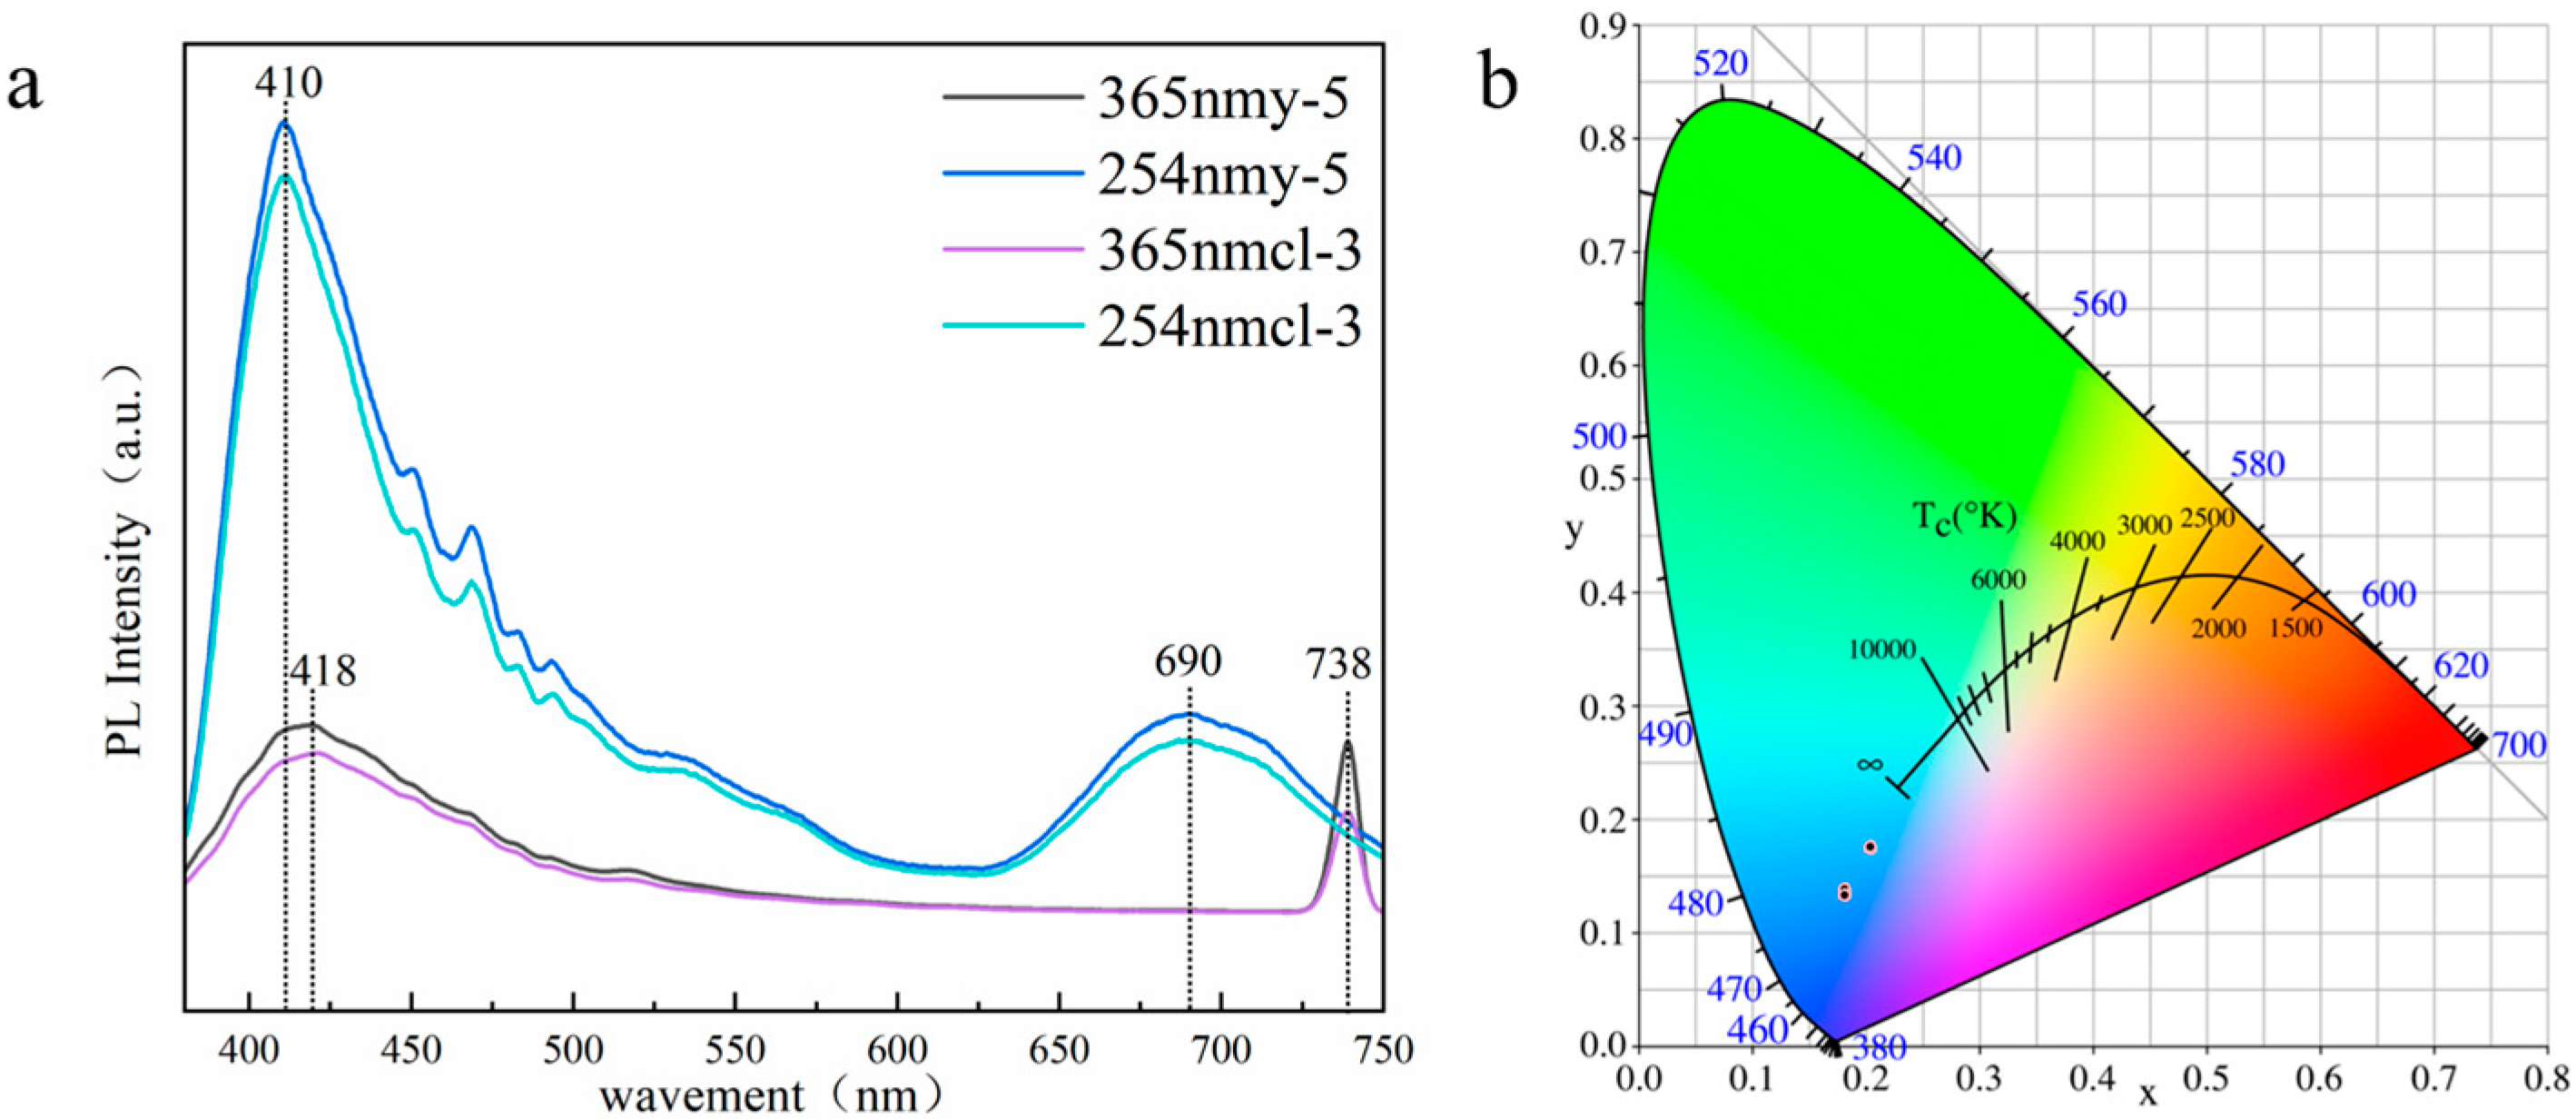
Different from the orange fluorescence found by previous scholars, the yellow and colorless Scapolite studied in this paper showed blue fluorescence. The excitation spectra of colorless and yellow scapolite collected under 254 nm and 365 nm excitation light sources are shown in Figure 9a, and the image of their color coordinates on CIE1931 is shown in Figure 9b. The results showed that colorless and yellow scapolite fluoresced blue under both long-wave UV and short-wave UV, but the fluorescence intensity of scapolite is much stronger under 254 nm excitation, which is intuitively manifested by the more intense blue fluorescence of the colorless sample. In the short-wave region, scapolite has a broad strong excitation peak centered at 410 nm, which is the reason for its blue fluorescence. The experimental results of ICP-MS of y-5 and cl-3 samples (shown in Table S3 in the supporting document) show that scapolite samples contain rare earth elements Ce, Eu, La, Lu, Nd, Th, Tm, Y, and Yb. Obviously, the strong excitation at 410 nm is produced by 4f1 → 5d1 of Ce3+ [39], which is the reason for the blue fluorescence of the scapolite. The excitation in the range of 450–500 nm is produced by other rare earth elements in the scapolite. In the red region, there is a very obvious strong excitation band in scapolite, which shows broadband centered at 690 nm under the excitation of 365 nm, and a narrow excitation peak centered at 738 nm under the excitation of 254 nm. This is mainly caused by the presence of (S2)− dimer in scapolite, which is also the reason why scapolite exhibits orange fluorescence [15,16]. However, it is obvious that the excitation of the blue region is much stronger than that of the red region in the scapolite, so the scapolite still exhibits blue fluorescence as a whole. In summary, scapolite has two very strong excitation centers both in the short-wave and long-wave UV. The rare earth elements make scapolite appear blue in fluorescence, in which Ce3+ plays a dominant role.
4. Conclusions
In summary, the Raman peaks of scapolite were assigned completely, and the gemological characteristics, crystal structure, and chemical composition of colorless and yellow scapolite were systematically compared. The coloration mechanism of yellow scapolite was obtained, and the origin of blue fluorescence of scapolite was discussed for the first time.
The refractive index of colorless and yellow scapolite is 1.535–1.564, the birefringence range is 0.014–0.027, and the specific gravity is 2.63–2.65. The infrared spectra and Raman spectra of colorless and yellow scapolite are identical, which is consistent with the standard spectra of scapolite. The Me% values of colorless scapolite and yellow scapolite are 51.10% and 77.30%, respectively. This means that both of them are mizzonite, so they have very consistent gemological characteristics and crystal structures. The results of UV-Vis showed that the scapolite was yellow because of the presence of Fe3+. The 6A1→4E(4D), 6A1→4T2(4D) and 6A1→4A14E(4G) of Fe3+ in scapolite were observed. This makes the scapolite appear yellow. The difference in Fe content is the reason for the color difference between colorless scapolite and yellow scapolite. Additionally, the Fe content in colorless scapolite is only one-third of that in yellow scapolite, so it is colorless. The blue fluorescence is caused by the 4f1 → 5d1 transition of Ce3+, which makes scapolite form a strong and wide excitation band centered at 410 nm. Given the high consistency between yellow scapolite and colorless scapolite in the above studies, these two scapolites should be the same type. These conclusions are helpful to the identification of scapolite and deepen the understanding of the coloration mechanism of scapolite. This paper makes a preliminary explanation for the blue fluorescence phenomenon of gem-grade scapolite, which may provide a new perspective for the future study of the tenebrescence of scapolite.
Supplementary Materials
The following supporting information can be downloaded at: https://www.mdpi.com/article/10.3390/cryst13030462/s1, supporting document Table S1: the XRF test results of scapolite; supporting document Table S2: EPMA test results of scapolite; supporting document Table S3: ICP-MS test results of scapolite.
Author Contributions
Performing the experiment, Y.R.; analysis, Y.R.; writing the original manuscript, Y.R.; review and editing, Q.G. and L.L.; translation, S.Z. All authors have read and agreed to the published version of the manuscript.
Funding
This study was supported by the National Science and Technology Infrastructure, the National Infrastructure of Mineral, Rock and Fossil Resources for Science and Technology (http//www.nimrf.net.cn, accessed on 25 December 2021), as well as the Program of the Data Integration and Standardization in the Geological Science and Technology from MOST, China, grant number 2013FY110900-3.
Data Availability Statement
Not applicable.
Conflicts of Interest
The authors declare no conflict of interest.
References
- Shaw, D.M. The Geochemistry of Scapolite Part I. Previous Work and General Mineralogy. J. Petrol. 1960, 1, 218–260. [Google Scholar] [CrossRef]
- Choudhary, G. Purple scapolite. Gems Gemol. 2015, 51, 202–203. [Google Scholar]
- Milkey, R.G. Infrared Spectra of Some Tectosilicates. Am. Mineral. 1960, 45, 990–1007. [Google Scholar]
- Newton, R.C.; Goldsmith, J.R. Stability of the end-member scapolites: 3NaAlSi3O8·NaCl, 3CaAl2Si2O8·CaCO3, 3CaAl2Si2O8·CaSO4. Z. Krist. Cryst. Mater. 1976, 143, 333–353. [Google Scholar] [CrossRef]
- Litvinenko, A.K.; Moiseeva, S.B.; Odinaev, S.A.; Utenkov, V.A. Geology of the Chernogorskoe Gem-Quality Scapolite Deposit (Central Pamirs, Tajikistan). Geol. Ore Depos. 2019, 61, 481–493. [Google Scholar] [CrossRef]
- Almeida, K.M.F.; Jenkins, D.M. A comparison between the stability fields of a Cl-rich scapolite and the end-member marialite. Am. Mineral. 2019, 104, 1788–1799. [Google Scholar] [CrossRef]
- Filiberto, J.; Treiman, A.H.; Giesting, P.A.; Goodrich, C.A.; Gross, J. High-temperature chlorine-rich fluid in the martian crust: A precursor to habitability. Earth Planet. Sci. Lett. 2014, 401, 110–115. [Google Scholar] [CrossRef]
- Zeng, L.; Zhao, X.; Hammerli, J.; Fan, T.; Spandler, C. Tracking fluid sources for skarn formation using scapolite geochemistry: An example from the Jinshandian iron skarn deposit, Eastern China. Miner. Depos. 2019, 55, 1029–1046. [Google Scholar] [CrossRef]
- Pauling, L. The structure of some sodium and calcium aluminosilicates. Proc. Natl. Acad. Sci. USA 1930, 16, 453–459. [Google Scholar] [CrossRef] [Green Version]
- Schiebold, E.; Seumel, G. Über die Kristallstruktur von Skapolith. Z. Krist. Cryst. Mater. 1932, 81, 110–134. [Google Scholar] [CrossRef]
- Papike, J.J.; Zoltai, T. The crystal structure of a marialite scapolite. Am. Mineral. 1965, 50, 641–655. [Google Scholar]
- Antao, S.M.; Hassan, I. The structures of marialite (Me 6) and meionite (Me 93) in space groups P42/n and I4/m, and the absence of phase transitions in the scapolite series. Powder Diffr. 2011, 26, 119–125. [Google Scholar] [CrossRef]
- Wehrenberg, J.P. The Infrared Absorption Spectra of Scapolite. Am. Mineral. 1971, 56, 1639. [Google Scholar]
- Swayze, G.A.; Clark, R.N. Infrared-spectra and crystal-chemistry of scapolites–implications for martian mineralogy. J. Geophys. Res. Solid Earth Planets 1990, 95, 14481–14495. [Google Scholar] [CrossRef]
- Aierken, S.; Kusachi, I.; Kobayashi, S.; Atobe, K.; Yamashita, N. Photoluminescence spectra of S2− center in natural and heat-treated scapolites. Phys. Chem. Miner. 2008, 35, 137–145. [Google Scholar] [CrossRef]
- Blumentritt, F.; Latouche, C.; Morizet, Y.; Caldes, M.T.; Jobic, S.; Fritsch, E. Unravelling the Origin of the Yellow-Orange Luminescence in Natural and Synthetic Scapolites. J. Phys. Chem. Lett. 2020, 11, 4591–4596. [Google Scholar] [CrossRef]
- Xu, B.; Hou, Z.Q.; Griffin, W.L.; Zheng, Y.C.; Wang, T.; Guo, Z.; Hou, J.; Santosh, M.; O’Reilly, S.Y. Cenozoic lithospheric architecture and metallogenesis in Southeastern Tibet. Earth-Sci. Rev. 2021, 214, 03472. [Google Scholar] [CrossRef]
- Feininger, T. An Introduction to the Rock-Forming Minerals (third edition). Can. Mineral. 2013, 51, 663–664. [Google Scholar] [CrossRef]
- Pezzotta, F.; Superchi, M.; Gambini, E.; Castaman, E. Yellow Scapolite from Ihosy, Madagascar. Gems Gemol. 2010, 46, 274–279. [Google Scholar]
- Schipf, R.G. Color Encyclopedia of Gemstones (Book Review). Libr. J. 1978, 103, 673. [Google Scholar]
- Ulbrich, H.H. Crystallographic data and refractive indices of scapolites. Am. Mineral. 1973, 58, 81–89. [Google Scholar]
- Xu, B.; Hou, Z.Q.; Griffin, W.L.; Lu, Y.; Belousova, E.; Xu, J.F.; O’Reilly, S.Y. Recycled volatiles determine fertility of porphyry deposits in collisional settings. Am. Mineral. 2021, 106, 656–661. [Google Scholar] [CrossRef]
- Xu, B.; Hou, Z.Q.; Griffin, W.L.; O’Reilly, S.Y. Apatite halogens and Sr–O and zircon Hf–O isotopes: Recycled volatiles in Jurassic porphyry ore systems in southern Tibet. Chem. Geol. 2022, 605, 120924. [Google Scholar] [CrossRef]
- Sokolova, E.; Hawthorne, F.C. Hawthorne.The crystal chemistry of the scapolite-group minerals. I. Crystal structure and long-range order. Can. Mineral. 2009, 46, 1527–1554. [Google Scholar] [CrossRef]
- Schwarcz, H.P.; Speelman, E.L. Determination of sulfur and carbon coordination in scapolite by infra-red absorption spectrophotometry. Am. Mineral. 1965, 50, 656. [Google Scholar]
- You, J.L.; Jiang, G.C.; Hou, H.Y.; Chen, H.; Wu, Y.Q.; Xu, K.D. Quantum chemistry study on superstructure and Raman spectra of binary sodium silicates. J. Raman Spectrosc. 2005, 36, 237–249. [Google Scholar] [CrossRef]
- Mysen, B.O.; Virgo, D.; Scarfe, C.M. Scarfe.Relations between the anionic structure and viscosity of silicate melts; a Raman spectroscopic study. Am. Mineral. 1980, 65, 690–710. [Google Scholar]
- McMillan, P. Structural studies of silicate glasses and melts; applications and limitations of Raman spectroscopy? Am. Mineral. 1984, 69, 622–644. [Google Scholar]
- McMillan, P.; Wolf, G.; Poe, B.T. Vibrational spectroscopy of silicate liquids and glasses. Chem. Geol. 1992, 96, 351–366. [Google Scholar] [CrossRef]
- Pan, F.; Yu, X.; Mo, X. Raman spectra of framework silicate minerals. J. Chin. Ceram. Soc. 2009, 37, 2043. [Google Scholar]
- Akaogi, M.; Ross, N.L.; McMillan, P.; Navrotsky, A. The Mg2SiO4 polymorphs (olivine, modified spinel and spinel) thermodynamic properties from oxide melt solution calorimetry, phase relations, and models of lattice vibrations. Am. Mineral. 1984, 69, 499–512. [Google Scholar]
- Xu, K.D.; Jiang, G.C.; Huang, S.P.; You, J.L. A study on the bonding structure of CaO-SiO2 slag by means of molecular dynamics simulation. Sci. China Ser. E Technol. Sci. 1999, 42, 77–82. [Google Scholar] [CrossRef]
- Burns, R.G. Mineralogical Applications of Crystal Field Theory; Cambridge at the University Press: Cambridge, UK, 1970. [Google Scholar]
- Hofmeister, A.M.; Rossman, G.R. Color in feldspars. Rev. Mineral. 1983, 2, 271–280. [Google Scholar]
- Krzemnicki, M.S. Red and green labradorite feldspar from Congo. J. Gemmol. 2004, 29, 15–23. [Google Scholar] [CrossRef]
- Hofmeister, A.M.; Rossman, G.R. Exsolution of metallic copper from Lake Country labradorite. Geology 1985, 13, 644–647. [Google Scholar] [CrossRef]
- Chen, Z. Discussion on the Color Genesis of ‘Tibet Red Feldspar’; China University of Geosciences: Wuhan, China, 2014. [Google Scholar]
- Quinn, E.P.; Muhlmeister, S. Albitic “moonstone” from the Morogoto region, Tanzania. Gems Gemol. 2005, 41, 60–61. [Google Scholar]
- Ma, Y.; He, J.; Aziguli, R.; Bahadeer, R.; Aierken, S. Photoluminescence of Sinthetic Scapolite Na4Ca4Al6Si9O24Phosphors Activated with Ce3+ and Tb3+ and Energy Transfer from Ce3+ to Tb3+. Spectrosc. Spectr. Anal. 2015, 11, 3241–3246. [Google Scholar]
Figure 1.
Pictures of colorless scapolites.

Figure 2.
Pictures of yellow scapolites.

Figure 3.
Experiment flow chart.

Figure 4.
Surface and internal characteristics of scapolite. (a) Corresponding to cl-1, (b) corresponding to y-15, (c) corresponding to y-4, (d) corresponding to cl-2, (e) corresponding to y-6, (f) corresponding to y-13.
Figure 4.
Surface and internal characteristics of scapolite. (a) Corresponding to cl-1, (b) corresponding to y-15, (c) corresponding to y-4, (d) corresponding to cl-2, (e) corresponding to y-6, (f) corresponding to y-13.

Figure 5.
The XRD patterns of colorless and yellow scapolite.

Figure 6.
(a) Infrared spectra (reflection) of yellow samples; (b) infrared spectra (reflection) of colorless samples; (c) infrared spectra (transmission) of scapolites.
Figure 6.
(a) Infrared spectra (reflection) of yellow samples; (b) infrared spectra (reflection) of colorless samples; (c) infrared spectra (transmission) of scapolites.

Figure 7.
Raman spectra of colorless (upper) and yellow (lower) samples.

Figure 8.
(a) UV-Vis spectra of yellow scapolites; (b) UV-Vis spectra of colorless scapolites.

Figure 9.
Fluorescence spectra of colorless, yellow scapolite (a) and projection on CIE1931 (b).


Table 1.
Conventional gemological properties of scapolite.
| Sample Number | Color | Luster | Transparency | Specific Gravity | Refractive Index | Birefringence |
|---|---|---|---|---|---|---|
| cl-1 | Colorless | Vitreous luster | Opaque | 2.65 | 1.543–1.564 | 0.021 |
| cl-2 | Colorless | Vitreous luster | Opaque | 2.64 | 1.548–1.562 | 0.014 |
| cl-3 | Colorless | Vitreous luster | Opaque | 2.64 | 1.545–1.561 | 0.016 |
| y-1 | Yellow | Vitreous luster | Opaque | 2.65 | 1.535–1.562 | 0.027 |
| y-2 | Yellow | Vitreous luster | Opaque | 2.65 | 1.546–1.560 | 0.014 |
| y-3 | Yellow | Vitreous luster | Opaque | 2.64 | 1.543–1.558 | 0.015 |
| y-4 | Yellow | Vitreous luster | Opaque | 2.64 | 1.543–1.562 | 0.019 |
| y-7 | Yellow | Vitreous luster | Opaque | 2.63 | 1.545–1.560 | 0.015 |
| y-9 | Yellow | Vitreous luster | Opaque | 2.64 | 1.545–1.561 | 0.016 |
| y-10 | Yellow | Vitreous luster | Opaque | 2.65 | 1.545–1.561 | 0.016 |
Table 2.
Assignment of Raman spectra of scapolite.
| M-O Lattice Vibration | Si-O-Si Bending Vibration | Si-Obr Symmetric Bending Vibrations | AlⅣ-Onb Symmetric Stretching Vibrations | Si -Onb Symmetric Stretching Vibrations | |
|---|---|---|---|---|---|
| Raman characteristic peak/cm−1 | 108 cm−1, 162 cm−1 263 cm−1, 300 cm−1 336 cm−1, 360 cm−1 | 459 cm−1 | 537 cm−1 | 773 cm−1 | 990 cm−1 1110 cm−1 |
Disclaimer/Publisher’s Note: The statements, opinions and data contained in all publications are solely those of the individual author(s) and contributor(s) and not of MDPI and/or the editor(s). MDPI and/or the editor(s) disclaim responsibility for any injury to people or property resulting from any ideas, methods, instructions or products referred to in the content. |
© 2023 by the authors. Licensee MDPI, Basel, Switzerland. This article is an open access article distributed under the terms and conditions of the Creative Commons Attribution (CC BY) license (https://creativecommons.org/licenses/by/4.0/).
Share and Cite
MDPI and ACS Style
Rao, Y.; Guo, Q.; Zhang, S.; Liao, L. Comparative Study on Gemmological Characteristics and Luminescence of Colorless and Yellow Scapolites. Crystals 2023, 13, 462. https://doi.org/10.3390/cryst13030462
AMA Style
Rao Y, Guo Q, Zhang S, Liao L. Comparative Study on Gemmological Characteristics and Luminescence of Colorless and Yellow Scapolites. Crystals. 2023; 13(3):462. https://doi.org/10.3390/cryst13030462
Chicago/Turabian StyleRao, Yinghua, Qingfeng Guo, Sixue Zhang, and Libing Liao. 2023. "Comparative Study on Gemmological Characteristics and Luminescence of Colorless and Yellow Scapolites" Crystals 13, no. 3: 462. https://doi.org/10.3390/cryst13030462
Note that from the first issue of 2016, this journal uses article numbers instead of page numbers. See further details here.