

Early Detection of Damage of Inconel 718 with the Use of Strain-Hardening Cross-Effect

Lukasiewicz Research Network—Institute of Aviation, Al. Krakowska 110/114, 02-256 Warsaw, Poland
*
Author to whom correspondence should be addressed.
Crystals 2023, 13(3), 429; https://doi.org/10.3390/cryst13030429
Submission received: 3 February 2023
/
Revised: 24 February 2023
/
Accepted: 28 February 2023
/
Published: 2 March 2023
(This article belongs to the Special Issue Metals Manufacturing Techniques: Processing, Microstructure and Properties)
Abstract
:Indentation tests were used for early detection of deformation-induced damage of Inconel 718. Damage was produced in a controlled manner using specially designed specimens with a variable width of the gage part. Static tension, LCF, and HCF tests were performed to induce material damage. Accumulated plastic strain intensity was used as the reference measure of deformation-induced damage. Detection of damage progress in its early phase was based on the use of strain-hardening cross-effect. Experimentally determined correlation of hardness and indentation work with reference damage parameter was analyzed. The results of our analysis lead to the conclusion that the proposed experimental procedure is useful for the detection of deformation-induced damage in the early stage of the process.
1. Introduction
There exists no universally accepted method of direct measurement of the damage introduced into metal alloys by service loads in the early phase of the process (before physical discontinuities of the material are formed). In engineering practice, it is usually accepted to assume that changes in some material properties; for example, mass density [1] or local inelastic response [2,3] are related to the progress of damage under service loads. Such properties are then used to monitor damage progress as damage indicators. Many damage indicators were proposed in the literature [4,5], but only a few were proved to change in a unique way with progressing damage [1,2]. In the paper [5], a good review of damage indicators is given. According to this review damage indicators (or damage quantifying parameters, as they are called by authors) can be divided into several categories: metallurgical parameters, surface crack quantifications, mechanical parameters, and physical measures. The last of the mentioned categories include most non-destructive inspection methods such as X-radiography, acoustic emission, magnetic field methods, eddy current technique, and ultrasonic technique. The usefulness of the last two mentioned techniques for the detection of material damage was examined in another paper [6]. Those methods proved to be useful; however, it was concluded that standard techniques and equipment used for the detection of material flaws have to be modified in order to achieve a sensitivity allowing detection of the damage in the early stage.
Most mechanical parameters like, for example, strain or stress amplitude under cyclic loading, strain energy, elastic moduli, or endurance limit can be determined only with the use of destructive tests performed in a well-equipped strength laboratory. This is a serious disadvantage of such methods since they cannot be performed for the material of the engineering structure under service conditions. On the other hand, such methods can offer the best accuracy as long as it’s possible to prove that changes in the mechanical parameter in question are correlated with the progressing damage.
Most useful methods of damage detection should be applicable to the engineering structure in service conditions without necessitating the use of specially prepared specimens cut out from the structure component. Among such methods, we can find all kinds of surface inspection as well as indentation tests, for example, hardness measurements that are usually considered to be semi-destructive tests. In many cases, it is possible to measure the hardness of the material under service conditions (especially using microindentation tests). Moreover, the hardness is strictly related to the yield stress and its changes due to strain hardening. Yield and flow stress are proven to change with accumulated permanent deformation. Those changes have to be carefully examined for each material, taking into account the complex influence of pre-stressing on the yield locus in the stress space. The indentation test is a promising method for quantifying damage since it allows the evaluation of the yield and flow stress in the direction perpendicular to the material surface using a strain-hardening cross-effect. Propositions of the definitions of damage parameters based on hardness measurements were given in the formerly mentioned publications [4,5].
In the presented investigations, indentation tests will be used to quantify the damage of Inconel 718 introduced by monotonic and cyclic deformation. As it is widely accepted, the damage of metal alloys in the first phase (preceding formation of physical discontinuities) is run by plastic deformation, i.e., movement and multiplication of crystal structure defects, and, resulting from this movement, the agglomeration and locking on structural obstacles like grain boundaries or precipitations. This applies to both monotonic (ultimate strength, creep) and cyclic (fatigue) loadings in simple and complex stress states as reported in [7,8,9]. For this reason, indentation tests, the results of which are strictly related to changes in the yield stress should be suitable to quantify damage in the early phase. Moreover, this measurement allows for the investigation of local changes in the material properties, and since the damage is a local phenomenon, it can be regarded as an additional advantage.
2. Theoretical Foundations of Research
2.1. Strain-Hardening Cross-Effect
Strain-hardening cross-effect is the effect of pre-stressing on the yield limit in the direction perpendicular to that of pre-stressing. In three-dimensional principal stress space, the yield condition for isotropic material is usually shown as a cylinder inclined at some angle (equal for all axes) to all three axes of the coordination system. The cross-section of that cylinder corresponding to the plane stress can be illustrated as an ellipsis shown in Figure 1. If when applying uniaxial tension along the σ11 axis we yield material reaching the new yield limit σY11, then due to strain hardening we can expect some shift (kinematic hardening) and change of size (isotropic hardening or softening) of the ellipsis representing the yield condition. The center of the ellipsis is shifted by α11 which can be interpreted as the component of the back-stress tensor. Enlarged and shifted along the σ11 axis, the subsequent yield surface is shown in Figure 1. As we can see in this figure, in the direction σ33 perpendicular to the specimen gage part surface we can expect some change in the yield stress due to strain-hardening cross-effect. Subsequent yield stress in direction σ33 is denoted as σY33 and can be determined using an appropriate indentation test.
To investigate strain-hardening cross-effect, one has to perform testing in a complex stress state. Most of such experiments were performed on tubular specimens subject to axial load, torque, and internal pressure. The evolution of the yield surface due to strain hardening of material subject to complex stress state was investigated by many researchers, especially in the second half of the 20th century. Recently, such tests are rarely performed due to the high cost and high work effort necessary to produce credible results. Some of the papers regarding the verification of strain-hardening hypotheses also report results regarding strain-hardening cross-effect.
In the paper [10], the effect of tensile and torsional pre-strain on the subsequent yield surface was reported. Experiments were performed on thin-walled copper tubes subjected to simultaneous tension and torsion. The authors reported pronounced, positive cross-effect for the material pre-strained in either tension and torsion (tensile yield stress was increased by torsional pre-strain, and yield stress in shear was increased by tensile pre-strain). A similar effect was reported in [11] for En 25 steel tubular specimens subjected to pre-stress in either tension or torsion. In this case, the cross-effect of the tensile pre-stress is much greater than that of a shear pre-stress.
The results reported in the above-mentioned and other papers indicate that we can always expect some strain-hardening cross-effect due to initial pre-stressing. This kind of effect is expected to be useful for the quantification of deformation-induced damage in the phase preceding the nucleation of material discontinuities.
2.2. Damage Indicators and Damage Parameter
It was assumed, as proven in a formerly published paper [7], that modified Johnson’s proposition [12] of parameter quantifying damage (damage parameter) D can be used as the reference for the validation of other damage indicators. The definition of this parameter is as follows:
where stands for the current value of the accumulated plastic strain intensity and is the final value of the accumulated plastic strain intensity (corresponding to the failure of the material). Such a reference damage parameter is calculated as the ratio of the current plastic strain intensity at a given spot of the material to the value of plastic strain intensity corresponding to the failure of the material. In the case of an arbitrary loading path in the stress space, the damage indicator is calculated as integral to the plastic strain intensity along this path (index notation used):
The definition of this parameter, first given by Odquist in his paper [13], can be used for a proportional as well as a non-proportional path in the complex stress state.
If the material is subject to uniaxial load, which is the case in question, three non-zero strain tensor components can be identified as principal strains. In the case of a proportional strain path (monotonic deformation or ratcheting in the case of cyclic loading) and in terms of principal strain, plastic strain intensity can be expressed by the following formula [14]:
For deformation obtained as the result of an applied, uniaxial loading program, this parameter can be easily calculated on the base of the measurements of the initial and deformed geometry of the specimens’ gage part cross-sections marked in Figure 2.
The patented [15] method of calibration (and validation) of damage indicators was described in another paper [7]. The idea behind this procedure was to produce, in a single test, a plastic strain intensity field varying from zero (undamaged state) to that corresponding to failure in the gage part of the specimen, as shown in Figure 2. This gage part has a variable width b and constant thickness a. The deformation was produced by monotonic and cyclic loading to rupture. The plastic strain intensity at selected and marked cross-sections of the gage part was calculated on the base of measurements of the cross-section geometry before and after the test, assuming the incompressibility of the material. The failure strain corresponds to the plastic strain intensity at the fracture surface. Other details of the method used for the introduction of deformation-induced damage into the investigated material can be found in the patent description [15] and also in the aforementioned paper [7].
The accumulated plastic strain intensity can be used as a damage indicator for any mechanism of damage and arbitrary loading path in the stress space as suggested in this paper [3]. In the case of LCF and HCF tests, accumulated plastic strain consists of ratcheting and inelastic response in the load cycle (double hysteresis loop width) [3]. The sum of inelastic response is in this case (R = 0.05—only tensile load) negligible and can be disregarded. We can assume that all accumulation of plastic strain is the result of ratcheting. In the case of static tension, the damage is induced by monotonic deformation. The most important question in the case of the presented investigations is: how the uniaxial stress state resulting from the applied load program influences the yield limit in the perpendicular (normal to specimen surface) direction. We can assume that no residual stress acts in this direction and changes in yield stress and flow stress are the sole results of changes in crystal defect density, their agglomeration, and locking at obstacles (e.g., grain or phase boundaries). This allows us to eliminate, for example, the influence of the Bauschinger effect on the results of indentation tests.
The parameters selected to be used in the presented investigations as damage indicators—Brinell hardness HB and work of indentation limited by constant maximum load W—were calculated on the base of indentation test results. The correlation between the mentioned damage indicators and the reference damage parameter (1) was investigated and will be reported in the following paragraphs.
Hardness, by definition, is related to yield limit. The definition of hardness takes the following form [4]:
where F is the indentation force and S is the curved surface area of the indentation [16]. According to Lemaitre [4], the coefficient of proportionality has to be introduced into the relation between the hardness and the yield limit , so finally it takes the following form:
where c is the coefficient of proportionality.
Hardness is influenced both by strain hardening and damage in the form of discontinuities. This is also valid if we assume that the indentation is performed in the direction perpendicular to the initial, tensile loading. In the general case, both effects of dislocation structure change, and the creation and growth of micro-discontinuities contribute to damage progress; however, in the early phase of the process (before nucleation of micro-discontinuities) we can disregard the influence of discontinuities and focus on the change of the dislocation structure.
Loading can be performed along a non-proportional path in the stress space and micro-discontinuities of arbitrary orientation and form (planar cracks, voids) can be formed. In spite of this, the damage parameter D in this case shall be coupled with the isotropic component of the strain hardening law [4] and the yield condition shall be written as suggested in [17] in the following form:
where is the stress tensor, is the back-stress tensor, is the accumulated plastic strain intensity (2), and k is the yield stress in shear increasing with progressing plastic deformation (isotropic hardening). In the initial phase of damage, before the nucleation of micro-cracks, we can assume that yield stress is increasing due to the generation and mutual locking of dislocations. After the balance between the effect of strain hardening and the formation of discontinuities on the yield condition is achieved, yield stress shall start decreasing.
Since no back stress is expected in the direction perpendicular to the material surface ( = 0, see Figure 1) we can assume that the yield stress in this direction, for the initial phase of damage, is dominated by the change of dislocation density and its structure (isotropic hardening).
where k is the yield stress in shear (the initial value of this parameter is shown in Figure 1). In the later phase, the mechanism of damage is dominated by the creation and growth of physical micro-discontinuities limiting the ratcheting resulting from the dislocation movement. Such micro-discontinuities grow with applied load cycles and finally achieve a size enabling the triggering of uncontrolled crack extension leading to the final rupture of the specimen. If we can determine, on the basis of appropriate experiments, the form of both functions and we can find the critical (maximum) value of the hardness differentiating function (7):
It has to be mentioned at that point, that use of the linear damage function (1) doesn’t give reasonable results. The maximum value of hardness determined experimentally corresponds to a much higher value of than the value determined with the use of Equation (8). This leads to the conclusion that damage is not a linear function of the accumulated equivalent plastic strain. Bearing in mind that fact, the definition of the damage parameter proposed by Johnson doesn’t seem to be sufficient to describe all the phenomena responsible for the progress of material damage. A more appropriate measure of the damage shall be defined, for example, on the base of measurements of the residual ability to achieve permanent deformation. Using definition (1) the residual failure strain intensity can be given by a simple relation:
Assuming, for example, the Hancock–Mackenzie ductile failure criterion [18], we can postulate that the damage criterion for ductile materials can be modified to the following form:
where a is the constant characterizing the material in question and η is the triaxiality factor characterizing the stress state (ratio of first and second invariant of stress tensor). A simple measuring procedure for the determination of as well as a description of the necessary equipment can be found in the paper [19].
Summarizing, the usefulness of hardness measurements for damage assessment shall be applicable only to the initial phase of the process (before crack nucleation) and must be verified in an experimental way.
3. Materials and Methods
3.1. Equipment Used for Indentation Tests
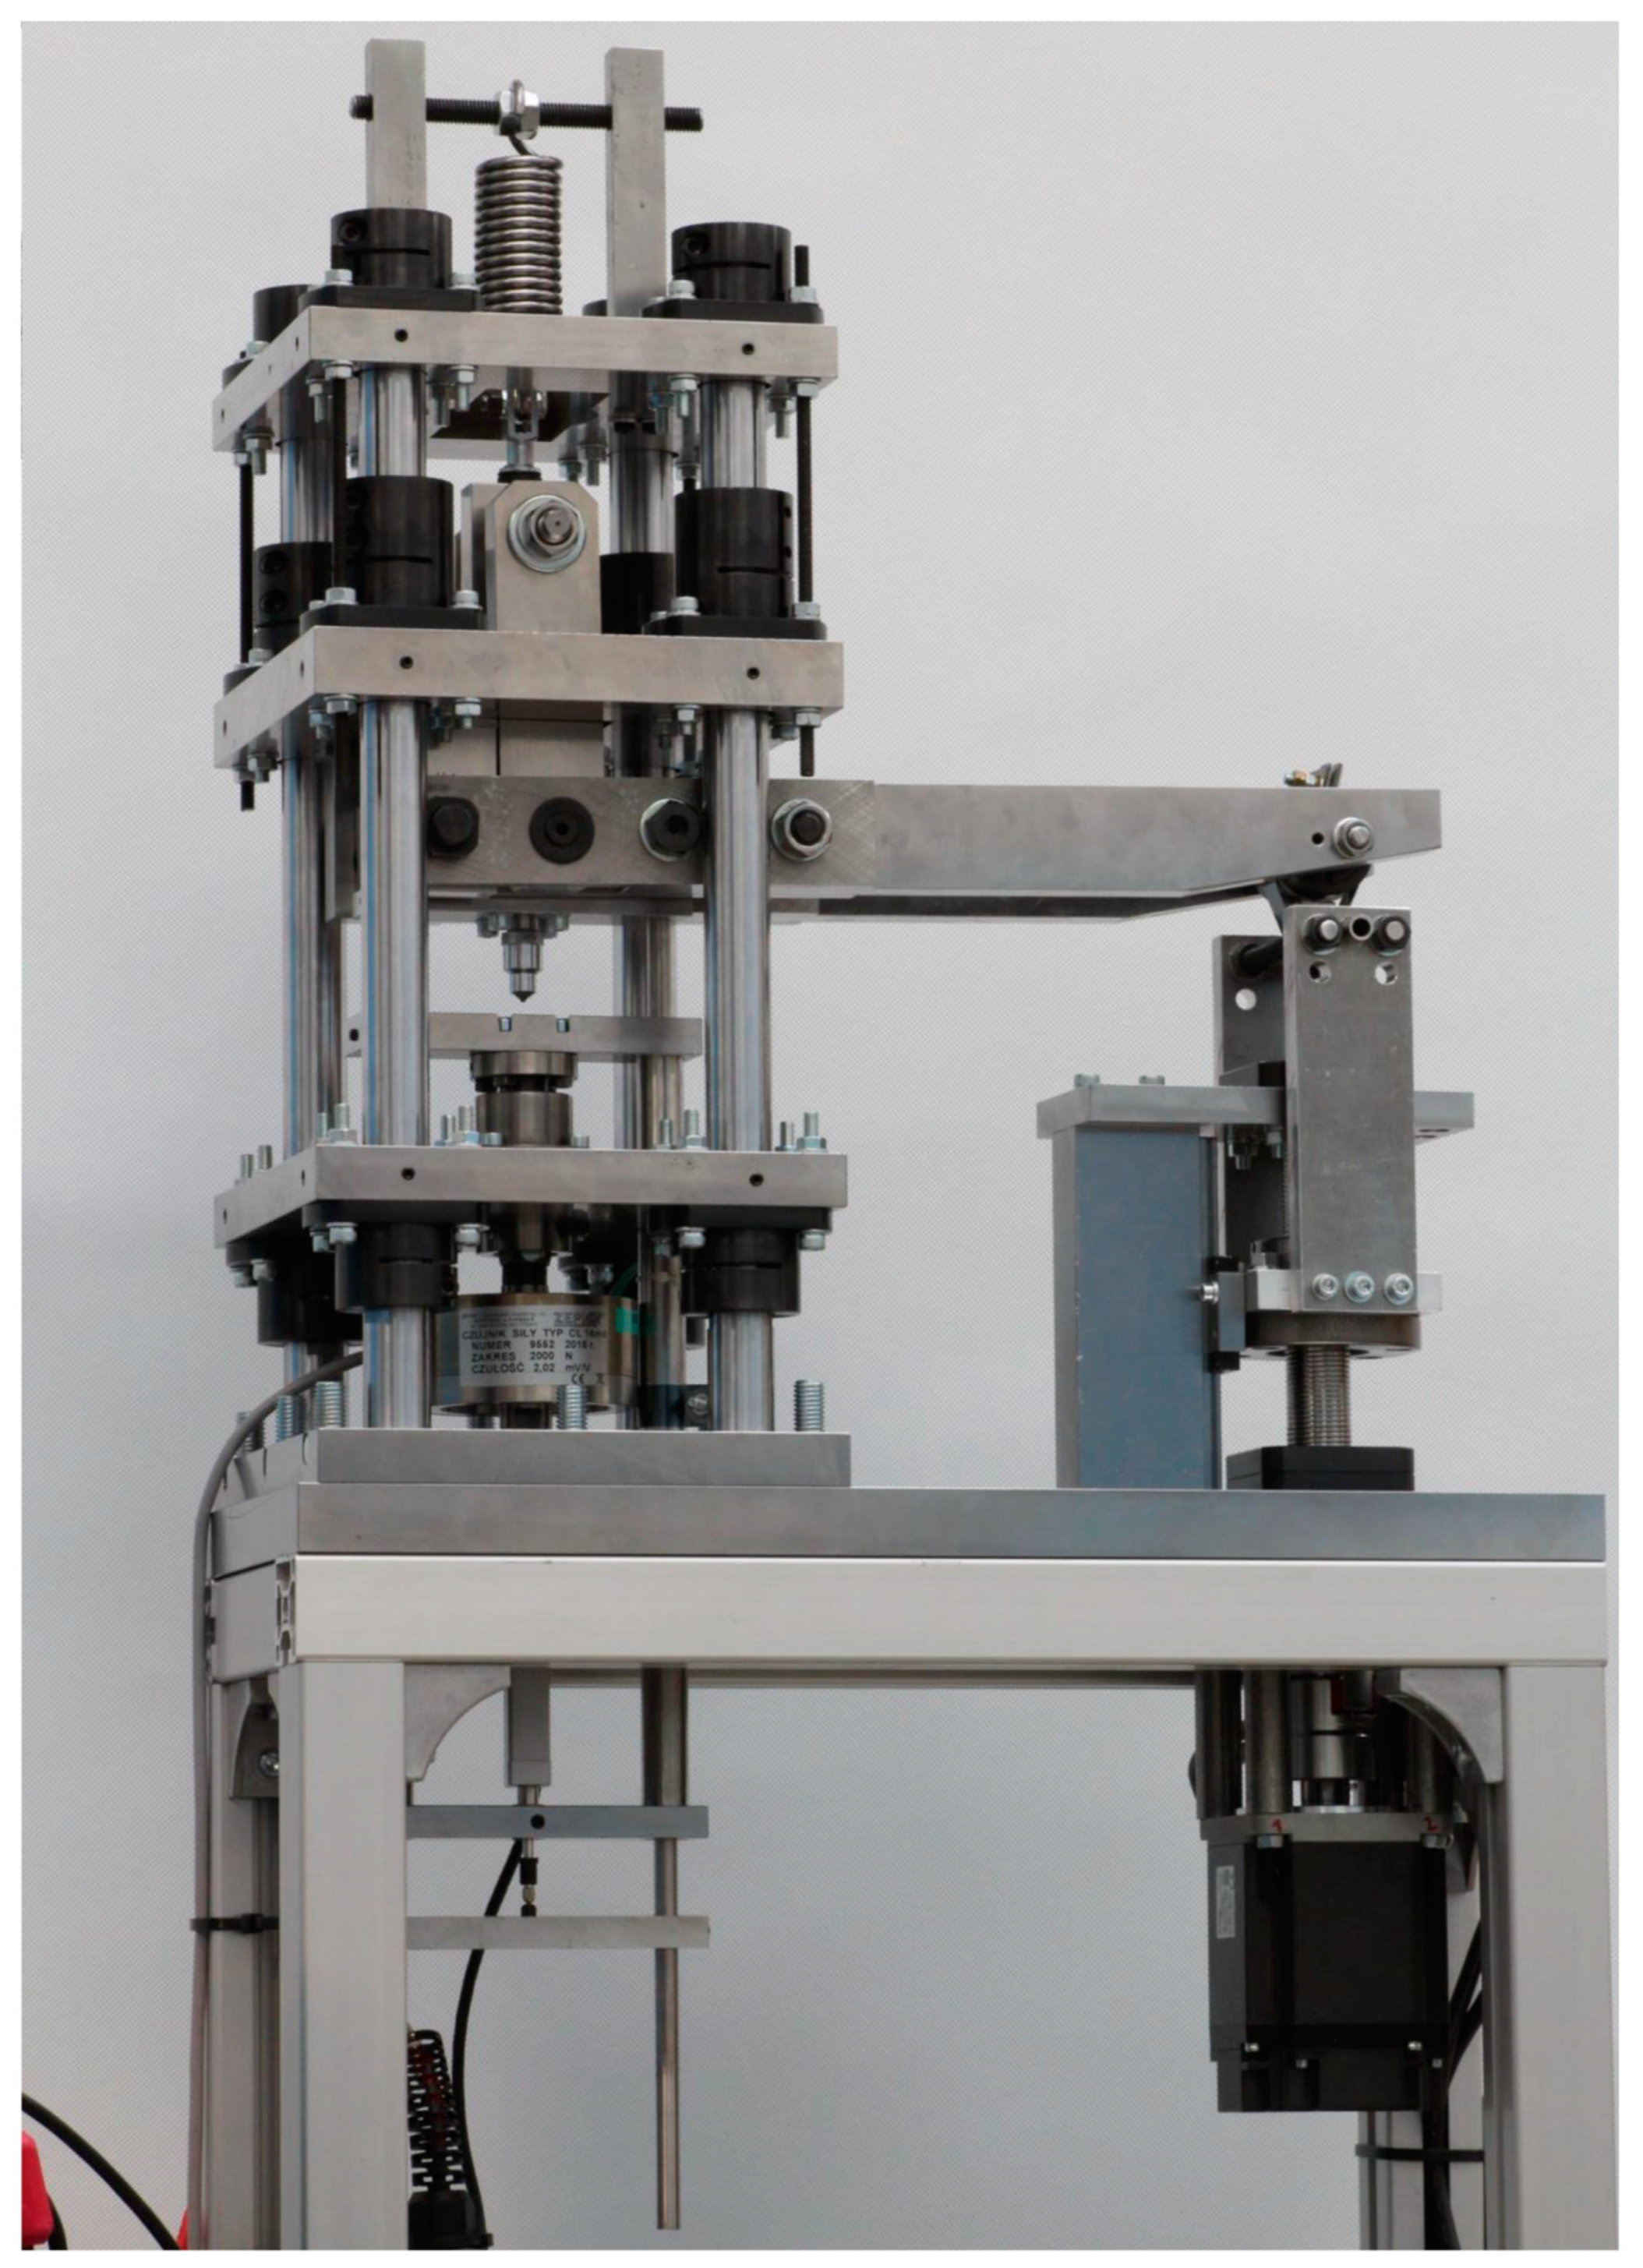
A special test set-up was designed and produced to perform the indentation test with elevated accuracy of displacement and load measurements. This setup is shown in Figure 3. The device is equipped with a 2 KN force sensor with a sensitivity of 2.0204 mV/V and a summary error of ≤0.2%, and is also equipped with a displacement gauge with typically 0.03 μm short-range accuracy. Data from the force sensor and the displacement gauge were acquired in LabVIEW using an acquisition card with a frequency of 100 Hz and a resolution of 0.1 N for the force sensor and 0.05 μm for the length gauge. As an intender, the tungsten carbide ball with a 2.5 mm diameter is used. The intender is moved using a leverage system and ball screw by the servo motor. During the indentation tests displacement of the indenter and force is recorded continuously.
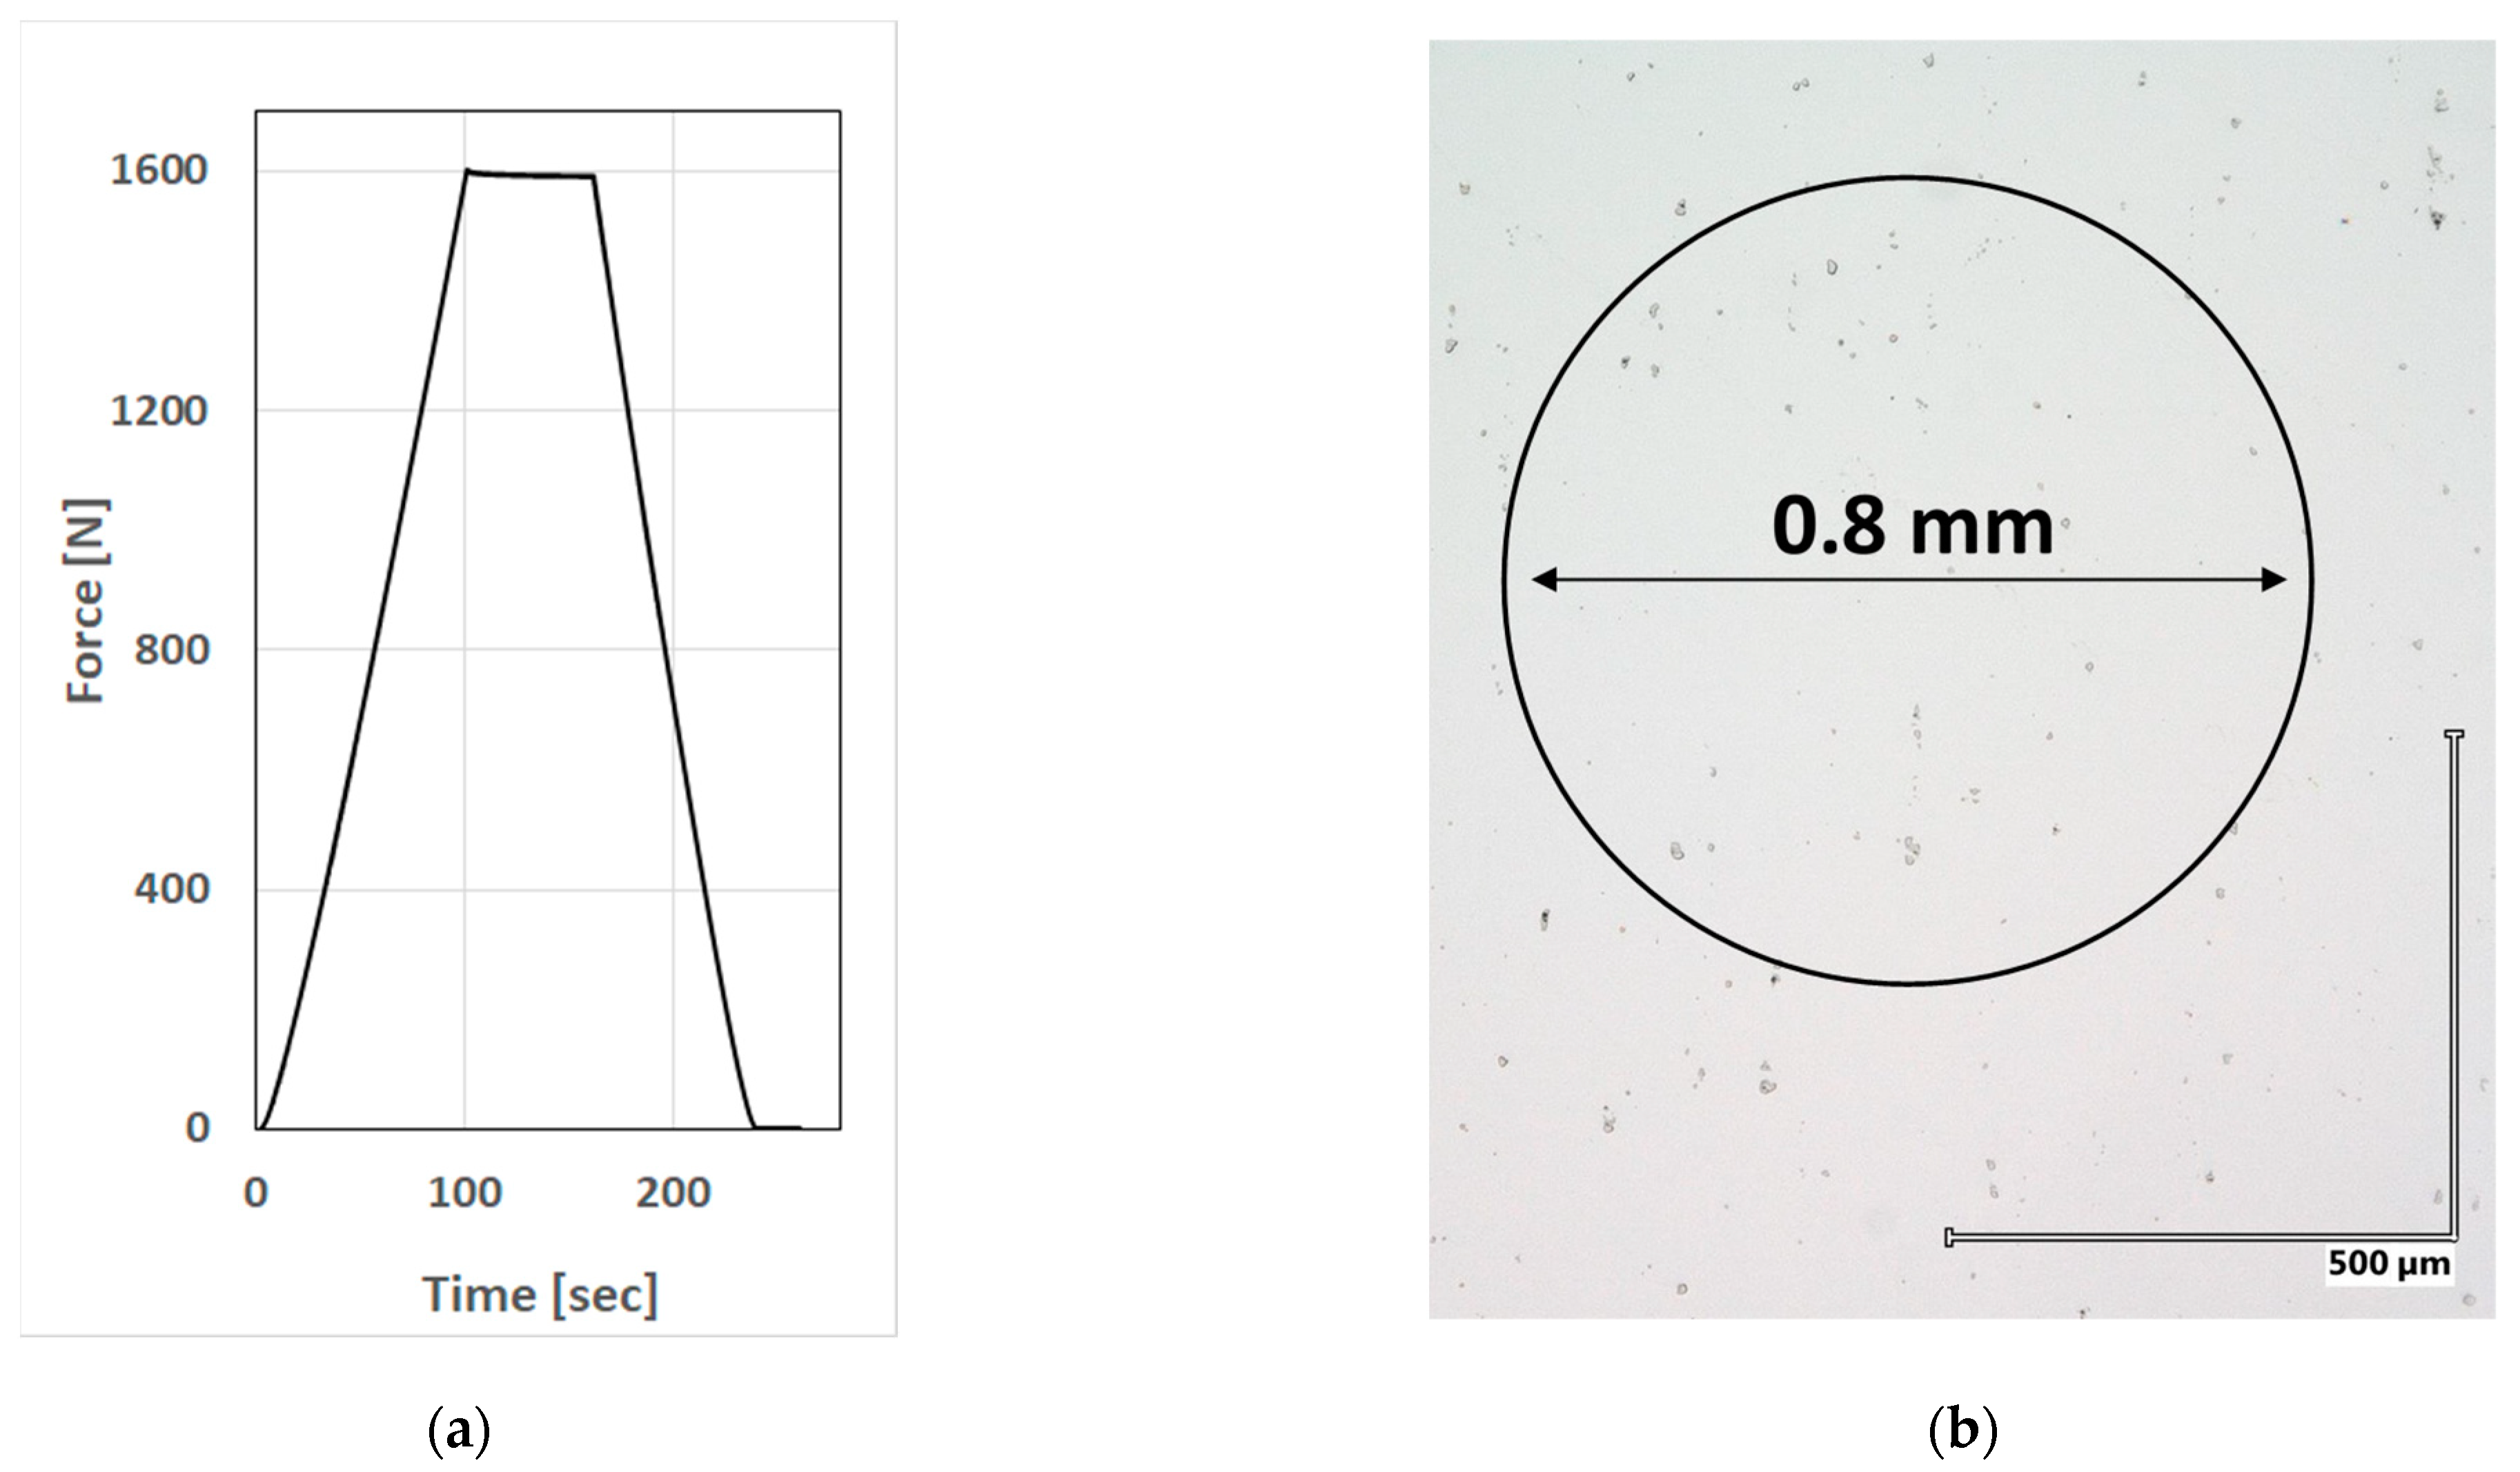
The indentation tests were not performed in the standard Brinell regime [16,20]. The maximum force was limited to 1600 N to minimize the harmful effects that could occur under higher loads such as the pill-up effect, higher shear stresses between the indenter and specimen surface, nonlinear relation between Brinell hardness and indentation area [21,22,23]. Additionally, a smaller load leads to smaller indentation, which allows us to densify the number of indentations that can be made in the region of interest. An example of a force vs. time diagram recorded during the indentation test is shown in Figure 4a. Indentation work, understood as the work used to produce permanent deformation of the material marked in Figure 4b with a circle, was then calculated after the test using recorded data. A typical recorded force-displacement plot is shown in Figure 5. Indentation work corresponds to the hatched area under the curve shown in this figure.
It has to be stressed at this point that the measured parameter cannot be identified with specific strain work. In the case of hardness measurement, progressing indentation depth stress and strain state in the region of plastic deformation vary, and calculation of specific work, however possible, is very complicated and requires knowledge of material strain-hardening behavior in a complex stress state. To overcome this difficulty, we have to apply constant indentation parameters (applied load, indenter geometry, and material stiffness of all the components of the test set-up). Indentation work measured in this way can be considered a conventional parameter characterizing the plastic flow of the material.
3.2. Investigated Alloy
The material under investigation is a nickel-based Inco 718 alloy (AMS 5596K) in cold rolled and annealed condition. This kind of alloy is often used for many components of an aircraft engine due to its high strength and resistance to extreme temperatures that can be expected in aircraft engines.
The mechanical properties of the investigated alloy in an as-received state at room temperature are 0.2% offset yield strength 445 MPa, ultimate tensile strength 855 MPa, elongation 51%. The chemical composition of the alloy is shown in Table 1.
Metallographic examinations of the alloy under investigation were performed to assess homogeneity, grain size, inclusions, and phase composition before deformation was applied to introduce damage. Microscopic observations of metallographic cross-sections were performed using a Keyence VHX 6000 digital light microscope. After strength tests, the side surfaces of tested specimens were investigated using a Carl Zeiss EVO 25 MA scanning electron microscope (SEM) equipped with a Back Scattering Electron Detector (BSE) (used for specimen surface visualizations) and a Bruker X Flash 5010 125 eV Energy Dispersive X-Ray detector (EDX).
The structure of the alloy in an as-received state, observed using an optical microscope, is shown in Figure 6a. The structure of the investigated material is typical for annealed Inconel 718 with equiaxed grains and dark inclusions that were identified as the primary niobium carbide using an energy dispersive X-ray analysis (EDX). The average grain diameter estimated for three perpendicular planes is, respectively, 0.22, 0.021, and 0.020 mm. Carbides create evenly distributed strands. The estimated amount of carbides is within 0.4–0.5%.
In Figure 6b, the surface of the specimen at the necking zone after the HCF test to failure observed with the use of SEM is shown. Plastic deformation of the ductile matrix can be easily seen in this figure as well as de-bonded hard inclusions—niobium carbide according to the performed EDX analysis. This picture shows that the two main phenomena that contribute damage process are plastic deformation of the ductile matrix and nucleation and growth of physical discontinuities at the interface between the matrix and hard inclusions.
3.3. Experimental Program
To verify the usefulness of indentation tests for damage assessment, three specimens of the kind shown in Figure 2 were prepared and measured before the load was applied to introduce damage. One of the prepared specimens was pulled to rupture in tension at room temperature 21 °C. The testing machine’s cross-head displacement rate was initially 0.1 mm/min and after reaching a strain equal to 0.015 mm/mm it was increased to 1,2 mm/min and kept constant during the rest of the test, till the rupture of the specimen. A plastic strain field varying from zero to failure strain was obtained in the ruptured gage part of the specimen. A damage parameter was calculated using Formula (1) for the gage part sections marked in Figure 2.
The remaining two specimens were subjected to oscillating load to introduce fatigue damage. The first of them was loaded with a maximum stress of 600 MPa at the smallest cross-section of the gage part and a cycle asymmetry ratio of R = 0.05 (frequency 20 Hz, room temperature) to failure at Nf = 125,742 cycles. Since the value separating the HCF and LCF regimes was assumed to be 105 cycles, this corresponds to a high cycle fatigue (HCF) regime. The last specimen was loaded with a maximum stress of 700 MPa (frequency 20 Hz, room temperature, asymmetry ratio R = 0.05) to rupture at Nf = 60,851 cycles, which corresponds to low cycle fatigue (LCF) conditions.
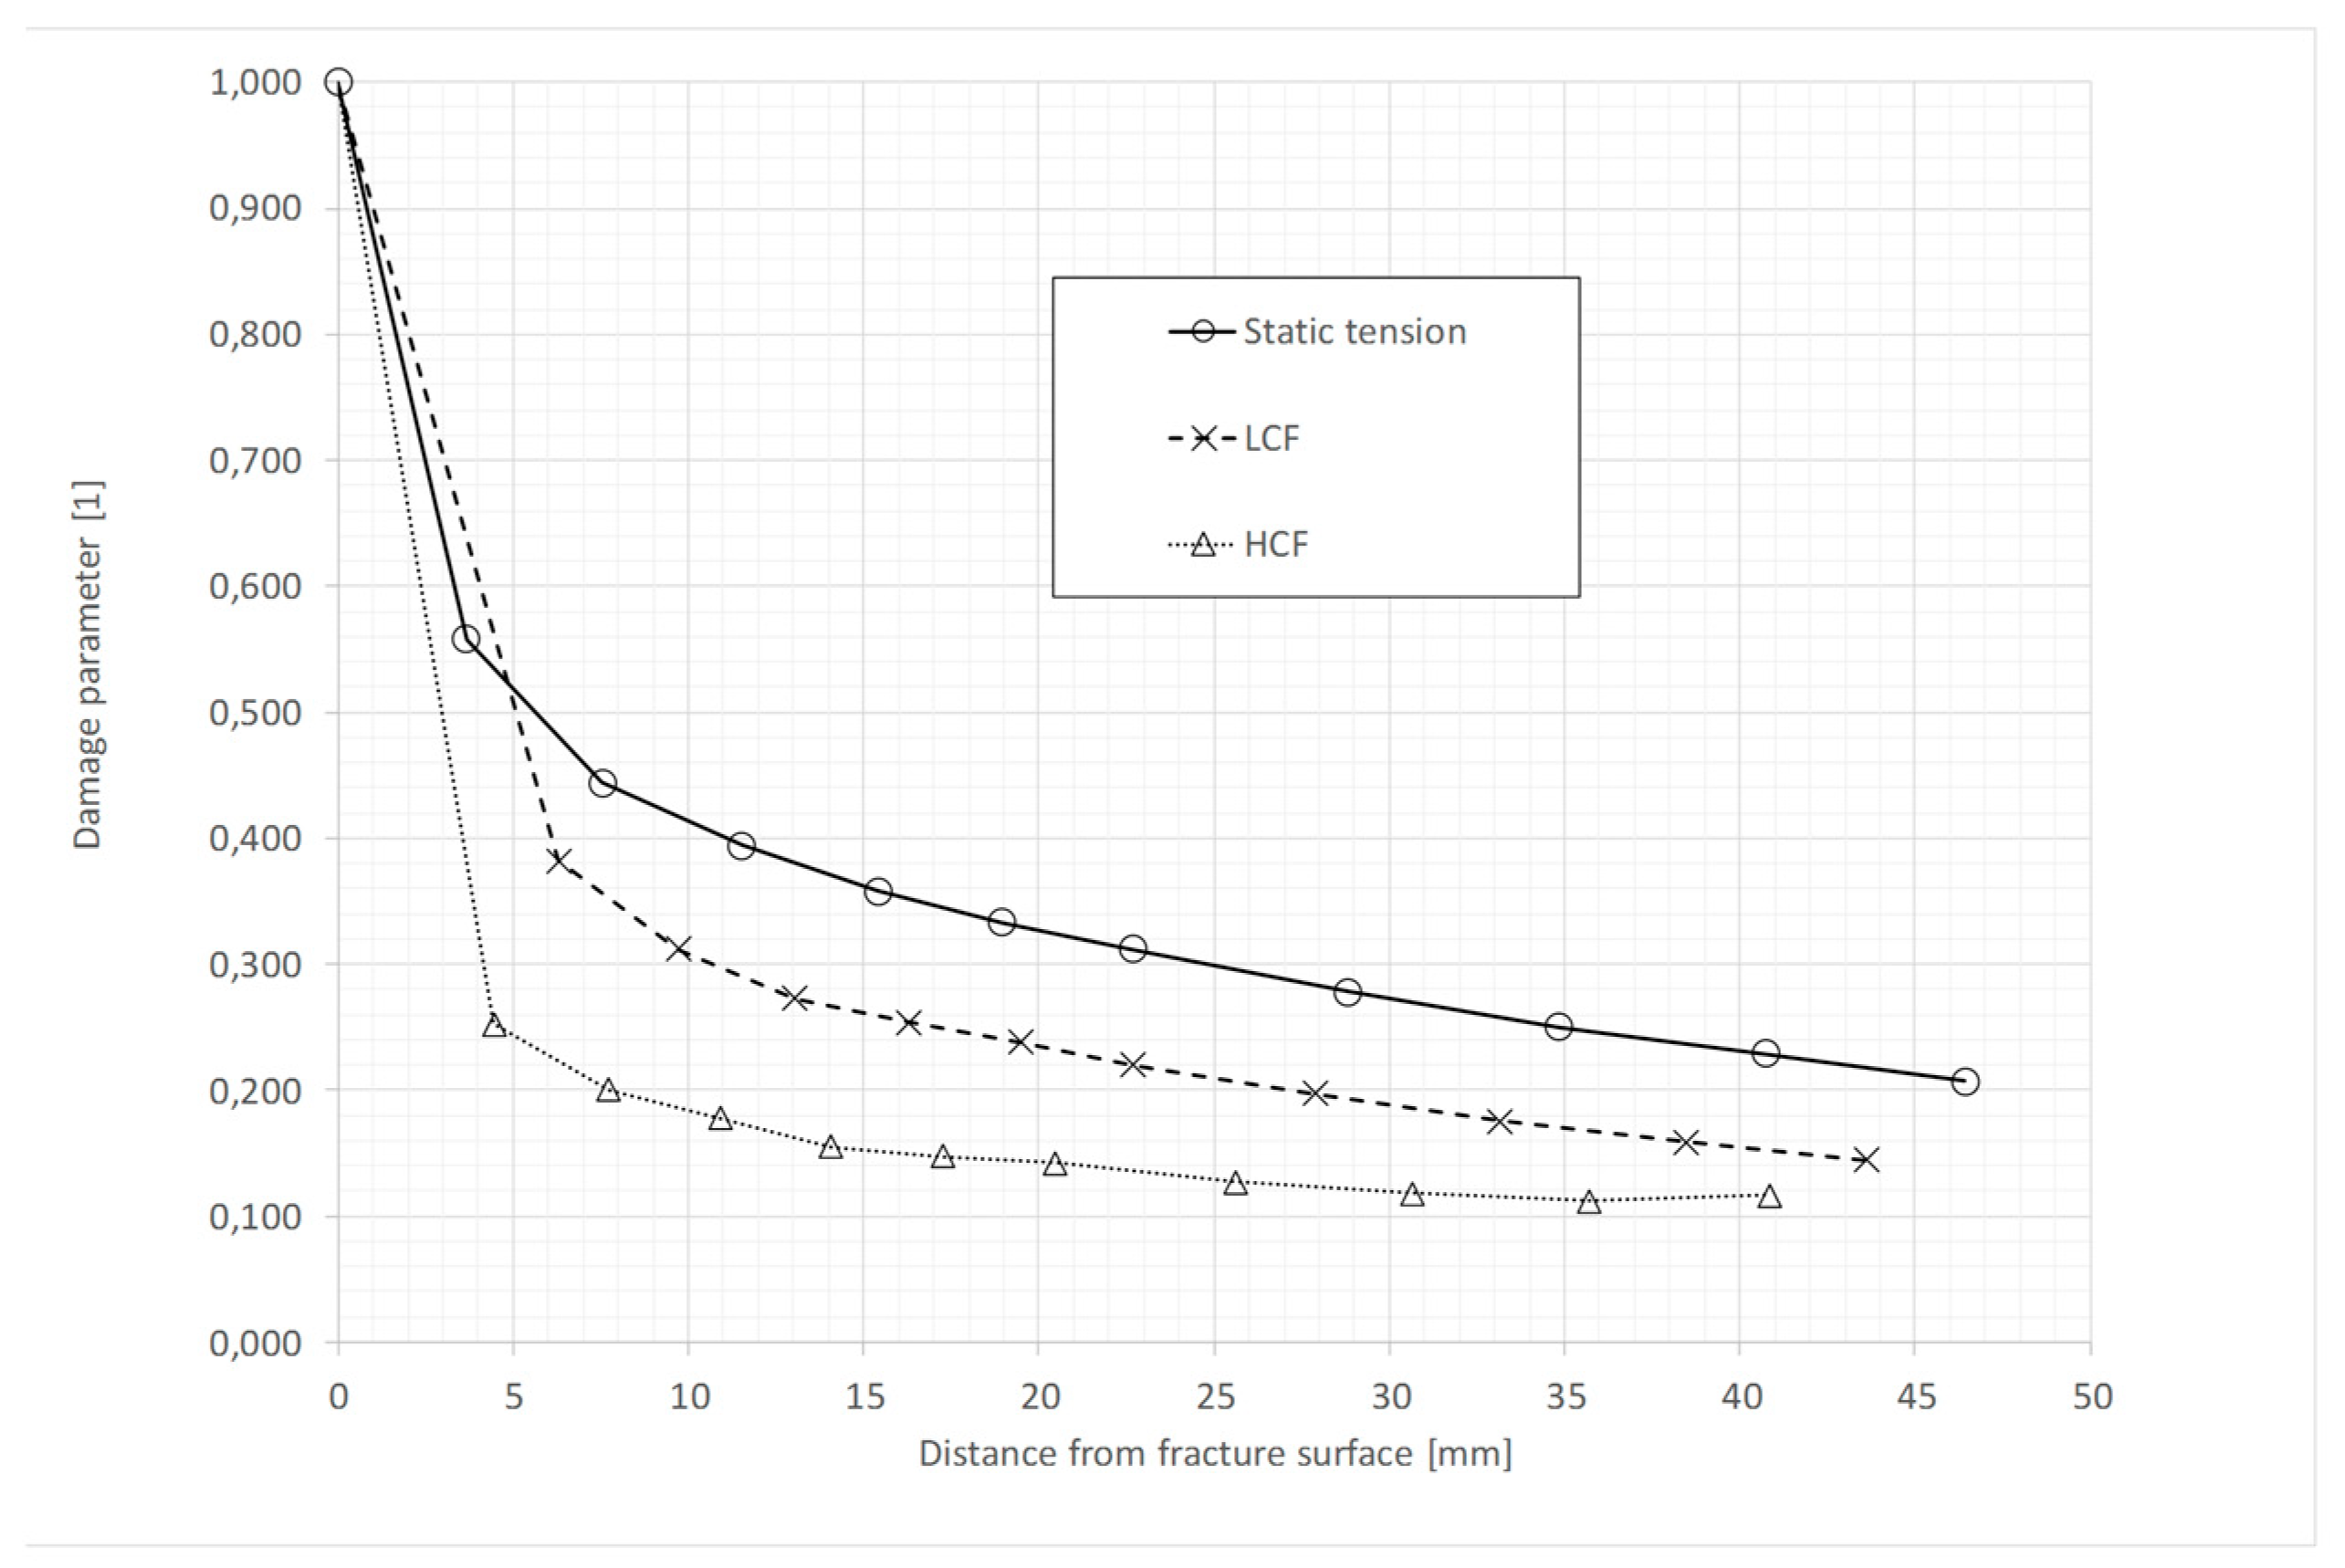
For all three kinds of tests (static tension, LCF, and HCF), the specimen was loaded until the final rupture of the gage part. Measurements of the width and thickness at the marked sections (see Figure 2) were performed to calculate plastic strain intensity at the corresponding sections. Using Formula (1), the value of the damage parameter was calculated and plotted as the function of distance from the ruptured surface (the data points correspond to marked sections). The results of the calculations are shown in Figure 7 for all applied testing regimes. As can be seen, the value of the damage parameter is the highest for the specimen ruptured under static tension for all the sections of the gage part except the fracture surface (where it has to be equal to 1 by definition). Additionally, the elongation of the specimen gage part is the highest. It is easily understandable since fatigue damage decreases the ability of the alloy to achieve plastic deformation preceding the final rupture of the material.
4. Results and Discussion
Two damage-quantifying parameters (damage indicators) were used in the presented investigations: Brinell hardness and indentation work. The relation between those damage indicators and the reference damage parameter defined by Johnson [12] and modified in [3] was determined experimentally and will be discussed.
4.1. Hardness
Hardness is considered a good indicator of damage [4]. The rearrangement of the dislocation system is followed by nucleation and propagation of physical discontinuities which disturb the picture of the phenomenon in the late phase of the process. Moreover, various kinds of discontinuities develop from micro-cracks (planar flaws, voids) and it makes this picture even more complex. The damage mechanism varies also between alloys. The only method to determine the correlation between damage and hardness is an experiment. Measuring hardness in the direction perpendicular to the surface of the material, which is the standard technique in the case of hardness measurements, allows us to utilize the strain-hardening cross-effect. This enables obtaining a clear picture of the complex phenomenon in its initial phase.
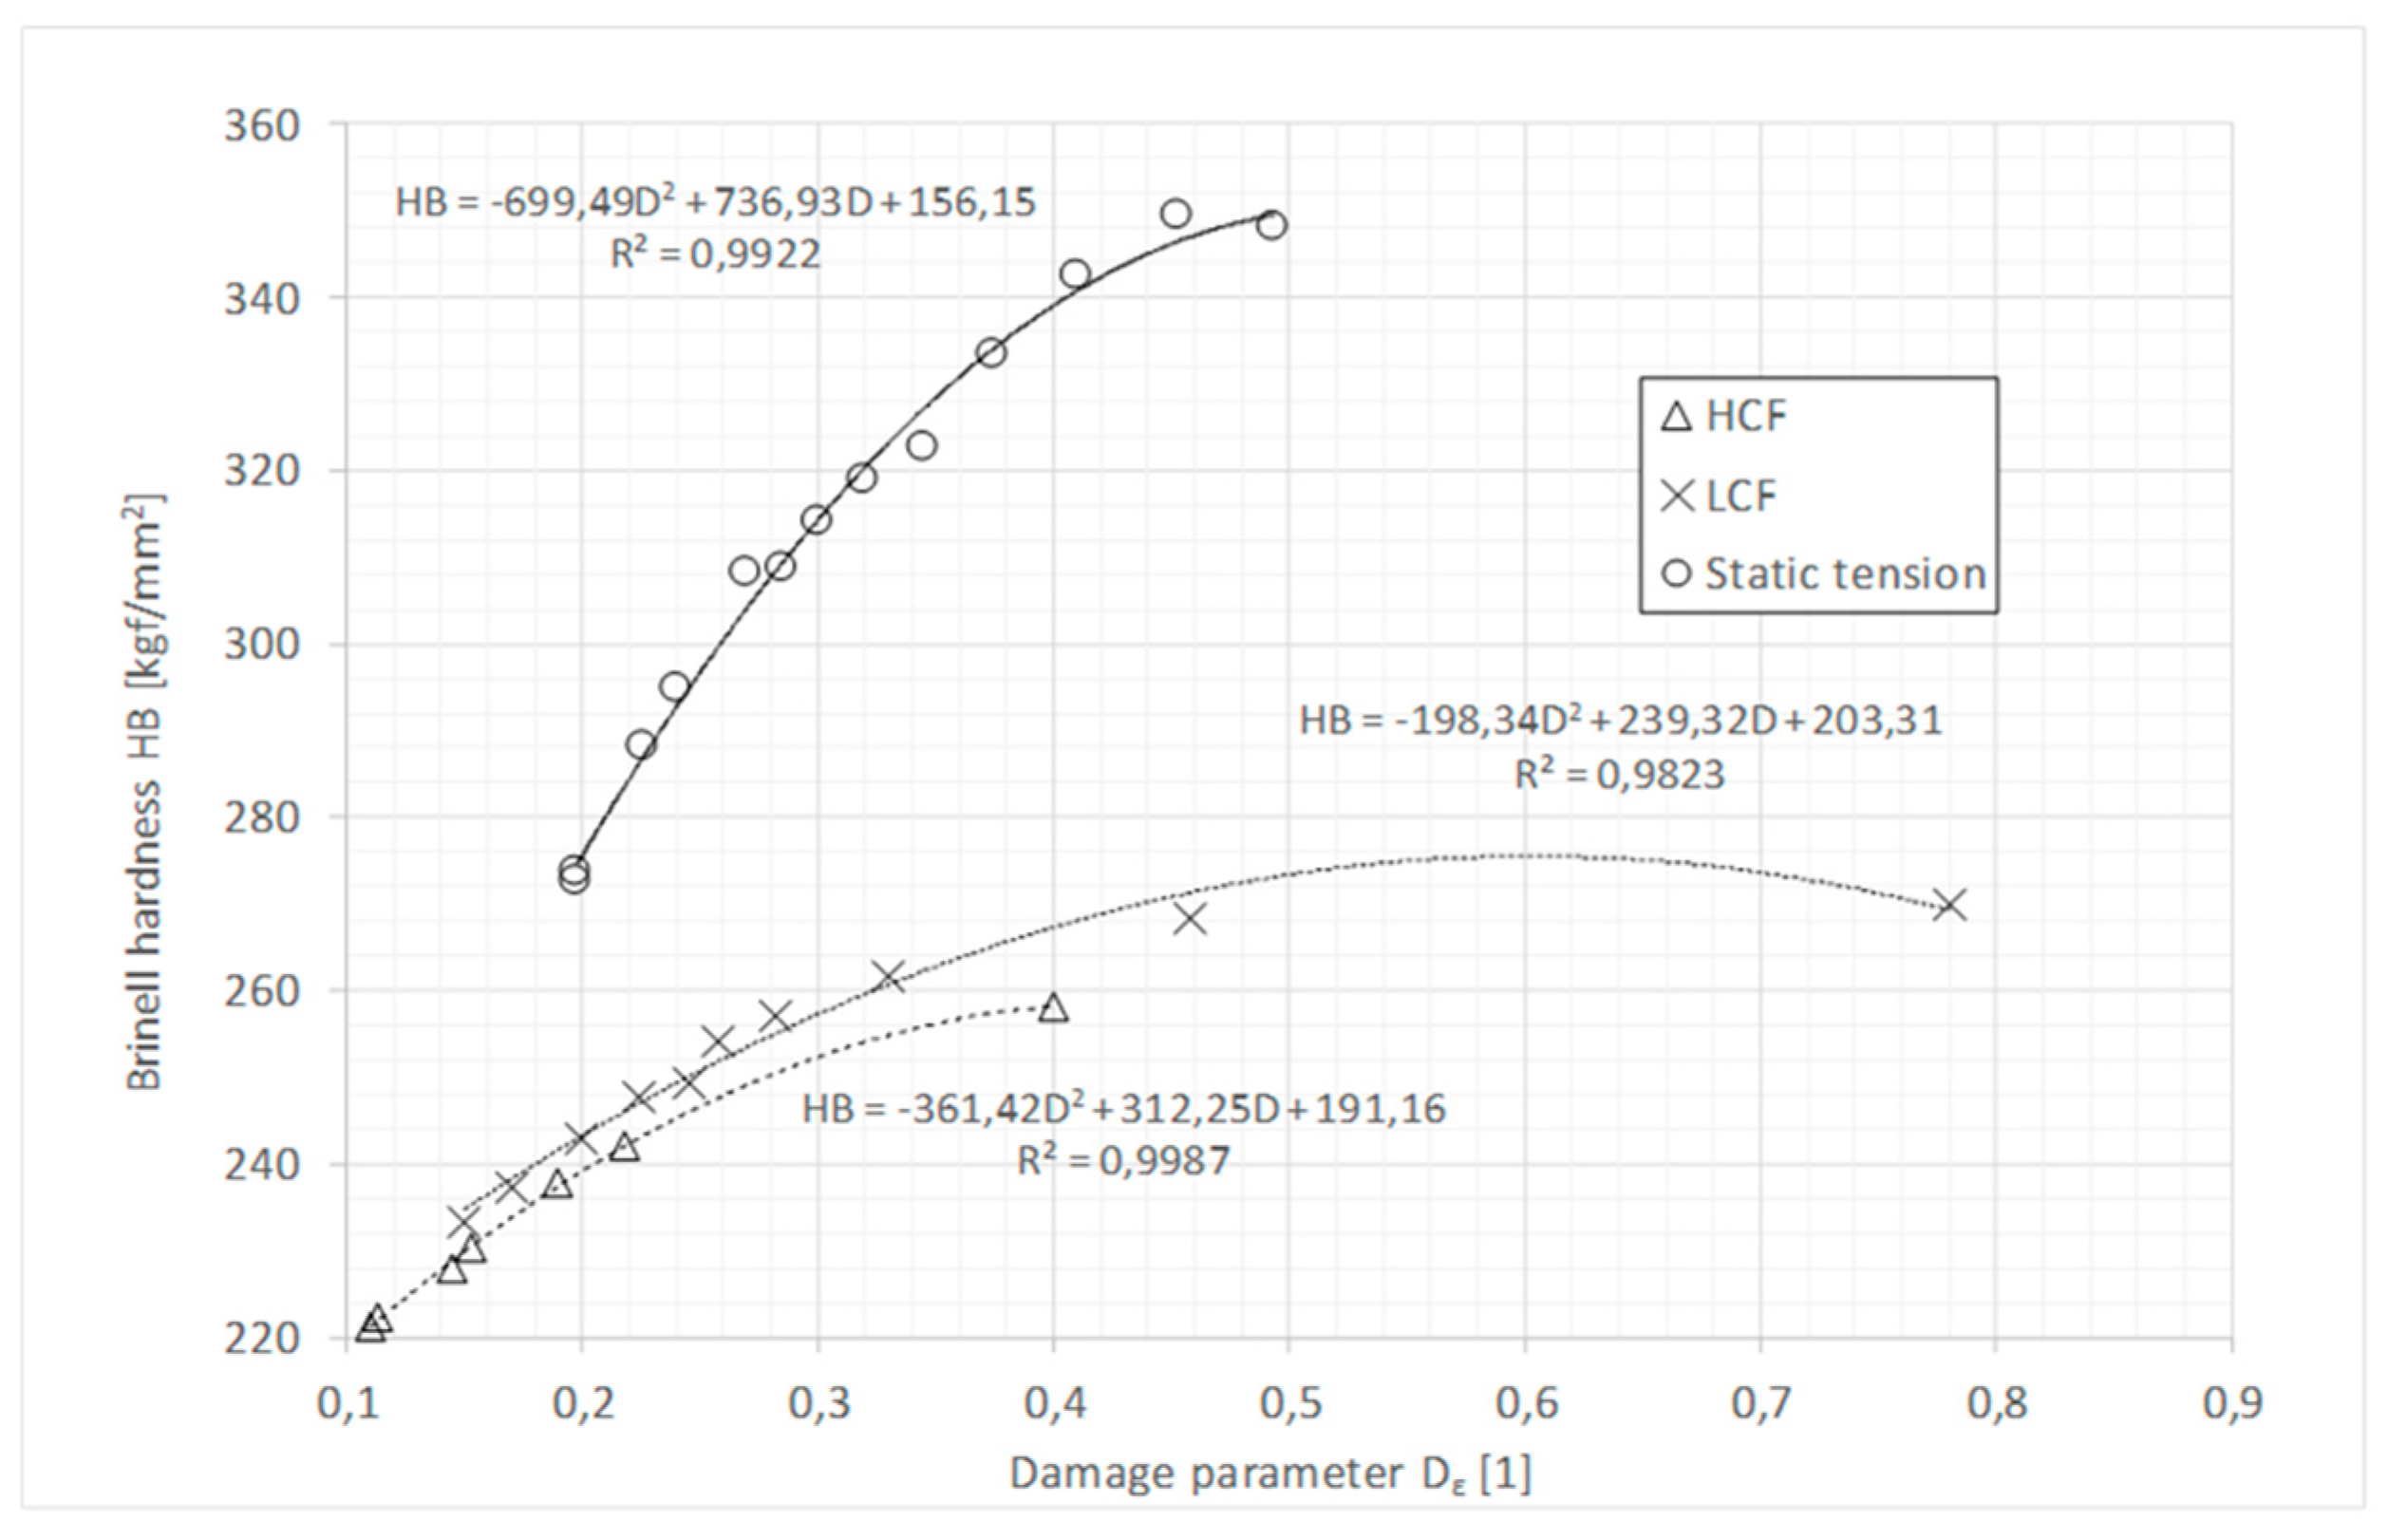
A comparison of results for all testing regimes is shown in Figure 8. In the case of the specimen shown in Figure 2, hardness was measured at the spots of the gage part shown in Figure 9a, Figure 10a, and Figure 11a—for tensile, HCF, and LCF tested specimens, respectively. Indentation was performed in the direction perpendicular to the initial pre-stressing. A regression of the experimental data was performed with the use of a polynomial function for the given range of damage parameter D. Equations of regression lines as well as coefficients of determination R-squared are shown in this figure. As can be seen in Figure 8, hardness increases with progressing damage in a monotonic manner only in the initial phase of the process for all kinds of applied loading. In the case of the HCF test, due to the strong localization of ratcheting strain hardness measurements were performed for the value of damage parameter D < 0.4. In this range of D, hardness is only increasing. For the LCF test, a decrease in hardness for the value of damage parameter D > 0.4 can be observed. For static tension, a hardening of the material for D > 0.4 can be observed. This observation is in agreement with the former discussion and indicates that the creation of physical discontinuities prevails in effects related to strain hardening in the later phase of the damage process (see the results for LCF testing). The occurrence of voids that can be seen in Figure 6b increases the real stress in the alloy matrix for a given nominal (effective [4]) stress, calculated according to Equation (4). A higher deformation of the alloy matrix due to its increased real stress is observed as an apparent softening of the investigated alloy, with a similar effect on hardness. This effect is strongly localized in the case of HCF, making observations of the final phase of the phenomenon with the use of the proposed technique difficult.
4.2. Indentation Work
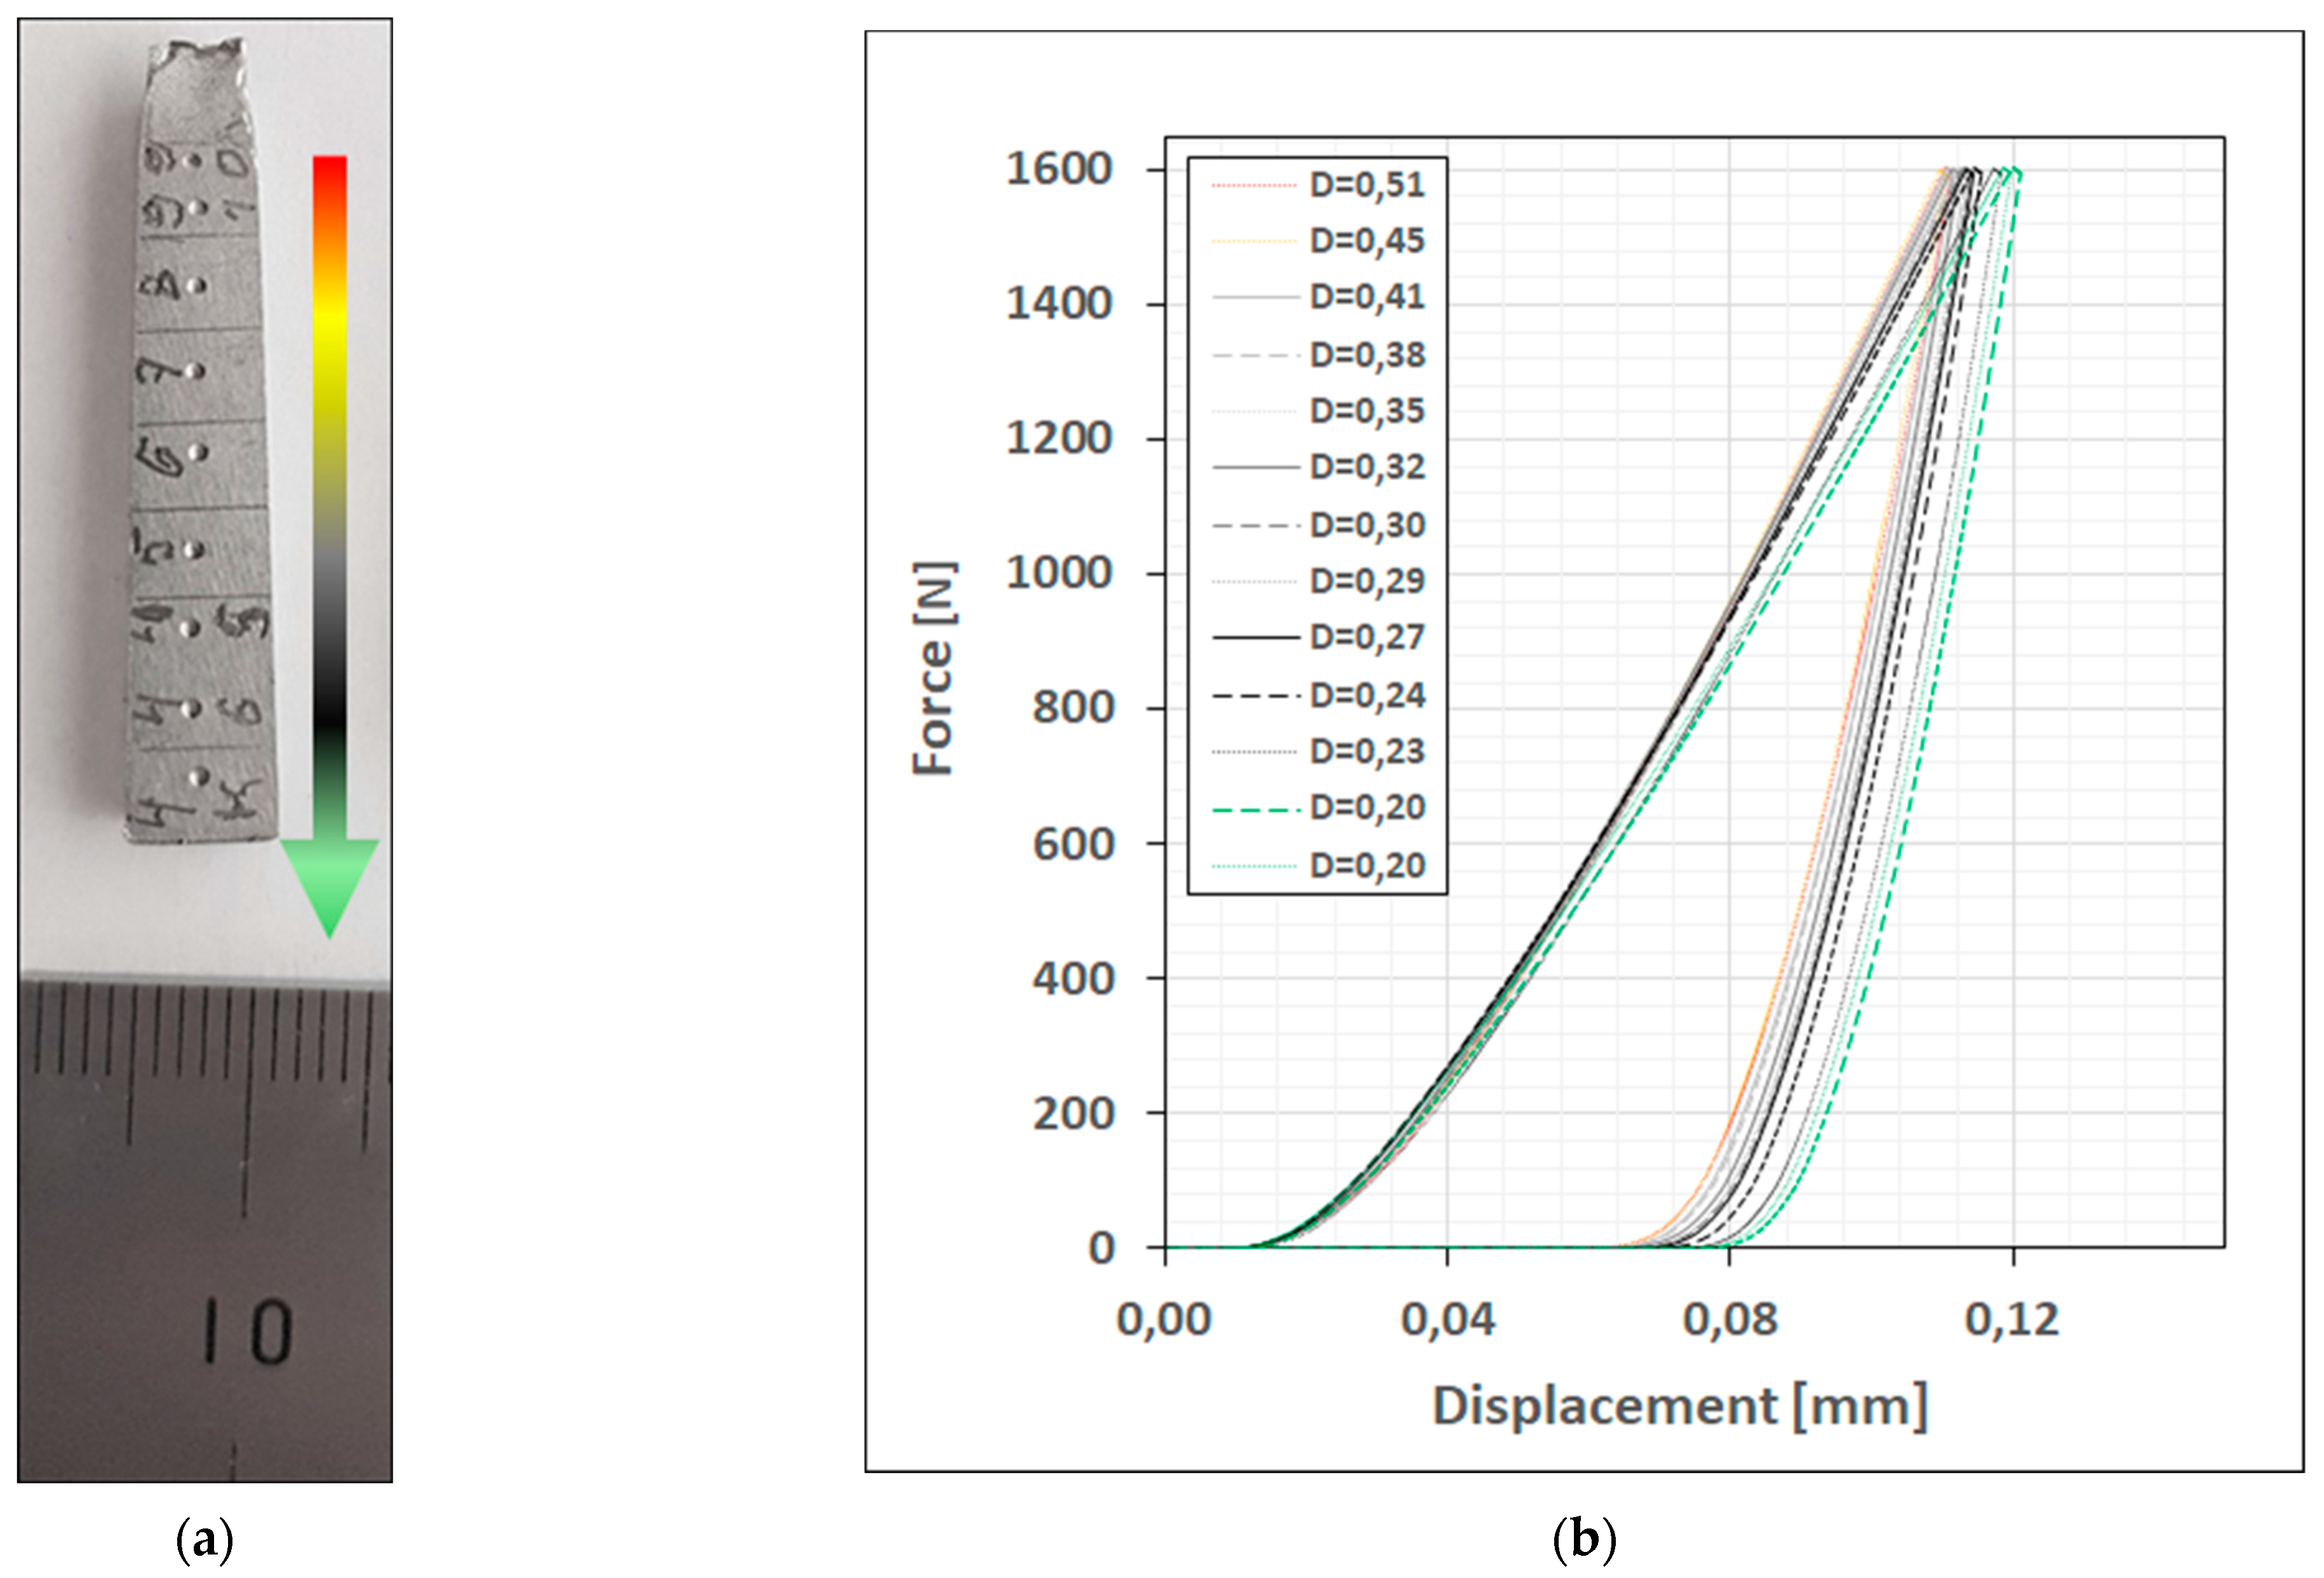
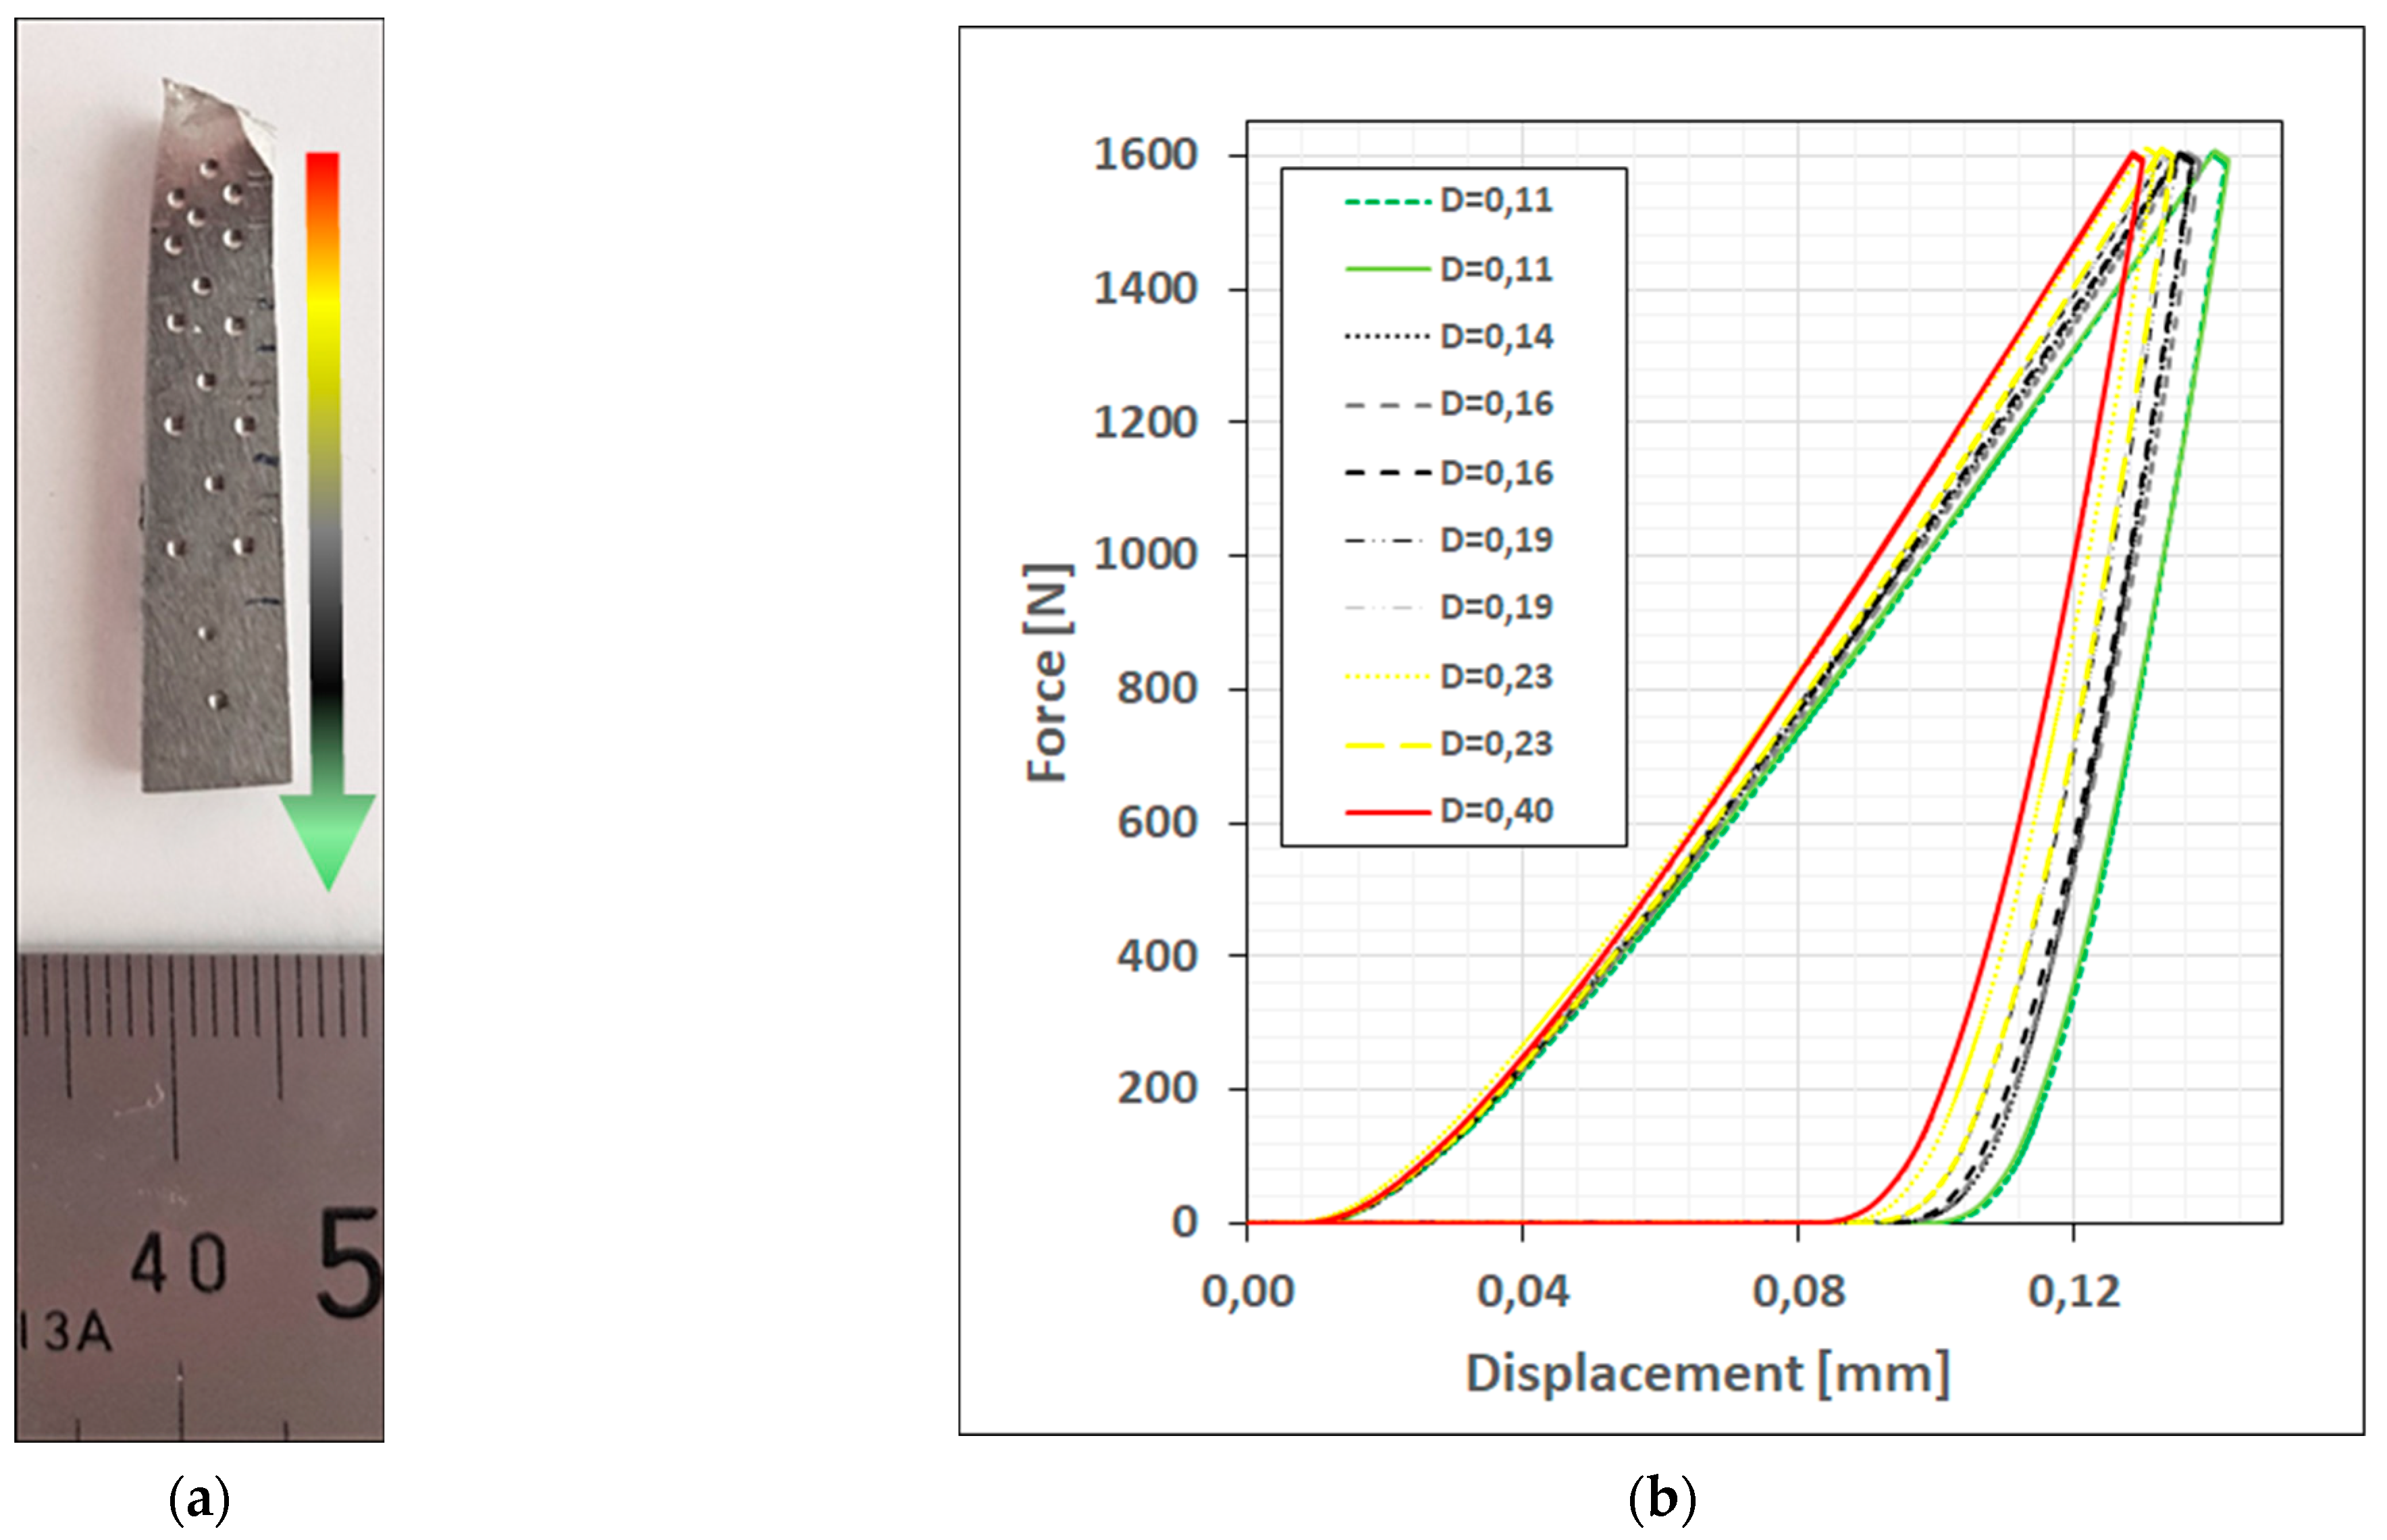
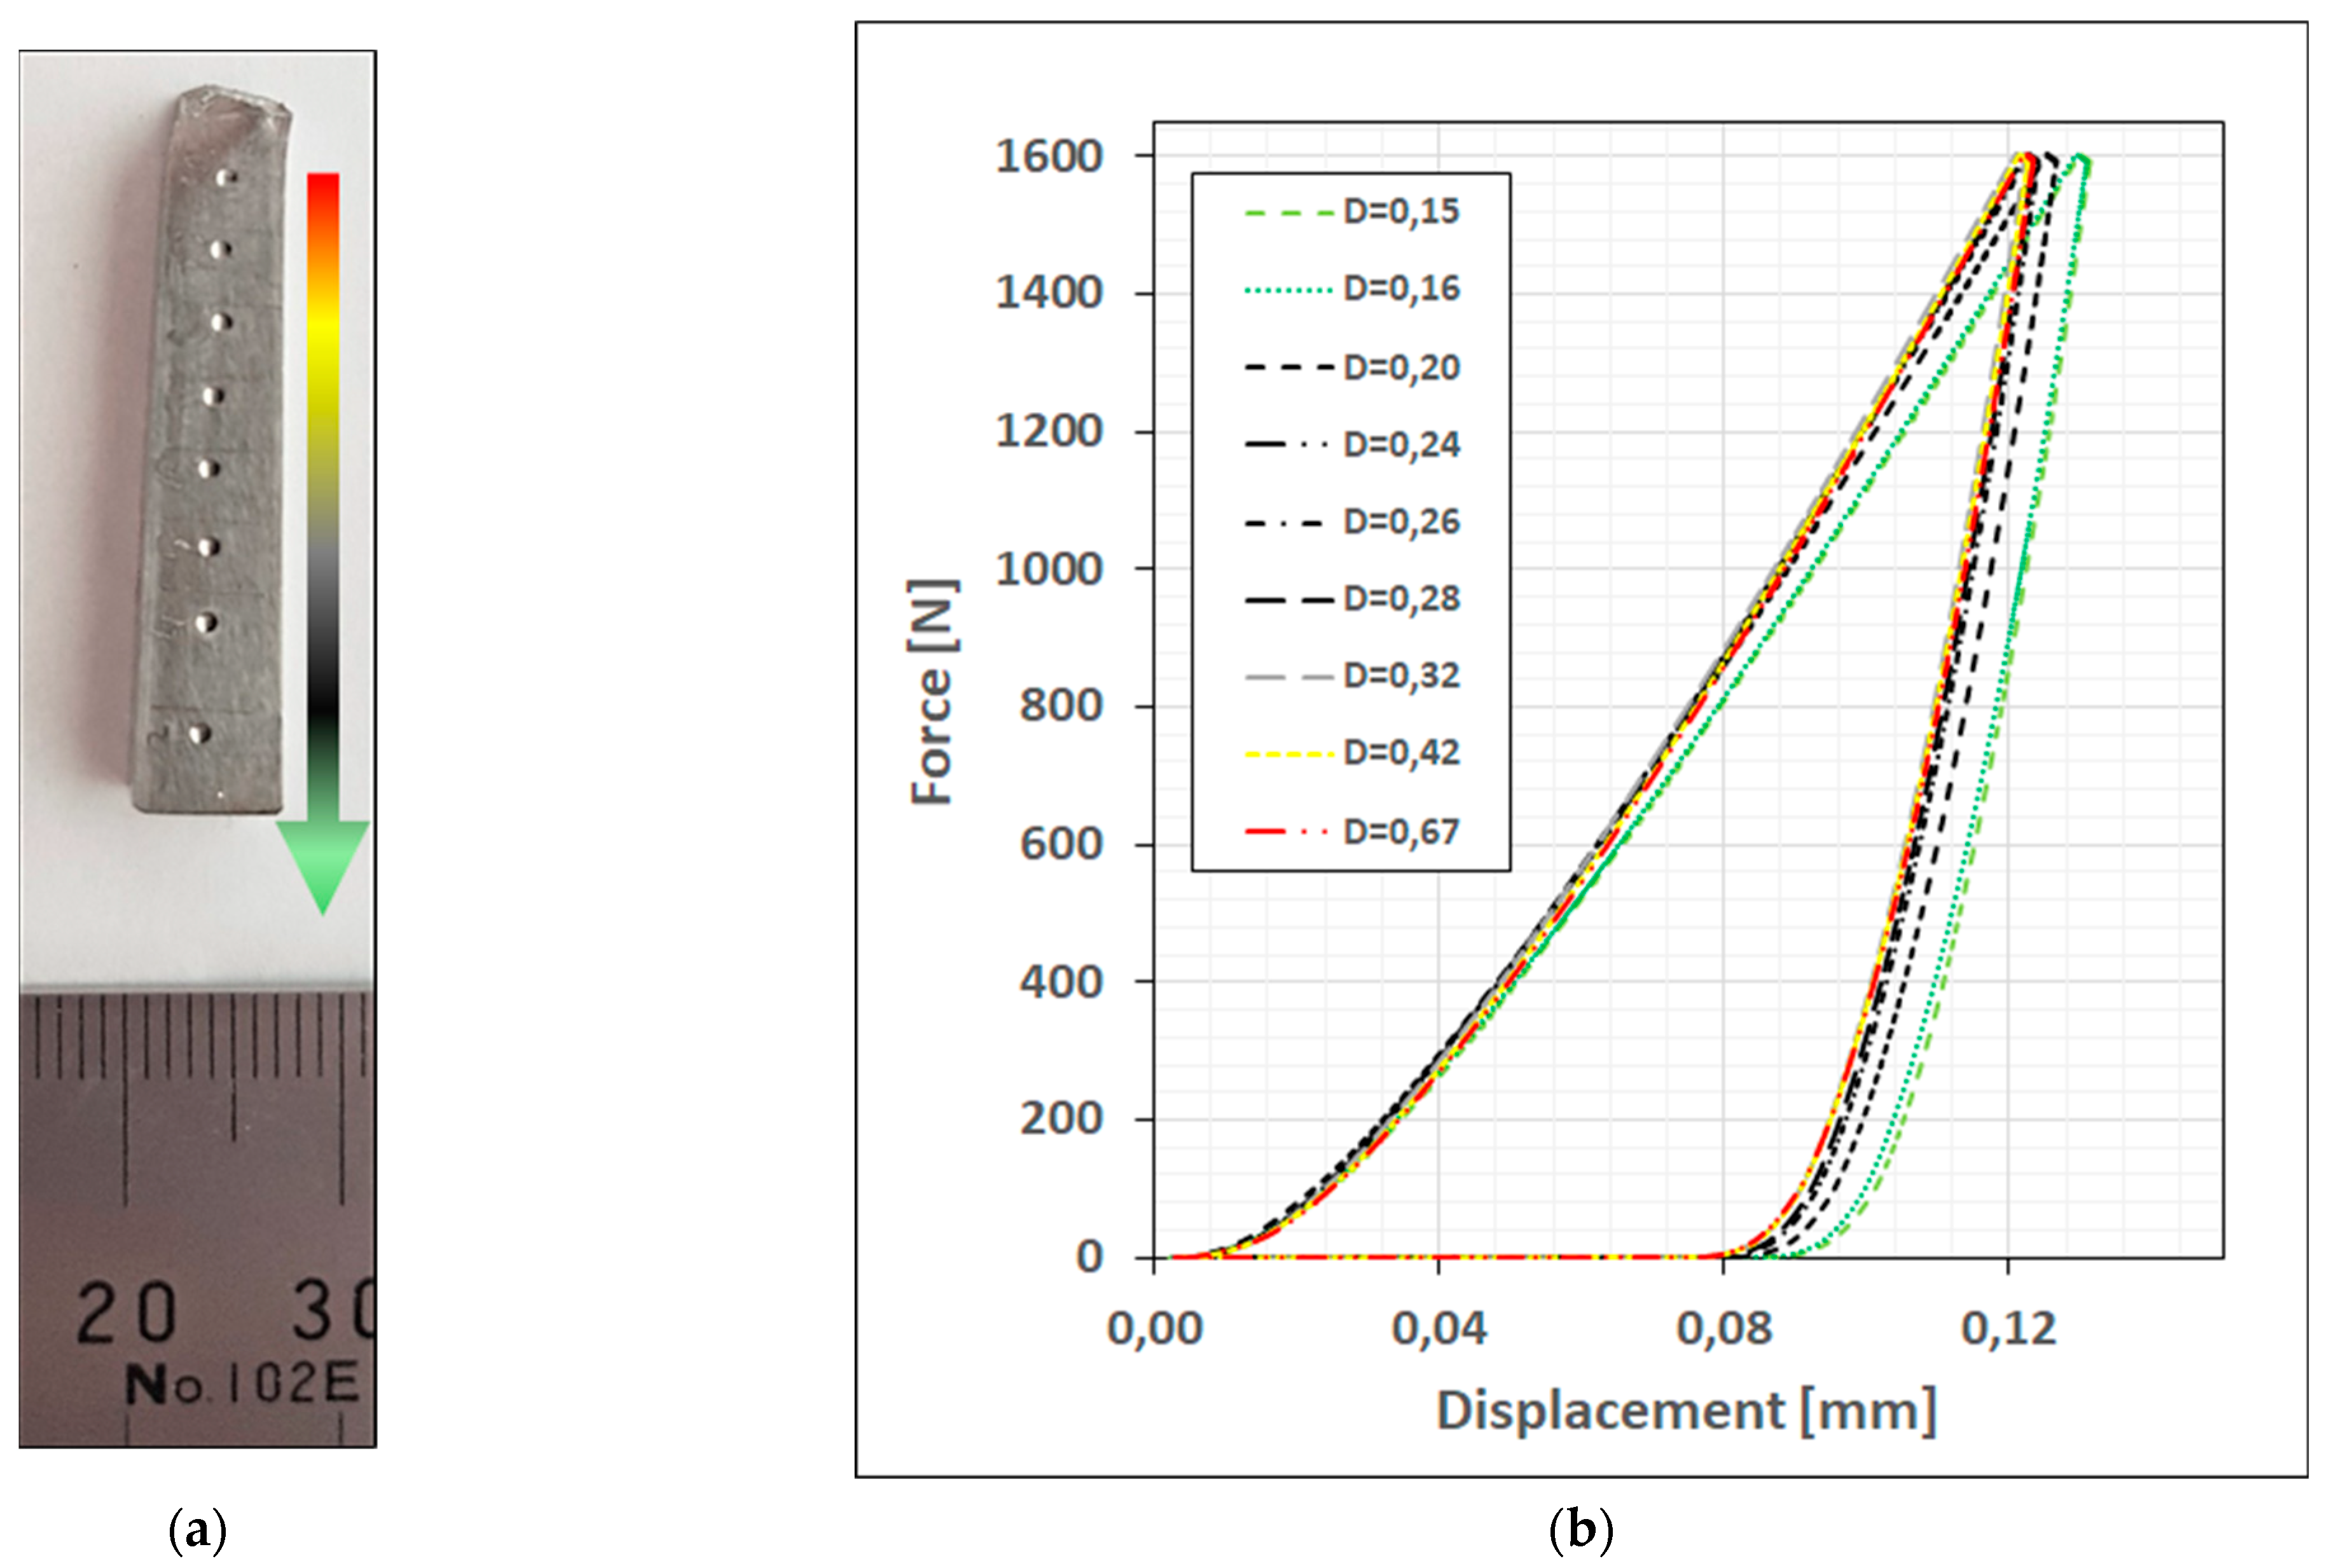
The second of the proposed damage indicators—indentation work W—seems to be well suited to assess the damage to the material. It reflects yield stress as well as strain hardening of the material in the direction perpendicular to the material surface. The precision of the indentation work measurements is higher than that for hardness. As can be seen in Figure 9, Figure 10 and Figure 11, the newly developed testing system offers very good accuracy of force and displacement measurements. Indentation force is limited by 1600 N, and numerical integration of the recorded signal allows a precise determination of the work necessary to produce deformation.
The gage part of the specimens after tensile, HCF, and LCF tests with the location of indentation measurement points is shown in Figure 9a, Figure 10a, and Figure 11a. The spacing between indentations for the specimen after tension and LCF meets the standard spacing according to ASTM E10. For the HCF specimen, after indentation was performed with standard spacing, additional indentations were performed. The relative position of the test surface and loading axis is ensured by mounting specimens in hard and durable epoxy resin with a mineral filler using a hot mounting press. Two indentations were performed in an area with the same value of plastic deformation. The scatter of the results was less than 0.5%. The elastic compliance of the device was treated as a systematic error (bias) which does not disqualify our test method.
The colored arrow shows damage distribution: green—less damaged, and red—more damaged. Indentation force–displacement plots are shown in Figure 9b, Figure 10b, and Figure 11b. In the case of the tensile test (Figure 9a,b) the damage parameter varies from 0.2 to 0.51, and a maximum penetration depth of 0.122 mm is achieved for D = 0.2. For the HCF-tested specimen (Figure 10a,b), smaller values of damage parameter D are considered (from 0.11 to 0.4). That is because plastic deformation, in this case, is strongly localized. In this case, however, the penetration depth is bigger and reaches 0.14 mm due to a decreased (compared to tension) effect of the strain-hardening cross-effect. Since the material is softer, penetration under the same load is bigger. As previously, the biggest penetration depth is achieved for the smallest value of damage parameter D = 0.11. In the case of the LCF test (Figure 11a,b), the biggest range of damage parameter D is considered—from 0.15 to 0.67. As in formerly considered cases, the biggest penetration is obtained for the smallest value of the damage parameter (0.15). To summarize, for all testing regimes, the indentation depth decreases with the progressing damage of the alloy. Since, due to strain-hardening cross-effect, yield stress increases with accumulated plastic strain, indentation work shall decrease with progressing damage.
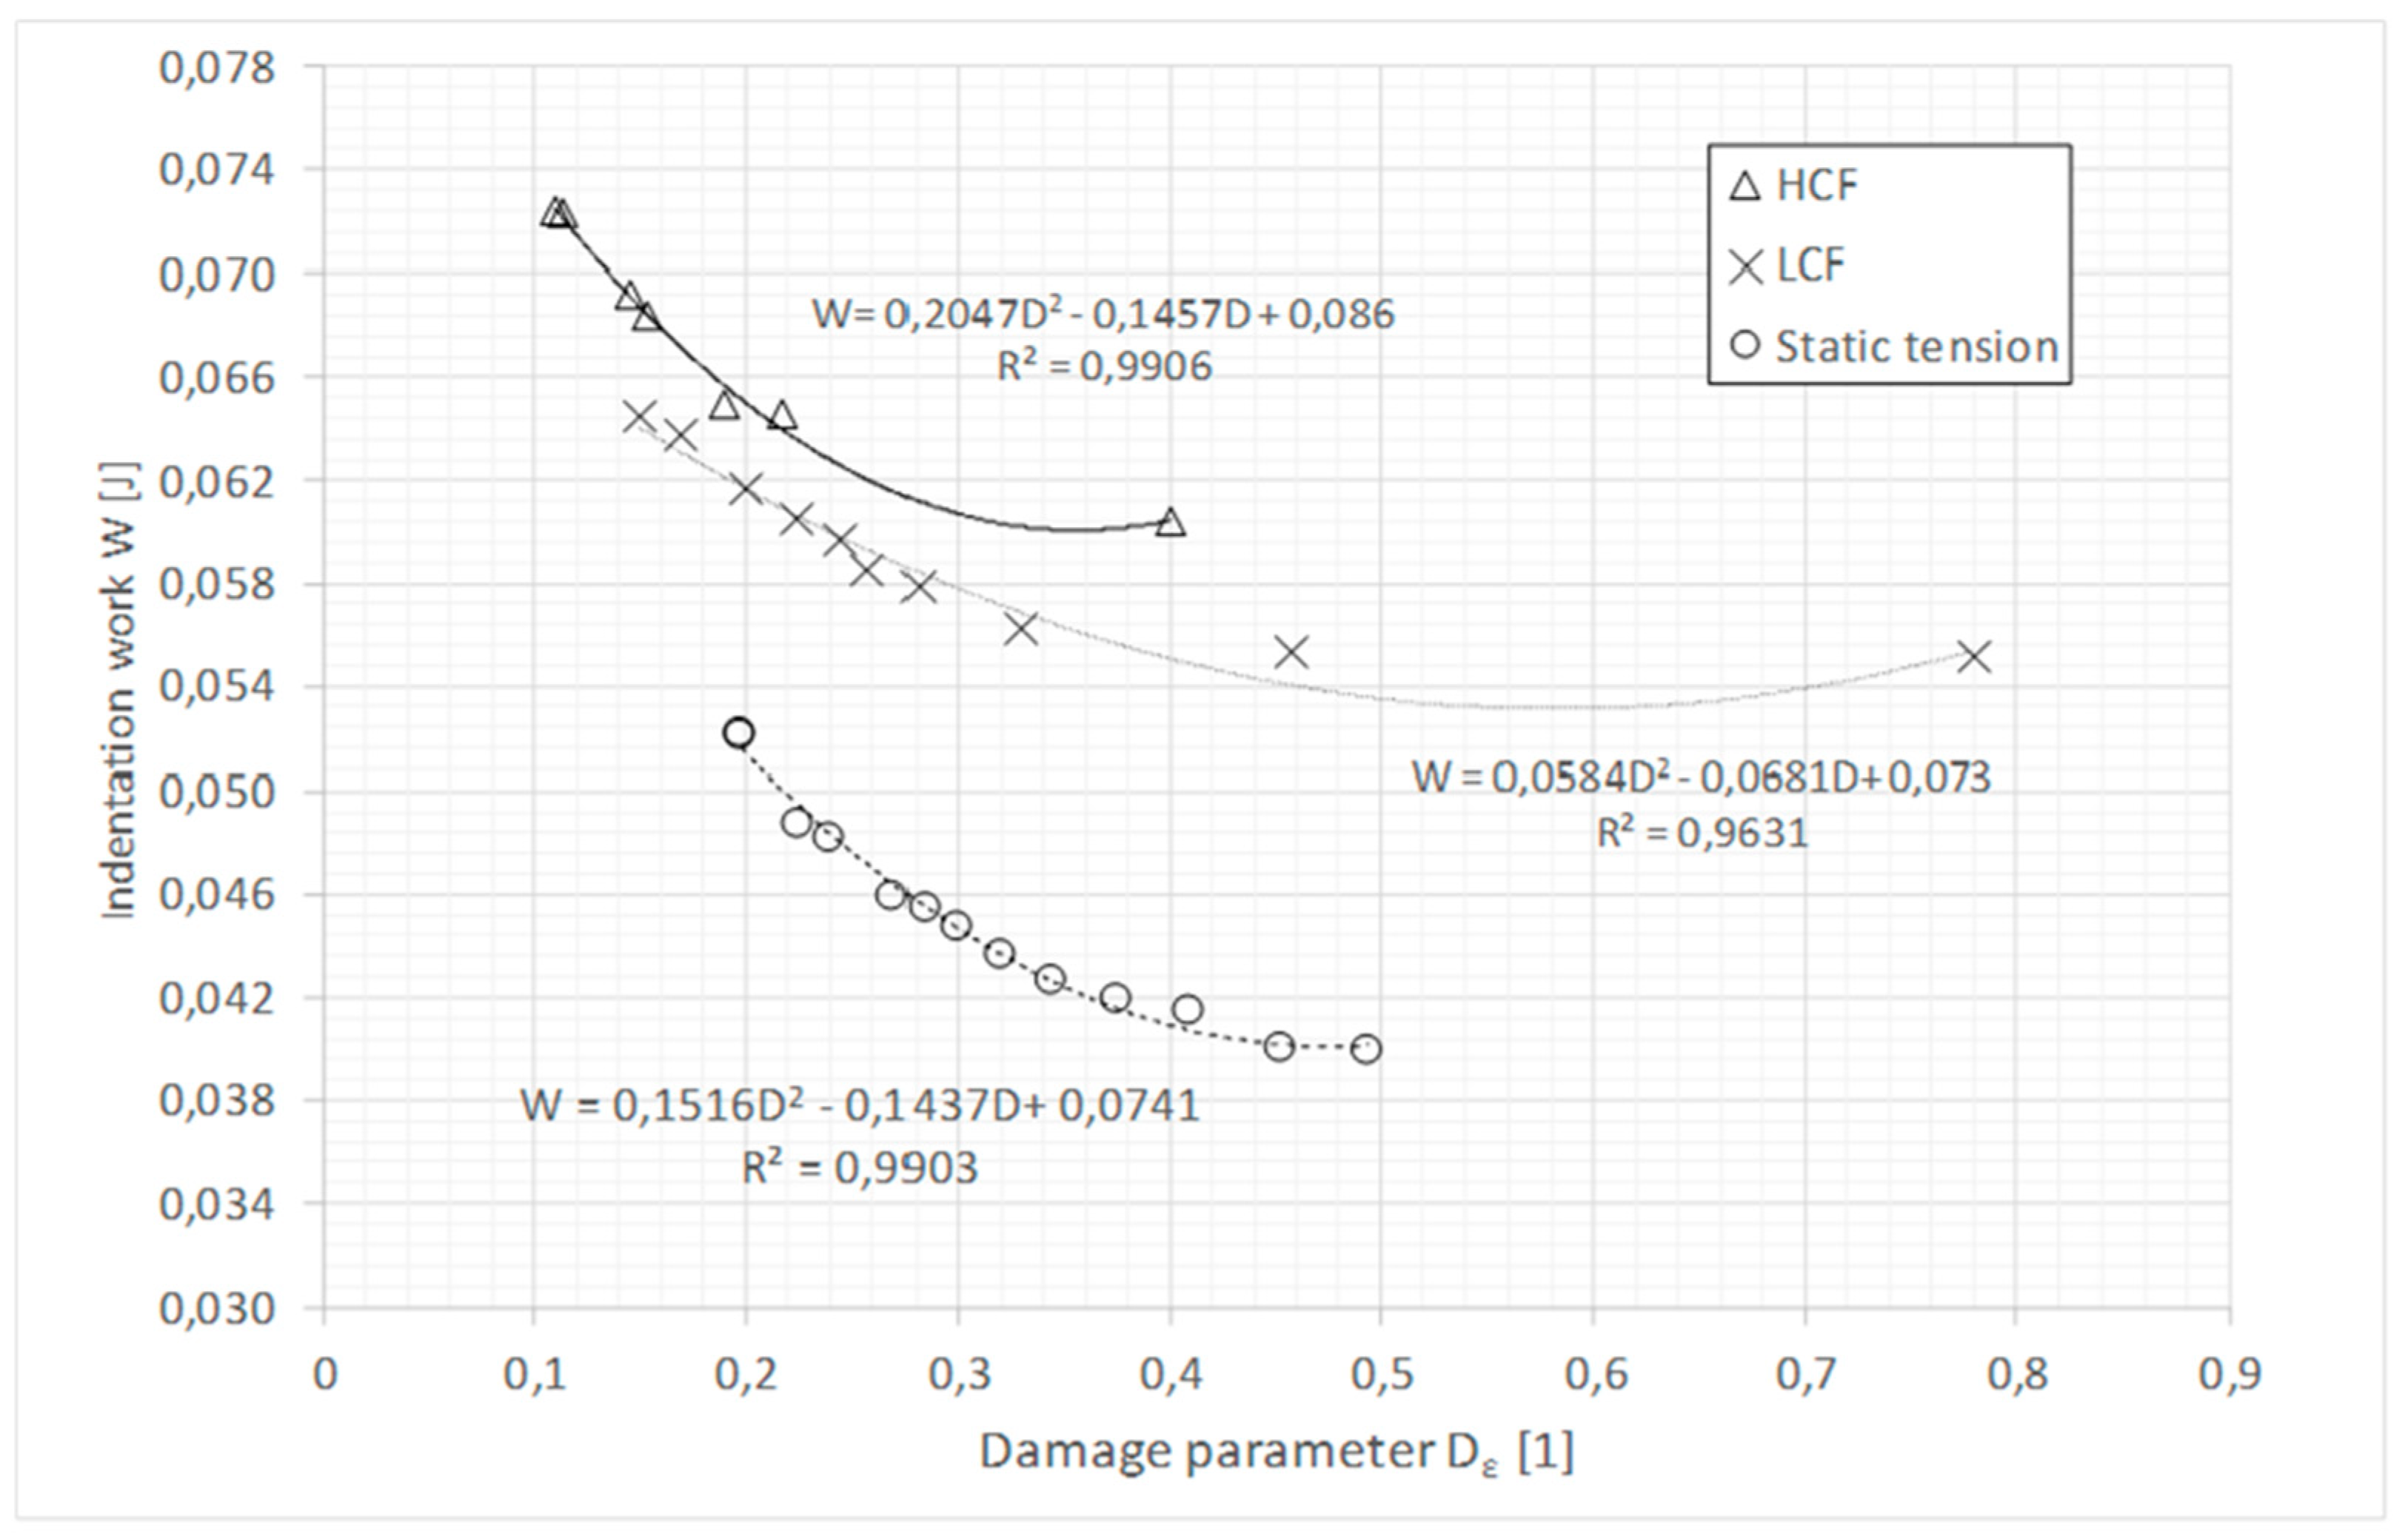
The results for all testing regimes (static tension, LCF, and HCF) are compared in Figure 12. It can be seen in this figure that in all cases, the work of indentation decreases with progressing damage to the material. This effect is the result of the applied pre-stress scheme and the strain-hardening cross-effect. Since indentation is limited by maximum load (1600 N), the depth of indentation decreases with a similar effect on indentation work due to an increase in flow stress. Changes of indentation work saturate for the values of damage parameter D > 0.5. This indicates that this kind of damage indicator can be useful for assessing damage at an early stage. For the later phase of the damage process, we can expect an opposite effect—due to the incubation and growth of discontinuities, indentation depth will grow with progressing damage. As already mentioned, the occurrence of voids increases the real stress in the alloy matrix for a given effective [4] stress. Due to this fact, the apparent softening of the investigated alloy will be observed and indentation depth will increase with a similar effect on indentation work.
5. Conclusions
The deformation-induced variations of two selected damage indicators-hardness and indentation work-were investigated in this paper. Damage of the material was quantified by the reference damage parameter proposed by Johnson in paper [12] and modified in [3]. The analysis of the investigation results leads to the following conclusions:
In the case of Inconel 718, the damage process is run by two phenomena: the plastic deformation of the ductile matrix, followed in the later phase by the nucleation and growth of micro-discontinuities at the interface between the ductile matrix and hard inclusions (niobium carbide).
The strain-hardening cross-effect is useful for the early detection of deformation-induced damage. Due to this phenomenon, it is possible to focus on the isotropic hardening of the material and avoid the influence of back stress (kinematic hardening) disturbing observations. This allows for detecting damage progress in the early phase of the process (before physical discontinuities are formed in the material).
The hardness value works well as the damage indicator in the initial phase of the process. Due to the use of strain-hardening cross-effect damage can be detected as the increase in hardness measured in the direction perpendicular to the direction of pre-stressing. The proposed technique offers sufficient accuracy to precisely assess damage to the material in question.
Indentation work can be useful as a damage indicator. The development of a specialized setup for this kind of test resulted in significantly improved accuracy of measurement. Using, for example, a bigger diameter of the indenter ball is a promising way of developing the proposed technique.
Residual plastic deformation preceding material failure seems to be a better damage indicator for the phase of the process following the nucleation of micro-discontinuities. The definition of failure criterion (10) taking into account this fact was proposed in this paper. This simple testing technique [19] can be useful for such investigations.
Complex stress testing and investigations of deformation-induced plastic anisotropy of polycrystalline metal alloys can help in the developing of innovative inspection techniques useful, for example, for the early detection of fatigue damage accumulation.
Author Contributions
Conceptualization, G.S. and M.M.; methodology, G.S.; investigation, M.M.; writing—original draft preparation, G.S.; writing—review and editing, G.S. All authors have read and agreed to the published version of the manuscript.
Funding
This research received no external funding.
Institutional Review Board Statement
Not applicable.
Informed Consent Statement
Not applicable.
Conflicts of Interest
The authors declare no conflict of interest.
References
- Gorkunov, E.S.; Smirnov, S.V.; Rodionowa, S.S. Influence of plastic deformation at hydrostatic pressure on damage and magnetic characteristics of low—Carbon steel 3sp. Phys. Mesomech. 2003, 6, 101–108. [Google Scholar]
- Socha, G. Experimental investigations of fatigue cracks nucleation, growth and coalescence in structural steel. Int. J. Fat. 2003, 25, 139–147. [Google Scholar] [CrossRef]
- Socha, G. Fatigue damage indicators based on plastic deformation. ASTM Spec. Tech. Publ. 2017, 1598, 246–257. [Google Scholar]
- Lemaitre, J. A Course on Damage Mechanics; Springer: Berlin/Heidelberg, Germany, 1996. [Google Scholar]
- Yang, L.; Fatemi, A. Cumulative Fatigue Damage Mechanisms and Quantifying Parameters: A Literature Review. J. Test. Eval. 1998, 26, 89–100. [Google Scholar]
- Krysztofik, J.; Kukla, D.; Manaj, W.; Socha, G. Evaluation of damage degree of Inconel 718 alloy with the use of non-destructive methods. Russ. J. Nondestruct. Test. 2019, 55, 299–307. [Google Scholar] [CrossRef]
- Socha, G.; Madejski, B.; Malicki, M. Study on deformation-induced damage evolution for Inconel718 superalloy with the use of an innovative single-specimen method. J. Theor. Appl. Mech. 2016, 54, 1379–1390. [Google Scholar] [CrossRef] [Green Version]
- Socha, G.; Dietrich, L. Accumulation of damage in A336 GR5 structural steel subject to complex stress loading. Strain 2012, 48, 279–285. [Google Scholar]
- Socha, G.; Dietrich, L. A fatigue damage indicator parameter for P91 chromium-molybdenum alloy steel and fatigue pre-damaged P54T carbon steel. Fatigue Fract. Engng. Mater. Struct. 2014, 37, 195–205. [Google Scholar] [CrossRef]
- Mair, W.M.; Pugh, H. Effect of pre-strain on yield surfaces in copper. J. Mech. Eng. Sci. 1954, 6, 150–163. [Google Scholar] [CrossRef]
- Rogan, J.; Shelton, A. Effect of pre-stress on the yield and flow of En 25 steel. J. Strain Anal. 1969, 4, 138–160. [Google Scholar] [CrossRef]
- Johnson, G.R. Materials Characterization for computations involving severe dynamic loading. In Proceedings of the Army Symposium on Solid Mechanics, Cape Cod, MA, USA, 30 September–2 October 1980; pp. 62–67. [Google Scholar]
- Odqvist, F.K.G. Die Verfestigung von flusseisenaehlichen Koerpern. ZAMM 1933, 13, 360–363. [Google Scholar] [CrossRef]
- Hill, R. The Mathematical Theory of Plasticity; Clarendon Press: Oxford, UK, 1956. [Google Scholar]
- Socha, G.; Madejski, B.; Krysztofik, J.; Czarnewicz, S. Method for testing the damage of material structure caused by permanent deformation of the specimen subjected to tensile test and the specimen for testing the damage of material structure. Patent 409294, 2014. [Google Scholar]
- ASTM E10-15; Standard Test Method for Brinell Hardness of Metallic Materials. ASTM Standards: West Conshohocken, PA, USA, 2019.
- Socha, G. Changes of the yield condition due to accumulation of damage of metal alloys. Eng. Trans. 2008, 56, 227–245. [Google Scholar]
- Hancock, J.W.; Mackenzie, A.C. On the mechanisms of ductile failure in high-strength steels subjected to multi-axial stress-states. J. Mech. Phys. Solids 1976, 24, 147–169. [Google Scholar] [CrossRef]
- Socha, G. Calibration of Failure Criteria for Additively Manufactured Metallic Materials. Materials 2021, 14, 3442. [Google Scholar] [CrossRef] [PubMed]
- EN ISO 14577-1:2015; Metallic materials—Instrumented indentation test for hardness and materials parameters—Part 1: Test method. ISO: Geneva, Switzerland, 2015.
- He, X.; Liu, Z.; Ripley, L.B.; Swensen, V.L.; Kim, S.H. Empirical relationship between interfacial shear stress and contact pressure in micro- and macro-scale friction. Tribol. Int. 2021, 155, 106780. [Google Scholar] [CrossRef]
- Tabor, T. The Hardness of Metals; Department of Physical Chemistry: Cambridge, UK, 1951. [Google Scholar]
- Oliver, W.C.; Pharr, G.M. Measurement of hardness and elastic modulus by instrumented indentation: Advances in understanding and refinements to methodology. J. Mater. Res. 2004, 19, 3–20. [Google Scholar] [CrossRef]
Figure 1.
Graphical interpretation of the strain-hardening cross-effect for plane stress state.

Figure 2.
Specimen with varying cross-section of the gage part used for the investigation (dimensions in mm).
Figure 2.
Specimen with varying cross-section of the gage part used for the investigation (dimensions in mm).

Figure 3.
Device for indentation tests—instrumented hardness tester.

Figure 4.
Indentation test: (a) indentation load vs. time; (b) projected intended area.

Figure 5.
Force–displacement plot for indentation test.

Figure 6.
Inconel 718 alloy: (a) structure in as-received state (magnification 400×), (b) surface of specimen in the neck zone after HCF test—magnification 1500×).
Figure 6.
Inconel 718 alloy: (a) structure in as-received state (magnification 400×), (b) surface of specimen in the neck zone after HCF test—magnification 1500×).

Figure 7.
Distribution of the damage parameter in the gage part of the specimens after tests.

Figure 8.
Hardness as the function of reference damage parameter for all applied loading regimes.

Figure 9.
Specimen after static tension test: (a) gage part of the specimen after indentation tests; (b) and indentation force–displacement plots.
Figure 9.
Specimen after static tension test: (a) gage part of the specimen after indentation tests; (b) and indentation force–displacement plots.

Figure 10.
HCF tested specimen: (a) gage part of the specimen after indentation tests; (b) and indentation force–displacement plots.
Figure 10.
HCF tested specimen: (a) gage part of the specimen after indentation tests; (b) and indentation force–displacement plots.

Figure 11.
LCF tested specimen: (a) gage part of the specimen after indentation tests; (b) and indentation force–displacement plots.
Figure 11.
LCF tested specimen: (a) gage part of the specimen after indentation tests; (b) and indentation force–displacement plots.

Figure 12.
Indentation work as the function of damage parameter for all applied loading regimes.


Table 1.
Chemical composition of the Inconel 718 alloy (% weight).
| C | Mn | P | S | Si | Cr | Ni | Al |
| 0.05 | 0.01 | 0.008 | 0.0002 | 0.10 | 17.98 | 52.30 | 0.60 |
| Mo | Cu | Nb | Ta | Ti | Co | B | Fe |
| 2.88 | 0.02 | 4.97 | 0.01 | 1.02 | 0.04 | 0.002 | 19.96 |
Disclaimer/Publisher’s Note: The statements, opinions and data contained in all publications are solely those of the individual author(s) and contributor(s) and not of MDPI and/or the editor(s). MDPI and/or the editor(s) disclaim responsibility for any injury to people or property resulting from any ideas, methods, instructions or products referred to in the content. |
© 2023 by the authors. Licensee MDPI, Basel, Switzerland. This article is an open access article distributed under the terms and conditions of the Creative Commons Attribution (CC BY) license (https://creativecommons.org/licenses/by/4.0/).
Share and Cite
MDPI and ACS Style
Socha, G.; Malicki, M. Early Detection of Damage of Inconel 718 with the Use of Strain-Hardening Cross-Effect. Crystals 2023, 13, 429. https://doi.org/10.3390/cryst13030429
AMA Style
Socha G, Malicki M. Early Detection of Damage of Inconel 718 with the Use of Strain-Hardening Cross-Effect. Crystals. 2023; 13(3):429. https://doi.org/10.3390/cryst13030429
Chicago/Turabian StyleSocha, Grzegorz, and Maciej Malicki. 2023. "Early Detection of Damage of Inconel 718 with the Use of Strain-Hardening Cross-Effect" Crystals 13, no. 3: 429. https://doi.org/10.3390/cryst13030429
Note that from the first issue of 2016, this journal uses article numbers instead of page numbers. See further details here.