

High Temperature Deformation Behavior of Near-β Titanium Alloy Ti-3Al-6Cr-5V-5Mo at α + β and β Phase Fields


School of Materials Science and Engineering, Shenyang University of Technology, Shenyang 110870, China
*
Author to whom correspondence should be addressed.
Crystals 2023, 13(3), 371; https://doi.org/10.3390/cryst13030371
Submission received: 4 February 2023
/
Revised: 16 February 2023
/
Accepted: 18 February 2023
/
Published: 21 February 2023
(This article belongs to the Special Issue Crystallization of High Performance Metallic Materials)
Abstract
:Most near-β titanium alloy structural components should be plastically deformed at high temperatures. Inappropriate high-temperature deformed processes can lead to macro-defects and abnormally coarse grains. Ti-3Al-6Cr-5V-5Mo alloy is a near-β titanium alloy with the potential application. The available information on the high-temperature deformation behavior of the alloy is limited. To provide guidance for the actual hot working of the alloy, the flow stress behavior and processing map at α + β phase field and β phase field were studied, respectively. Based on the experimental data obtained from hot compressing simulations at the range of temperature from 700 °C to 820 °C and at the range of strain rate from 0.001 s−1 to 10 s−1, the constitutive models, as well as the processing map, were obtained. For the constitutive models at the α + β phase field and β phase field, the correlated coefficients between actual stress and predicted stress are 0.986 and 0.983, and the predictive mean relative errors are 2.7% and 4.1%. The verification of constitutive models demonstrates that constitutive equations can predict flow stress well. An instability region in the range of temperature from 700 °C to 780 °C and the range of strain rates from 0.08 s−1 to 10 s−1, as well as a suitable region for thermomechanical processing in the range of temperature from 790 °C to 800 °C and the range of strain rates from 0.001 s−1 to 0.007 s−1, was predicted by the processing map and confirmed by the hot-deformed microstructural verification. After the deformation at 790 °C/0.001 s−1, the maximum number of dynamic recrystallization grains and the minimum average grain size of 17 μm were obtained, which is consistent with the high power-dissipation coefficient region predicted by the processing map.
1. Introduction
Near-β titanium alloys are applied to various engineering fields as an important structural metal due to their high strength and toughness, excellent thermal stability, and good fatigue properties [1,2]. Most titanium alloy structural components must be plastically deformed by thermomechanical processing (TMP), including forging, hot rolling, and hot extrusion [3,4,5,6]. After TMP, the structural components exhibit good mechanical properties while obtaining the desired shape. For example, Ti-6Al-2Sn-4Zr-6Mo alloy was produced through β-processed forging, whose forging temperature is above β-transus [7]. Moreover, a titanium alloy aero-engine drum was formed by hot-deformation at a dual-phase field [8]. Thus, the TMP of such alloys may be carried out at both single-phase (β) field and dual-phase field (α + β). Moreover, an inappropriate technical process can lead to the formation of macro-defects and abnormally coarse grains, as well as harmful effects on the quality of the near-β titanium alloy structural components.
Many efforts were made to study the high-temperature deformation behavior of near β titanium alloys during TMP [9,10]. Park et al. [11] proposed the processing map and calculated the activation energy for high-temperature deformation of the near-β titanium alloy, β21S. According to the established processing map, flow instability would occur when the β21S alloy deformed at 900 °C/10 s−1. Zhang et al. [12] established the constitutive relationship and processing map of Ti-6Mo-2Sn-6Al-4Zr alloy. The results suggested that deformation should occur in an area of efficient power dissipation, and the area should be within the range of temperature from 850 °C to 1000 °C, with a strain rate from 0.001 s−1 to 0.1 s−1. Chen et al. [13] developed the Arrhenius model for hot deformation of the Ti-5.5Cr-5Mo-5V-4Al-1Nb alloy. This model exhibits an accurate prediction for flow stress with a high correlation coefficient value. Gao et al. [14] investigated the high-temperature deformed process of Ti-10Mo-3Nb-6Zr-4Sn alloy via an isothermal compression test. They quantitatively calculated a sensibility factor of strain rate and constructed the thermal processing map. These results accurately describe the high-temperature deformation behaviors of the alloy. Wang et al. [15] proposed a modified J-C constitutive model to exactly represent the flow stress behavior of Ti-22Al-23Nb-2(Mo, Zr) alloy. Zhao et al. [16] studied the high-temperature deformation behavior of ingot metallurgy Ti-5V-5Mo-3Cr-5Al alloy via a processing map. They proposed that the region of suitable deformation is in the temperature from 800 °C to 970 °C and the strain rate from 10−1.5 s−1 to 10−3 s−1. Hence, there are effective methods to study the high-temperature deformation behavior of near-β titanium alloys by establishing constitutive relations and processing maps.
During high-temperature deformation, the microstructure of near-β titanium alloys can be tailored by dynamic recovery (DRV) and dynamic recrystallization (DRX) [17,18]. Meanwhile, different near-β titanium alloys exhibit distinct instability and suitable deformation regions, other flow stress behaviors, and DRV and DRX behaviors. The works reported by the literature [19,20,21,22,23] also performed similar research and confirm this phenomenon.
Ti-3Al-6Cr-5V-5Mo alloy is a near-β titanium alloy with good mechanical properties; it is designed by taking the Ti-5Cr-5V-8Cr-3Al alloy as the baseline alloy [24]. Its tensile strength is over 1400 MPa through TMP. The alloy shows a potential application in structural components. However, the further improvement of ductility and toughness of the alloy after hot working is often restricted by coarse grains. In addition, the available information on the flow stress behavior and processing map of the alloy is limited at present. Therefore, this work aimed to study the high-temperature deformation behavior of the Ti-3Al-6Cr-5V-5Mo alloy. Acceptable TMP conditions were traced by establishing a processing map and observing the microstructure. Furthermore, constitutive relations for deformation at the dual-phase field and single-phase field were sequentially established to predict the flow stress behavior. The purpose of this work is to provide guidance for the actual hot working of the alloy.
2. Materials and Methods
The spongy titanium, Al-Mo master alloy, Al-V master alloy, purity Al, and purity Cr were used as raw materials for smelting Ti-3Al-6Cr-5V-5Mo (wt.%) alloy. The alloy ingot was prepared by triple vacuum arc remelting. The chemical composition of the alloy ingot was analyzed by X-ray Fluorescence Spectrometer, as shown in Table 1.
The cylindrical samples, which were 15 mm in height and 10 mm in diameter, were cut from the alloy ingot and then used for high-temperature compression tests. The high-temperature compression simulations were performed on a Gleeble 3800 thermomechanical simulator. A metallographic examination was adopted to measure the β-transus of the alloy. The measured β-transus is 780 °C. Five deformation temperatures and five strain rates were selected. The samples were high-temperature deformed with a height reduction of 60%, followed by water quenching. The detailed high-temperature compressing simulation parameters are shown in Table 2. After hot-temperature deformation, square sheets were cut from specimens along the compression axis to observe the deformed microstructure. The square sheets were ground on metallographic sandpaper and electrolytically polished at ~−16 °C in a liquid of 59% methanol, 35% nbutyl alcohol, and 6% perchloric acid. The voltage of electrolytic polishing was 32 V, the current of electrolytic polishing was 1.2 A, and the electrolytic polishing time was 60 s. Then the deformed grains of the alloy were observed by electron backscattered diffraction (EBSD) installed on a ZEISS GeminiSEM300 scanning electron microscope.
3. Results and Discussion
3.1. Flow Stress
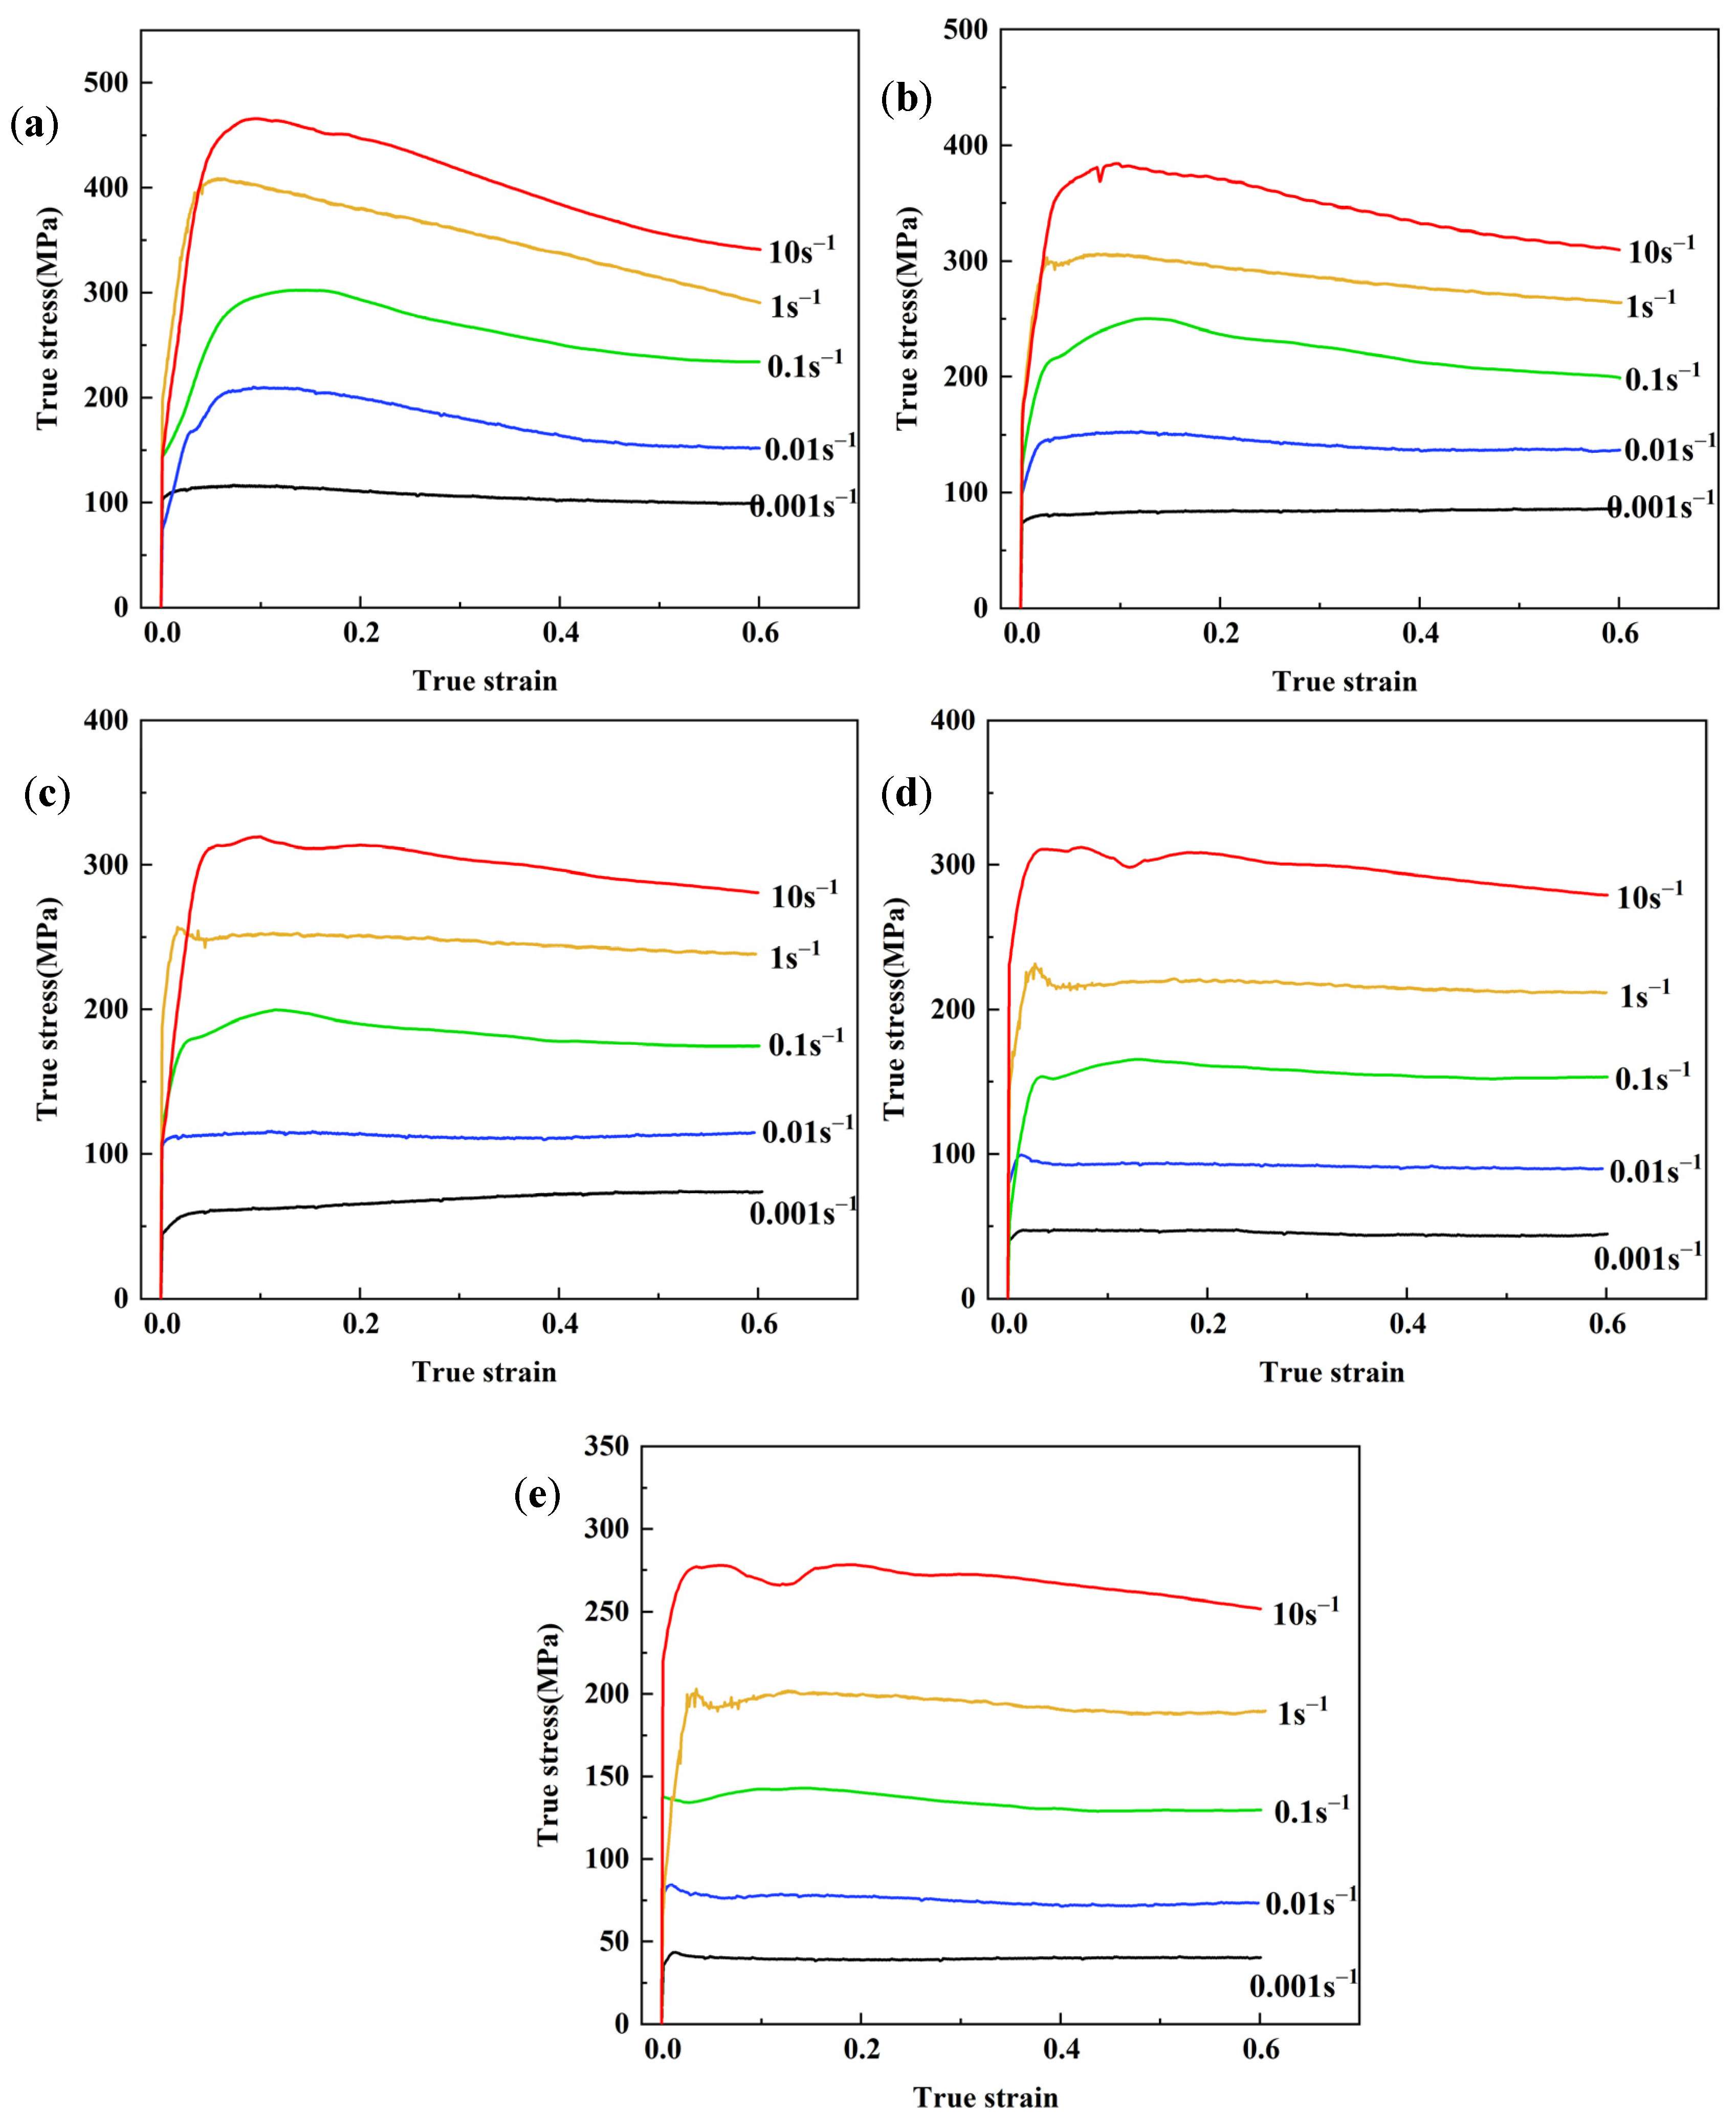
The true-stress–true-strain curves during the deformation at dual-phase field and single-phase field are shown in Figure 1. According to Figure 1, the flow stress under the different deformation conditions exhibits similar characteristics. In the initial stage of deformation, a large number of dislocations are rapidly activated. The interaction between dislocations leads to the difficulty of dislocation slip, which is represented as work hardening. Thus, the flow stress rapidly rises to the peak value due to work hardening when the strain is minor [25]. After the peak of stress, the flow stress gets into a relatively stable stage of slow change or equilibrium. The competition between work-hardening and -softening mechanisms, such as DRV and DRX, causes this phenomenon. The occurrence of DRV and DRX is mainly affected by temperature and time. At a constant deformation temperature, the lower strain rate provides a condition for the event of softening. Moreover, the increase of strain rate leads to the increase in dislocation density, hindering dislocation movement [26]. Therefore, for the same deformation temperature, the flow stress increases with the increase in strain rate. In a constant time, the higher temperature provides favorable conditions for the DRV and DRX. Moreover, the higher free energy is beneficial to dislocation slip and grain-boundary migration [27]. Therefore, the flow stress decreases with the increase of deformation temperature for the same strain rate.
3.2. Constitutive Model for High-Temperature Deformation
Based on the analysis of flow stress at various deformation conditions, Arrhenius’s constitutive model for high-temperature deformation at the α + β phase field and β phase field is established, sequentially.
3.2.1. Constitutive Relations
The constitutive relations between deformation conditions and stress should be obtained to determine the optimal hot-deformation parameters. An Arrhenius model [28] is adopted to establish the relationship between strain rate () and deformation activation energy (Q), deformation temperature (T), and stress (σ), as shown in Equation (1).
where R is the gas constant of 8.314 J/(mol·K) [29]. Moreover, f(σ) can be defined as a function of stress, as shown in Equation (2).
where A1, A2, β, α, and A are materials’ constants; and n1 and n are stress exponents.
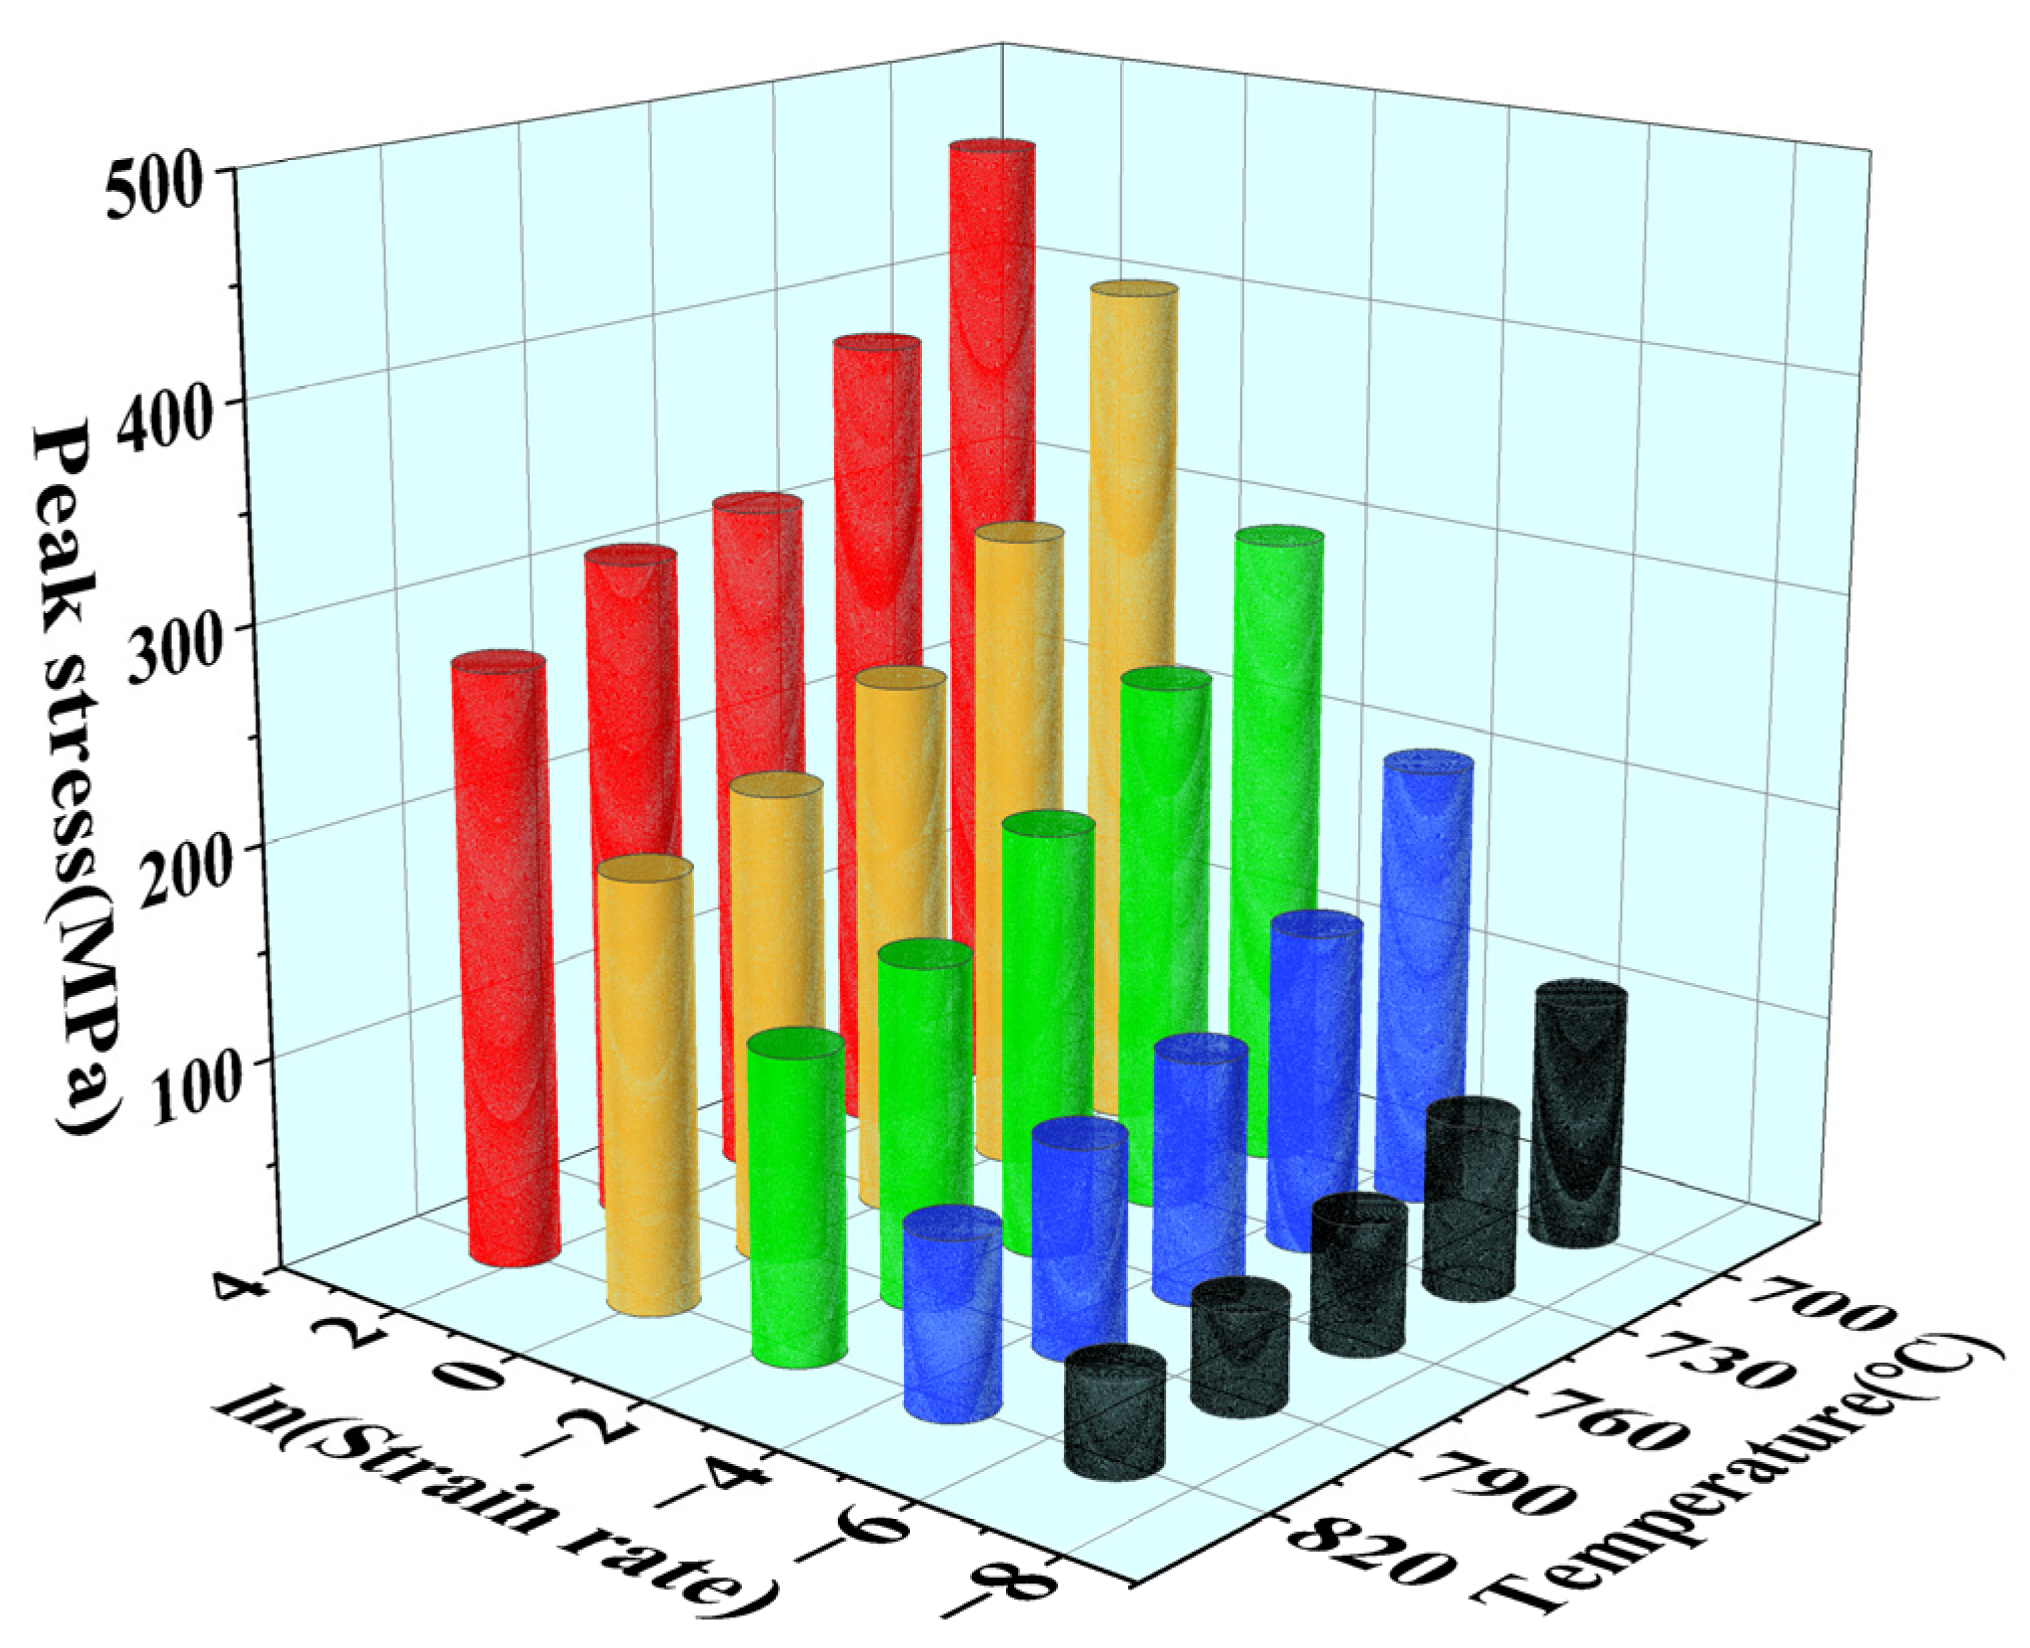
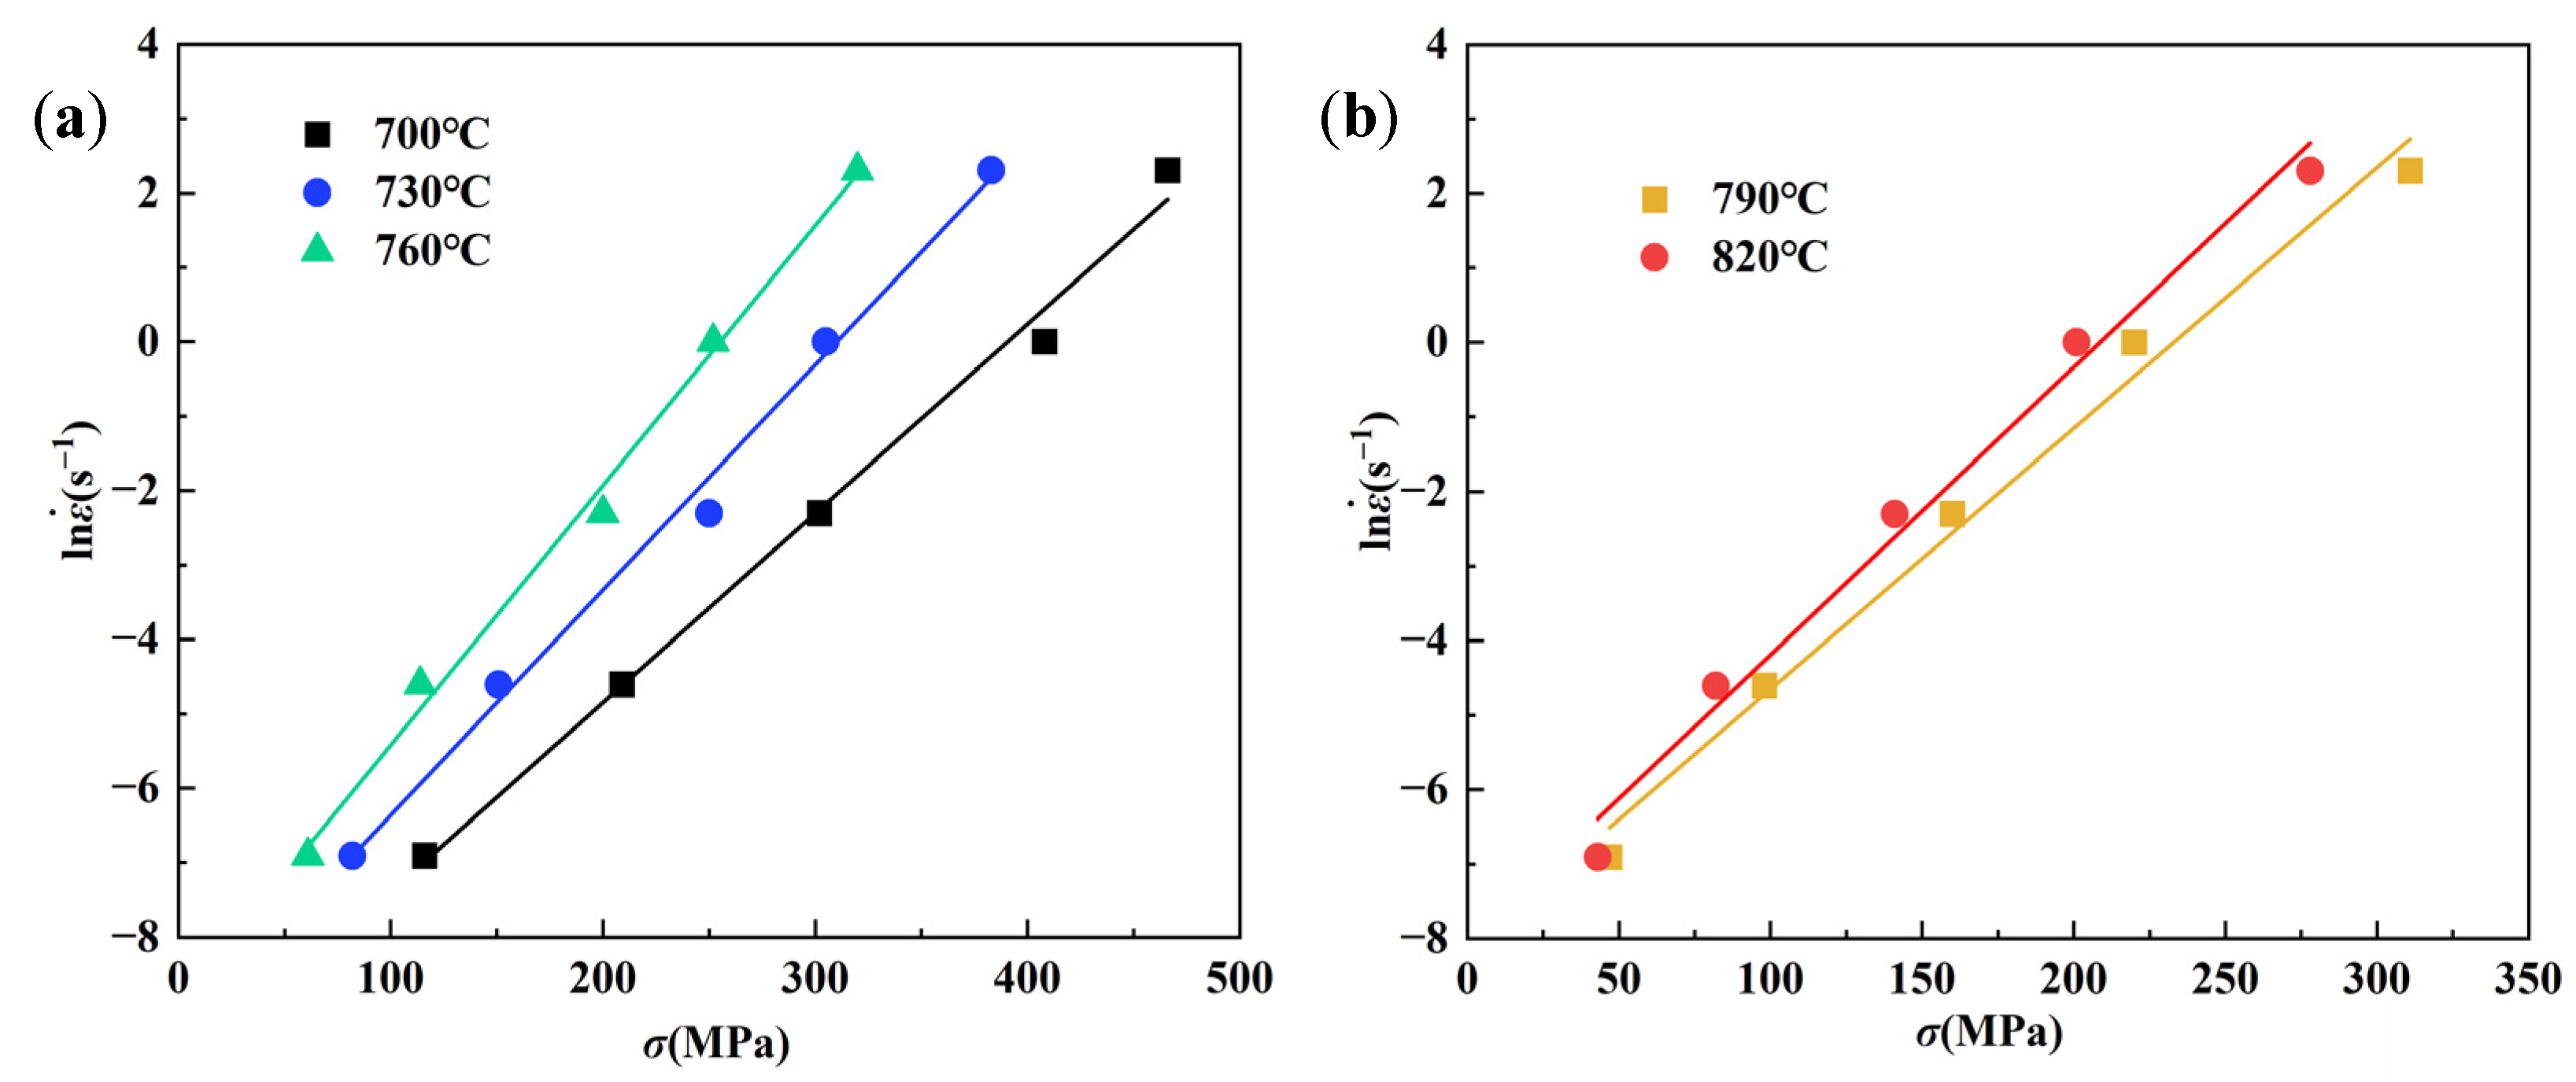
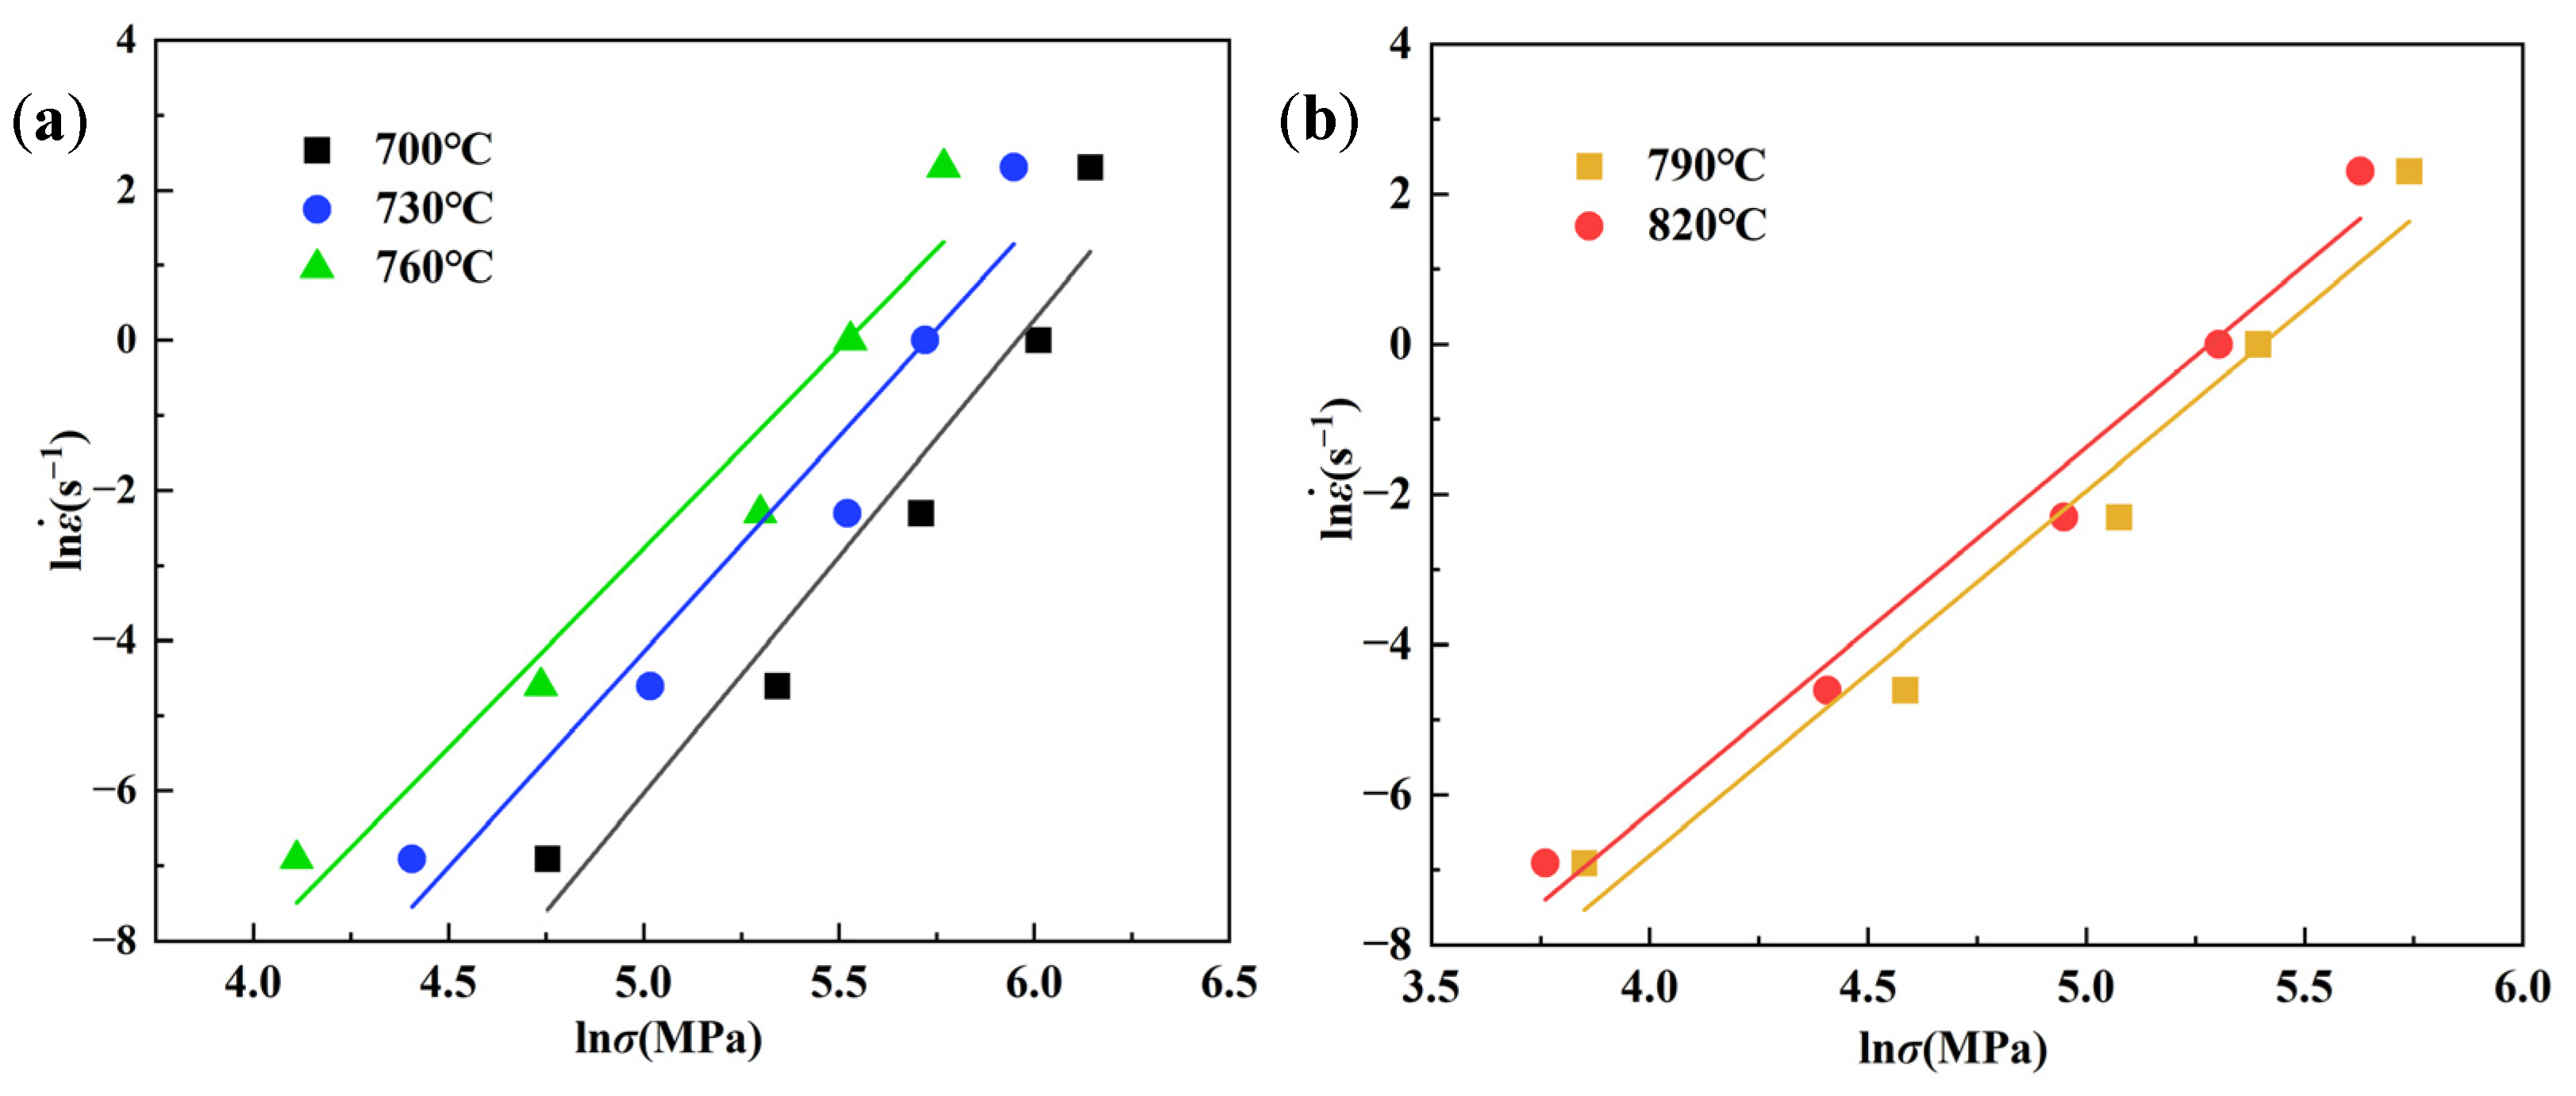
The peak stress is adopted to establish constitutive equations [30]. The values of peak stress are shown in Figure 2. Based on the values and σ values, the curves of ln − σ and ln − lnσ at different phase fields are drawn in Figure 3 and Figure 4, respectively.
The average slopes of ln − σ curves and ln − lnσ curves are obtained by linear fitting. Furthermore, the logarithms of Equation (1) after bringing f(σ) = A1σn1 and f(σ) = A2exp(βσ) are taken, respectively, which are used to calculate the values of n1 and β at α + β and β phase fields. Then the values of α at α + β and β phase fields can be calculated by β/n1 [31]. The calculated values of α, β and n1 are shown in Table 3.
Bring into
Equation (1), and by taking the logarithm, Equation (3) can be obtained as
follows:
By taking the partial differential of Equation (3), the Q is determined by Equation (4):
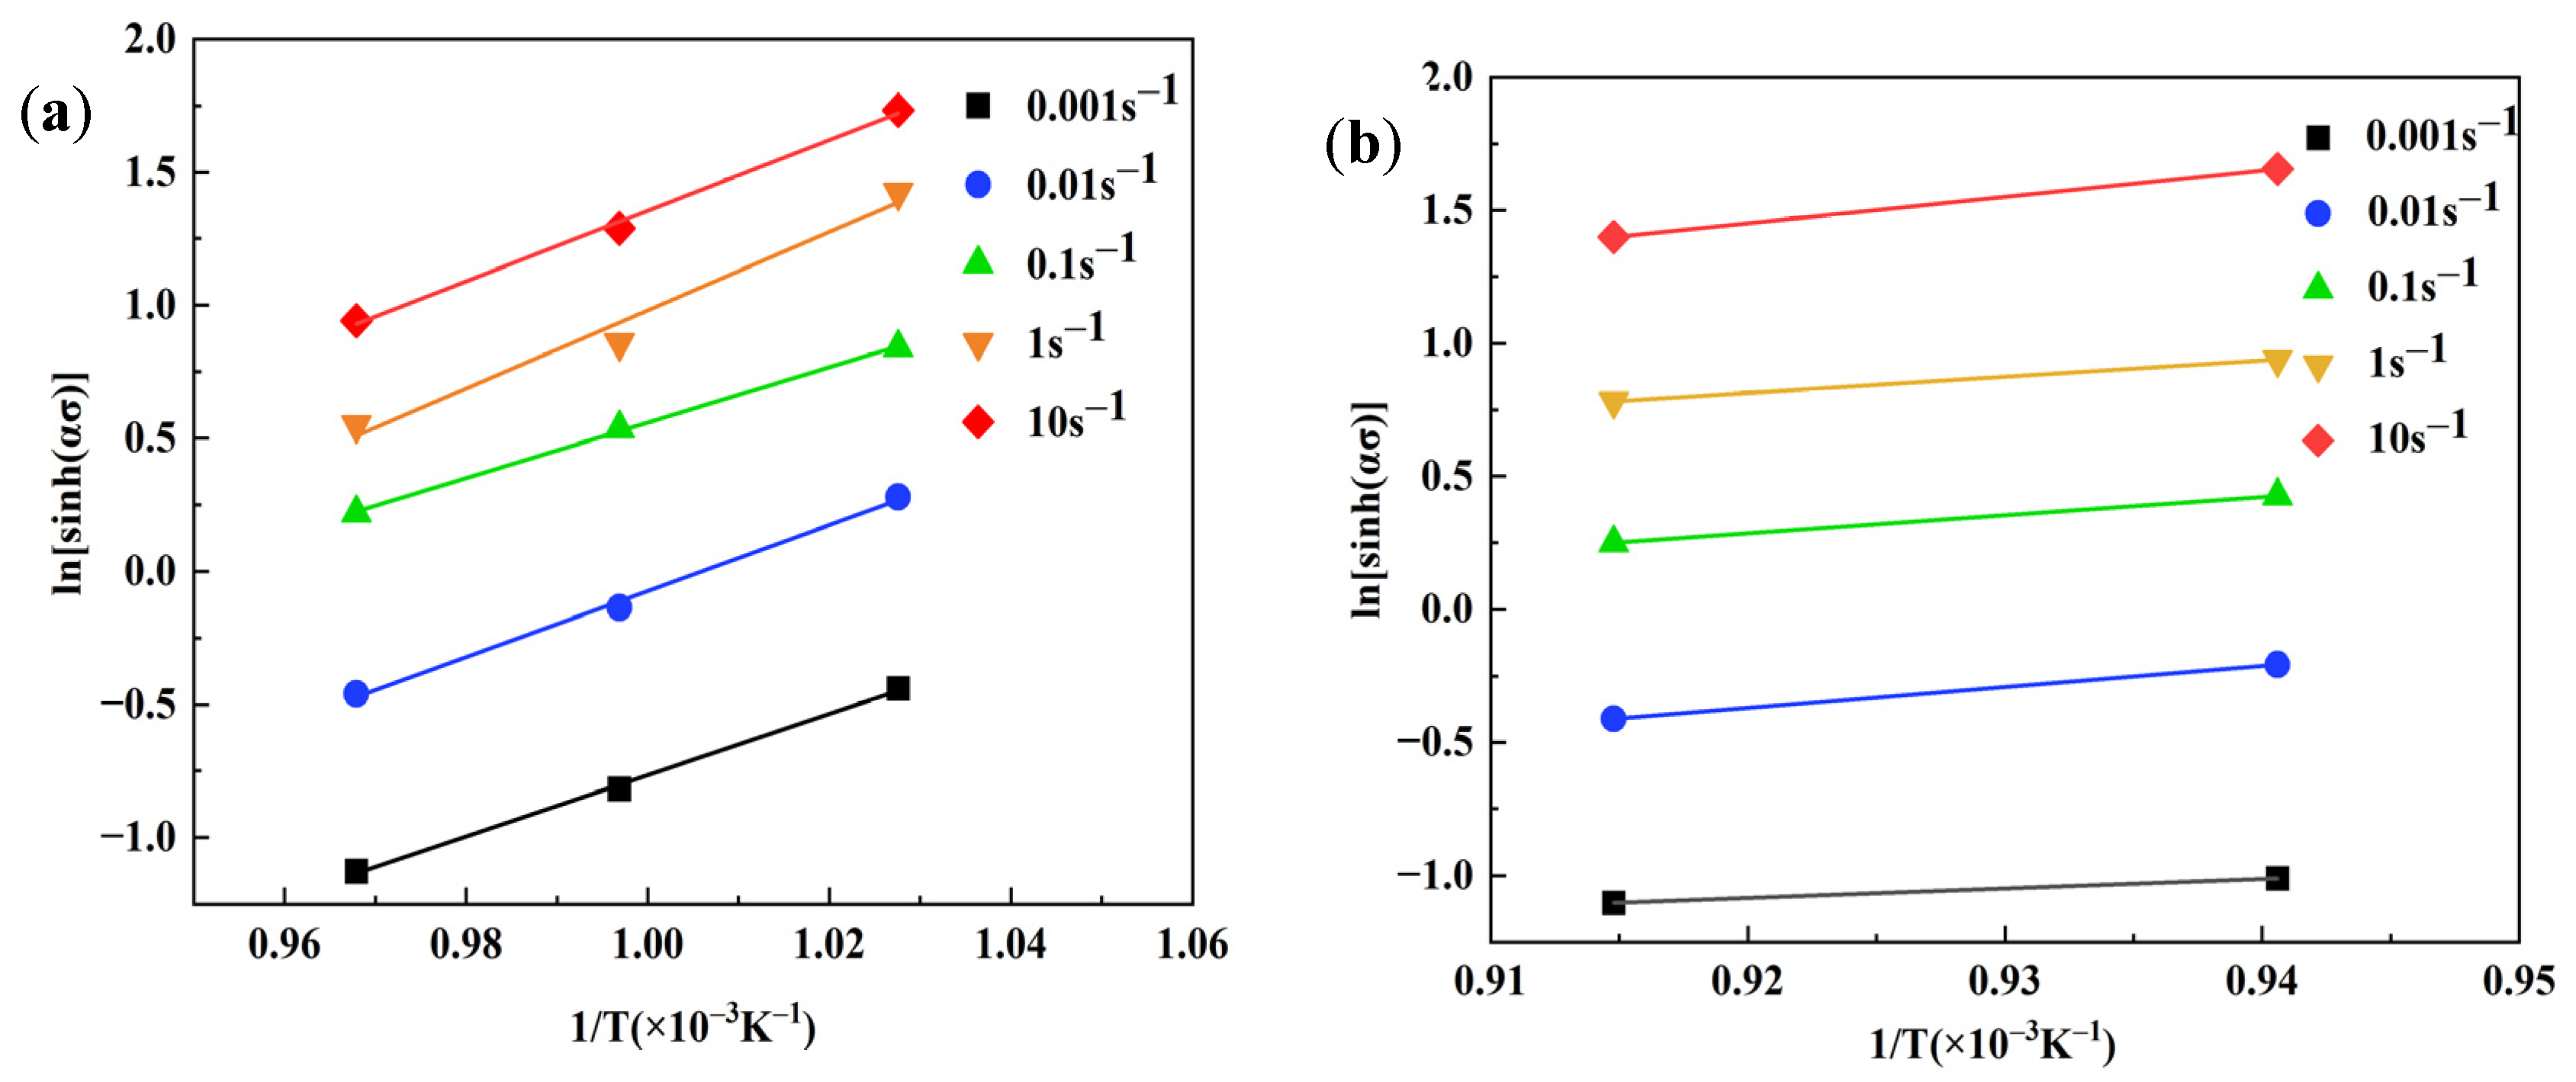
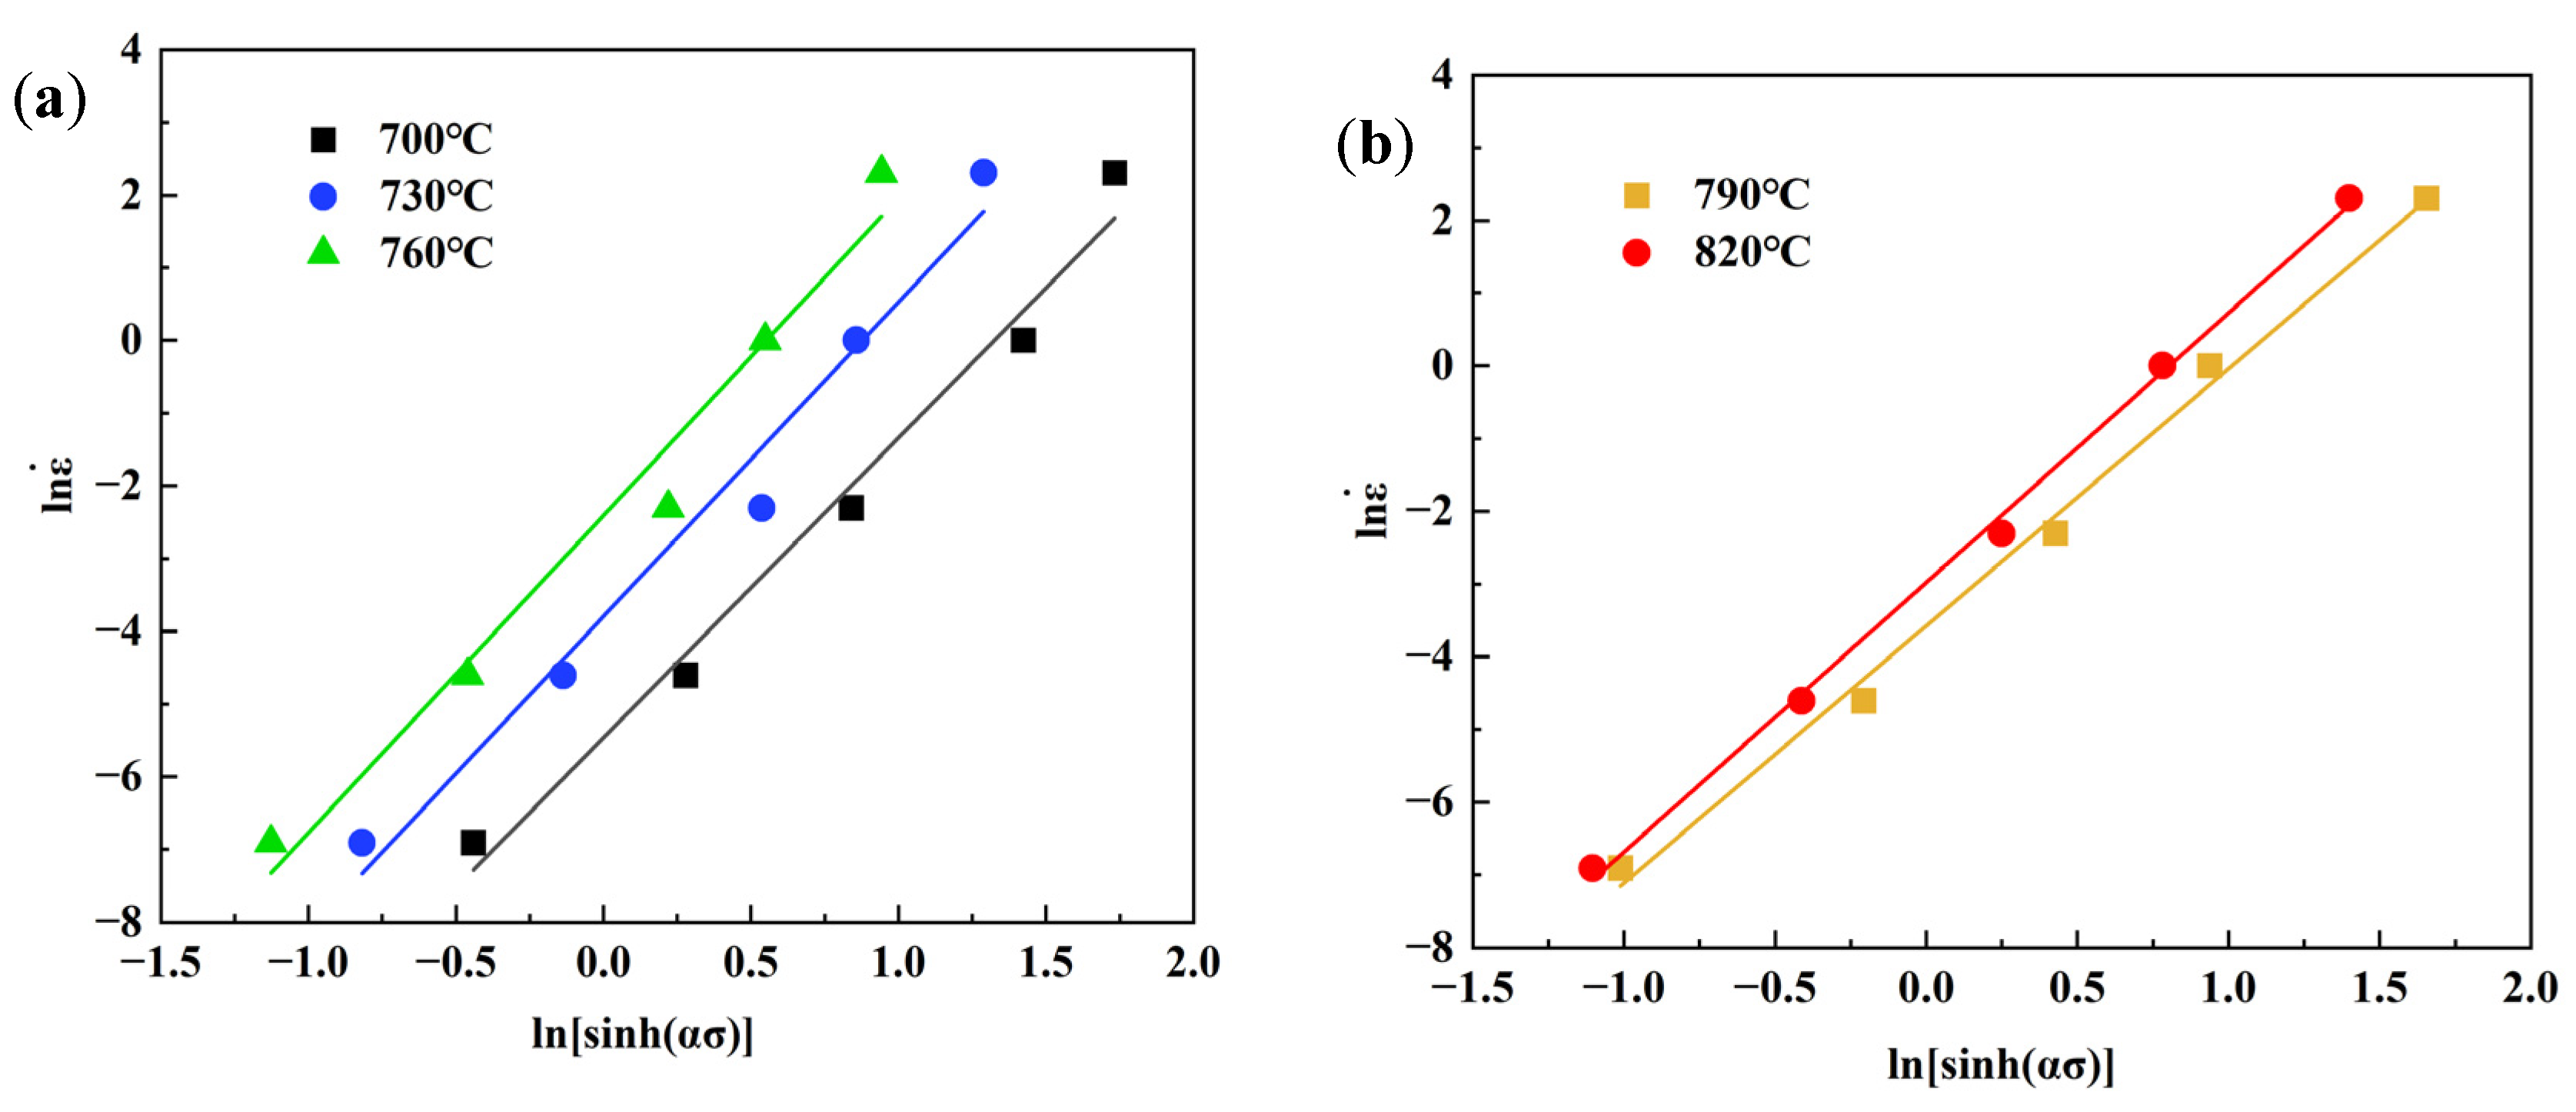
According to Equation (4), the values of Q can be obtained by calculating the partial differential between ln[sinh(ασ)]/1/T and ln/ln[sinh(ασ)]. Thus, the curves of ln[sinh(ασ)] − 1/T and ln − ln[sinh(ασ)] are drawn in Figure 5 and Figure 6, respectively.
According to Figure 5 and Figure 6, the average slopes of ln[sinh(ασ)] − 1/T curves at α + β and β phase fields were calculated as 12.45591 and 6.870484, and those of the ln − ln[sinh(ασ)] curves were 4.27053 and 3.62148, which were obtained by linear fitting. The values of Q at α + β and β phase fields were calculated by introducing the abovementioned slopes into Equation (4), and they are shown in Table 3.
A Zener–Hollomon parameter Z on the relationship between strain rate, , and deformation temperature, T, is introduced [32], as shown in Equation (5):
The logarithm of Equation (5) can be described as follows:
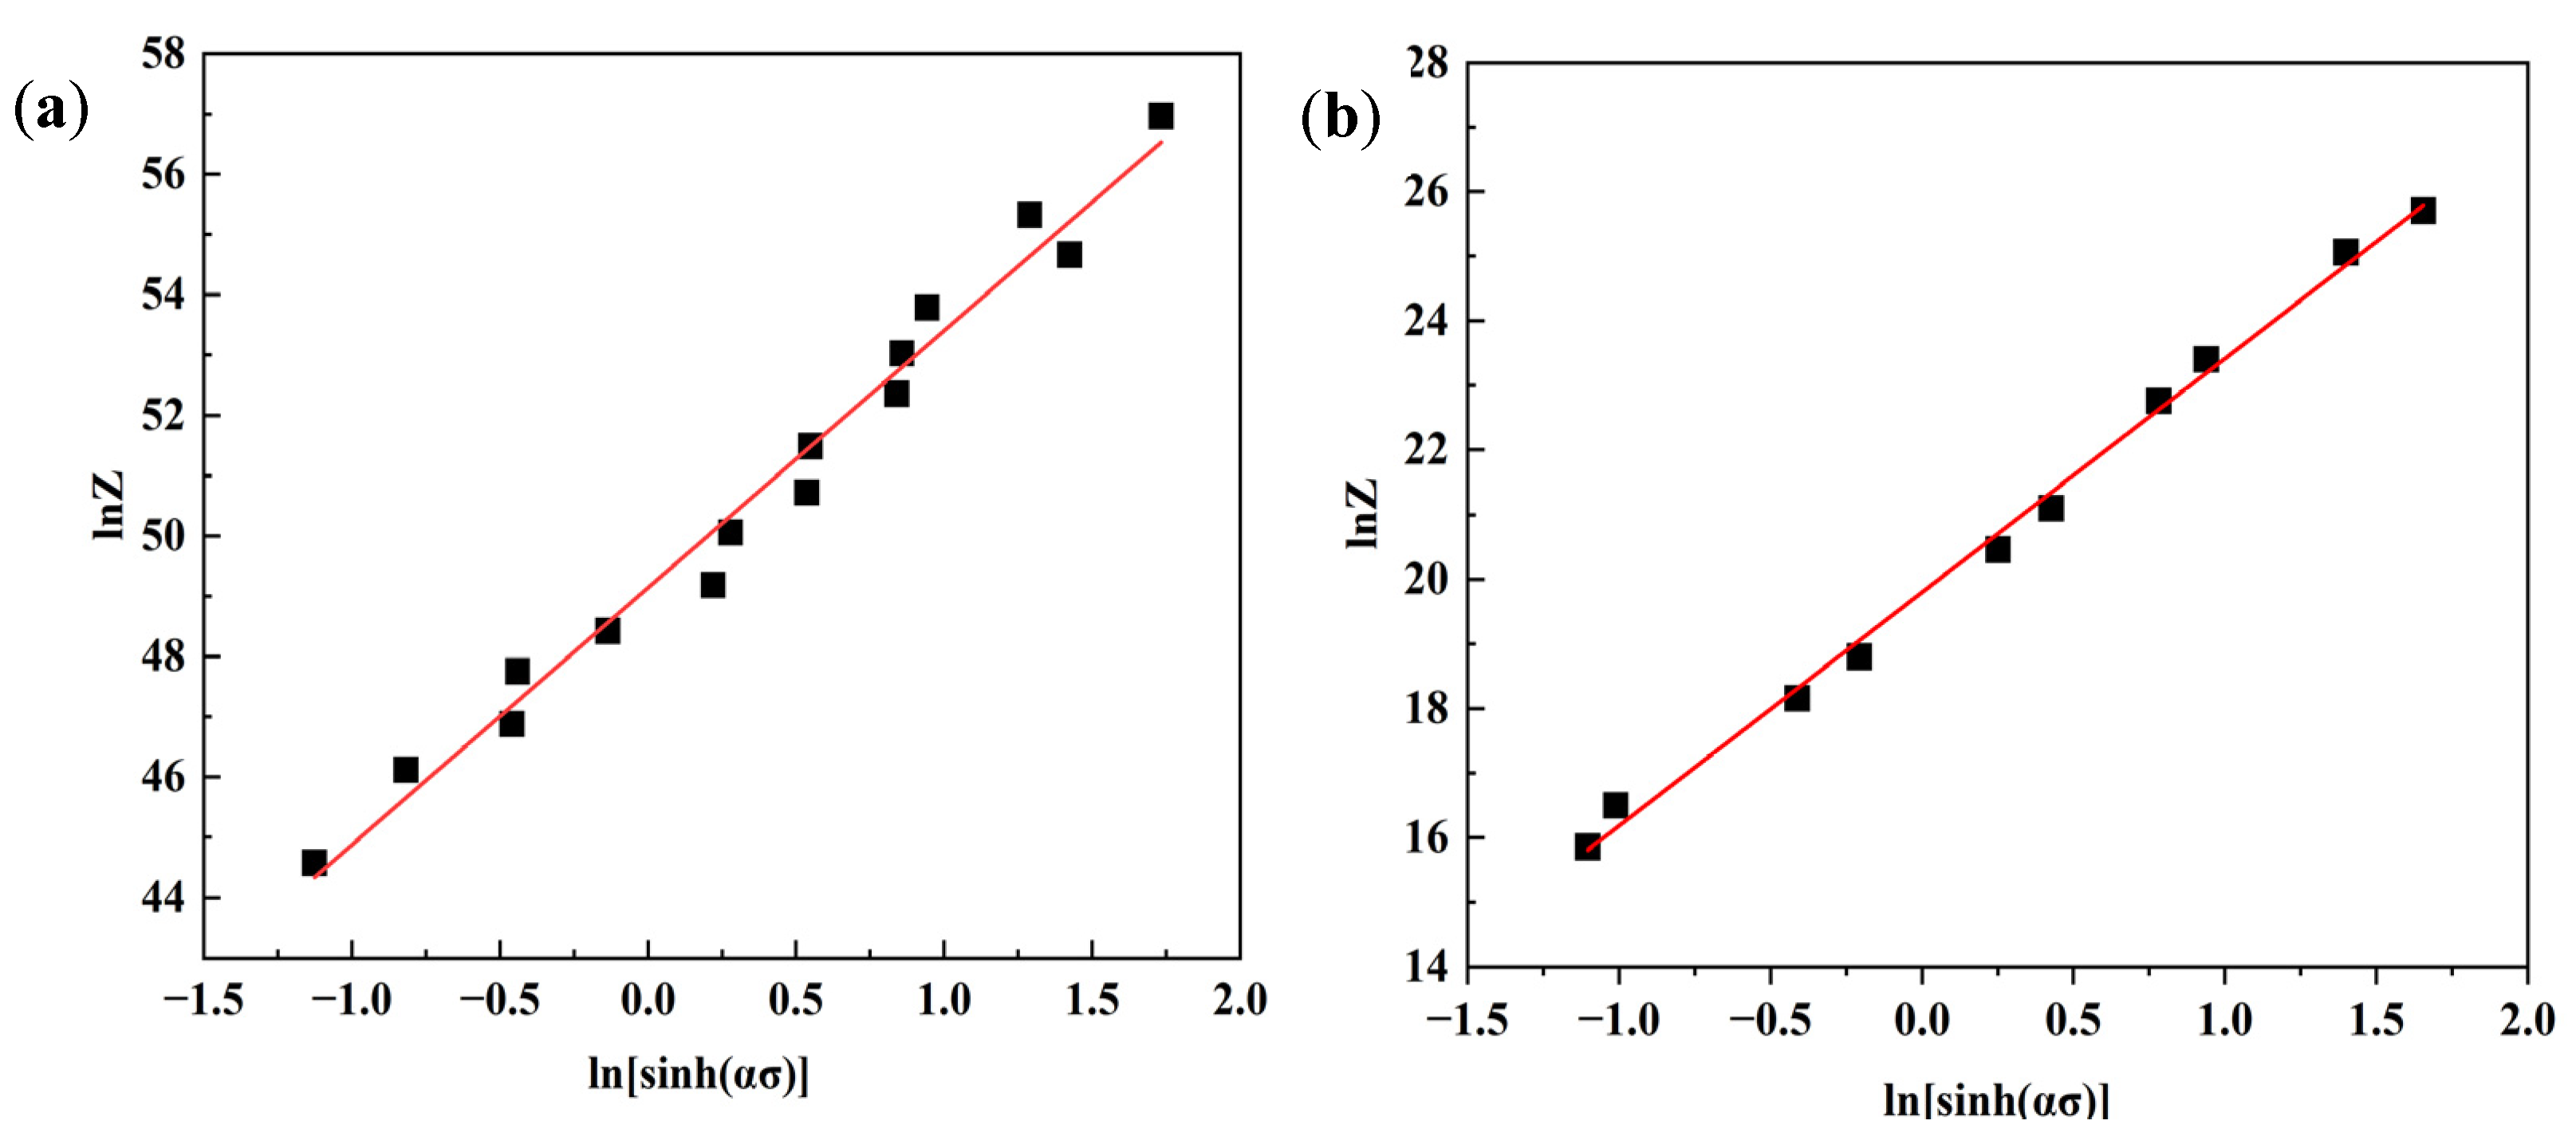
Moreover, lnZ can be calculated by taking the Q, T, and into Equation (6). Then the curves of ln[sinh(ασ)] −lnZ at α + β and β phase fields can be obtained as shown in Figure 7. The values of n are obtained from the slopes of the curves. The values of A can be obtained from the lnA of 49.13873 (α + β phase field) and 19.79592 (β phase field), which can be determined by the intercepts of the curves. The n and A are shown in Table 3.
Moreover, the correlation coefficient of ln[sinh(ασ)] − lnZ at α + β and β phase fields can be determined as 0.98 and 0.9958, respectively, which show the hyperbolic sinusoidal function coincides with the experimental data. The constitutive equations of the alloy are expressed as shown in Equation (7):
Generally, because high-temperature compression is a thermal-activation process, the softening mechanism can be inferred by comparing with deformation activation energy and self-diffusion activation energy of β titanium alloy (161 kJ/mol) [33]. As seen from Table 3, the self-diffusion activation energy of 161 kJ/mol is smaller than the Q values of 442.25 kJ/mol and 206.86 kJ/mol. It can be inferred that the DRX may be the main softening mechanism when the alloy deforms at a high temperature.
3.2.2. Verification of Constitutive Equations
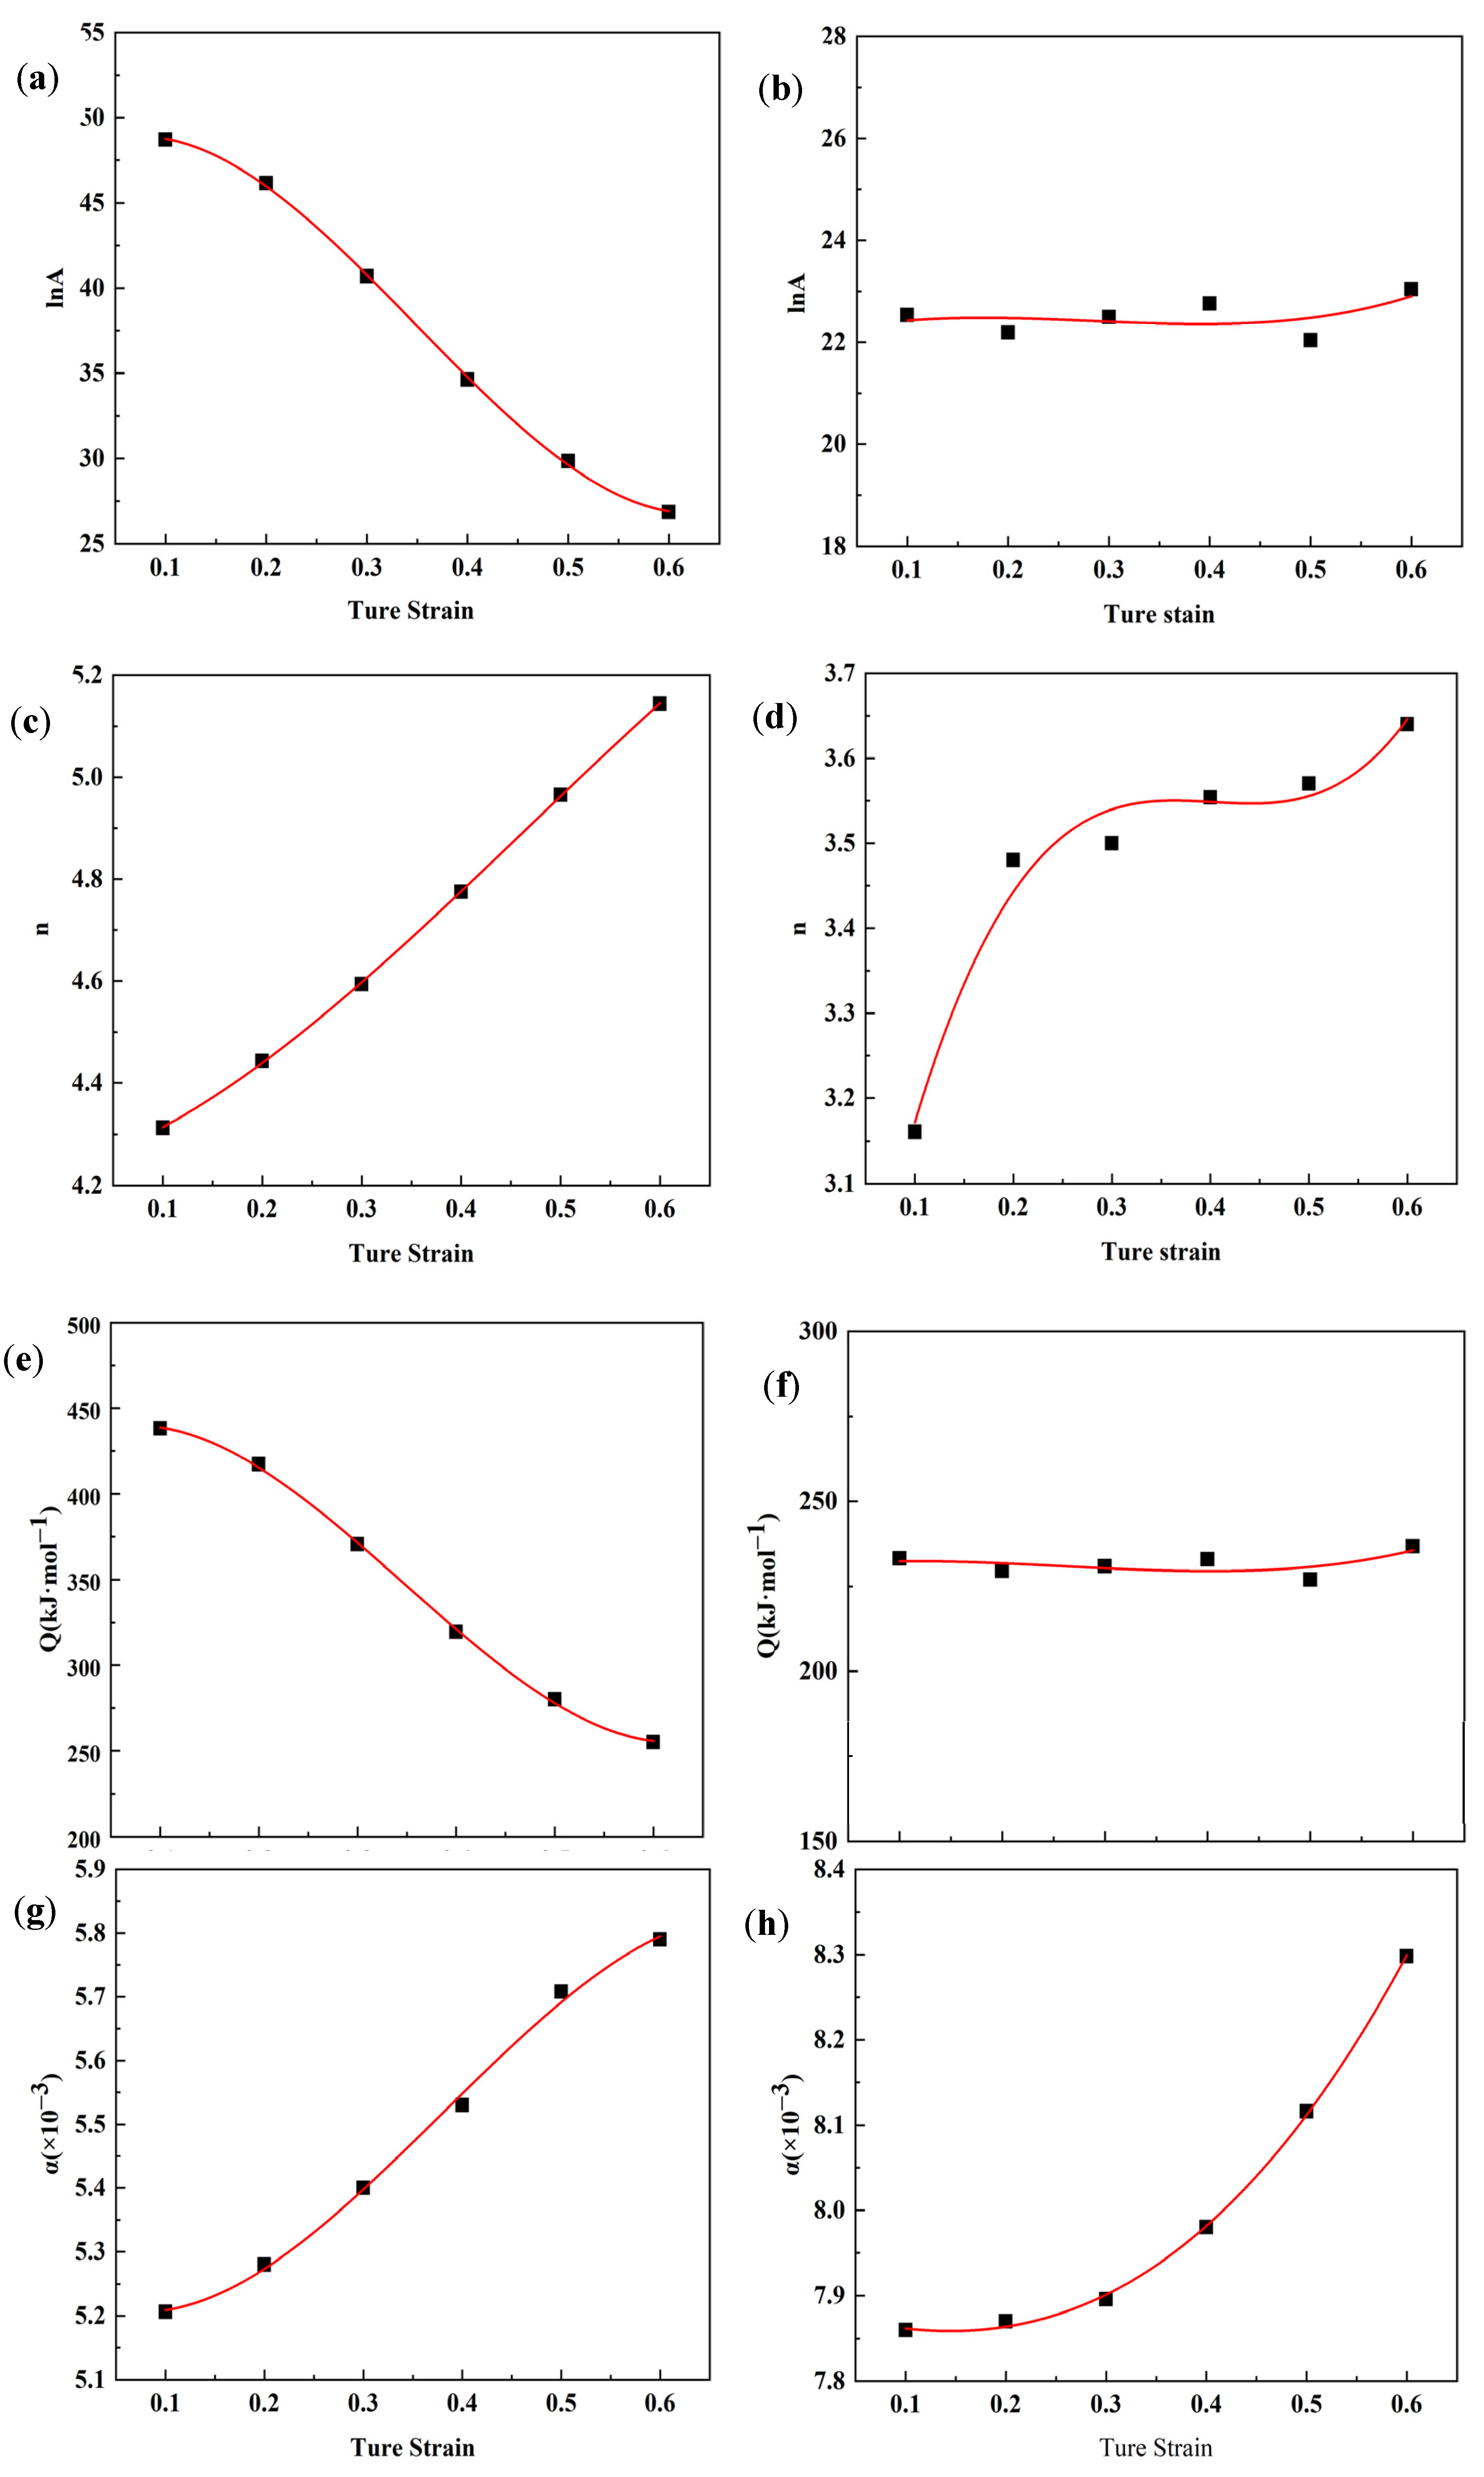
The method for establishing the constitutive equations under the peak strain described in Section 3.2.1 can be used to obtain the constitutive equation for other strains of 0.1–0.6. The relationship between model parameters and true strain was built to accurately predict the flow stress in the strain range of 0.1–0.6, as shown in Figure 8. According to Figure 8e,f, the values of deformation activation energy, Q, under different deformed conditions are shown in Table 4. The values of Q under all strains are always larger than the value of self-diffusion activation energy in both dual-phase and single-phase fields.
The constitutive equations at strains from 0.1 to 0.6 can be obtained by replacing the parameters in Equation (7) with the above A, n, Q, and α. Then the predicted stress values can be calculated and compared with experimental data, as shown in Figure 9. According to Figure 9, the constitutive equations can well predict the flow stress of Ti-3Al-6Cr-5V-5Mo alloy under the TMP conditions.
In order to further verify the accuracy of the constitutive equations at the dual-phase field and single-phase field, respectively, a correlated coefficient (R) and a mean relative error (E) are introduced to evaluate the accuracy quantitatively. The R and E can be calculated as Equations (8) and (9), respectively [34].
where is
the actual stress value obtained by experiment, is the average
value of , is the predicted
stress value of constitutive model, is
the average value of , and N
is the number of data used for comparison.
The correlation analysis between the actual stress values and predicted stress values at different phase fields is shown in Figure 10. At the α + β phase field, the correlated coefficient (R) is 0.986, and the mean relative error (E) is 2.7%. At the β phase field, the correlated coefficient (R) is 0.983, and the mean relative error (E) is 4.1%. Other previous research works have also used the Arrhenius model to construct constitutive equations for flow-stress predictions for titanium alloys. The literature reports the constitutive model of a near-β titanium alloy Ti-6Cr-5Mo-5V-4Al at a high temperature above 800 °C. Its correlated coefficient and mean relative error are 0.982 and 6.23%, respectively [35]. An Arrhenius constitutive equation of TA32 titanium alloy has been established, in which the correlated coefficient and mean relative error are 0.978 and 7.3%, respectively [36]. In this work, the predictions of the constitutive equation at both the α + β and β phase fields exhibit slightly larger R values and slightly smaller E values compared with those of the abovementioned Arrhenius constitutive equations for other titanium alloys. Thus, it can be further proved that the constitutive equation has good prediction accuracy for the flow stress of Ti-3Al-6Cr-5V-5Mo alloy at both dual-phase and single-phase fields.
3.3. Processing Map
For metals, the required energy during deformation is mainly the power dissipation, which occurs for two reasons: the plastic deformation leads to power dissipation, and the microstructural change leads to power dissipation [37]. The relationship between these parameters is shown in Equation (10) [38]:
where P is the required energy during the materials’ deformation, G is the power dissipation led by plastic deformation, and J is the power dissipation led by microstructural change.
For a certain strain and deformation temperature, the partial differential between J and G can be obtained by the strain-rate sensitivity index, m, as shown in Equation (11) [39]. The power dissipation map and the rheological instability map are two parts of the processing map. When the materials are in ideal dissipation, the annihilation and formation of dislocations are balanced. In this case, the value of the strain-rate sensitivity index (m) can be regarded as 1. Then Jmax = σ/2. A power-dissipation coefficient, η, generated by standardization with the ideal linear dissipation factor, is shown in Equation (12).
The inequality between power dissipation and strain rate proposed by Prasad et al. [40] can be used to find the instability regions in the process of deformation. To obtain the instability conditions of TMP for the Ti-3Al-6Cr-5V-5Mo alloy, an expression including the strain rate sensitivity index and the dimensionless parameter, ξ(), is expressed as Equation (13). According to Equation (13), when the value of ξ() is less than zero, flow instability would occur during deformation in these regions. Such regions should be avoided during the thermomechanical processing of the alloy.
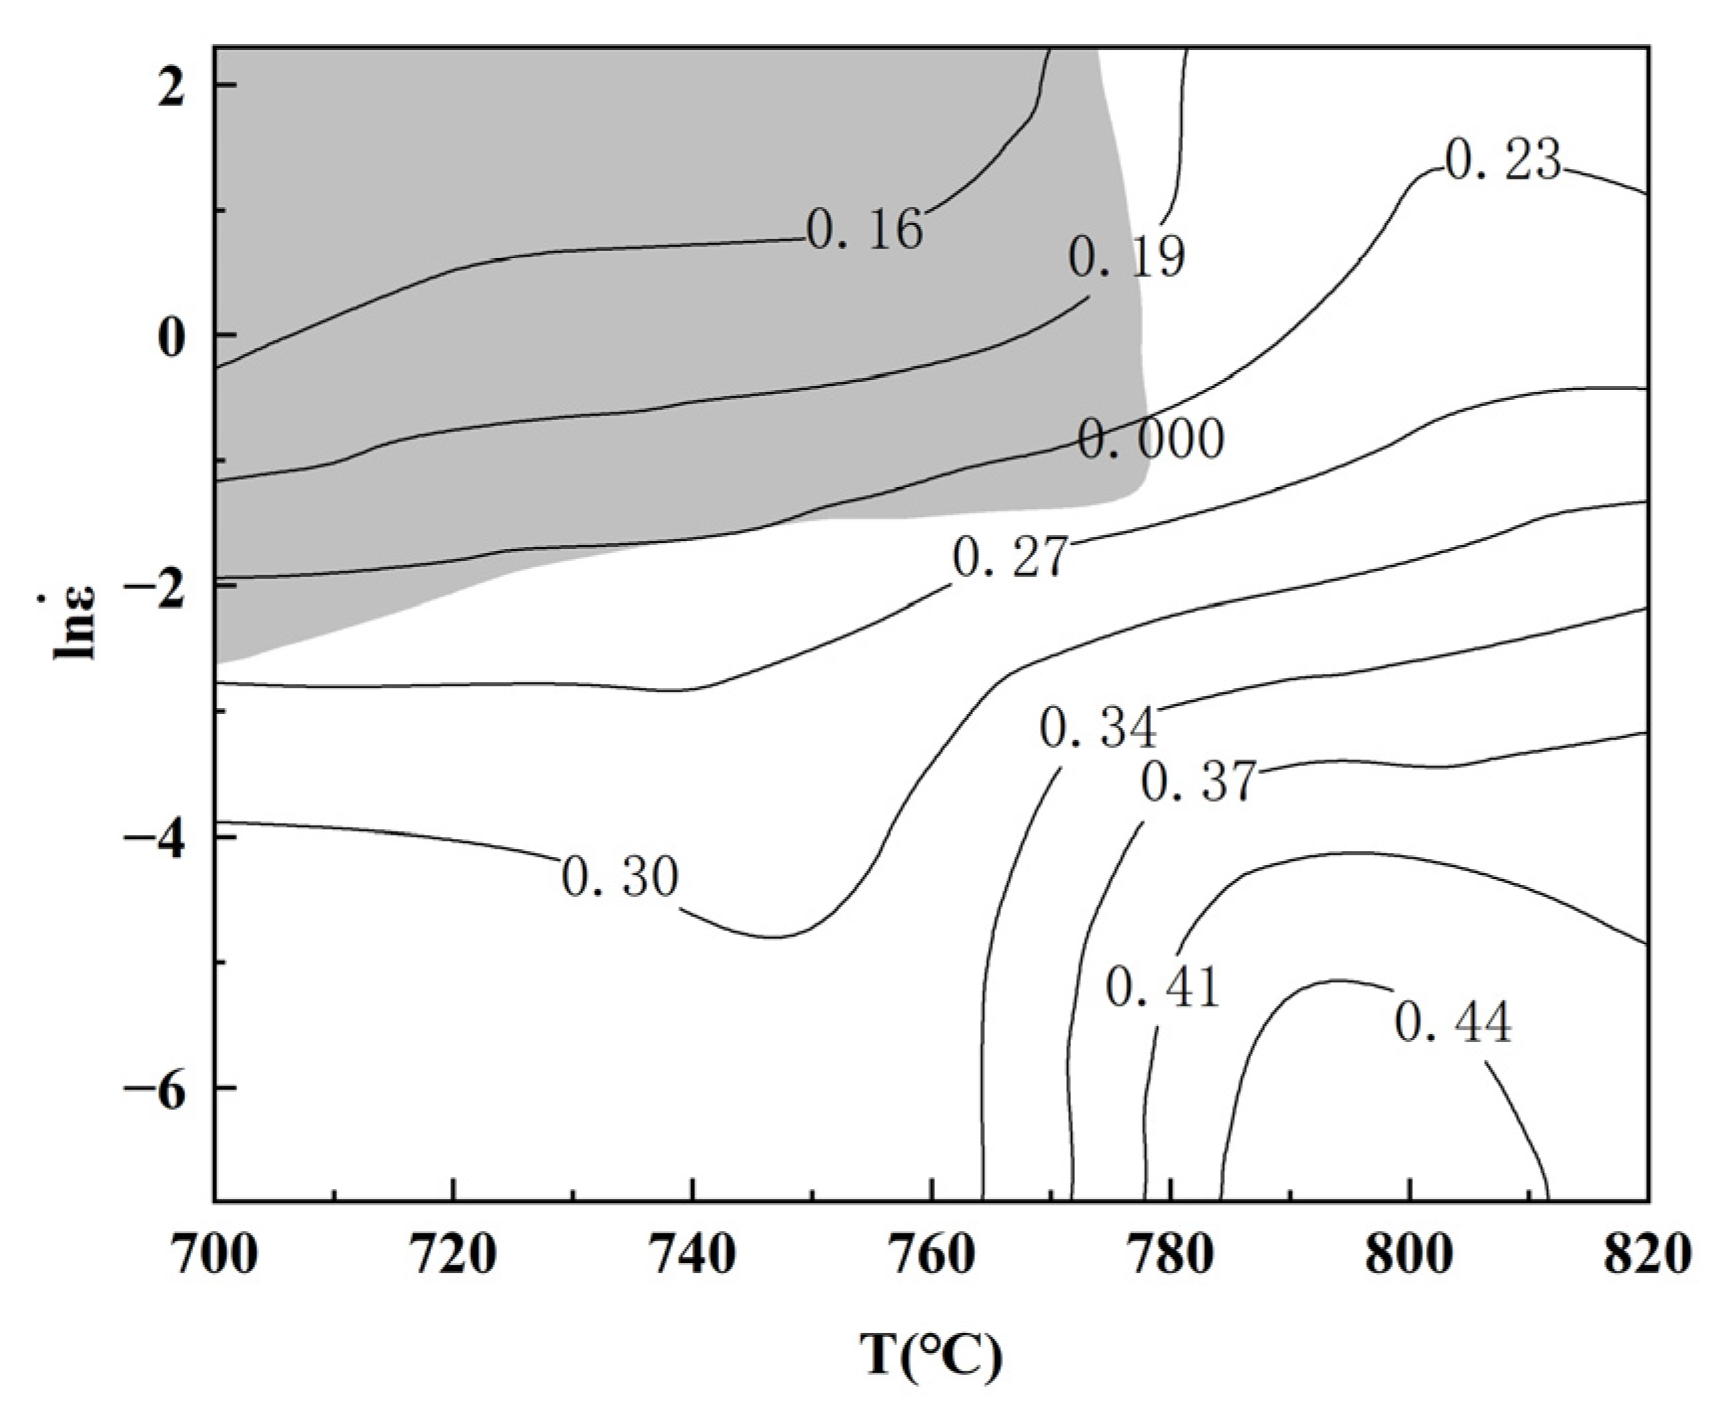
By superimposing the power dissipation map and rheological instability map, a processing map can be drawn. For the alloy at a strain of 0.6, the processing map is shown in Figure 11. At α + β phase field, the power-dissipation coefficient, η, enlarges from 0.16 to 0.41 with the increase of the deformation temperature. At the β phase field, η shows the same trend and increases to 0.44. Generally, a high value of η may indicate a region suitable for deformation because of the large power dissipation [23]. For the thermomechanical processing that occurred at the α + β phase field, the range of temperature from 780 °C to 790 °C and range of strain rate from 0.001 s−1 to 0.016 s−1 lead to a high η value. A similar region for thermomechanical processing occurred at the β phase field and had a range of temperature from 790 °C to 800 °C and a range of strain rate from 0.001 s−1 to 0.007 s−1. Compared with the two regions with a high power-dissipation-coefficient value, the η value of the β phase field is higher than that of the α + β phase field. This phenomenon indicates that the region with high power-dissipation-coefficient value of the β phase field may be more suitable for TMP. In addition, an instability region in the range of temperature from 700 °C to 780 °C, as well as the range of strain rate from 0.08 s−1 to 10 s−1, could be found. Under such TMP conditions, it may not be suitable for the high-temperature processing of the alloy.
3.4. Microstructural Verification of TMP Region
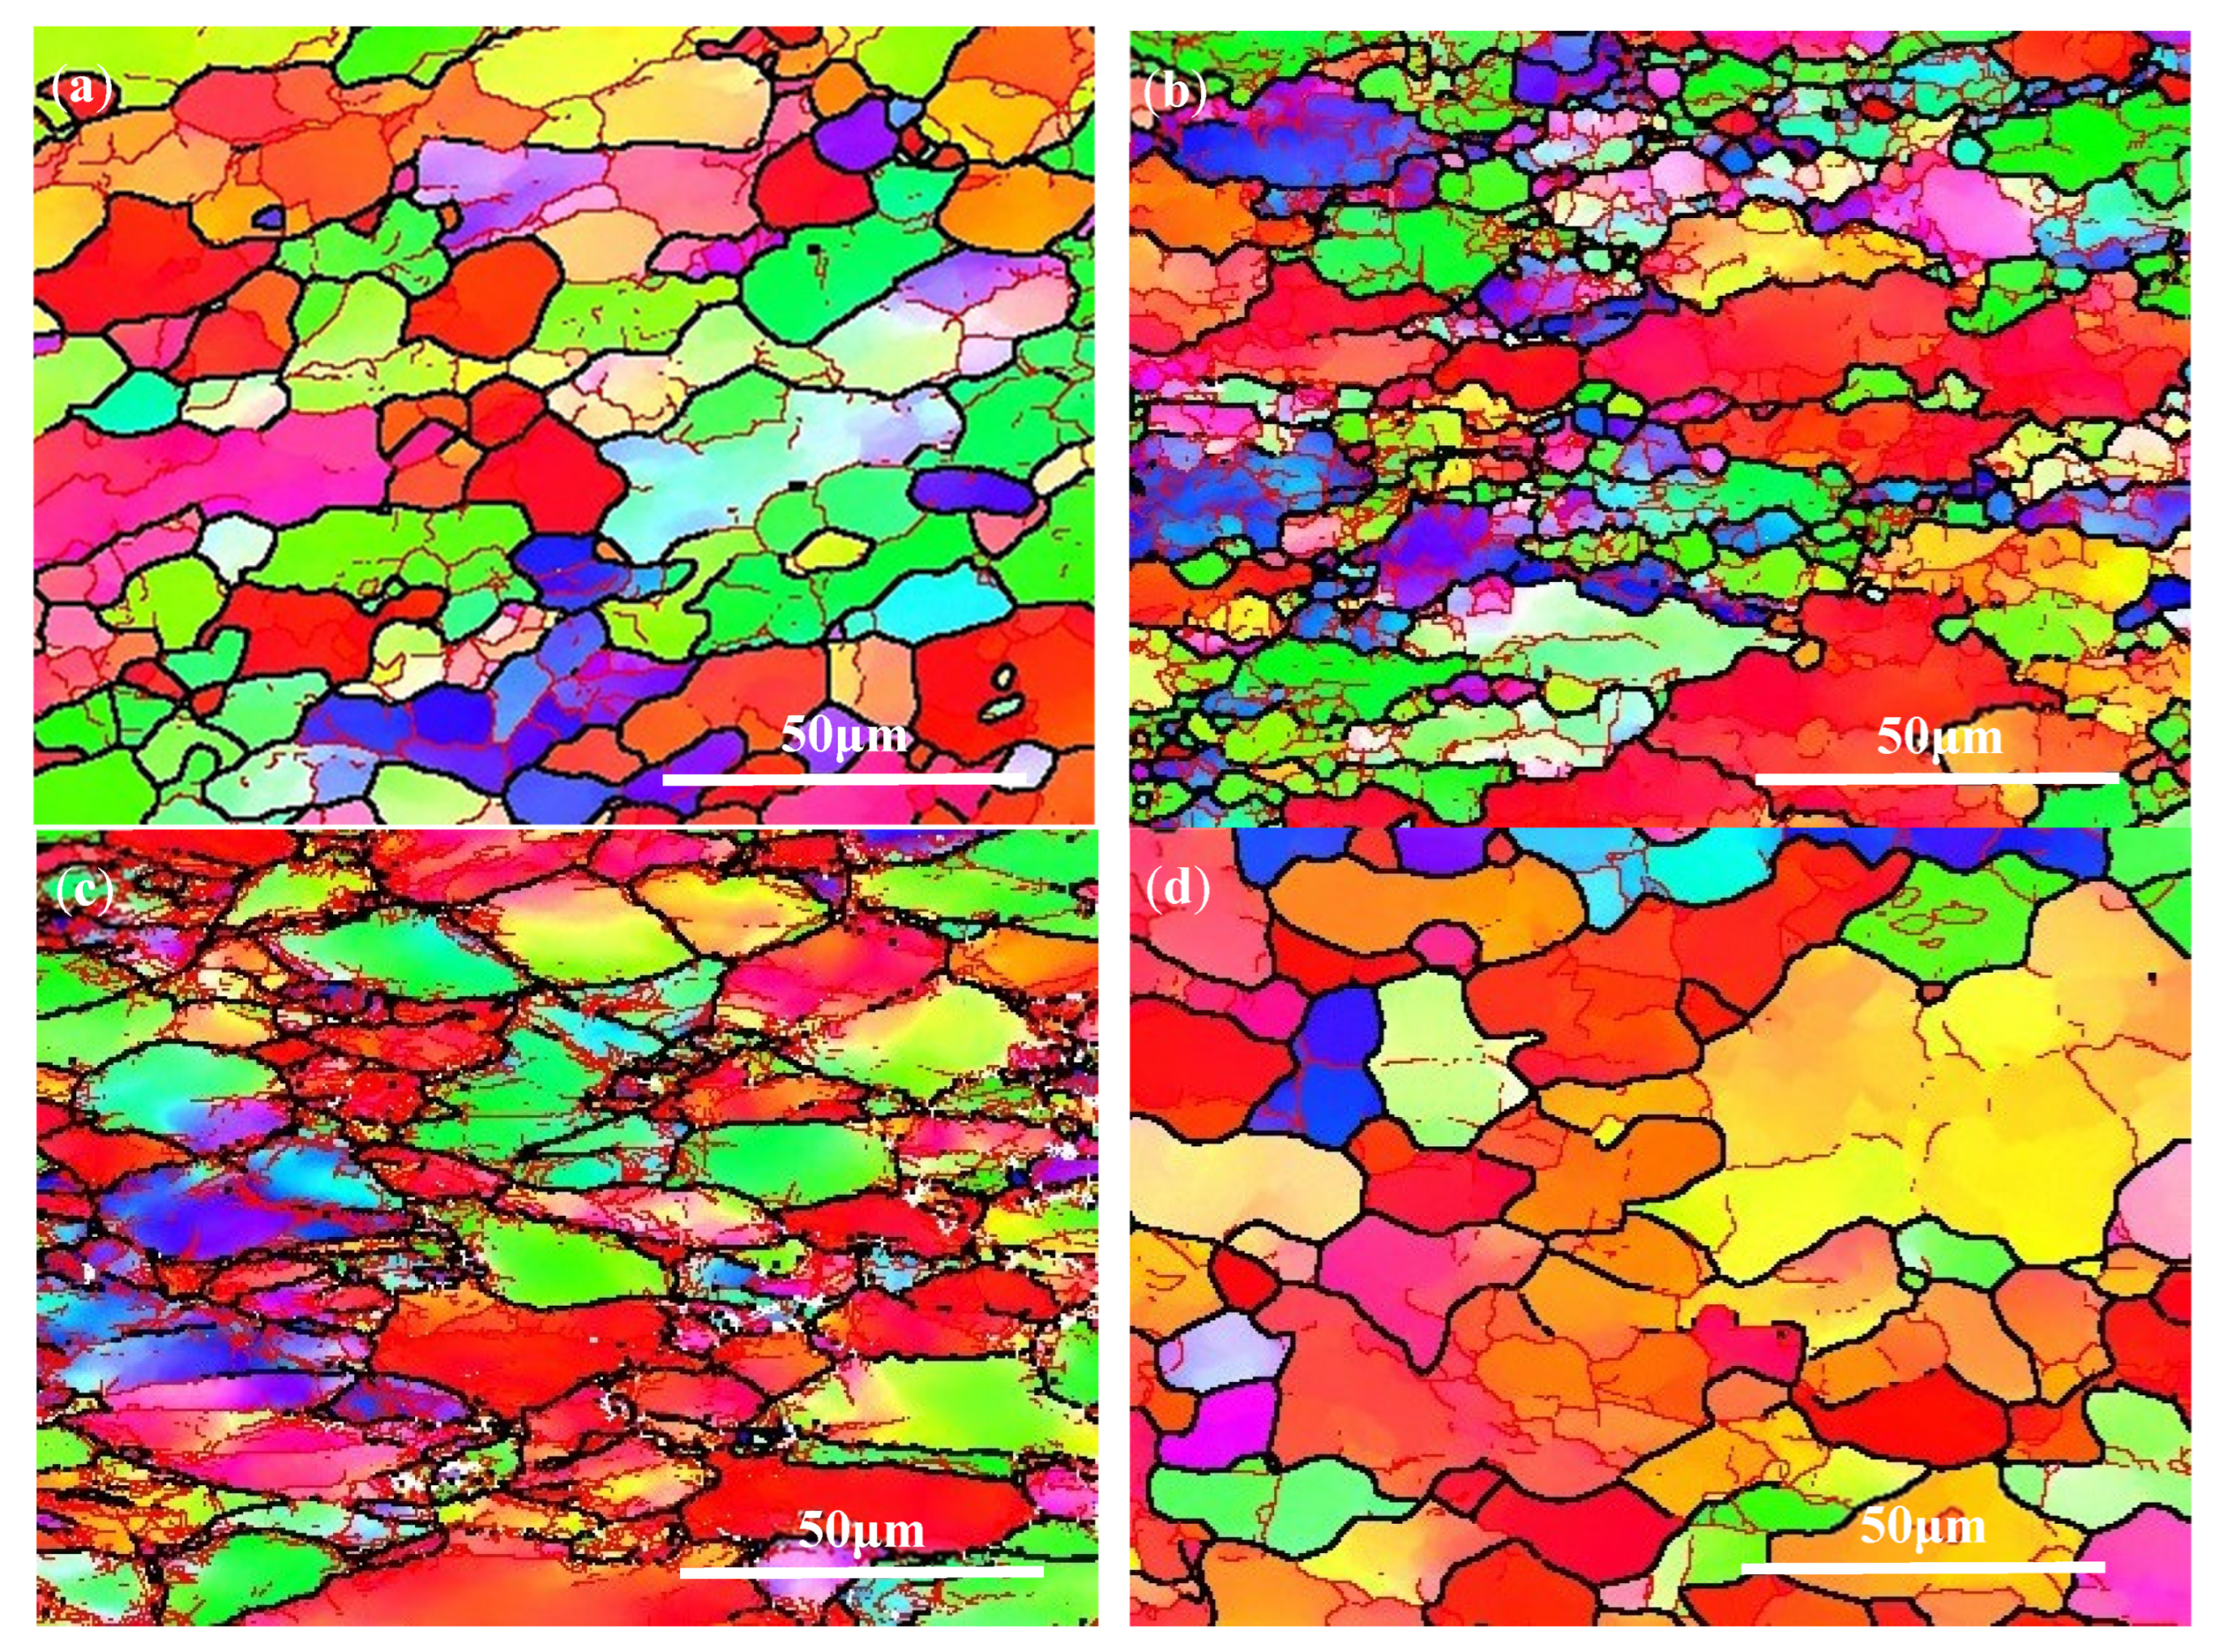
An EBSD analysis was performed to further investigate the deformed grains of the alloy at the dual-phase field and single-phase field. Figure 12 shows the EBSD images of the deformed grains at the α + β phase field, as well as strain rates of 0.01 s−1. According to Figure 12, a small number of DRX grains formed after deformation occurred at the α + β phase field. However, the number of DRX grains did not change significantly with the increasing deformation temperature. Figure 13 shows the EBSD images of the deformed grains at the β phase field. When deformation occurs at the β phase field, the grains exhibit completely different characteristics.
The average size of the deformed grains shown in Figure 12 and Figure 13 was measured, as shown in Table 5. According to Table 5, the average grain size of the alloys deformed at the α + β phase field is larger than that of the alloys deformed at the β phase field. The deformed grains at the β phase field refine significantly due to DRX, compared with that of deformed grains at the α + β phase field. Deformation temperature is one of the most important factors affecting DRX [41]. The stored deformation energy increases with the increase of deformation temperature, resulting in a larger driving force for DRX [42]. It seems that the deformation at the β phase field can provide more sufficient conditions for DRX in the Ti-3Al-6Cr-5V-5Mo alloy.
When the deformation occurs at the β phase field, the average grain size increases with the increasing temperature. The boundaries of grain and subgrain are easy to migrate at higher temperatures [9]. While the temperature is higher than β-transus, the grains of near-β titanium alloys are prone to coarsening. A similar phenomenon has been reported in several works of literature [43,44]. Therefore, it can be measured from the microstructure that the average grain size of 790 °C is smaller than that of 820 °C. When the alloy is deformed under the slowest strain rate of 0.001 s−1 at 790 °C, the most homogeneous grains with the smallest average size of 17 μm are obtained. It is well-known that time is another main factor for recrystallization [45]. During the deformation that occurs under a lower strain rate, there is more time for dislocation rearrangement, as well as the nucleation and growth of DRX grains. The DRX integral decreases with the increasing strain rate due to the shortening of the time for grain-boundary migration. Thus, the uniform and fine grains are formed at 790 °C/0.001 s−1.
The abovementioned microstructure characteristics are consistent with the high η value in the region predicted by the processing map. The reliability of the processing map for the Ti-3Al-6Cr-5V-5Mo alloy is proved.
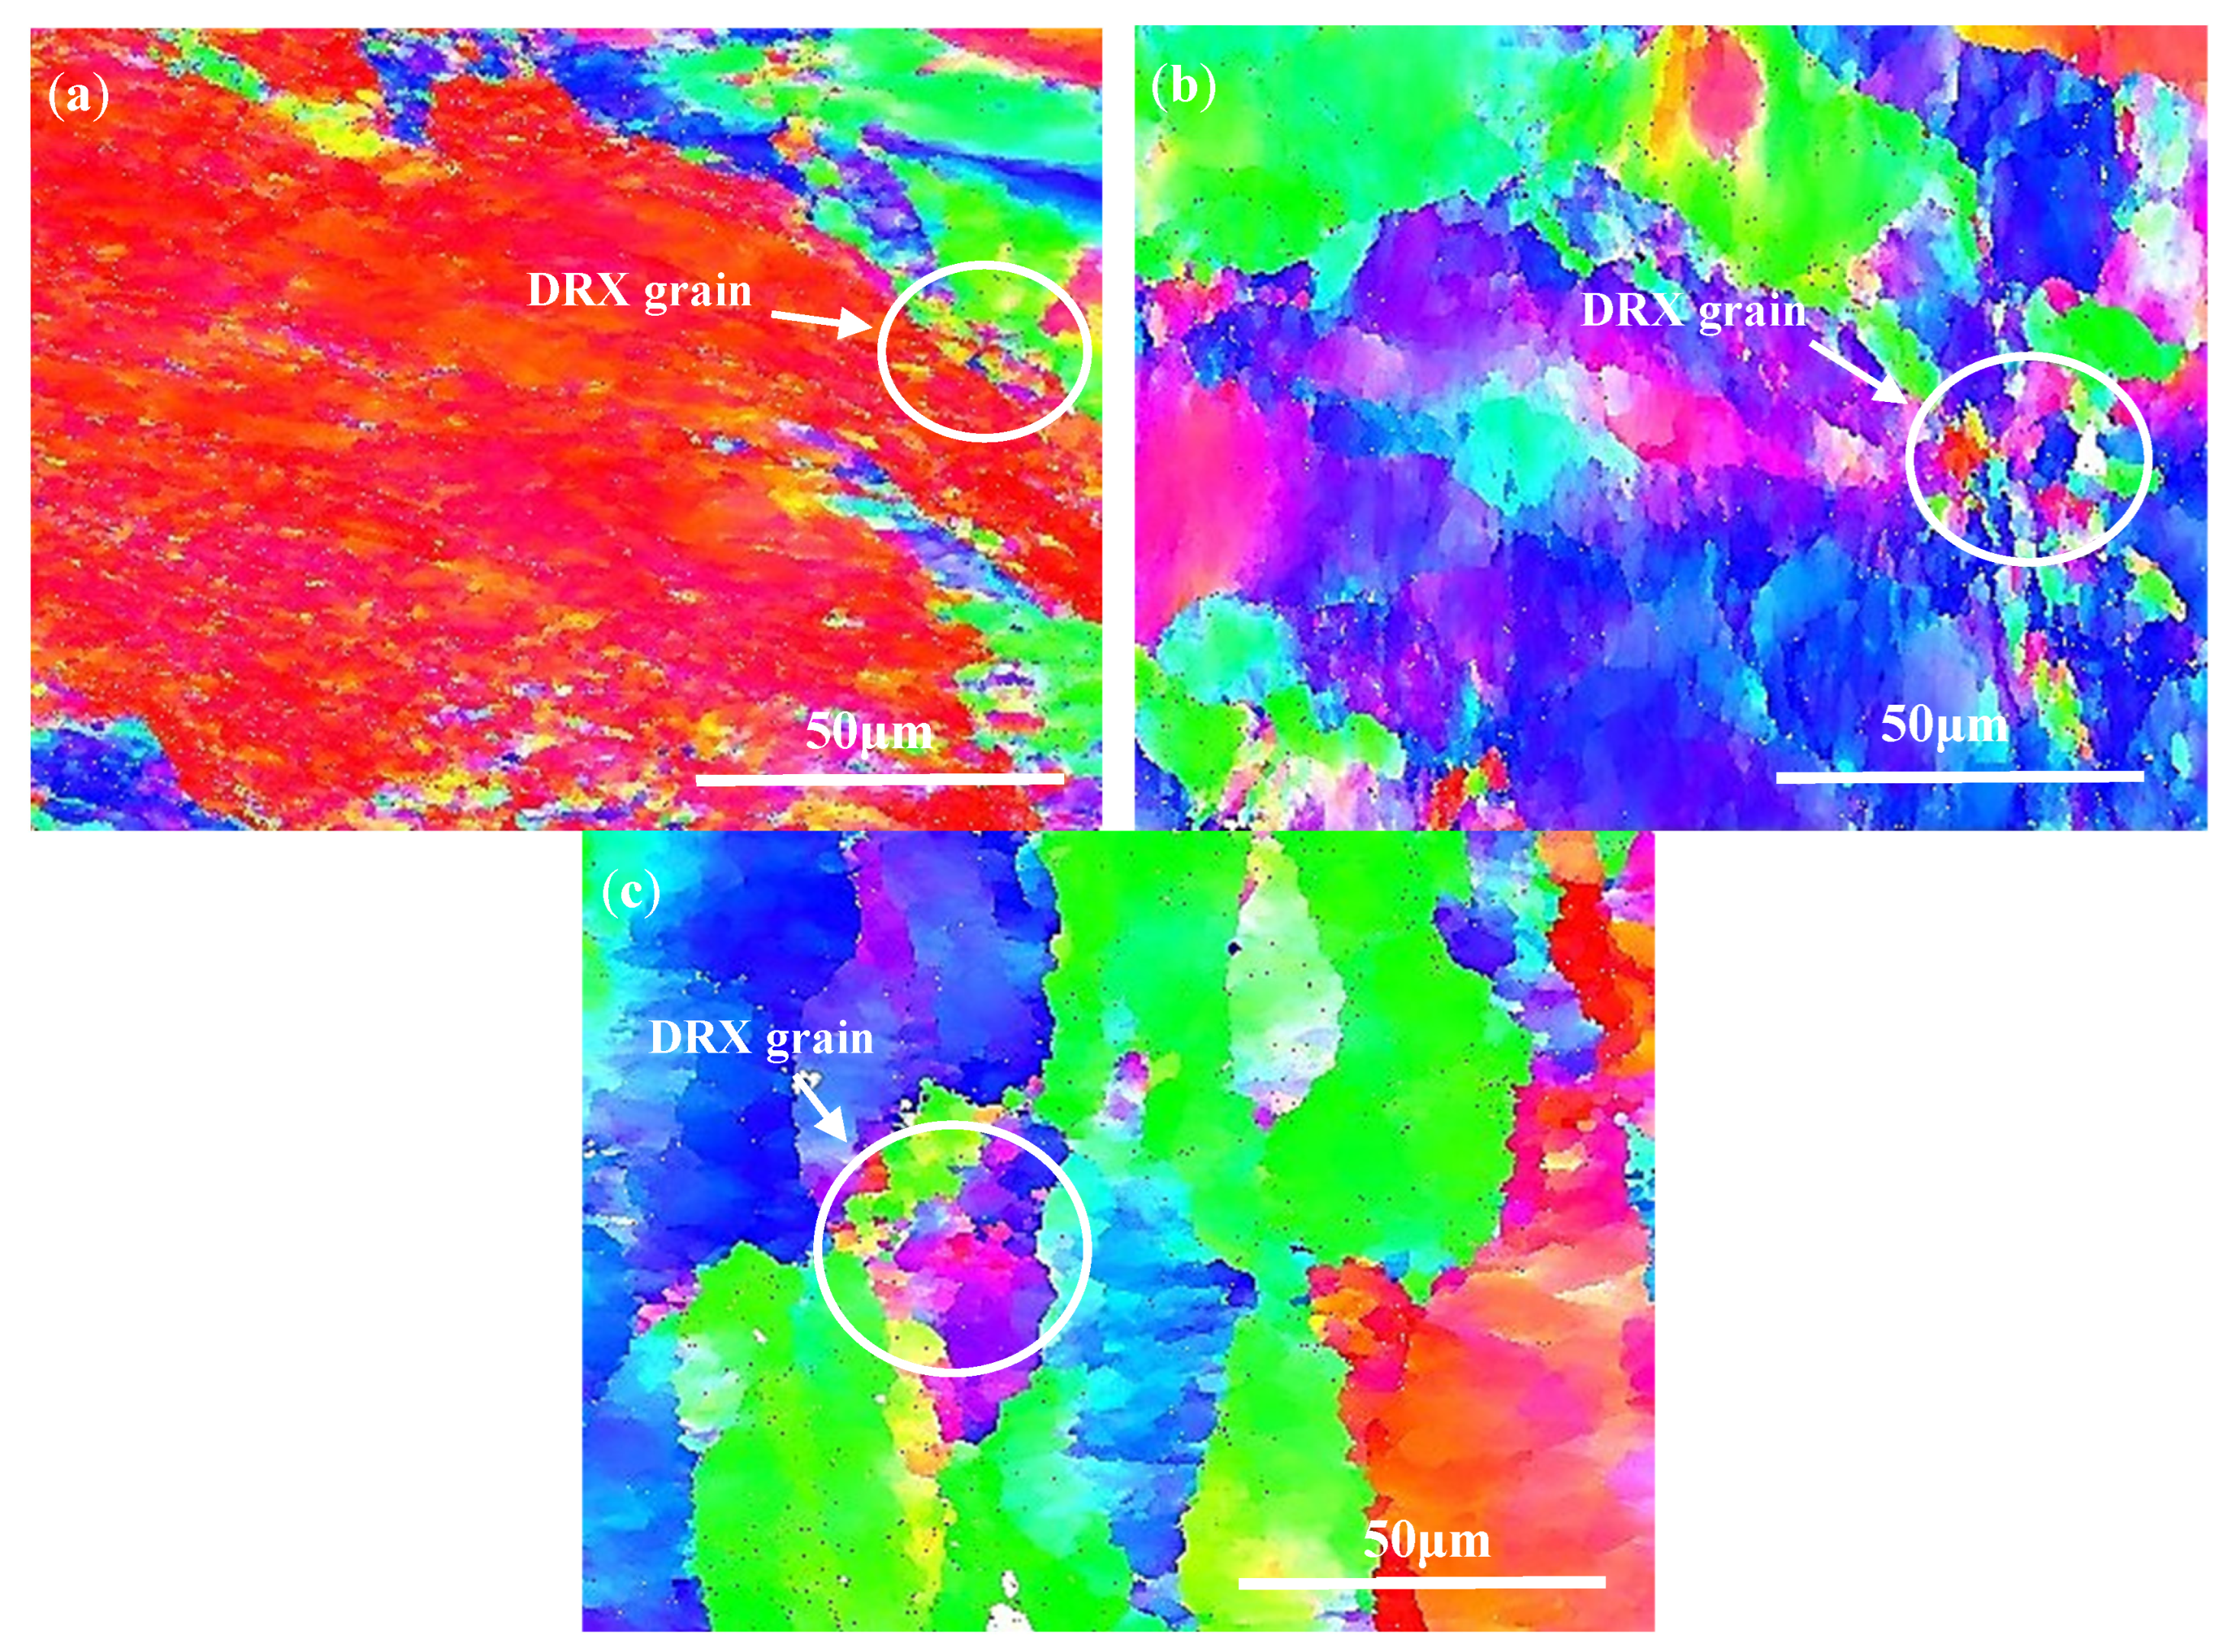
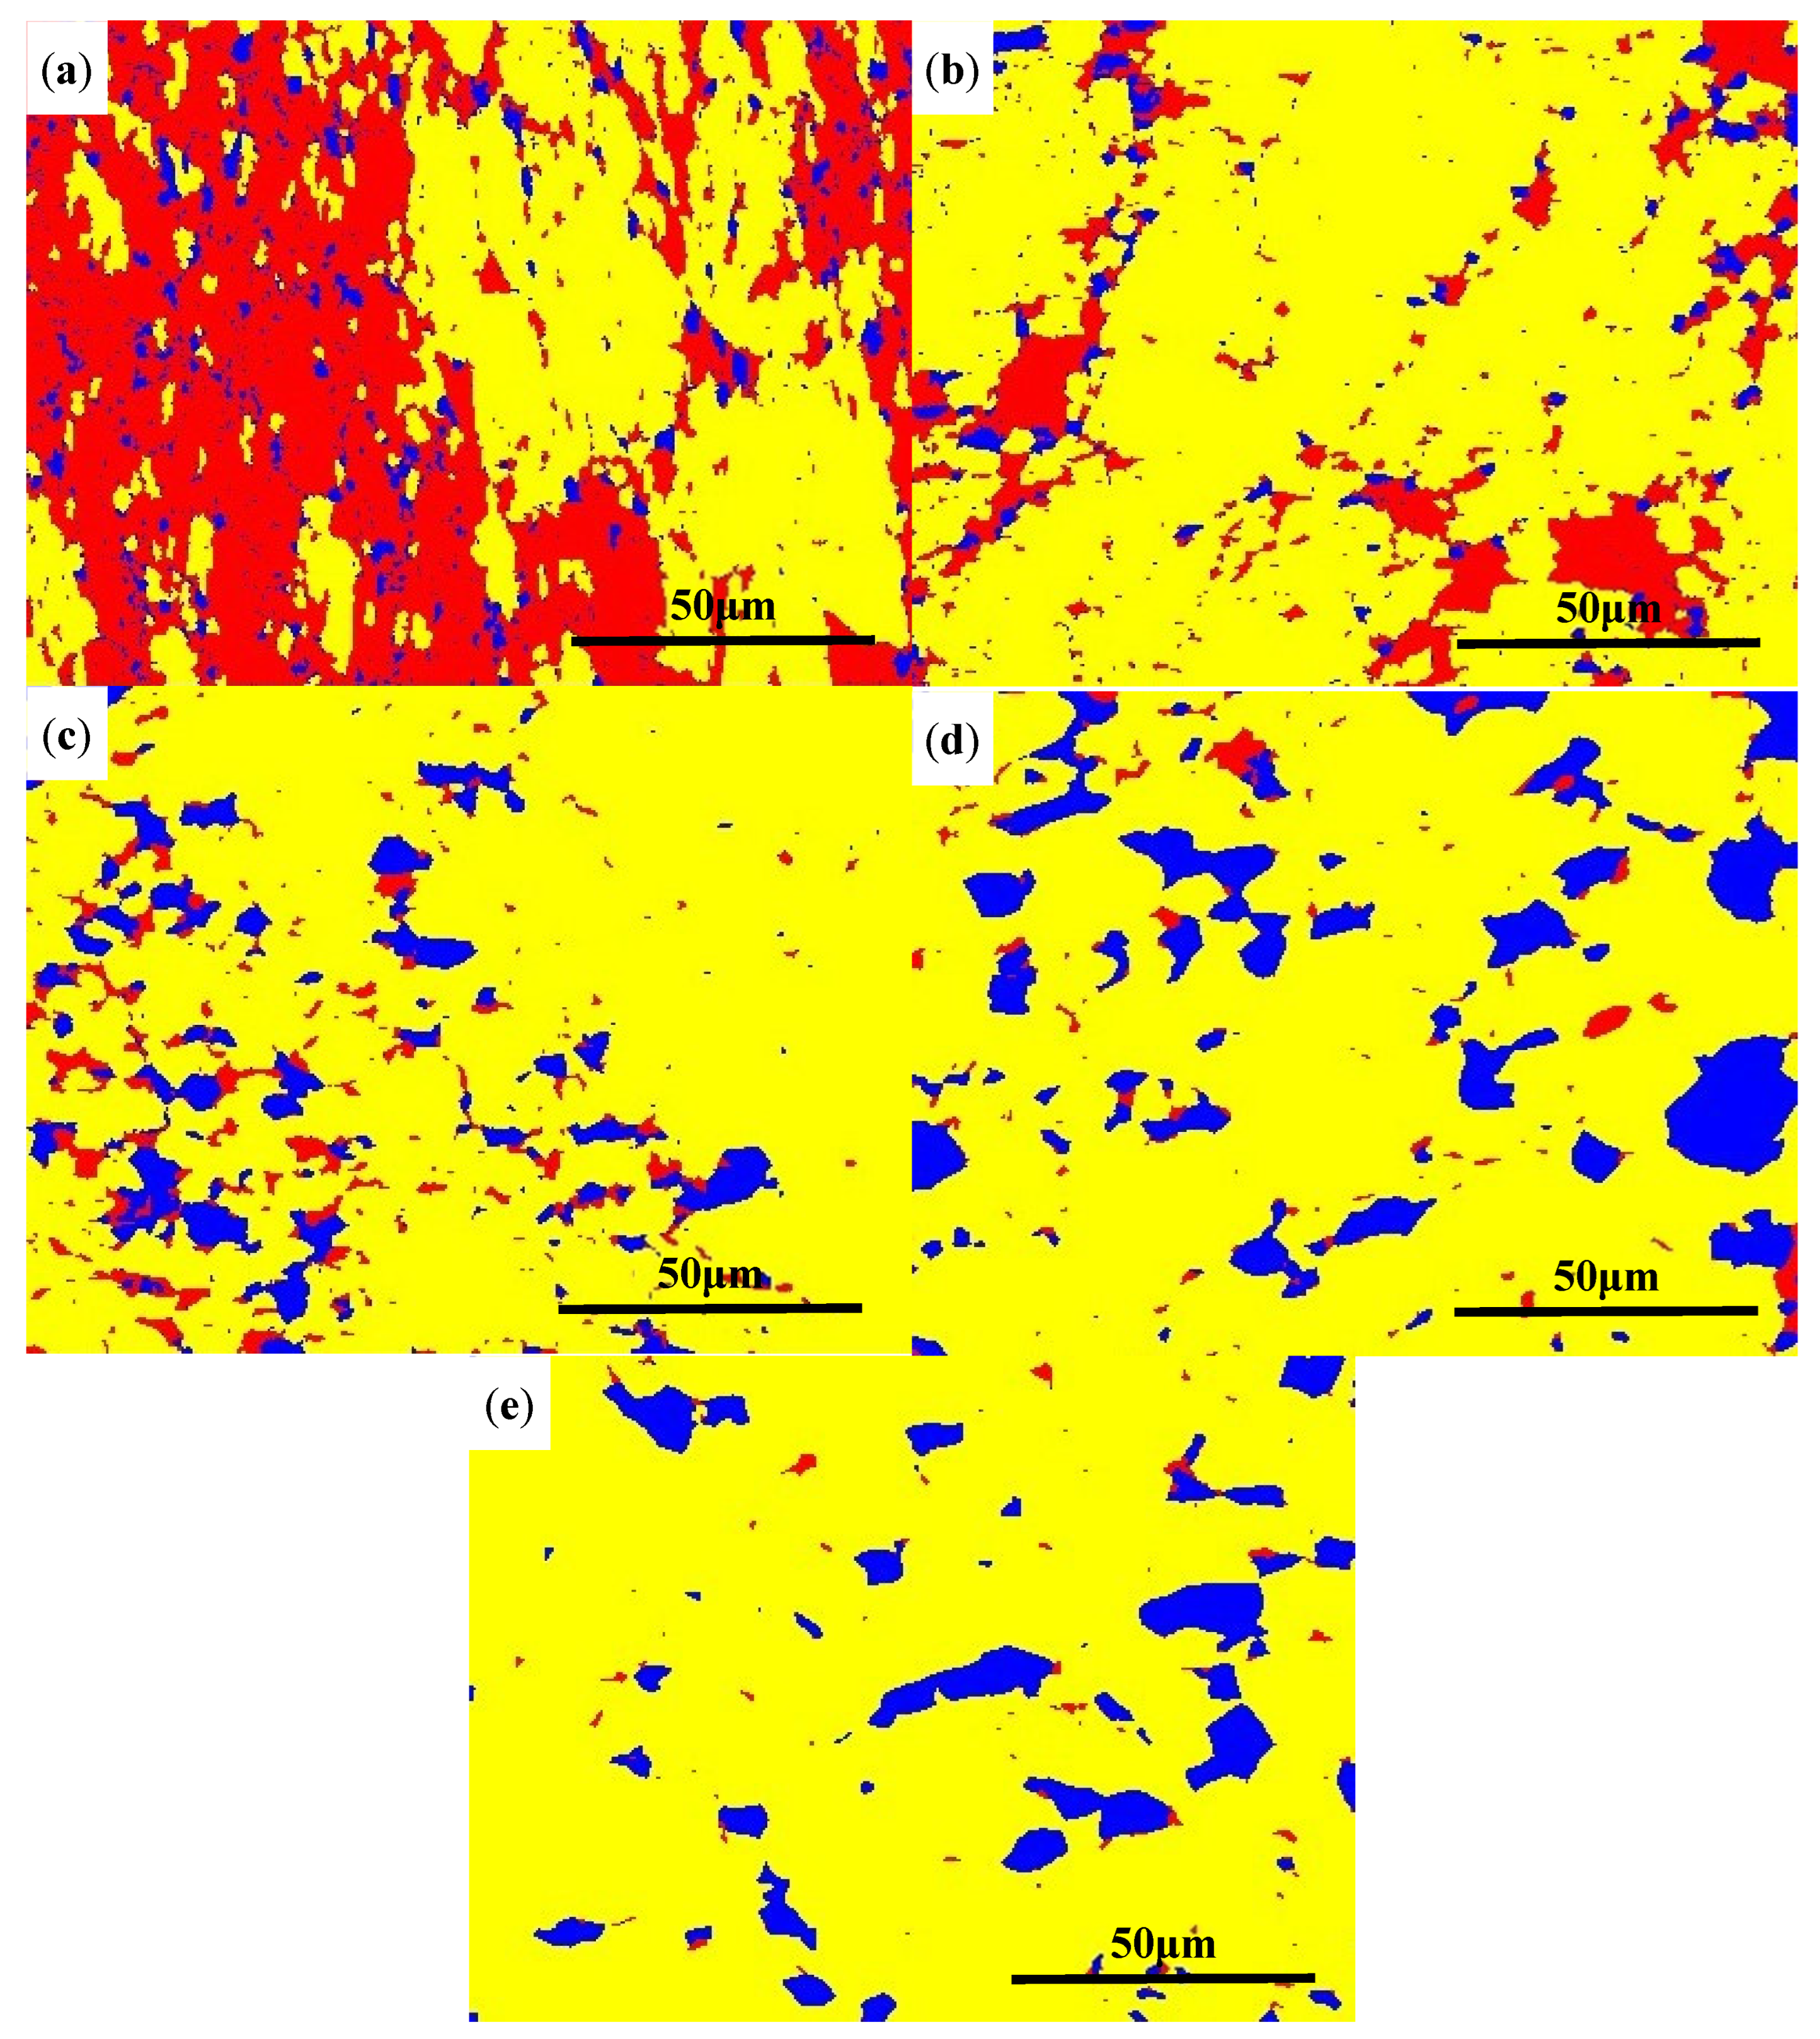
To further investigate the deformed grains under the 0.001 s−1 strain rate, an EBSD analysis for DRX was performed and is shown in Figure 14. The different marked colors indicate the different microstructure of the tested alloy; that is, the DRX grains, sub-grains, and primary grains are marked by blue, yellow, and red colors, respectively. For the temperature at the α + β phase field, as well as the strain rate of 0.001 s−1, the marked blue area enlarges with the increase of deformation temperature, suggesting that the number of DRX grains increases (Figure 14a–c). The deformation temperature of 790 °C and the strain rate of 0.001 s−1 lead to the maximum amount of dynamic recrystallization (Figure 14d). When the deformation temperature increases at the β phase field, the number of DRX grains decreases (Figure 14d,e). Such a phenomenon is consistent with the changes trend of the power dissipation coefficient η predicted by the processing map. The reliability of the processing map for the Ti-3Al-6Cr-5V-5Mo alloy is further confirmed.
4. Conclusions
To provide guidance for the actual hot working of a near-β titanium alloy with potential application, Ti-3Al-6Cr-5V-5Mo, the constitutive relations, processing map, and deformed microstructure of the alloy were investigated. The conclusions are as follows:
- (1)
- The constitutive models for the high-temperature deformation that occurred at the dual-phase field and single-phase field of the Ti-3Al-6Cr-5V-5Mo alloy are established, respectively.
For the α + β phase field, we have the following:
For β phase field, we have the following:
- (2)
- For the constitutive models established for the α + β phase field and β phase field, the correlated coefficients between actual stress and predicted stress are 0.986 and 0.983, and the mean relative errors of prediction are 2.7% and 4.1%, respectively. The accuracy of the model is slightly higher than some Arrhenius’s constitutive equations for other titanium alloys. The constitutive equation has good prediction accuracy for the flow stress of Ti-3Al-6Cr-5V-5Mo alloy at both dual-phase and single-phase fields.
- (3)
- An instability region at the range of temperature from 700 °C to 780 °C and the range of strain rates from 0.08 s−1 to 10 s−1 should be averted during thermomechanical processing. It is suggested that the alloy should be processed at a range of temperature from 790 °C to 800 °C and a range of strain rate from 0.001 s−1 to 0.007 s−1.
- (4)
- When the strain rate is 0.001 s−1, the number of DRX grains increases with the increase of temperature during deformation occurring at α + β phase field. The most homogeneous grains with the minimum average grain size of 17 μm and maximum amount of DRX were obtained during deformation, which occurred at 790 °C/0.001 s−1. It is consistent with the power-dissipation-coefficient region predicted by the processing map.
Author Contributions
Conceptualization, H.Z.; methodology, S.Z. (Shuo Zhang) and X.L.; validation, S.Z. (Shuai Zhang) and X.W.; investigation, H.Z., S.Z. (Siqian Zhang) and G.Z.; writing—original draft preparation, H.Z. All authors have read and agreed to the published version of the manuscript.
Funding
This research was funded by the “National Natural Science Foundation of China, grant number 52104379”.
Data Availability Statement
Not applicable.
Conflicts of Interest
The authors declare no conflict of interest.
References
- Wang, Y.; Hao, M.; Li, D.; Li, P.; Liang, Q.; Wang, D.; Zheng, Y.; Sun, Q.; Wang, Y. Enhanced mechanical properties of Ti-5Al-5Mo-5V-3Cr-1Zr by bimodal lamellar precipitate microstructures via two-step aging. Mater. Sci. Eng. A 2021, 829, 142117. [Google Scholar] [CrossRef]
- Zhang, H.; Wang, C.; Zhou, G.; Zhang, S.; Chen, L. Dependence of strength and ductility on secondary α phase in a novel metastable-β titanium alloy. J. Mater. Res. Technol. 2022, 18, 5257–5266. [Google Scholar] [CrossRef]
- Sadeghpour, S.; Abbasi, S.; Morakabati, M.; Kisko, A.; Karjalainen, L.; Porter, D. A new multi-element beta titanium alloy with a high yield strength exhibiting transformation and twinning induced plasticity effects. Scr. Mater. 2018, 145, 104–108. [Google Scholar] [CrossRef]
- Zhang, S.H.; Deng, L.; Che, L.Z. An integrated model of rolling force for extra-thick plate by combining theoretical model and neural network model. J. Manuf. Process. 2022, 75, 100–109. [Google Scholar] [CrossRef]
- Damodaran, D.; Shivpuri, R. Prediction and control of part distortion during the hot extrusion of titanium alloys. J. Mater. Process. Technol. 2004, 150, 70–75. [Google Scholar] [CrossRef]
- Cai, J.; Guo, M.; Peng, P.; Han, P.; Yang, X.; Ding, B.; Qiao, K.; Wang, K.; Wang, W. Research on Hot Deformation Behavior of As-Forged TC17 Titanium Alloy. J. Mater. Eng. Perform. 2021, 30, 7259–7274. [Google Scholar] [CrossRef]
- Meng, L.; Kitashima, T.; Tsuchiyama, T.; Watanabe, M. Effect of α precipitation on β texture evolution during β-processed forging in a near-β titanium alloy. Mater. Sci. Eng. A 2019, 771, 138640. [Google Scholar] [CrossRef]
- Luo, S.; Yao, J.; Zou, G.; Li, J.; Jiang, J.; Yu, F. Influence of forging velocity on temperature and phase transformation characteristics of forged Ti-6Al-4V aeroengine drum. Int. J. Adv. Manuf. Technol. 2020, 110, 3101–3111. [Google Scholar] [CrossRef]
- Zhang, W.; Yang, Q.; Tan, Y.; Ma, M.; Xiang, S.; Zhao, F. Simulation and Experimental Study of Dynamical Recrystallization Kinetics of TB8 Titanium Alloys. Materials 2020, 13, 4429. [Google Scholar] [CrossRef]
- Li, C.; Huang, C.; Ding, Z.; Zhou, X. Research on High-Temperature Compressive Properties of Ti–10V–1Fe–3Al Alloy. Metals 2022, 12, 526. [Google Scholar] [CrossRef]
- Park, C.W.; Choi, M.S.; Lee, H.; Yoon, J.; Javadinejad, H.R.; Kim, J.H. High-temperature deformation behavior and microstructural evolution of as-cast and hot rolled β21S alloy during hot deformation. J. Mater. Res. Technol. 2020, 9, 13555–13569. [Google Scholar] [CrossRef]
- Zhang, J.; Xu, X.; Xue, J.; Liu, S.; Deng, Q.; Li, F.; Ding, J.; Wang, H.; Chang, H. Hot deformation characteristics and mechanism understanding of Ti–6Al–2Sn–4Zr–6Mo titanium alloy. J. Mater. Res. Technol. 2022, 20, 2591–2610. [Google Scholar] [CrossRef]
- Chen, H.; Qin, H.; Qin, F.; Li, B.; Yu, Y.; Li, C. Hot Deformation Behavior and Microstructure Evolution of Ti–6Cr–5Mo–5V–4Al–1Nb Alloy. Crystals 2023, 13, 182. [Google Scholar] [CrossRef]
- Guo, H.; Du, Z.; Wang, X.; Cheng, J.; Liu, F.; Cui, X.; Liu, H. Flowing and dynamic recrystallization behavior of new biomedical metastable β titanium alloy. Mater. Res. Express 2019, 6, 0865d2. [Google Scholar] [CrossRef]
- Wang, Y.; Zhou, D.; Zhou, Y.; Sha, A.; Cheng, H.; Yan, Y. A Constitutive Relation Based on the Johnson–Cook Model for Ti-22Al-23Nb-2(Mo, Zr) Alloy at Elevated Temperature. Crystals 2021, 11, 754. [Google Scholar] [CrossRef]
- Zhao, Q.; Yang, F.; Torrens, R.; Bolzoni, L. Comparison of hot deformation behaviour and microstructural evolution for Ti-5Al-5V-5Mo-3Cr alloys prepared by powder metallurgy and ingot metallurgy approaches. Mater. Des. 2019, 169, 107682. [Google Scholar] [CrossRef]
- Sajadifar, S.V.; Maier, H.J.; Niendorf, T.; Yapici, G.G. Elevated Temperature Mechanical Characteristics and Fracture Behavior of a Novel Beta Titanium Alloy. Crystals 2023, 13, 269. [Google Scholar] [CrossRef]
- Fu, M.; Pan, S.; Liu, H.; Chen, Y. Initial Microstructure Effects on Hot Tensile Deformation and Fracture Mechanisms of Ti-5Al-5Mo-5V-1Cr-1Fe Alloy Using In Situ Observation. Crystals 2022, 12, 934. [Google Scholar] [CrossRef]
- Santosh, S.; Sampath, V.; Mouliswar, R. Hot deformation characteristics of NiTiV shape memory alloy and modeling using constitutive equations and artificial neural networks. J. Alloy. Compd. 2022, 901, 163451. [Google Scholar] [CrossRef]
- Yang, Q.; Ma, M.; Tan, Y.; Xiang, S.; Zhao, F.; Liang, Y. Initial β Grain Size Effect on High-Temperature Flow Behavior of Tb8 Titanium Alloys in Single β Phase Field. Metals 2019, 9, 891. [Google Scholar] [CrossRef] [Green Version]
- Lei, J.; Zhu, W.; Chen, L.; Sun, Q.; Xiao, L.; Sun, J. Deformation behaviour and microstructural evolution during the hot compression of Ti-5Al4Zr8Mo7V alloy. Mater. Today Commun. 2019, 23, 100873. [Google Scholar] [CrossRef]
- Wang, J.; Wang, K.; Lu, S.; Li, X.; OuYang, D.; Qiu, Q. Softening mechanism and process parameters optimization of Ti-4.2Al-0.005B titanium alloy during hot deformation. J. Mater. Res. Technol. 2022, 17, 1842–1851. [Google Scholar] [CrossRef]
- Han, L.; Zhang, H.; Cheng, J.; Zhou, G.; Wang, C.; Chen, L. Thermal Deformation Behavior of Ti-6Mo-5V-3Al-2Fe Alloy. Crystals 2021, 11, 1245. [Google Scholar] [CrossRef]
- Pang, X.; Xiong, Z.; Liu, S.; Sun, J.; Misra, R.; Kokawa, H.; Li, Z. Grain refinement effect of ZrB2 in laser additive manufactured metastable β-titanium alloy with enhanced mechanical properties. Mater. Sci. Eng. A 2022, 857, 144104. [Google Scholar] [CrossRef]
- Gu, B.; Chekhonin, P.; Xin, S.; Liu, G.; Ma, C.; Zhou, L.; Skrotzki, W. Effect of temperature and strain rate on the deformation behavior of Ti5321 during hot-compression. J. Alloy. Compd. 2021, 876, 159938. [Google Scholar] [CrossRef]
- Liu, S.F.; Li, M.Q.; Luo, J.; Yang, Z. Deformation behavior in the isothermal compression of Ti-5Al-5Mo-5V-1Cr-1Fe alloy. Mater. Sci. Eng. A 2014, 589, 15–22. [Google Scholar] [CrossRef]
- Wang, X.; Zhang, Y.; Ma, X. High temperature deformation and dynamic recrystallization behavior of AlCrCuFeNi high entropy alloy. Mater. Sci. Eng. A 2020, 778, 139077. [Google Scholar] [CrossRef]
- Wang, Y.; Shao, W.; Zhen, L.; Yang, L.; Zhang, X. Flow behavior and microstructures of superalloy 718 during high temperature deformation. Mater. Sci. Eng. A 2008, 497, 479–486. [Google Scholar] [CrossRef]
- Yong, Z.; Fukang, W.; Duo, Q.; Yongquan, N.; Min, W. High temperature deformation behavior of Ti-4.5Al-6.5Mo-2Cr-2.6Nb-2Zr-1Sn titanium alloy. Rare Met. Mater. Eng. 2020, 49, 944–949. [Google Scholar]
- Mirzadeh, H.; Cabrera, J.M.; Najafizadeh, A. Constitutive relationships for hot deformation of austenite. Acta Mater. 2011, 59, 6441–6448. [Google Scholar] [CrossRef]
- McQueen, H.; Yue, S.; Ryan, N.; Fry, E. Hot working characteristics of steels in austenitic state. J. Mater. Process. Technol. 1995, 53, 293–310. [Google Scholar] [CrossRef]
- Zener, C.; Hollomon, J.H. Effect of Strain Rate Upon Plastic Flow of Steel. J. Appl. Phys. 1944, 15, 22–32. [Google Scholar] [CrossRef]
- Shi, C.; Mao, W.; Chen, X.-G. Evolution of activation energy during hot deformation of AA7150 aluminum alloy. Mater. Sci. Eng. A 2013, 571, 83–91. [Google Scholar] [CrossRef]
- Wang, Y.; Li, J.; Xin, Y.; Li, C.; Cheng, Y.; Chen, X.; Rashad, M.; Liu, B.; Liu, Y. Effect of Zener–Hollomon parameter on hot deformation behavior of CoCrFeMnNiC0.5 high entropy alloy. Mater. Sci. Eng. A 2019, 768, 138483. [Google Scholar] [CrossRef]
- Li, C.; Huang, L.; Zhao, M.; Guo, S.; Li, J. Hot deformation behavior and mechanism of a new metastable β titanium alloy Ti–6Cr–5Mo–5V–4Al in single phase region. Mater. Sci. Eng. A 2021, 814, 141231. [Google Scholar] [CrossRef]
- Feng, R.; Bao, Y.; Ding, Y.; Chen, M.; Ge, Y.; Xie, L. Three different mathematical models to predict the hot deformation behavior of TA32 titanium alloy. J. Mater. Res. 2022, 37, 1309–1322. [Google Scholar] [CrossRef]
- Zhao, Q.; Yu, L.; Ma, Z.; Li, H.; Wang, Z.; Liu, Y. Hot Deformation Behavior and Microstructure Evolution of 14Cr ODS Steel. Materials 2018, 11, 1044. [Google Scholar] [CrossRef] [Green Version]
- Poliak, E.; Jonas, J. A one-parameter approach to determining the critical conditions for the initiation of dynamic recrystallization. Acta Mater. 1996, 44, 127–136. [Google Scholar] [CrossRef]
- Jin, Z.Y.; Li, N.N.; Yan, K.; Wang, J.; Bai, J.; Dong, H.B. Deformation mechanism and hot workability of extruded magnesium alloy AZ31. Acta Metall. Sin. (Engl. Lett.) 2018, 31, 71–81. [Google Scholar] [CrossRef] [Green Version]
- Balasubrahmanyam, V.; Prasad, Y. Deformation behaviour of beta titanium alloy Ti–10V–4.5Fe–1.5Al in hot upset forging. Mater. Sci. Eng. A 2002, 336, 150–158. [Google Scholar] [CrossRef]
- Shi, X.H.; Cao, Z.H.; Fan, Z.Y.; Li, L.; Guo, R.P.; Qiao, J.W. Isothermal Compression and Concomitant Dynamic Recrystallization Behavior of Ti-6.5Al-3.5Mo-1.5Zr-0.3Si Alloy with Initial Martensitic Microstructure. J. Mater. Eng. Perform. 2020, 29, 3361–3372. [Google Scholar] [CrossRef]
- Chuan, W.; Liang, H. Hot deformation and dynamic recrystallization of a near-beta titanium alloy in the β single phase region. Vacuum 2018, 156, 384–401. [Google Scholar] [CrossRef]
- Shekhar, S.; Sarkar, R.; Kar, S.K.; Bhattacharjee, A. Effect of solution treatment and aging on microstructure and tensile properties of high strength β titanium alloy, Ti–5Al–5V–5Mo–3Cr. Mater. Des. 2014, 66, 596–610. [Google Scholar] [CrossRef]
- Li, C.-L.; Mi, X.-J.; Ye, W.-J.; Hui, S.-X.; Yu, Y.; Wang, W.-Q. Effect of solution temperature on microstructures and tensile properties of high strength Ti–6Cr–5Mo–5V–4Al alloy. Mater. Sci. Eng. A 2013, 578, 103–109. [Google Scholar] [CrossRef]
- Fan, X.; Yang, H.; Gao, P.; Zuo, R.; Lei, P. The role of dynamic and post dynamic recrystallization on microstructure refinement in primary working of a coarse grained two-phase titanium alloy. J. Mater. Process. Technol. 2016, 234, 290–299. [Google Scholar] [CrossRef]
Figure 1.
True-stress–true-strain curves during the deformation at different phase fields: (a) 700 °C (α + β), (b) 730 °C (α + β), (c) 760 °C (α + β), (d) 790 °C (β), and (e) 820 °C (β).
Figure 1.
True-stress–true-strain curves during the deformation at different phase fields: (a) 700 °C (α + β), (b) 730 °C (α + β), (c) 760 °C (α + β), (d) 790 °C (β), and (e) 820 °C (β).

Figure 2.
Peak stress adopted to establish constitutive equations.

Figure 3.
Curves of ln − σ at different phase fields: (a) α + β and (b) β.

Figure 4.
Curves of ln− lnσ at different phase fields: (a) α + β and (b) β.

Figure 5.
Curves of ln[sinh(ασ)] − 1/T at different phase fields: (a) α + β and (b) β.

Figure 6.
Curves of ln − ln[sinh(ασ)] at different phase fields: (a) α + β and (b) β.

Figure 7.
Curves of ln[sinh(ασ)] − lnZ at different phase fields: (a) α + β and (b) β.

Figure 8.
Relationship between model parameters and true strain: (a) lnA at α + β phase field, (b) lnA at β phase field, (c) n at α + β phase field, (d) n at β phase field, (e) Q at α + β phase field, (f) Q at β phase field, (g) α at α + β phase field, and (h) α at β phase field.
Figure 8.
Relationship between model parameters and true strain: (a) lnA at α + β phase field, (b) lnA at β phase field, (c) n at α + β phase field, (d) n at β phase field, (e) Q at α + β phase field, (f) Q at β phase field, (g) α at α + β phase field, and (h) α at β phase field.

Figure 9.
Predicted stress values and experimental stress values: (a) α + β phase field, 700 °C; (b) α + β phase field, 730 °C; (c) α + β phase field, 760 °C; (d) β phase field, 790 °C; and (e) β phase field, 820 °C.
Figure 9.
Predicted stress values and experimental stress values: (a) α + β phase field, 700 °C; (b) α + β phase field, 730 °C; (c) α + β phase field, 760 °C; (d) β phase field, 790 °C; and (e) β phase field, 820 °C.

Figure 10.
Correlation analysis between the actual stress values and predicted stress values at different phase fields: (a) α + β and (b) β.
Figure 10.
Correlation analysis between the actual stress values and predicted stress values at different phase fields: (a) α + β and (b) β.

Figure 11.
Processing map for 0.6 strain.

Figure 12.
EBSD images of the deformed grains at α + β phase field, as well as strain rate of 0.01 s−1: (a) 700 °C, (b) 730 °C, and (c) 760 °C.
Figure 12.
EBSD images of the deformed grains at α + β phase field, as well as strain rate of 0.01 s−1: (a) 700 °C, (b) 730 °C, and (c) 760 °C.

Figure 13.
EBSD images of the deformed grains at β phase field: (a) 790 °C/0.001 s−1, (b) 790 °C/0.1 s−1, (c) 790 °C/10 s−1, and (d) 820 °C/0.001 s−1.
Figure 13.
EBSD images of the deformed grains at β phase field: (a) 790 °C/0.001 s−1, (b) 790 °C/0.1 s−1, (c) 790 °C/10 s−1, and (d) 820 °C/0.001 s−1.

Figure 14.
EBSD analysis of DRX at strain rates of 0.001 s−1: (a) 700 °C, (b) 730 °C, (c) 760 °C, (d) 790 °C, and (e) 820 °C.
Figure 14.
EBSD analysis of DRX at strain rates of 0.001 s−1: (a) 700 °C, (b) 730 °C, (c) 760 °C, (d) 790 °C, and (e) 820 °C.


Table 1.
Chemical composition.
| Element | Al | Cr | V | Mo | Ti |
|---|---|---|---|---|---|
| Content (wt.%) | 2.8 | 5.9 | 5.2 | 5.2 | Bal. |
Table 2.
Detailed parameters of high-temperature compression simulation.
| Parameters | Details |
|---|---|
| Deformation temperatures | 700 °C, 730 °C, 760 °C, 790 °C, 820 °C |
| Strain rate | 0.001 s−1, 0.01 s−1, 0.1 s−1, 1 s−1, 10 s−1 |
| Heating rate | 10 °C/s |
| Holding time before test | 300 s |
| Cooling method after test | water quenching |
| Reduction | 60% of height |
Table 3.
Parameters for constitutive relations.
| Phase Field | α | β | n1 | n | A | Q (kJ/mol) |
|---|---|---|---|---|---|---|
| α + β | 0.005225 | 0.0302 | 5.78 | 4.26352 | e49.13873 | 442.25 |
| β | 0.00758 | 0.0368 | 4.85 | 3.61766 | e19.79592 | 206.86 |
Table 4.
Values of Q under different deformed conditions (kJ/mol).
| Strain | 0.1 | 0.2 | 0.3 | 0.4 | 0.5 | 0.6 |
|---|---|---|---|---|---|---|
| α + β phase field | 438.10 | 417.21 | 370.53 | 319.48 | 280.08 | 255.08 |
| β phase field | 233.18 | 229.48 | 230.90 | 232.88 | 226.98 | 236.68 |
Table 5.
Average grain size.
| Conditions | 700 °C/0.01 s−1 | 730 °C/0.01 s−1 | 760 °C/0.01 s−1 | 790 °C/0.001 s−1 | 790 °C/0.1 s−1 | 790 °C/10 s−1 | 820 °C/0.001 s−1 |
|---|---|---|---|---|---|---|---|
| Average grain size (μm) | 71 | 56 | 51 | 17 | 22 | 26 | 38 |
Disclaimer/Publisher’s Note: The statements, opinions and data contained in all publications are solely those of the individual author(s) and contributor(s) and not of MDPI and/or the editor(s). MDPI and/or the editor(s) disclaim responsibility for any injury to people or property resulting from any ideas, methods, instructions or products referred to in the content. |
© 2023 by the authors. Licensee MDPI, Basel, Switzerland. This article is an open access article distributed under the terms and conditions of the Creative Commons Attribution (CC BY) license (https://creativecommons.org/licenses/by/4.0/).
Share and Cite
MDPI and ACS Style
Zhang, H.; Zhang, S.; Zhang, S.; Liu, X.; Wu, X.; Zhang, S.; Zhou, G. High Temperature Deformation Behavior of Near-β Titanium Alloy Ti-3Al-6Cr-5V-5Mo at α + β and β Phase Fields. Crystals 2023, 13, 371. https://doi.org/10.3390/cryst13030371
AMA Style
Zhang H, Zhang S, Zhang S, Liu X, Wu X, Zhang S, Zhou G. High Temperature Deformation Behavior of Near-β Titanium Alloy Ti-3Al-6Cr-5V-5Mo at α + β and β Phase Fields. Crystals. 2023; 13(3):371. https://doi.org/10.3390/cryst13030371
Chicago/Turabian StyleZhang, Haoyu, Shuo Zhang, Shuai Zhang, Xuejia Liu, Xiaoxi Wu, Siqian Zhang, and Ge Zhou. 2023. "High Temperature Deformation Behavior of Near-β Titanium Alloy Ti-3Al-6Cr-5V-5Mo at α + β and β Phase Fields" Crystals 13, no. 3: 371. https://doi.org/10.3390/cryst13030371
Note that from the first issue of 2016, this journal uses article numbers instead of page numbers. See further details here.