
Characterization of Ti/SBA-15 Composites Synthesized by Chemical Vapour Deposition of Organic Titanium Compounds
 , , , and
Abstract
:1. Introduction
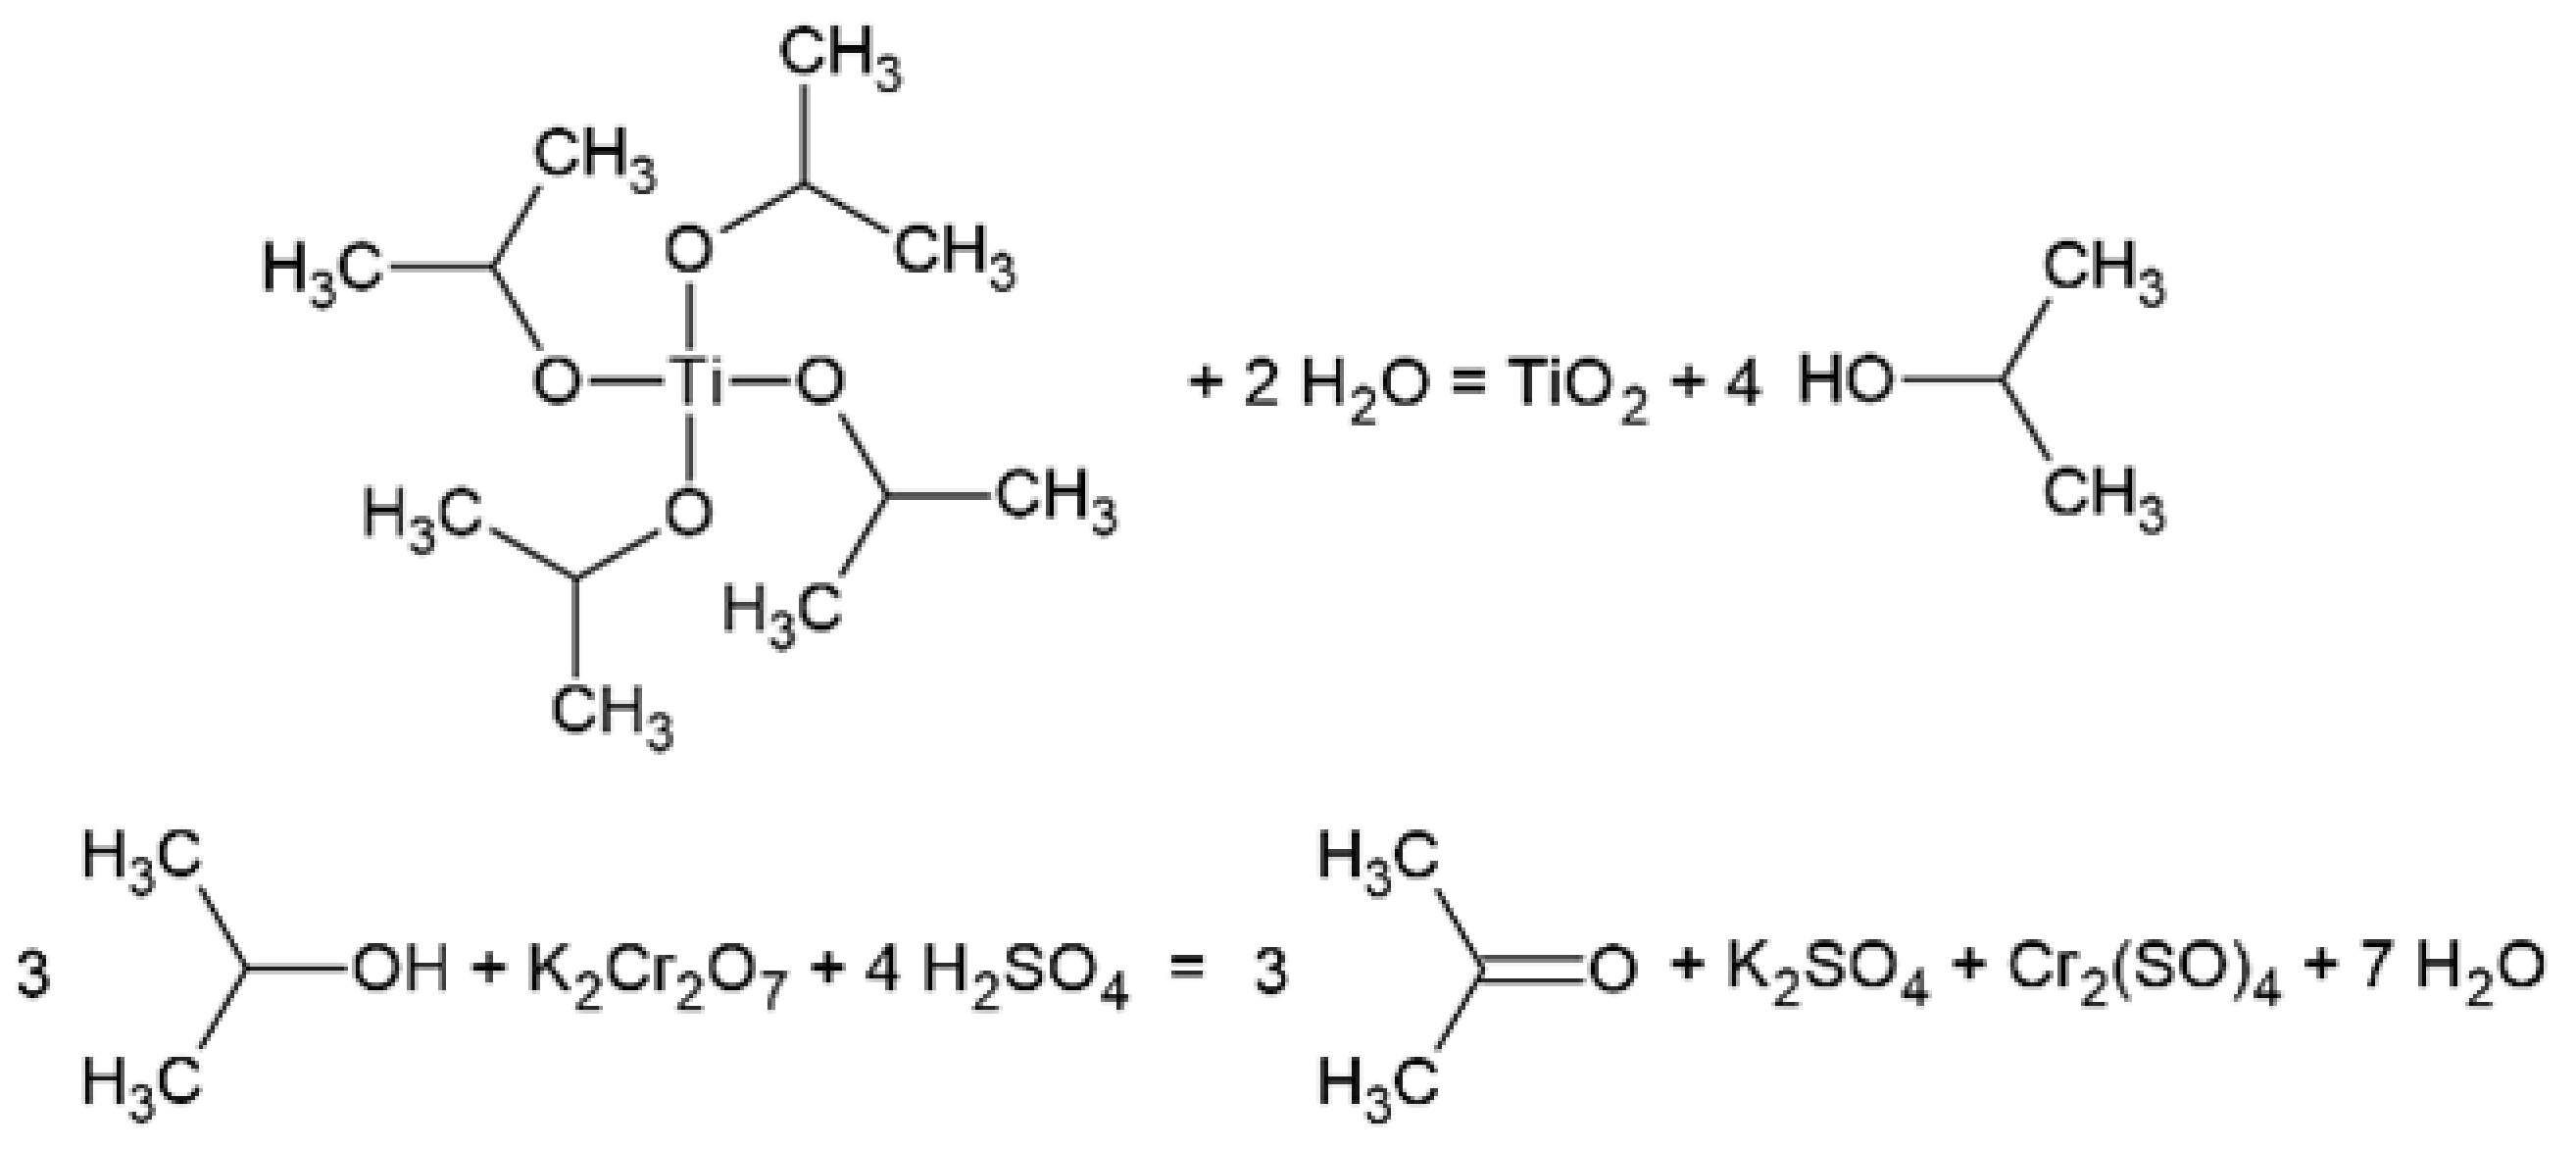
2. Materials and Methods
3. Results and Discussion
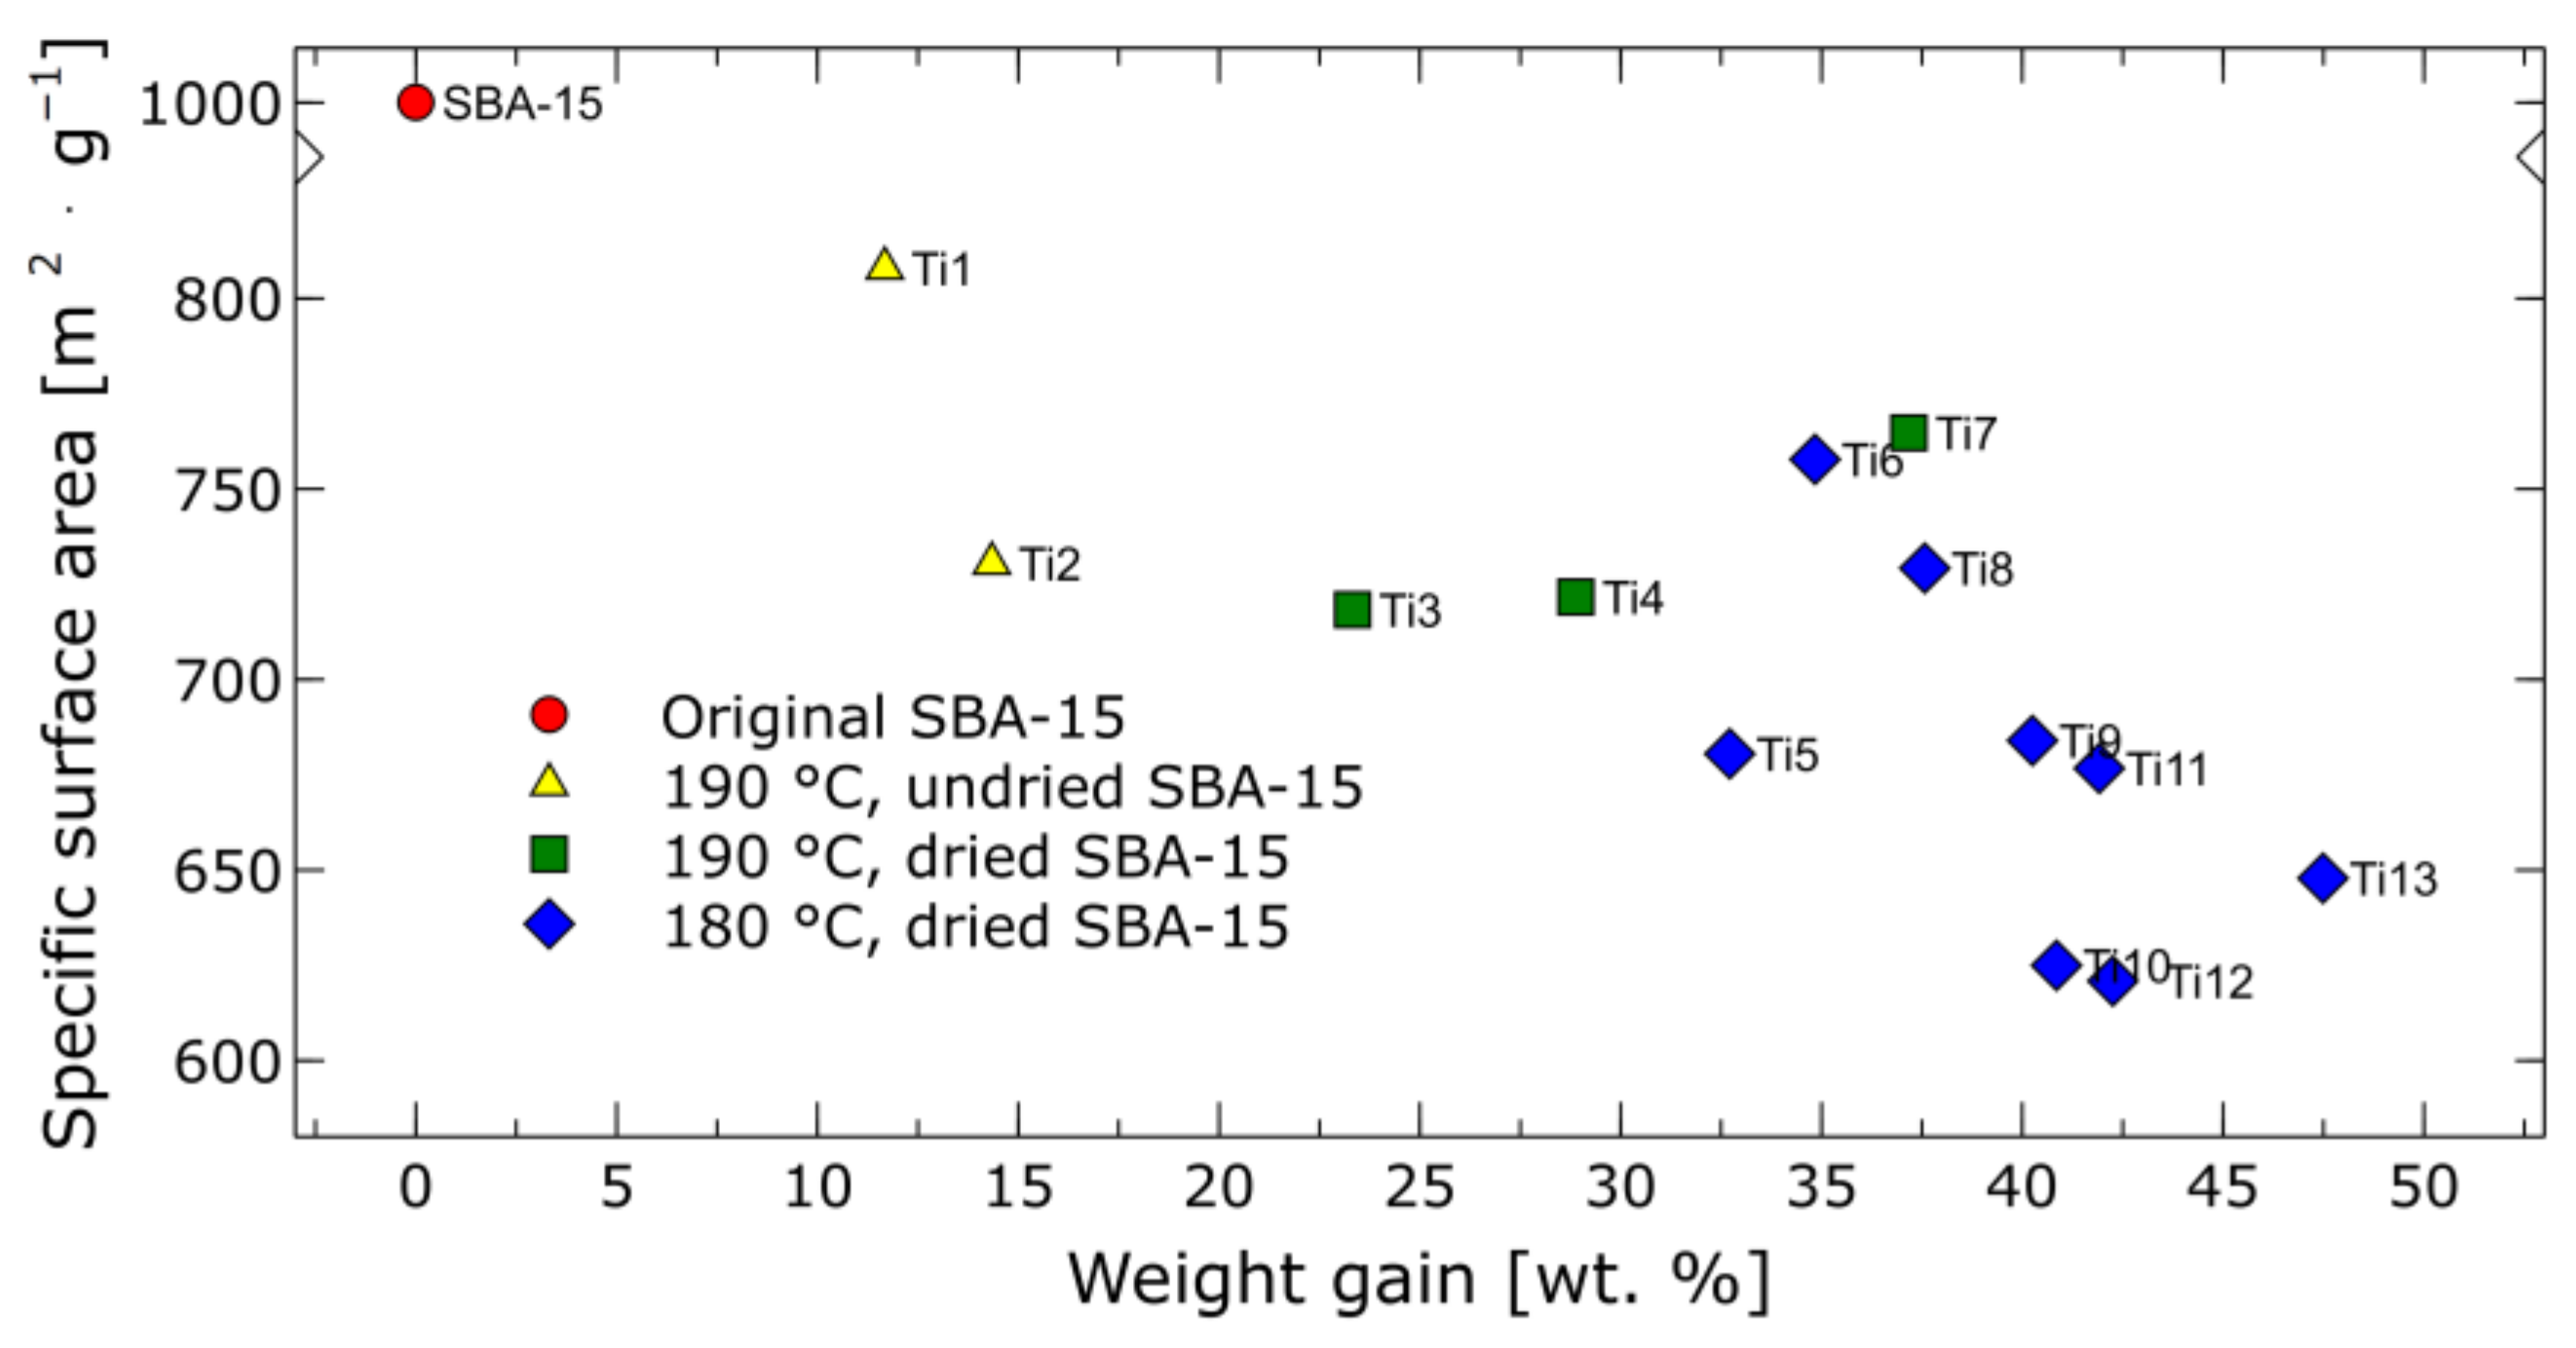
3.1. Ti Absorption and Specific Surface Area
3.2. XRD Investigations
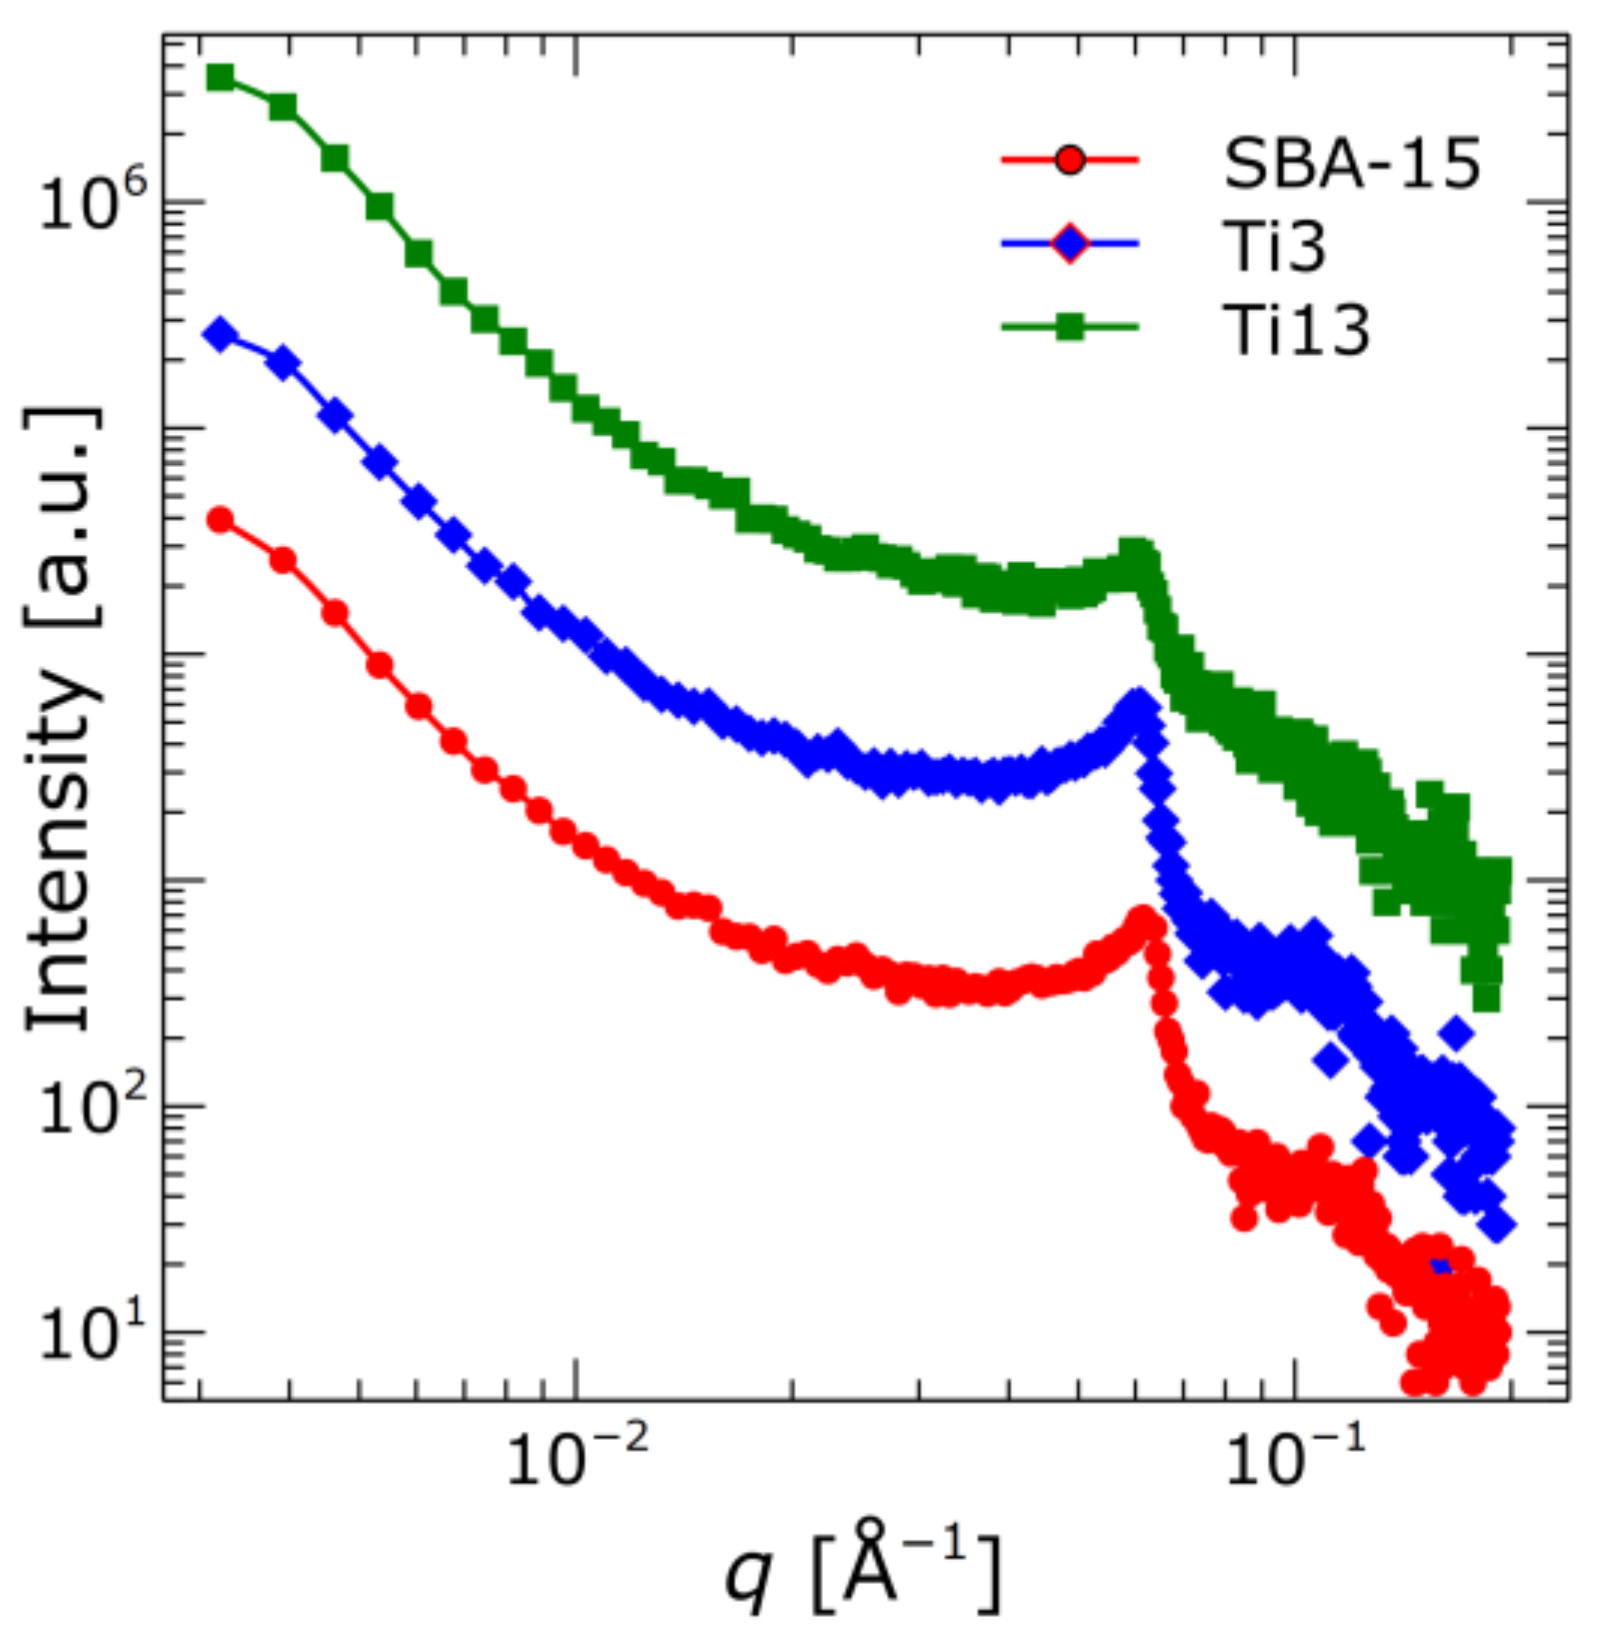
3.3. SAXS
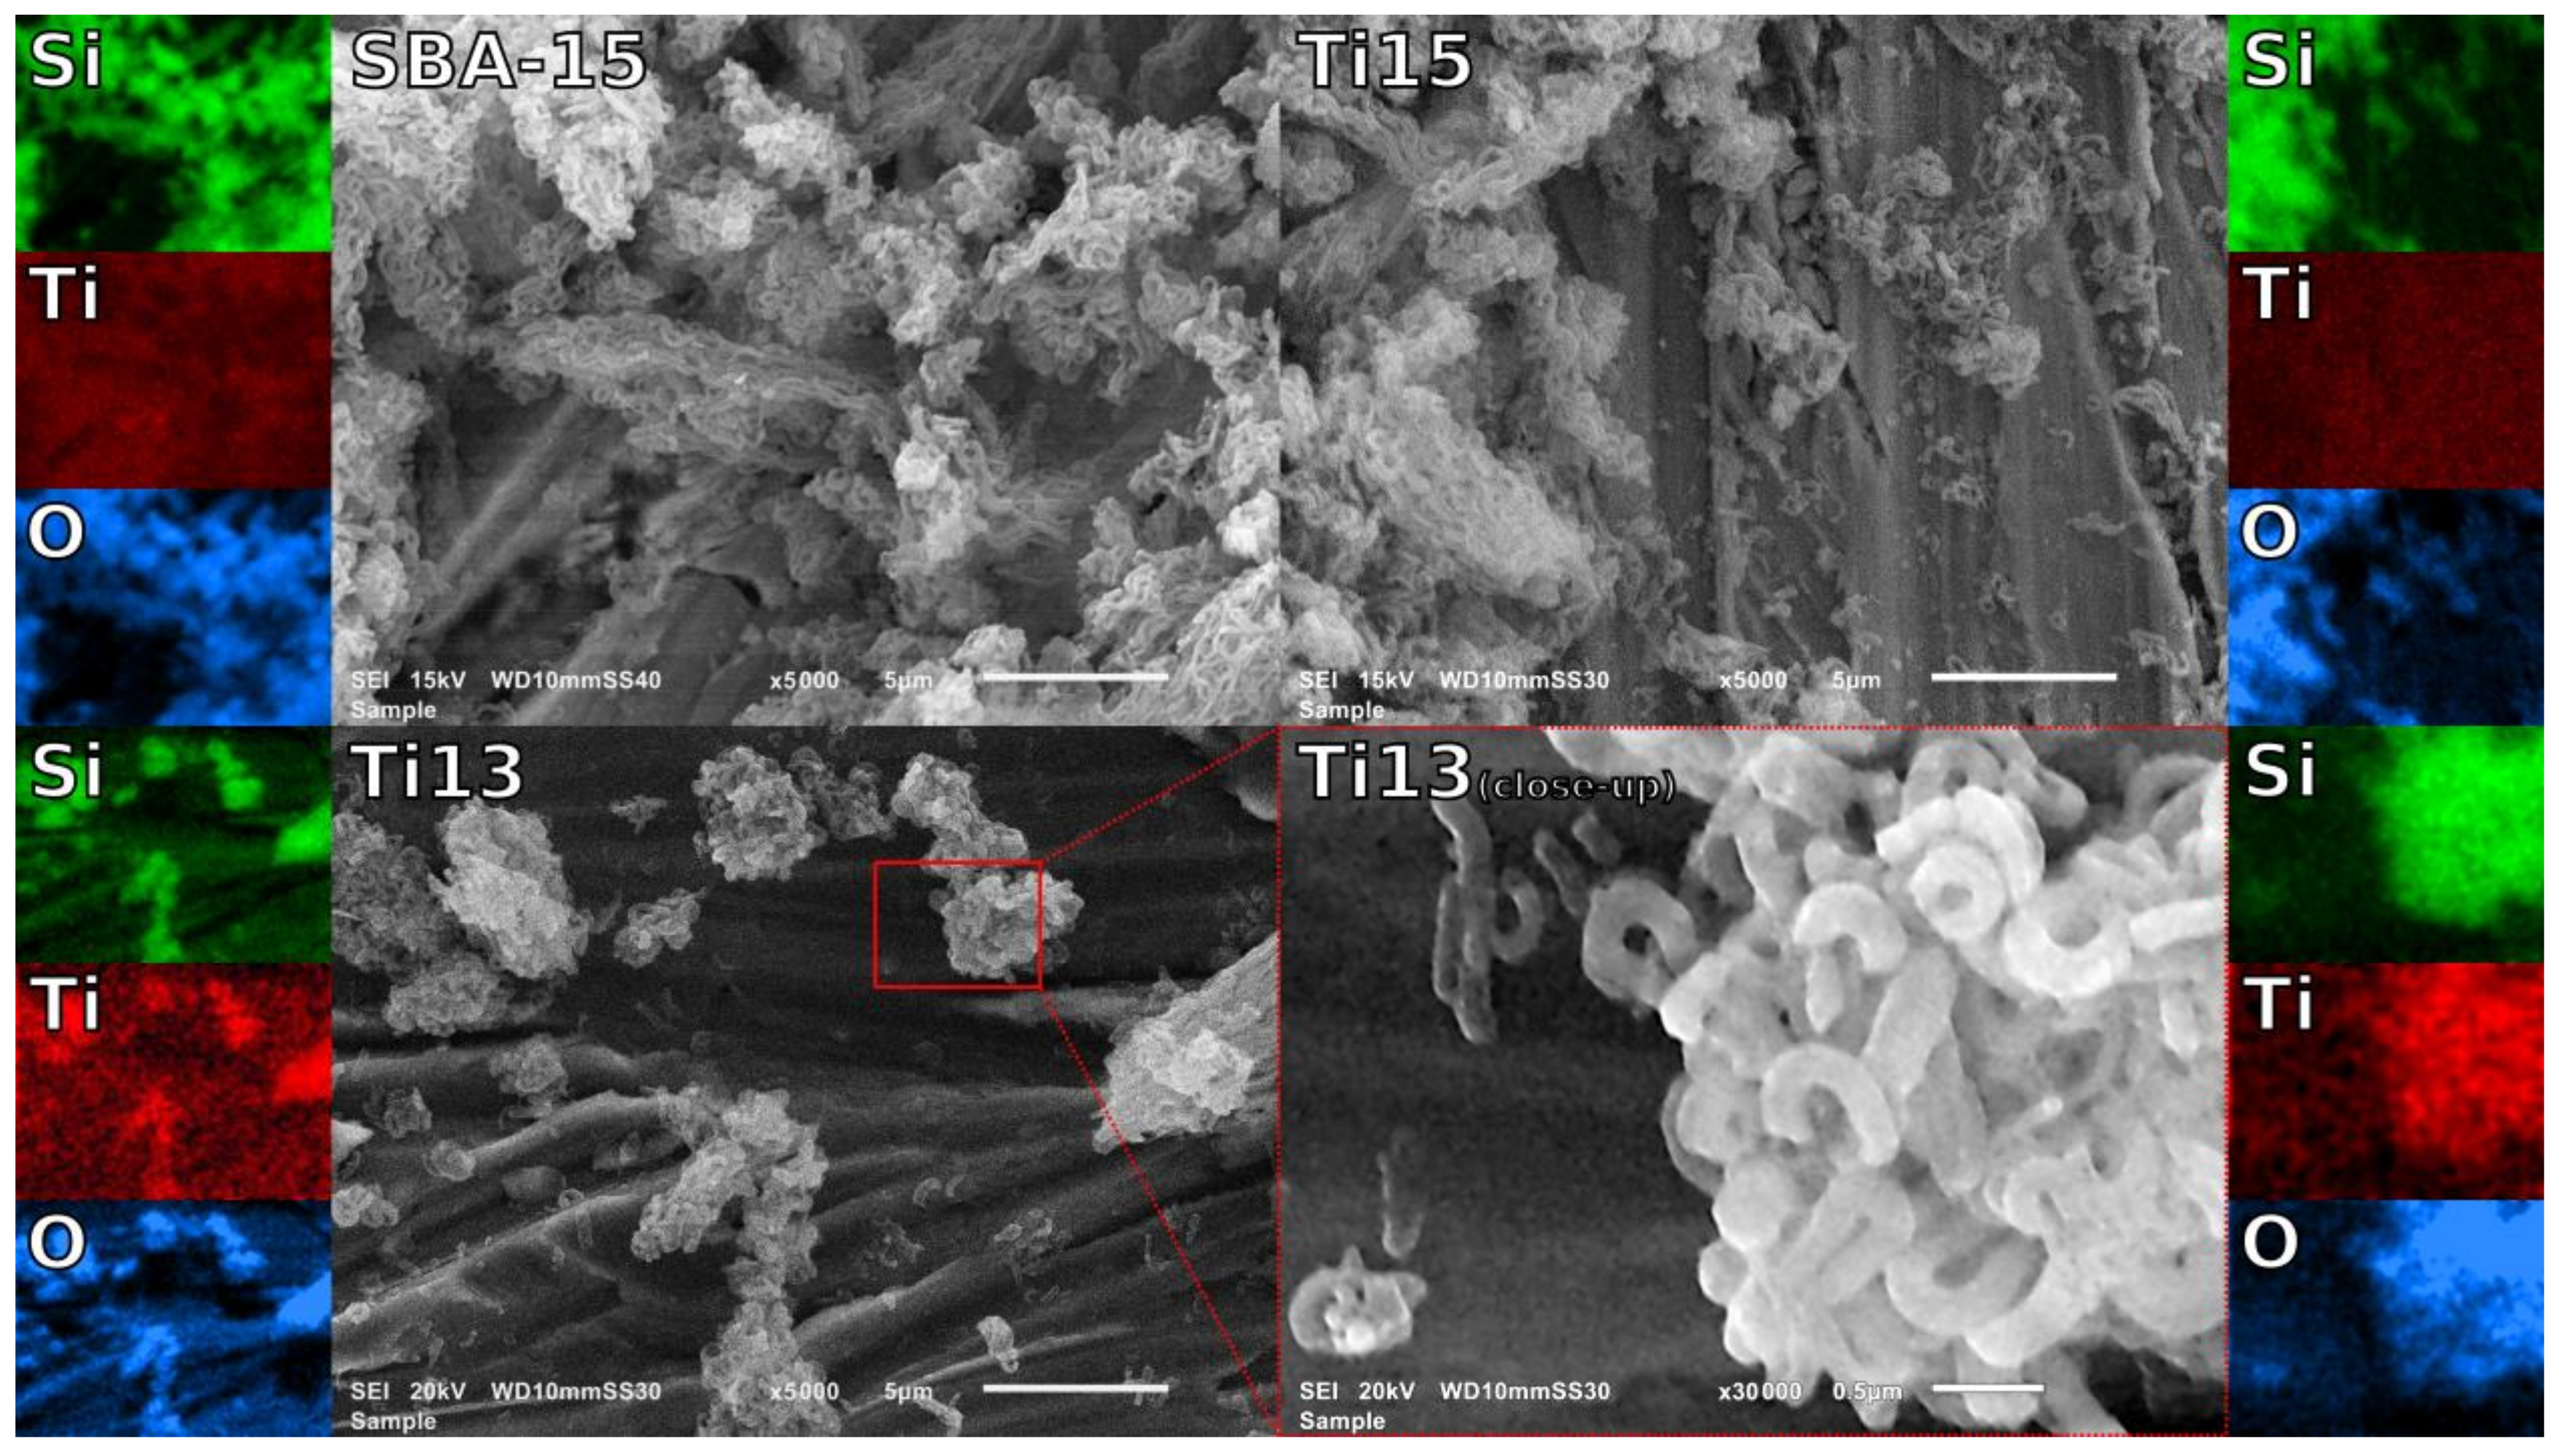
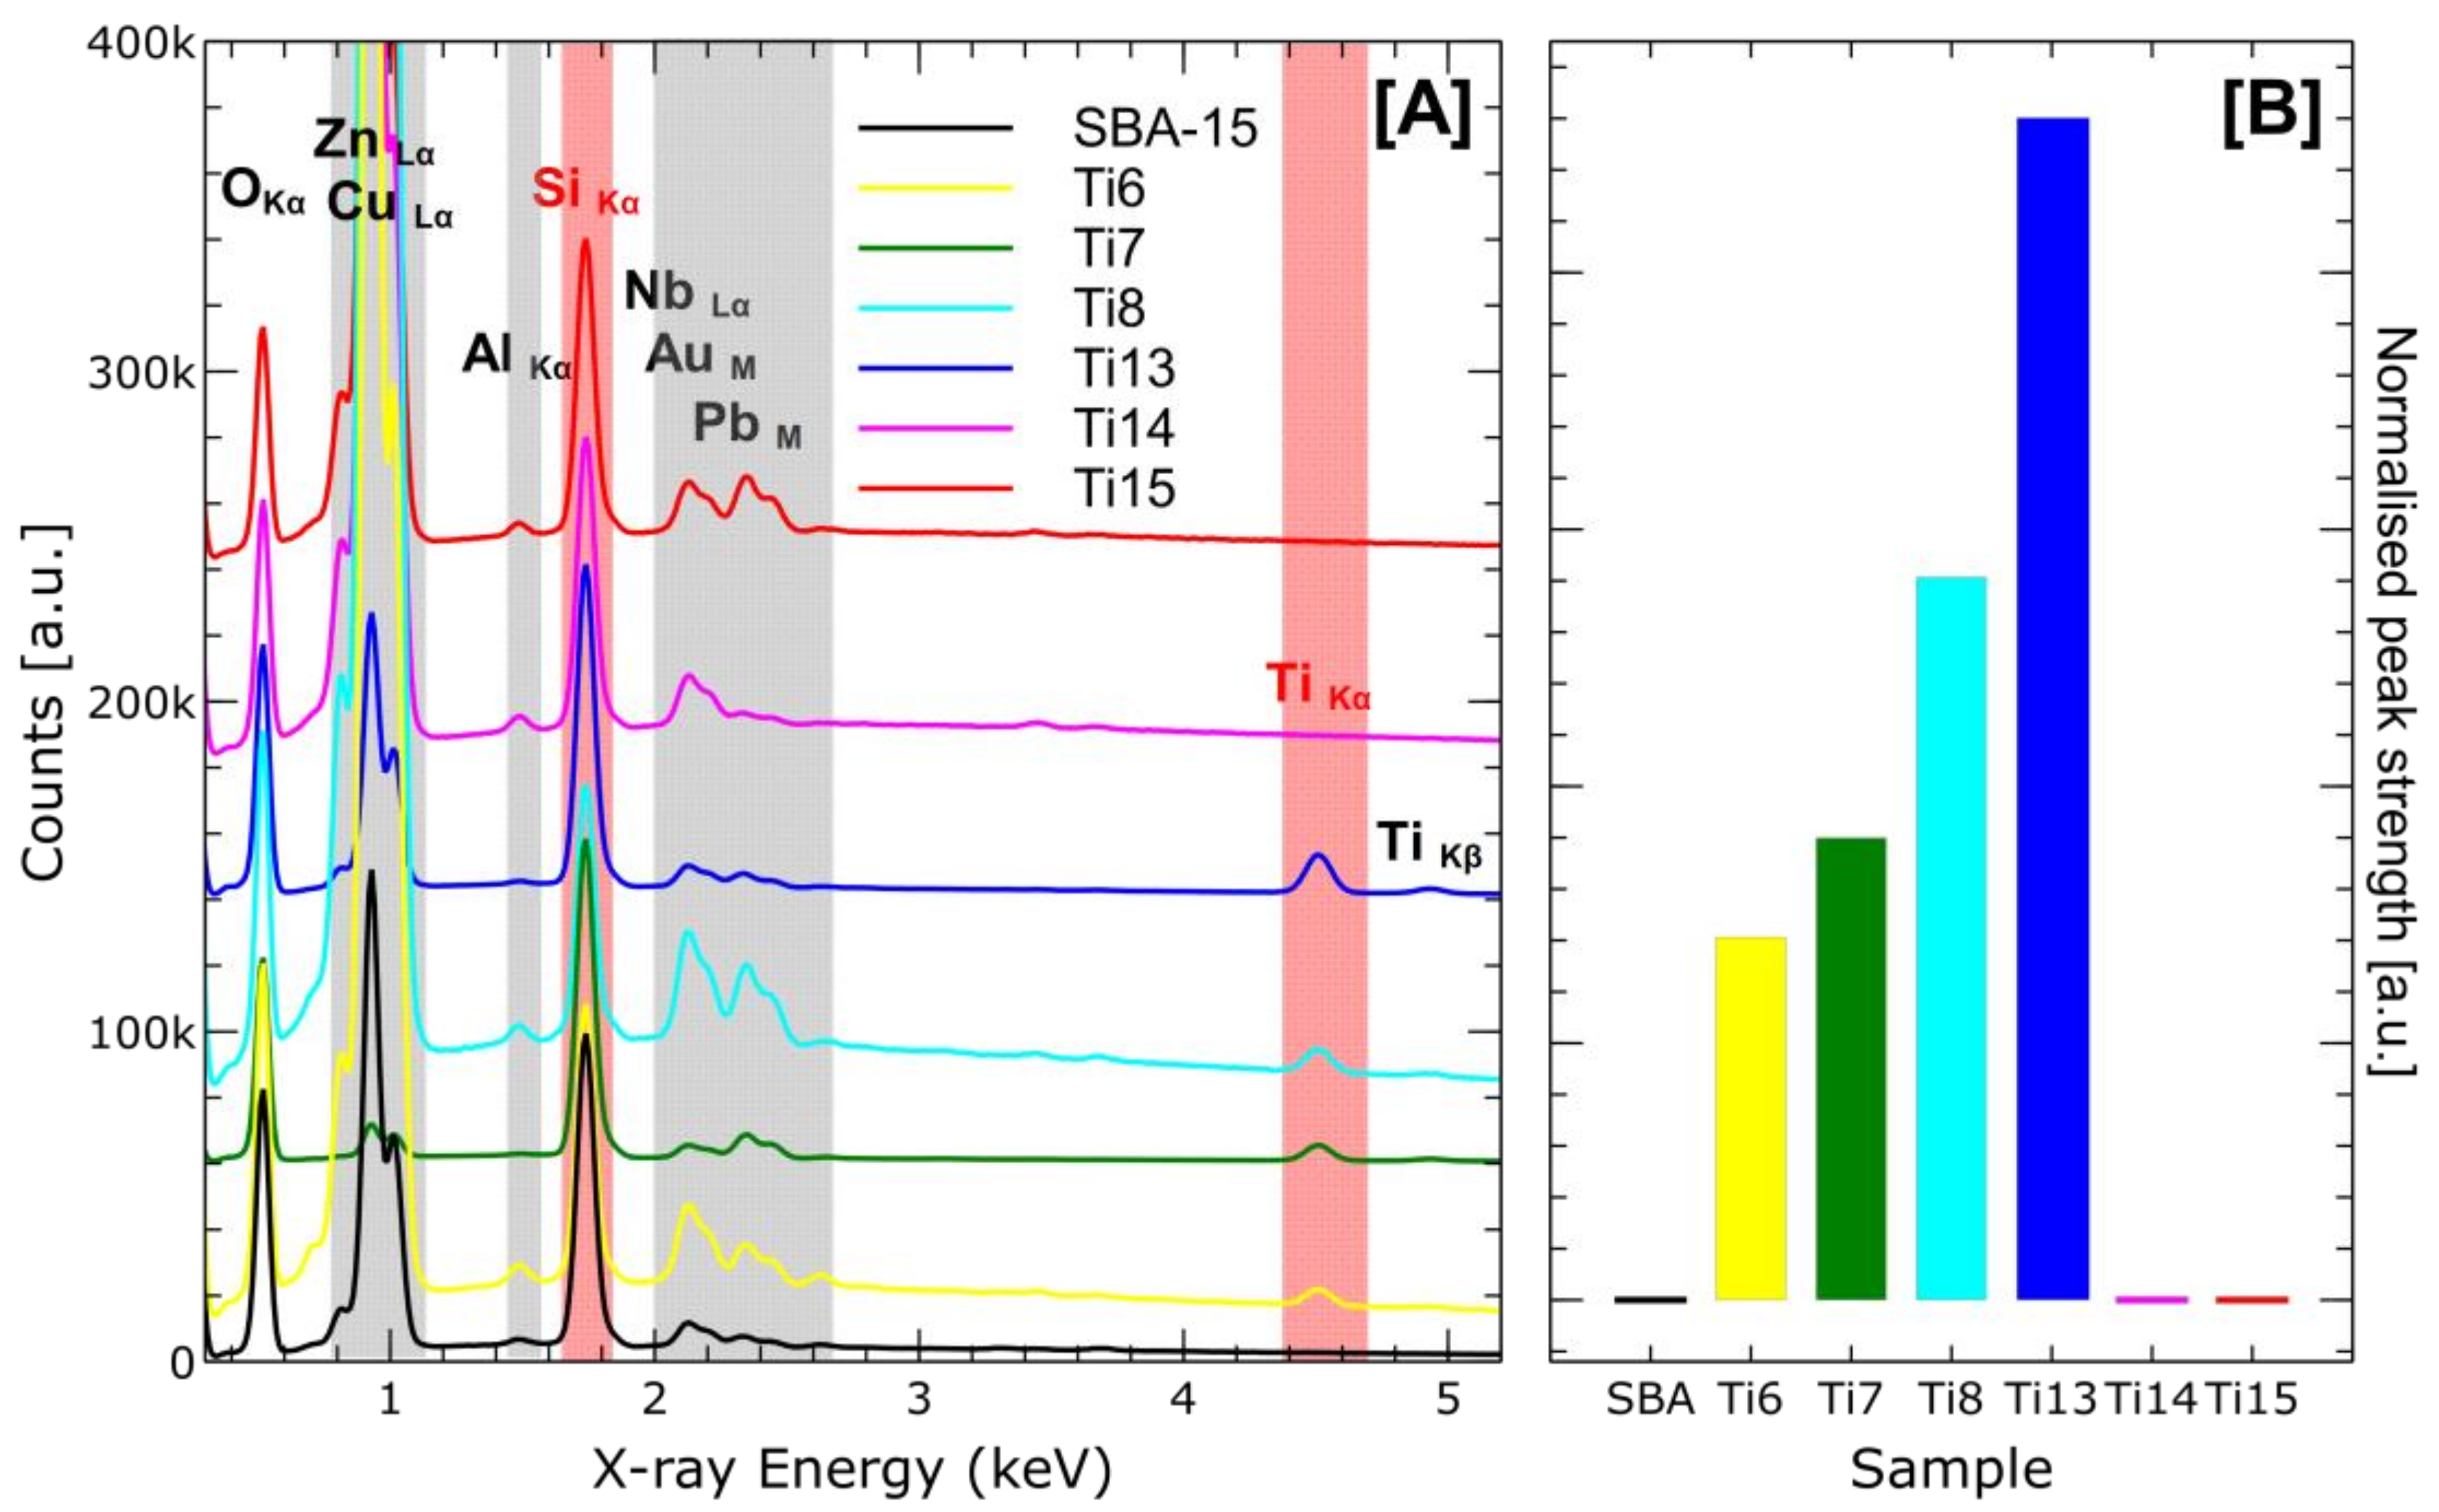
3.4. SEM and EDS Mapping
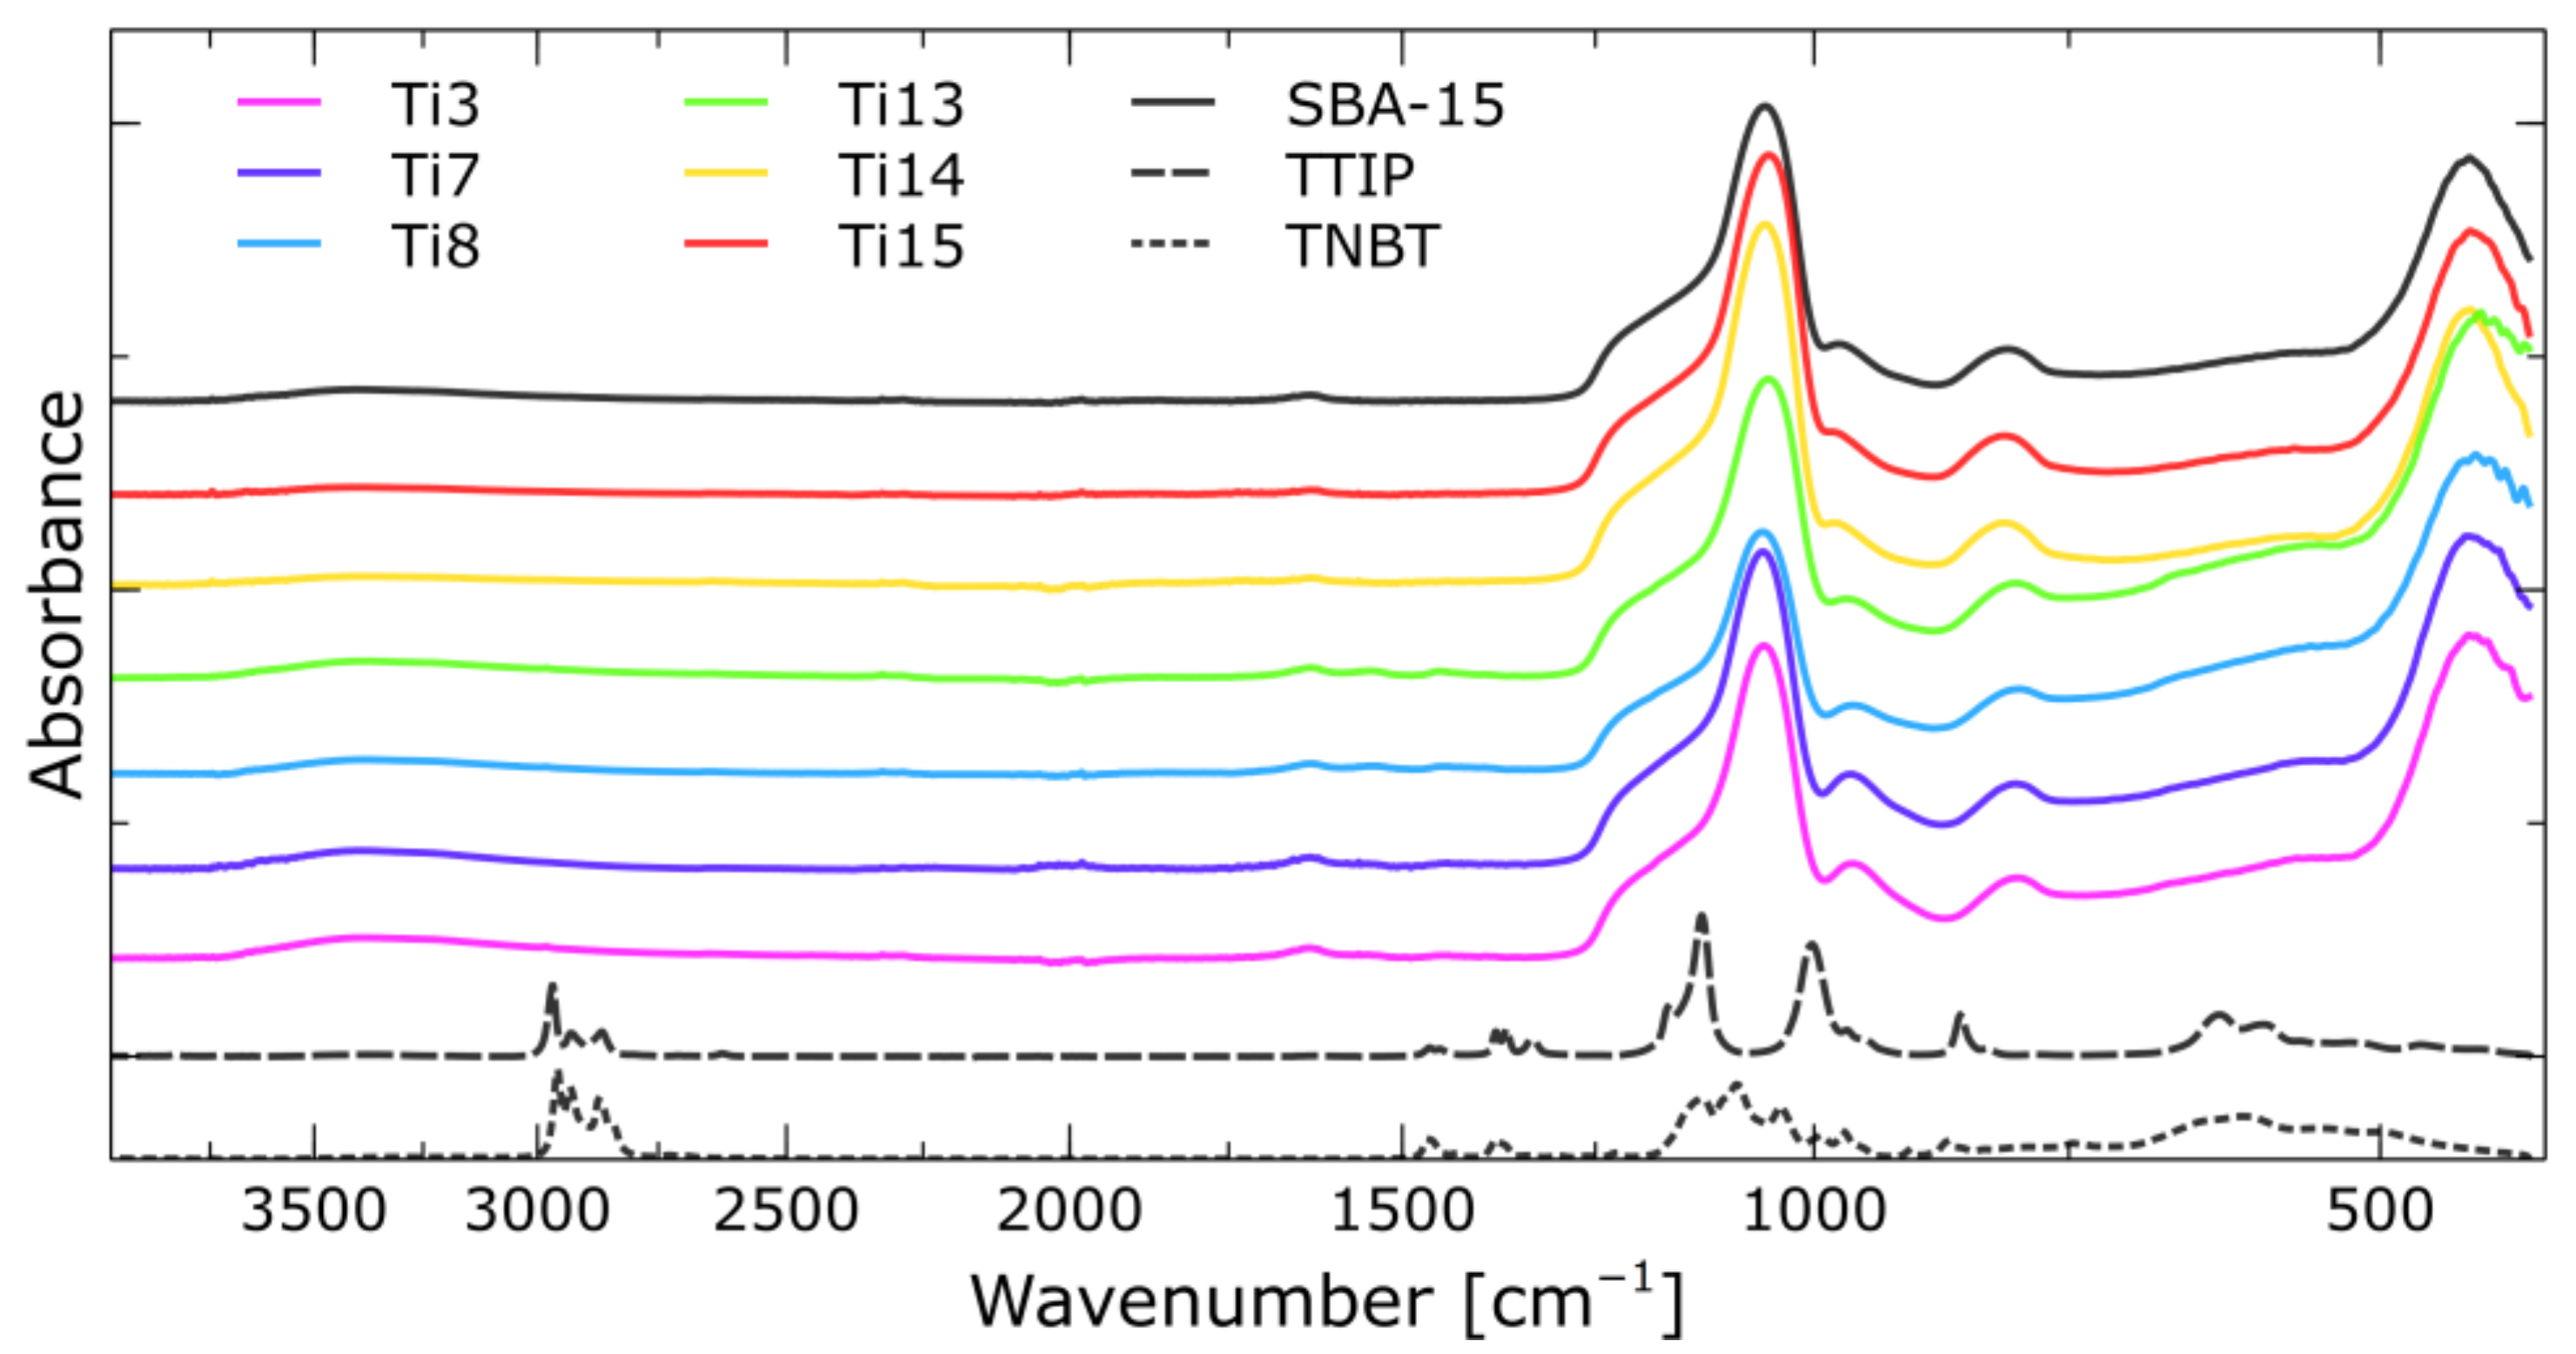
3.5. FTIR
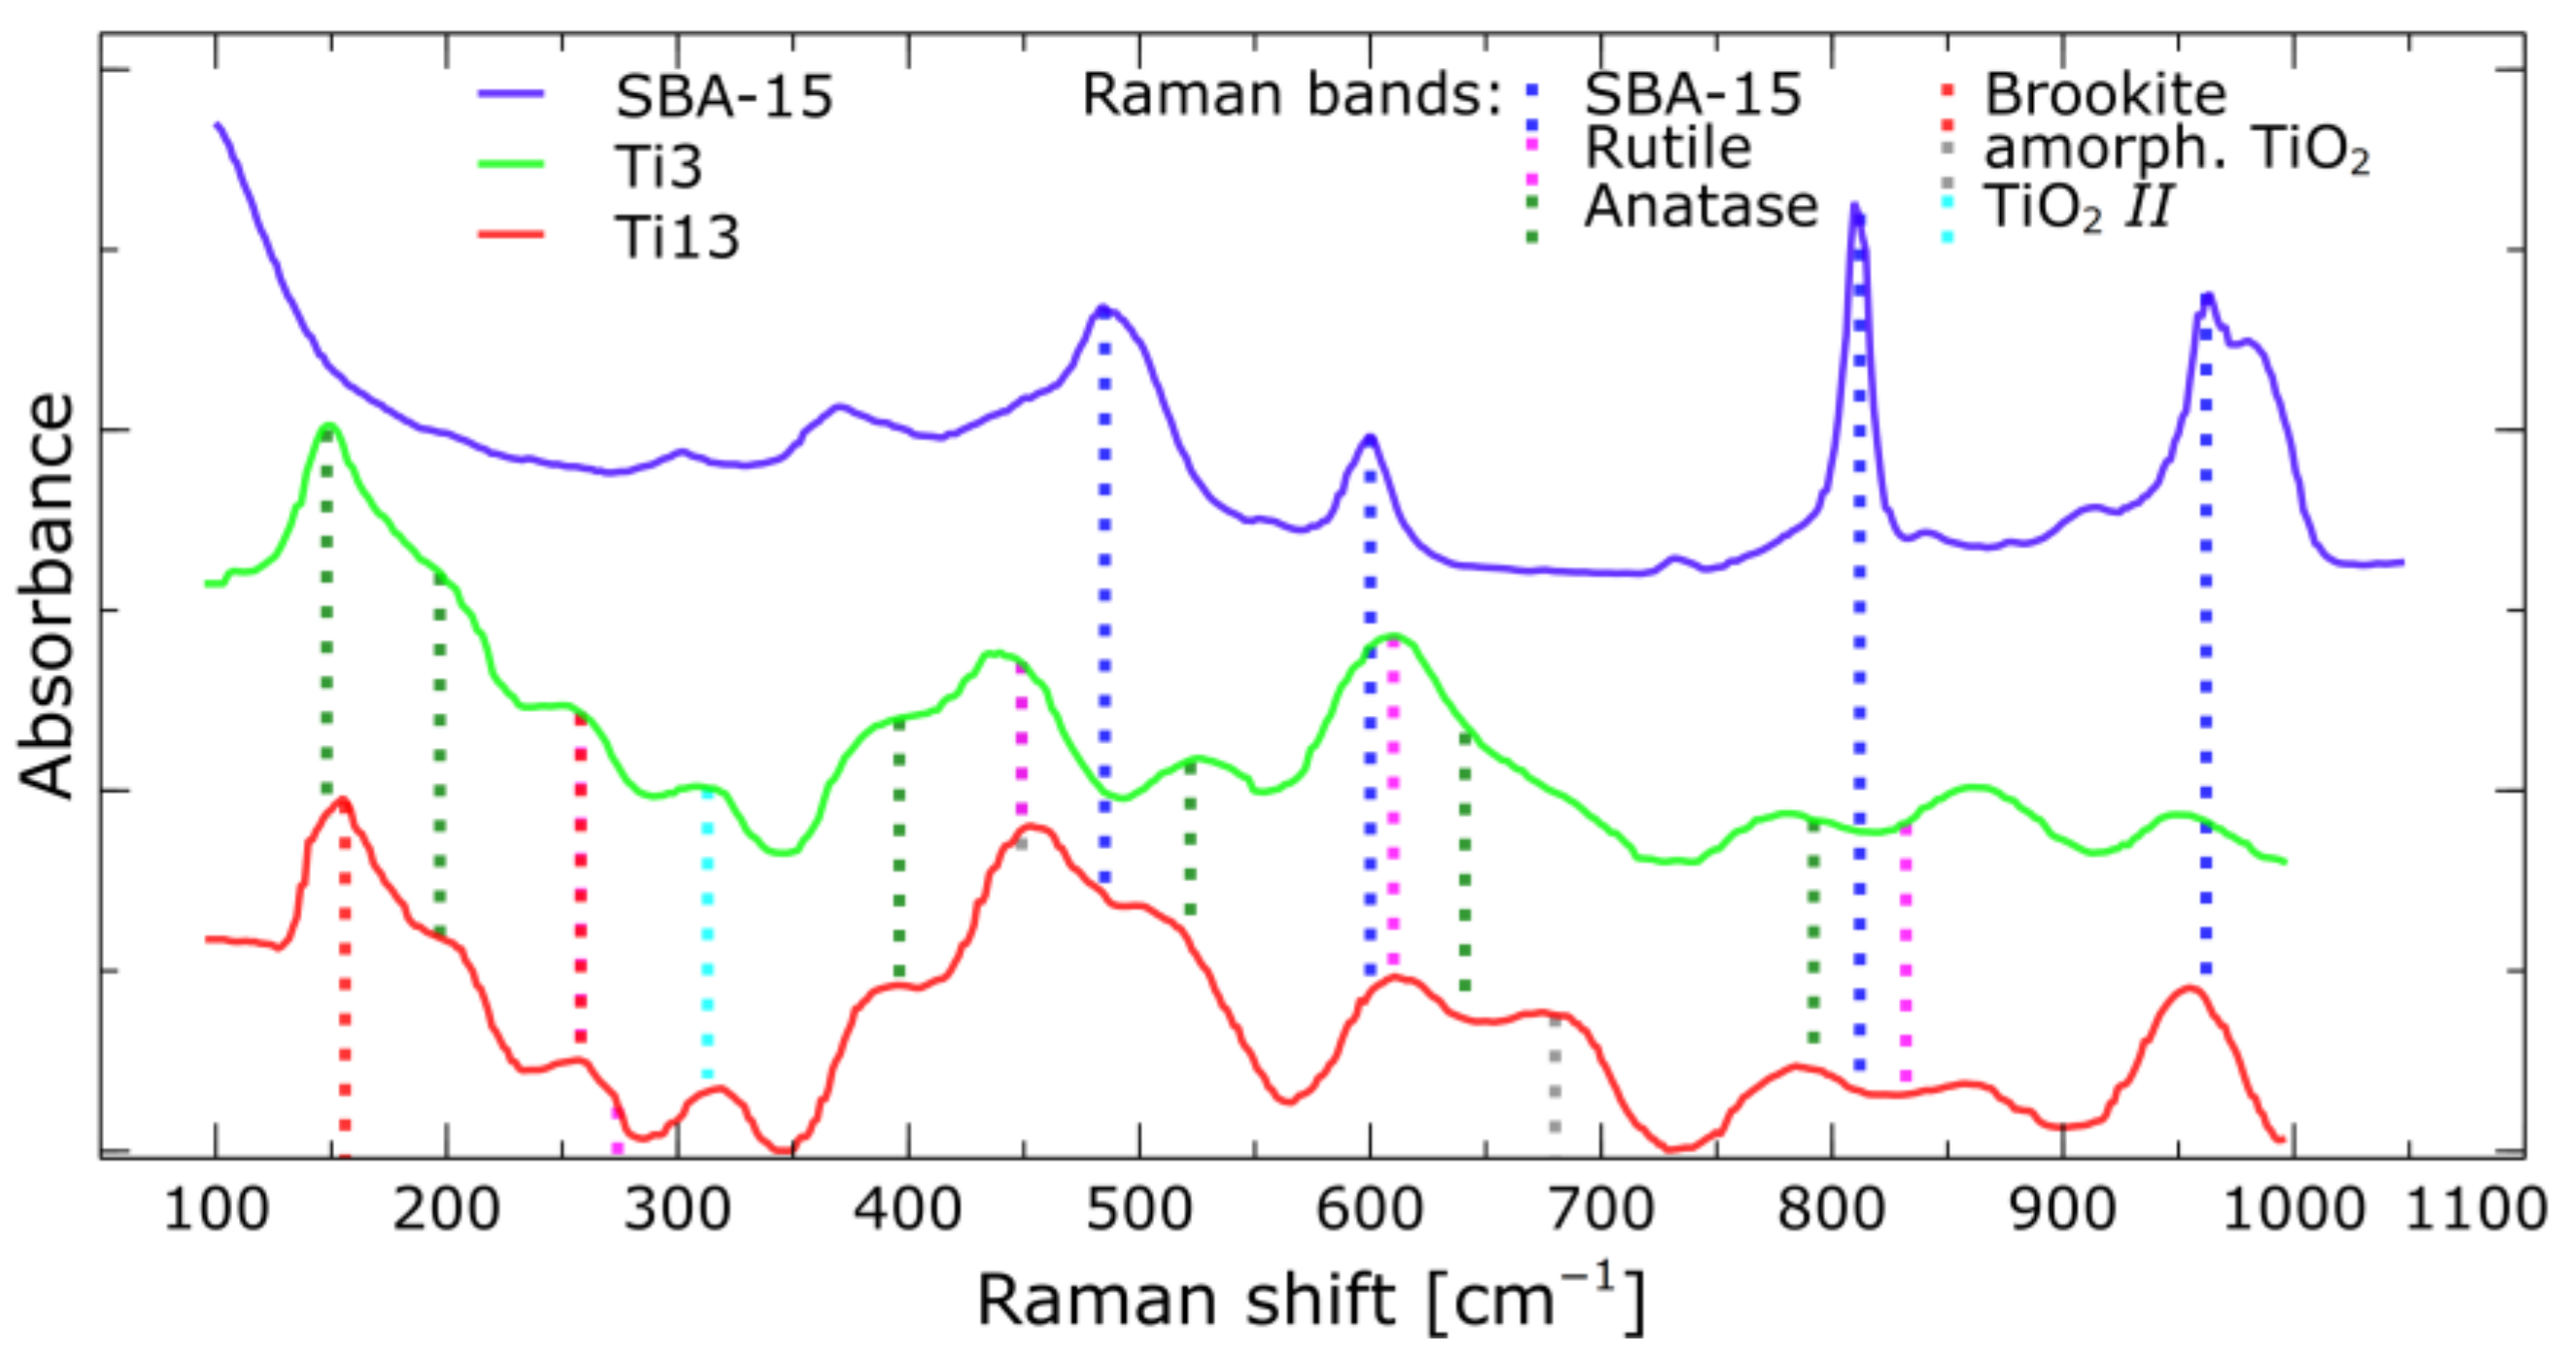
3.6. Raman Spectroscopy
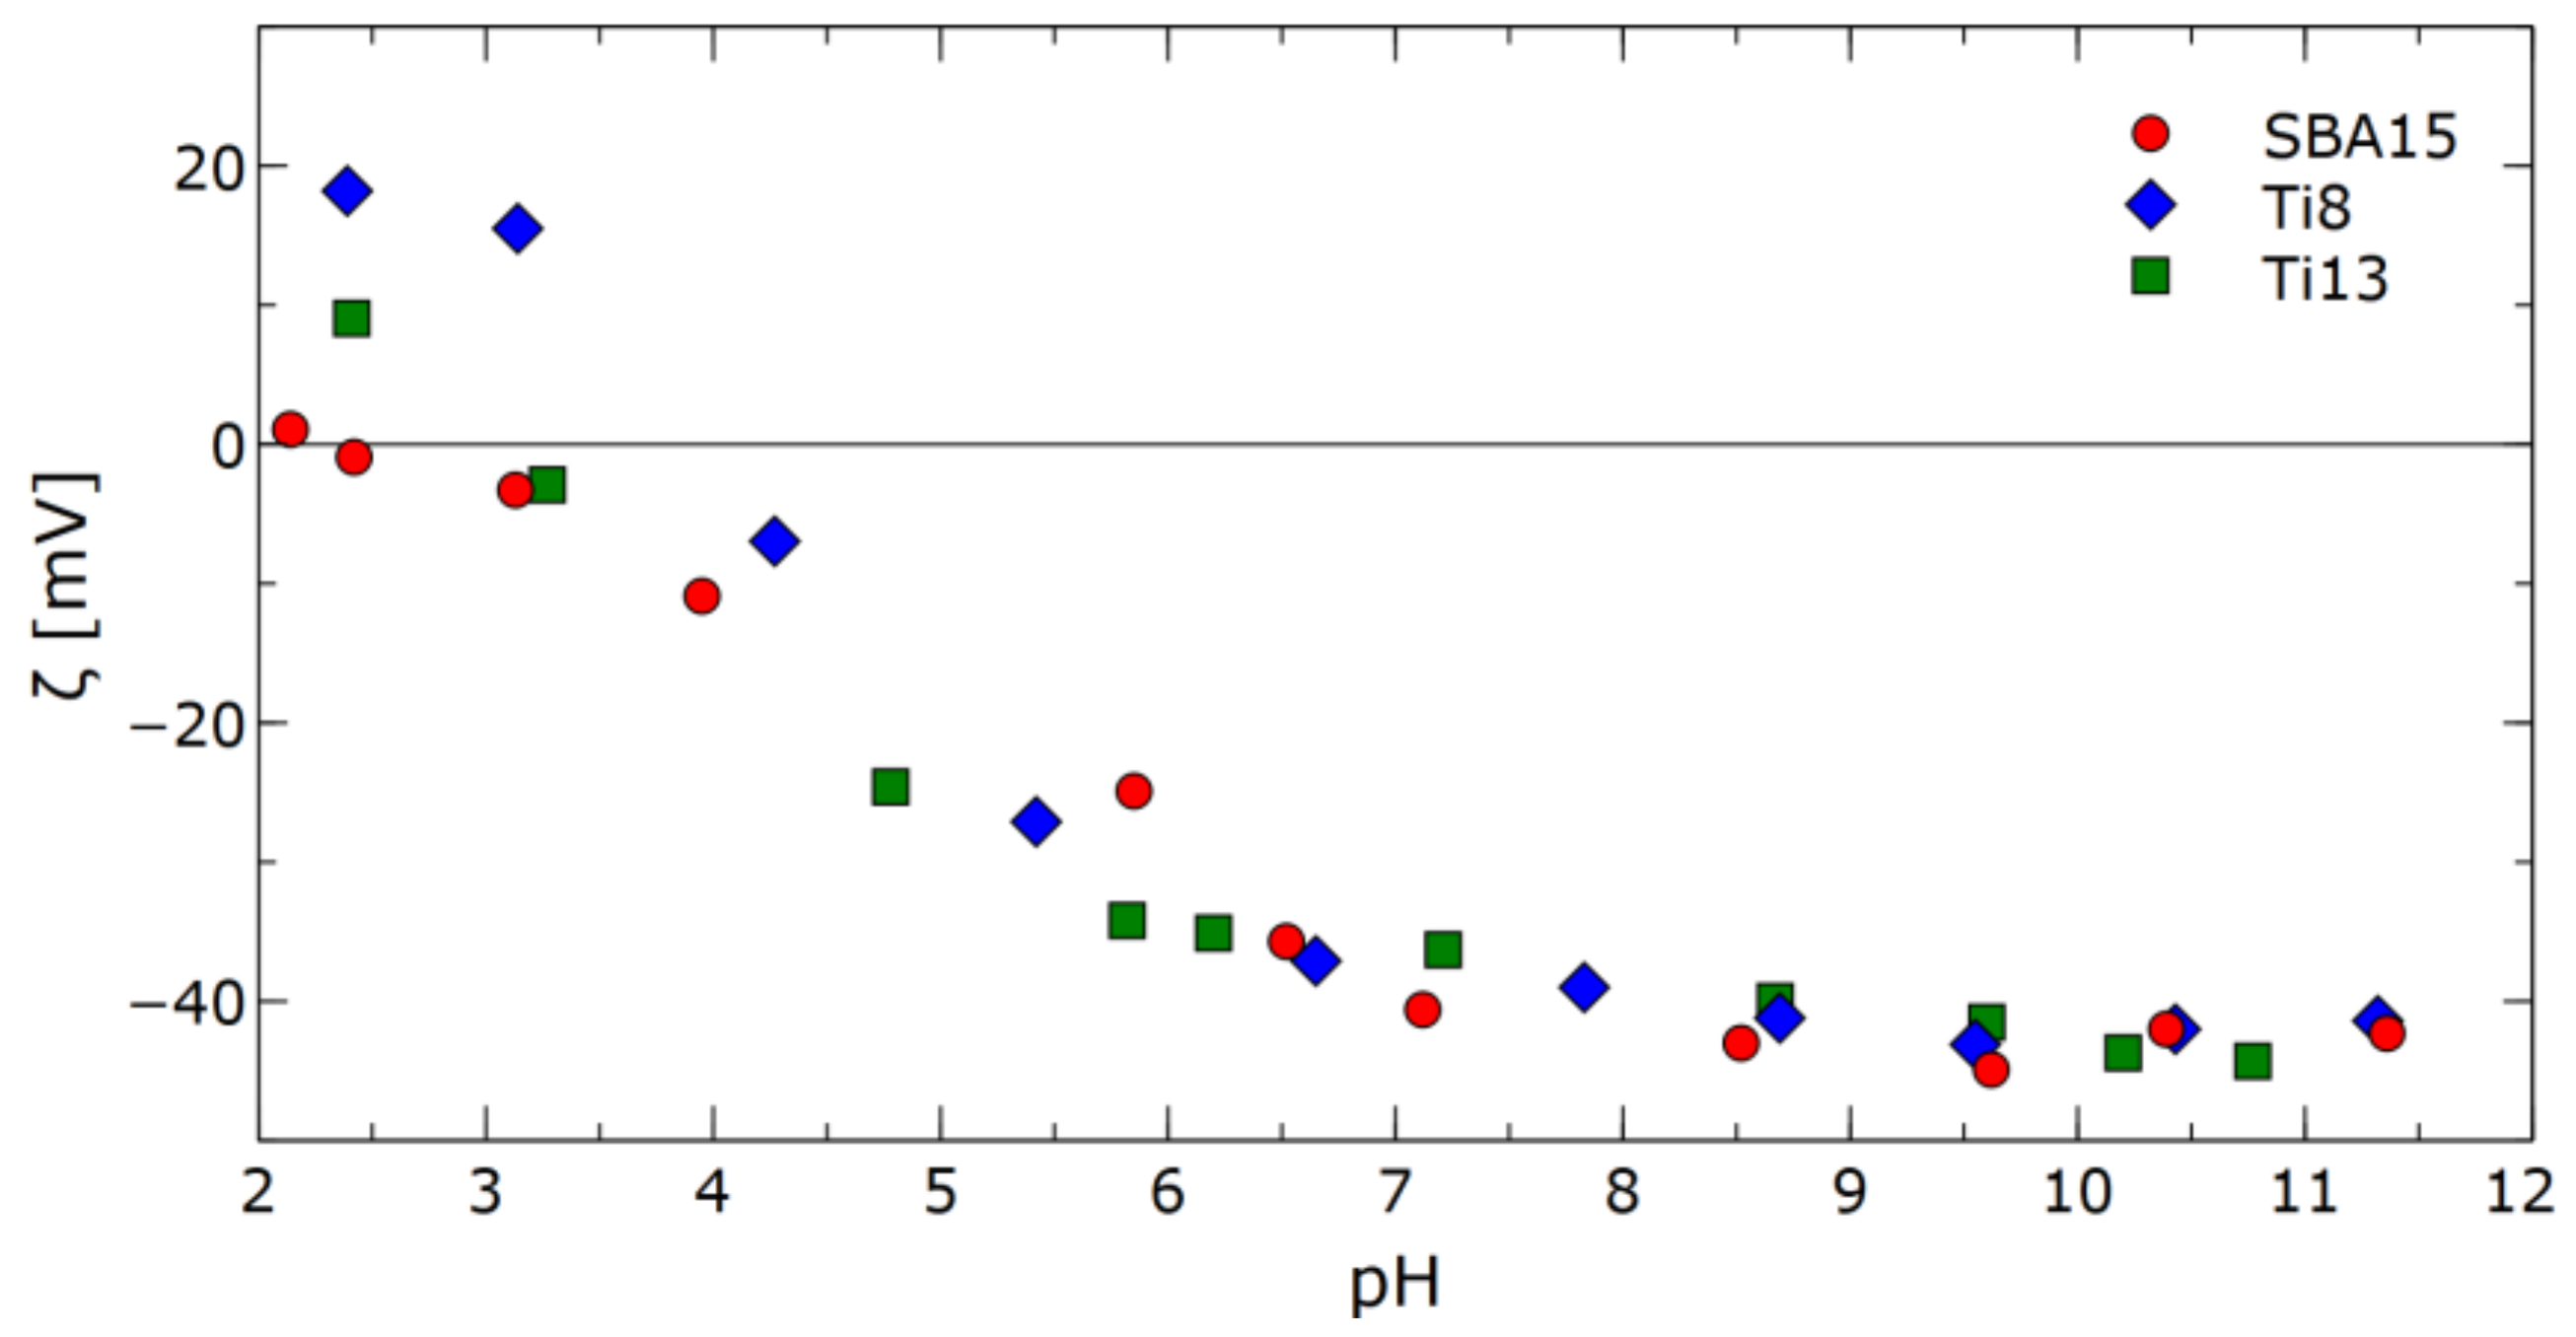
3.7. Zeta Potential
3.8. Thermalstability
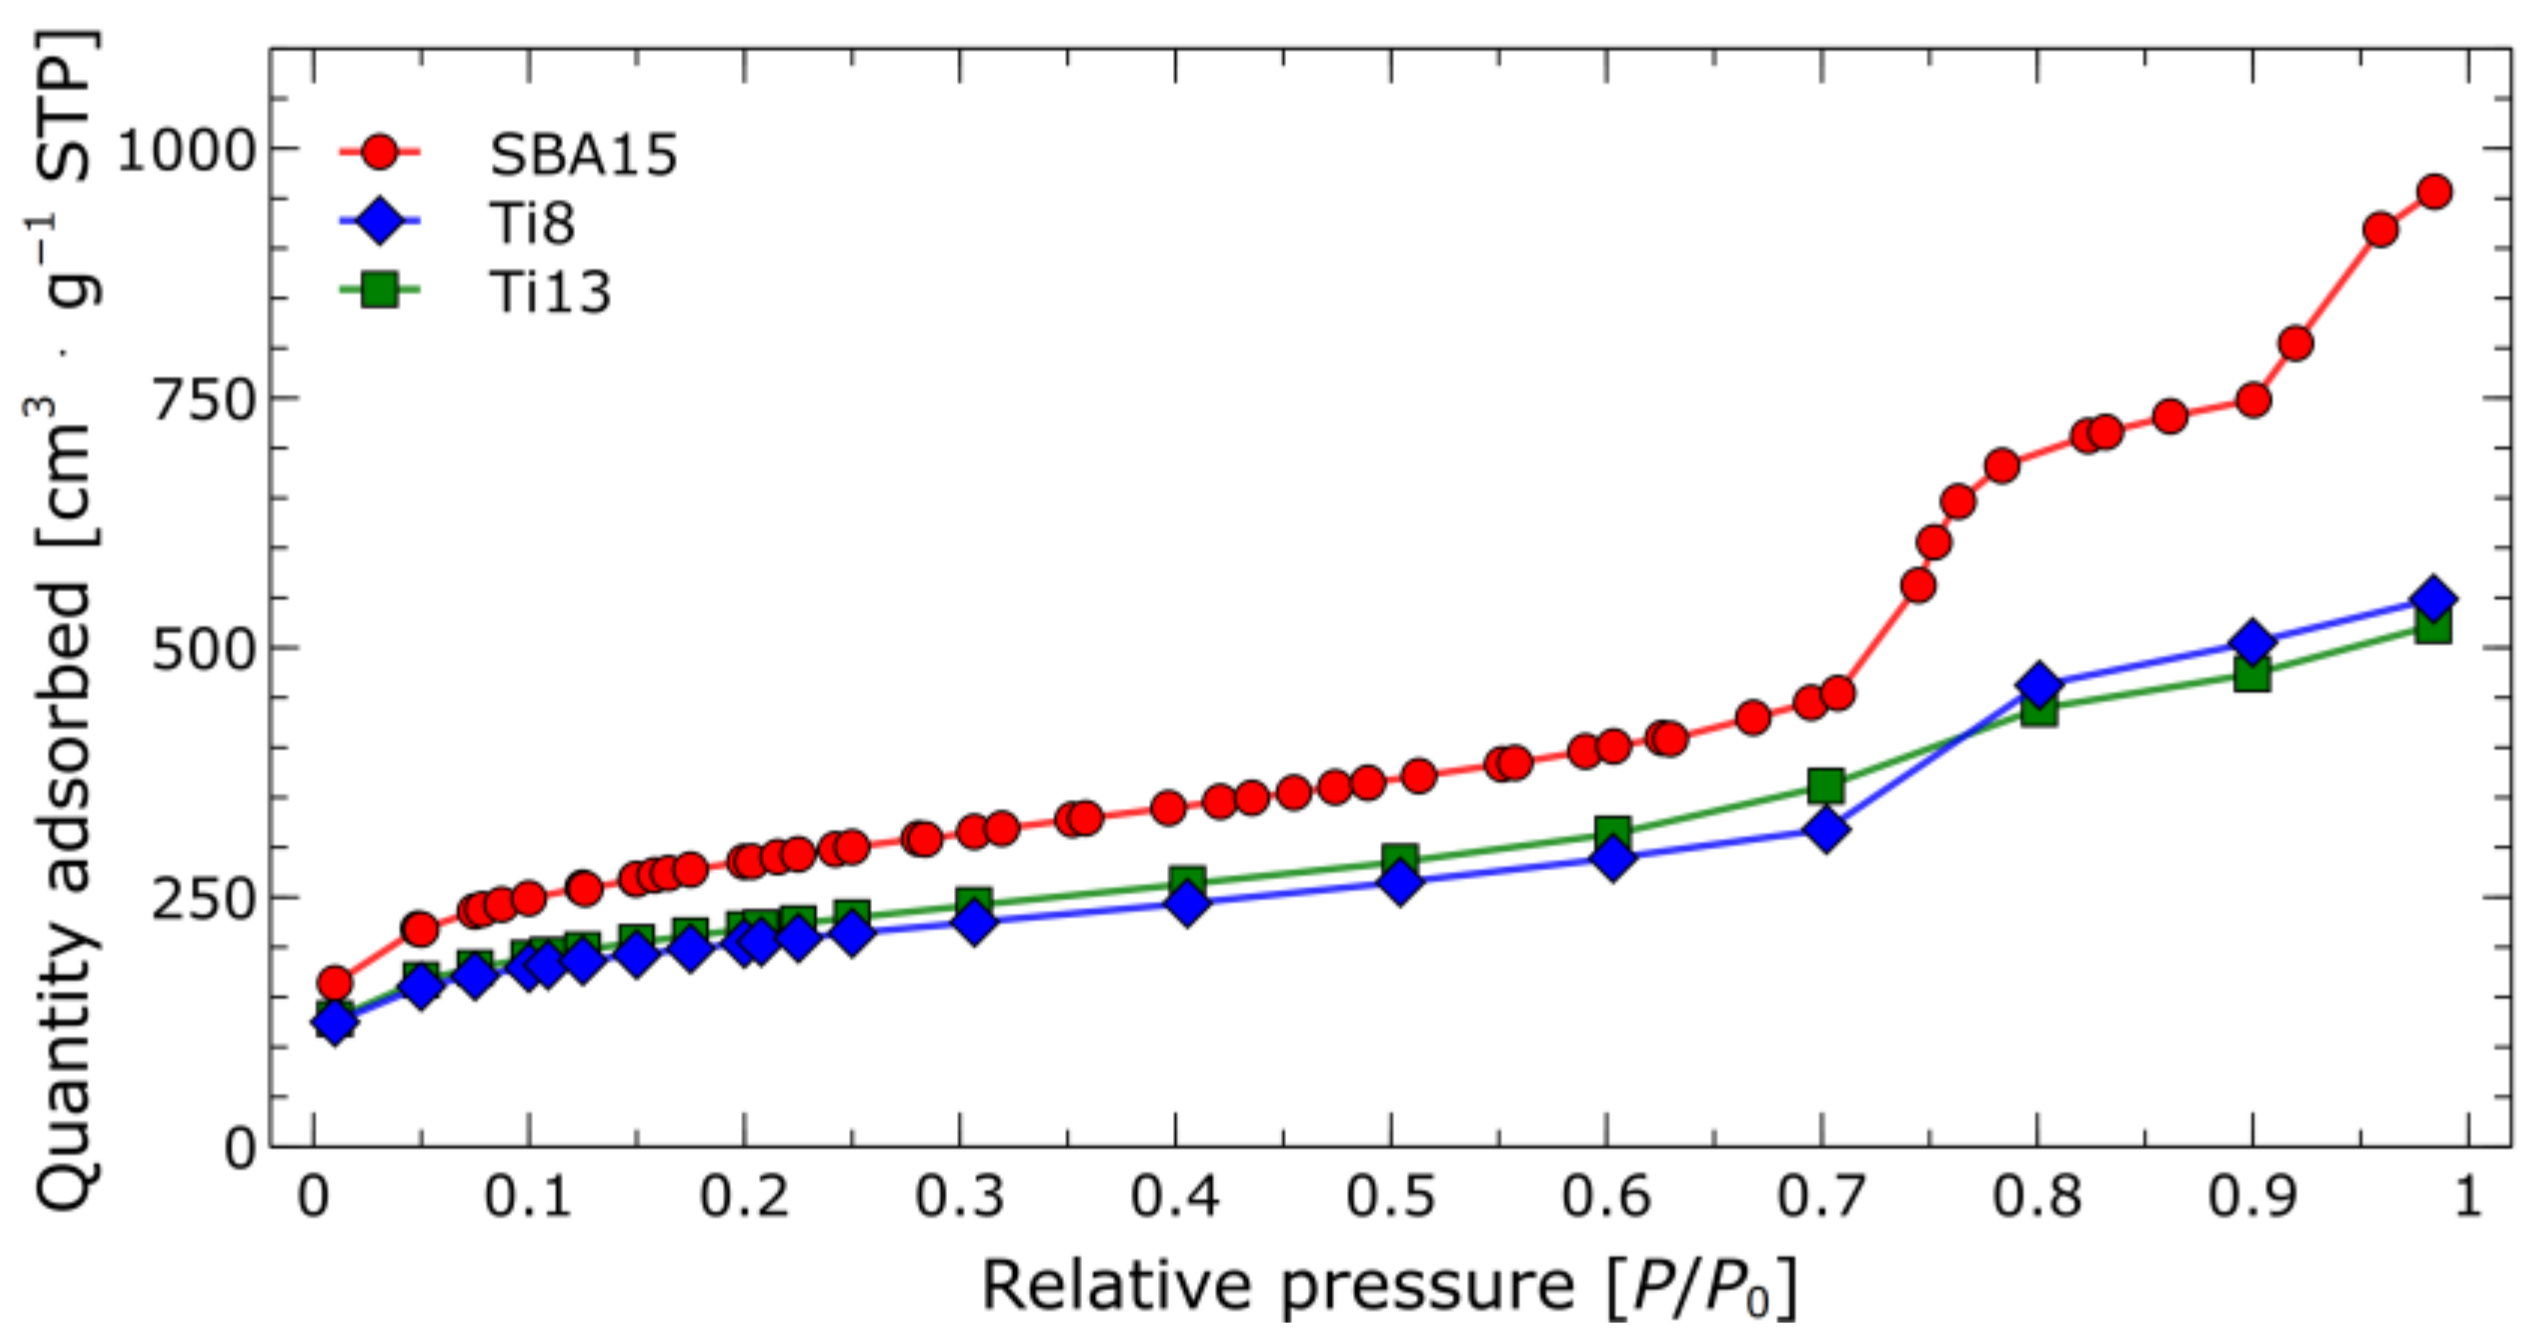
3.9. Isotherms
4. Conclusions
Author Contributions
Funding
Data Availability Statement
Conflicts of Interest
References
- Qiang, T.; Song, Y.; Zhao, J.; Li, J. Controlled Incorporation Homogeneous Ti-Doped SBA-15 for Improving Methylene Blue Adsorption Capacity. J. Alloys Compd. 2019, 770, 792–802. [Google Scholar] [CrossRef]
- Yuan, S.; Wang, M.; Liu, J.; Guo, B. Recent Advances of SBA-15-Based Composites as the Heterogeneous Catalysts in Water Decontamination: A Mini-Review. J. Environ. Manag. 2020, 254, 109787. [Google Scholar]
- Guo, G.; Guo, H.; Wang, F.; France, L.J.; Yang, W.; Mei, Z.; Yu, Y. Dye-Sensitized TiO2@SBA-15 Composites: Preparation and Their Application in Photocatalytic Desulfurization. Green Energy Environ. 2020, 5, 114–120. [Google Scholar] [CrossRef]
- Fathi Vavsari, V.; Mohammadi Ziarani, G.; Badiei, A. The Role of SBA-15 in Drug Delivery. RSC Adv. 2015, 5, 91686–91707. [Google Scholar]
- Bérubé, F.; Kleitz, F.; Kaliaguine, S. A Comprehensive Study of Titanium-Substituted SBA-15 Mesoporous Materials Prepared by Direct Synthesis. J. Phys. Chem. C 2008, 112, 14403–14411. [Google Scholar] [CrossRef]
- Zhao, D.; Feng, J.; Huo, Q.; Melosh, N.; Fredrickson, G.H.; Chmelka, B.F.; Galen, D.S. Triblock Copolymer Syntheses of Mesoporous Silica with Periodic 50 to 300 Angstrom Pores. Science 1998, 279, 548–552. [Google Scholar] [CrossRef]
- Pham, X.N.; Nguyen, M.B.; Doan, H.V. Direct Synthesis of Highly Ordered Ti-Containing Al-SBA-15 Mesostructured Catalysts from Natural Halloysite and Its Photocatalytic Activity for Oxidative Desulfurization of Dibenzothiophene. Adv. Powder Technol. 2020, 31, 3351–3360. [Google Scholar] [CrossRef]
- Zhao, Y.; Wang, W.; Jing, X.; Gong, X.; Wen, H.; Deng, Y. Catalytic Cracking of Polypropylene by Using Fe-SBA-15 Synthesized in an Acid-Free Medium for Production of Light Hydrocarbon Oils. J. Anal. Appl. Pyrolysis 2020, 146, 104755. [Google Scholar] [CrossRef]
- Qiang, T.; Zhao, J.; Li, J. Direct Synthesis of Homogeneous Zr-Doped SBA-15 Mesoporous Silica via Masking Zirconium Sulfate. Microporous Mesoporous Mater. 2018, 257, 162–174. [Google Scholar] [CrossRef]
- Ortega-Domínguez, R.A.; Vargas-Villagrán, H.; Peñaloza-Orta, C.; Saavedra-Rubio, K.; Bokhimi, X.; Klimova, T.E. A Facile Method to Increase Metal Dispersion and Hydrogenation Activity of Ni/SBA-15 Catalysts. Fuel 2017, 198, 110–122. [Google Scholar] [CrossRef]
- Kosmulski, M.; Mączka, E. Modification of SBA-15 with Vapors of Aluminum and Titanium Chlorides. Colloids Surf. A Physicochem. Eng. Asp. 2017, 535, 61–68. [Google Scholar] [CrossRef]
- Kosmulski, M.; Mączka, E. Novel Route of Synthesis of Sn-Coated SBA-15. J. Porous Mater. 2019, 26, 803–811. [Google Scholar] [CrossRef] [Green Version]
- Ruchomski, L.; Pikus, S.; Pikula, T.; Mączka, E.; Kosmulski, M. Synthesis and Properties of Fe/SBA-15. Colloids Surf. A Physicochem. Eng. Asp. 2020, 599, 124922. [Google Scholar] [CrossRef]
- Sanches, S.G.; Flores, J.H.; da Silva, M.I.P. Ti Dispersion on SBA-15 Porous Host to Enhance Photocatalytic Hydrogen Production. J. Mol. Struct. 2018, 1170, 9–17. [Google Scholar] [CrossRef]
- Zhang, W.H.; Lu, J.; Han, B.; Li, M.; Xiu, J.; Ying, P.; Li, C. Direct Synthesis and Characterization of Titanium-Substituted Mesoporous Molecular Sieve SBA-15. Chem. Mater. 2002, 14, 3413–3421. [Google Scholar] [CrossRef]
- Lin, Y.C.; Chang, C.C.; Sung, K.H.; Lee, J.F.; Cheng, S. Importance of Solvents in Preparing Highly Active Ti-SBA-15 Catalysts by Grafting Method. Microporous Mesoporous Mater. 2018, 272, 276–285. [Google Scholar] [CrossRef]
- Chang, C.C.; Lee, J.F.; Cheng, S. Highly Catalytically Active Micro/Meso-Porous Ti-MCM-36 Prepared by a Grafting Method. J. Mater. Chem. A 2017, 5, 15676–15687. [Google Scholar] [CrossRef]
- Sze, A.; Erickson, D.; Ren, L.; Li, D. Zeta-Potential Measurement Using the Smoluchowski Equation and the Slope of the Current-Time Relationship in Electroosmotic Flow. J. Colloid Interface Sci. 2003, 261, 402–410. [Google Scholar] [CrossRef]
- Sigma Aldrich Safety Data Sheet for TTIP. Available online: https://www.sigmaaldrich.com/PL/en/sds/aldrich/205273 (accessed on 9 January 2023).
- Sigma Aldrich Safety Data Sheet for TNBT. Available online: https://www.sigmaaldrich.com/PL/en/sds/aldrich/244112 (accessed on 9 January 2023).
- Ojeda-López, R.; Pérez-Hermosillo, I.J.; Marcos Esparza-Schulz, J.; Cervantes-Uribe, A.; Domínguez-Ortiz, A. SBA-15 Materials: Calcination Temperature Influence on Textural Properties and Total Silanol Ratio. Adsorption 2015, 21, 659–669. [Google Scholar] [CrossRef]
- Li, L.L.; Sun, H.; Fang, C.J.; Xu, J.; Jin, J.Y.; Yan, C.H. Optical Sensors Based on Functionalized Mesoporous Silica SBA-15 for the Detection of Multianalytes (H+ and Cu2+) in Water. J. Mater. Chem. 2007, 17, 4492–4498. [Google Scholar] [CrossRef]
- Erdem, B.; Erdem, S.; Öksüzolu, R.M. Catalytic Applications of Large Pore Sulfonic Acid-Functionalized SBA-15 Mesoporous Silica for Esterification. Open Chem. 2018, 16, 1233–1241. [Google Scholar] [CrossRef]
- De Magalhães, G.O.; de Oliveira Notório Ribeiro, J.; Vasconcelos, D.C.L.; Vasconcelosa, W.L. Production of Pure Granules of SBA-15 Mesoporous Silica. Mater. Res. 2018, 21, 1–6. [Google Scholar] [CrossRef]
- Thahir, R.; Wahab, A.W.; La Nafie, N.; Raya, I. Synthesis of high surface area mesoporous silica SBA-15 by adjusting hydrothermal treatment time and the amount of polyvinyl alcohol. Open Chem. 2019, 17, 963–971. [Google Scholar] [CrossRef]
- Socrates, G. Infrared and Raman Characteristic Group Frequencies: Tables and Charts, 3rd ed.; John Wiley & Sons Ltd.: Middlesex, UK, 2004; ISBN 978-0-470-09307-8. [Google Scholar]
- Burgos, M.; Langlet, M. The Sol-Gel Transformation of TIPT Coatings: A FTIR Study. Thin Solid Film. 1999, 349, 19–23. [Google Scholar] [CrossRef]
- Garkusha, I.; Nagy, A.; Guennoun, Z.; Maier, J.P. Electronic Absorption Spectrum of Titanium Dioxide in Neon Matrices. Chem. Phys. 2008, 353, 115–118. [Google Scholar] [CrossRef]
- Agarwal, S.; Rai, V.R. Surface Reaction Mechanisms during Ozone-Based Atomic Layer Deposition of Titanium Dioxide. J. Phys. Chem. C 2008, 112, 9552–9554. [Google Scholar] [CrossRef]
- Velasco, M.J.; Rubio, F.; Rubio, J.; Oteo, J.L. Hydrolysis of Titanium Tetrabutoxide. Study by FT-IR Spectroscopy. Spectrosc. Lett. 1999, 32, 289–304. [Google Scholar] [CrossRef]
- Das, N.; Eckert, H.; Hu, H.; Wachs, I.E.; Walzer, J.F.; Feher, F.J. Bonding States of Surface Vanadium(V) Oxide Phases on Silica: Structural Characterization by 51 V NMR and Raman Spectroscopy. J. Phys. Chem. 1993, 97, 8240–8243. [Google Scholar] [CrossRef]
- Du, G.; Lim, S.; Pinault, M.; Wang, C.; Fang, F.; Pfefferle, L.; Haller, G.L. Synthesis, Characterization, and Catalytic Performance of Highly Dispersed Vanadium Grafted SBA-15 Catalyst. J. Catal. 2008, 253, 74–90. [Google Scholar] [CrossRef]
- Rasalingam, S.; Peng, R.; Koodali, R.T. Removal of Hazardous Pollutants from Wastewaters: Applications of TiO2-SiO2 Mixed Oxide Materials. J. Nanomater. 2014, 2014, 617405. [Google Scholar] [CrossRef]
- Shen, J.; Hess, C. High Surface Srea VOx/TiO2/SBA-15 Model Catalysts for Ammonia SCR Prepared by Atomic Layer Deposition. Catalysts 2020, 10, 1386. [Google Scholar] [CrossRef]
- Cattaneo, A.S.; Ferrara, C.; Villa, D.C.; Angioni, S.; Milanese, C.; Capsoni, D.; Grandi, S.; Mustarelli, P.; Allodi, V.; Mariotto, G.; et al. SBA-15 Mesoporous Silica Highly Functionalized with Propylsulfonic Pendants: A Thorough Physico-Chemical Characterization. Microporous Mesoporous Mater. 2016, 219, 219–229. [Google Scholar] [CrossRef]
- Hearne, G.R.; Zhao, J.; Dawe, A.M.; Pischedda, V.; Maaza, M.; Nieuwoudt, M.K.; Kibasomba, P.; Nemraoui, O.; Comins, J.D.; Witcomb, M.J. Effect of Grain Size on Structural Transitions in Anatase TiO2: A Raman Spectroscopy Study at High Pressure. Phys. Rev. B Condens. Matter Mater. Phys. 2004, 70, 134102. [Google Scholar] [CrossRef]
- Tompsett, G.A.; Bowmaker, G.A.; Cooney, R.P.; Metson, J.B.; Rodgers, K.A.; Seakins, J.M. The Raman Spectrum of Brookite, TiO2 (Pbca, Z = 8). J. Raman Spectrosc. 1995, 26, 57–62. [Google Scholar] [CrossRef]
- Kelly, S.; Pollak, F.H.; Tomkiewicz, M. Raman Spectroscopy as a Morphological Probe for TiO2 Aerogels. J. Phys. Chem. B 1997, 101, 2730–2734. [Google Scholar] [CrossRef]
- Tarre, A.; Möldre, K.; Niilisk, A.; Mändar, H.; Aarik, J.; Rosental, A. Atomic Layer Deposition of Epitaxial TiO2 II on c-Sapphire. J. Vac. Sci. Technol. A Vac. Surf. Film. 2013, 31, 01A118. [Google Scholar] [CrossRef]
- Lubas, M.; Jasinski, J.J.; Sitarz, M.; Kurpaska, L.; Podsiad, P.; Jasinski, J. Raman Spectroscopy of TiO2 Thin Films Formed by Hybrid Treatment for Biomedical Applications. Spectrochim. Acta Part A Mol. Biomol. Spectrosc. 2014, 133, 867–871. [Google Scholar] [CrossRef]
- Hardcastle, F. Raman Spectroscopy of Titania (TiO2) Nanotubular Water-Splitting Catalysts. J. Ark. Acad. Sci. 2011, 65, 43–48. [Google Scholar]
- Hamilton, N.; Wolfram, T.; Tzolova Müller, G.; Hävecker, M.; Kröhnert, J.; Carrero, C.; Schomäcker, R.; Trunschke, A.; Schlögl, R. Topology of Silica Supported Vanadium-Titanium Oxide Catalysts for Oxidative Dehydrogenation of Propane. Catal. Sci. Technol. 2012, 2, 1346–1359. [Google Scholar] [CrossRef]
- Lohse, B.H.; Calka, A.; Wexler, D. Raman Spectroscopy as a Tool to Study TiC Formation during Controlled Ball Milling. J. Appl. Phys. 2005, 97, 114912. [Google Scholar] [CrossRef]
- Nolan, N.T.; Seery, M.K.; Pillai, S.C. Spectroscopic Investigation of the Anatase-to-Rutile Transformation of Sol-Gel-Synthesized TiO2 Photocatalysts. J. Phys. Chem. C 2009, 113, 16151–16157. [Google Scholar] [CrossRef]
- Iritani, E.; Hashimoto, T.; Katagiri, N. Gravity Consolidation-Sedimentation Behaviors of Concentrated TiO2 Suspension. Chem. Eng. Sci. 2009, 64, 4414–4423. [Google Scholar] [CrossRef]
- Loosli, F.; Le Coustumer, P.; Stoll, S. Impact of Alginate Concentration on the Stability of Agglomerates Made of TiO2 Engineered Nanoparticles: Water Hardness and PH Effects. J. Nanoparticle Res. 2015, 17, 44. [Google Scholar] [CrossRef]
- Mikhailova, S.L.; Prikhodko, O.Y.; Mukhametkarimov, Y.S.; Dautkhan, K.; Doseke, U.A.; Kozyukhin, S.A.; Kozik, V.V.; Ismailova, G.A.; Maksimova, S.Y.; Tarapeyeva, A.Y.; et al. Thermal Stability of the Structure and Optical Properties of Nanostructured TiO2 Films. Russ. Phys. J. 2021, 63, 2045–2051. [Google Scholar] [CrossRef]
- Kumari, Y.; Jangir, L.K.; Kumar, A.; Kumar, M.; Awasthi, K. Investigation of Thermal Stability of TiO2 Nanoparticles Using 1-Thioglycerol as Capping Agent. Solid State Commun. 2017, 263, 1–5. [Google Scholar] [CrossRef]
- Thommes, M.; Kaneko, K.; Neimark, A.V.; Olivier, J.P.; Rodriguez-Reinoso, F.; Rouquerol, J.; Sing, K.S.W. Physisorption of Gases, with Special Reference to the Evaluation of Surface Area and Pore Size Distribution (IUPAC Technical Report). Pure Appl. Chem. 2015, 87, 1051–1069. [Google Scholar] [CrossRef] [Green Version]


| Sample | Ti:Si a | Adsorption Conditions | SSA [m2∙g−1] | Pore Volume [cm3∙g−1] | Micropore Volume [cm3∙g−1] | Pore Size [nm] | Weight Gain b [%] |
|---|---|---|---|---|---|---|---|
| SBA-15 | – | – | 1000.8 | 1.250 | 0.096 | 5.0 | 0 |
| Ti1 | 0.33 | 190 °C, 1 d | 807.9 | 1.107 | 0.067 | 5.5 | 11.68 |
| Ti2 | 0.23 | 190 °C, 1 d | 730.5 | 0.995 | 0.060 | 5.5 | 14.34 |
| Ti3 | 0.22 | 190 °C, 1 d | 718.3 | 0.984 | 0.069 | 5.5 | 23.34 |
| Ti4 | 0.27 | 190 °C, 1 d | 721.7 | 0.952 | 0.086 | 5.3 | 28.88 |
| Ti5 | 0.71 | 180 °C, 2 d | 680.5 | 0.919 | 0.078 | 5.4 | 32.72 |
| Ti6 | 0.68 | 180 °C, 2 d | 757.8 | 0.910 | 0.094 | 4.8 | 34.84 |
| Ti7 | 0.19 | 200 °C, 1 d | 764.7 | 0.980 | 0.093 | 5.1 | 37.18 |
| Ti8 | 0.48 | 180 °C, 2 d | 729.2 | 0.750 | 0.069 | 4.1 | 37.57 |
| Ti9 | 1.50 | 180 °C, 2 d | 684.0 | 0.786 | 0.071 | 4.6 | 40.25 |
| Ti10 | 1.05 | 180 °C, 2 d | 625.0 | 0.581 | 0.057 | 3.7 | 40.85 |
| Ti11 | 0.86 | 180 °C, 2 d | 676.7 | 0.807 | 0.102 | 4.8 | 41.92 |
| Ti12 | 1.46 | 180 °C, 2 d | 620.9 | 0.830 | 0.104 | 5.3 | 42.26 |
| Ti13 | 0.49 | 180 °C, 2 d | 647.9 | 0.773 | 0.068 | 4.8 | 47.49 |
| Ti14 | 0.48 | 190 °C, 2 d | 910.2 | 1.198 | 0.084 | 5.3 | 0.75 |
| Ti15 | 0.43 | 190 °C, 2 d | 811.5 | 1.127 | 0.078 | 5.6 | 1.17 |
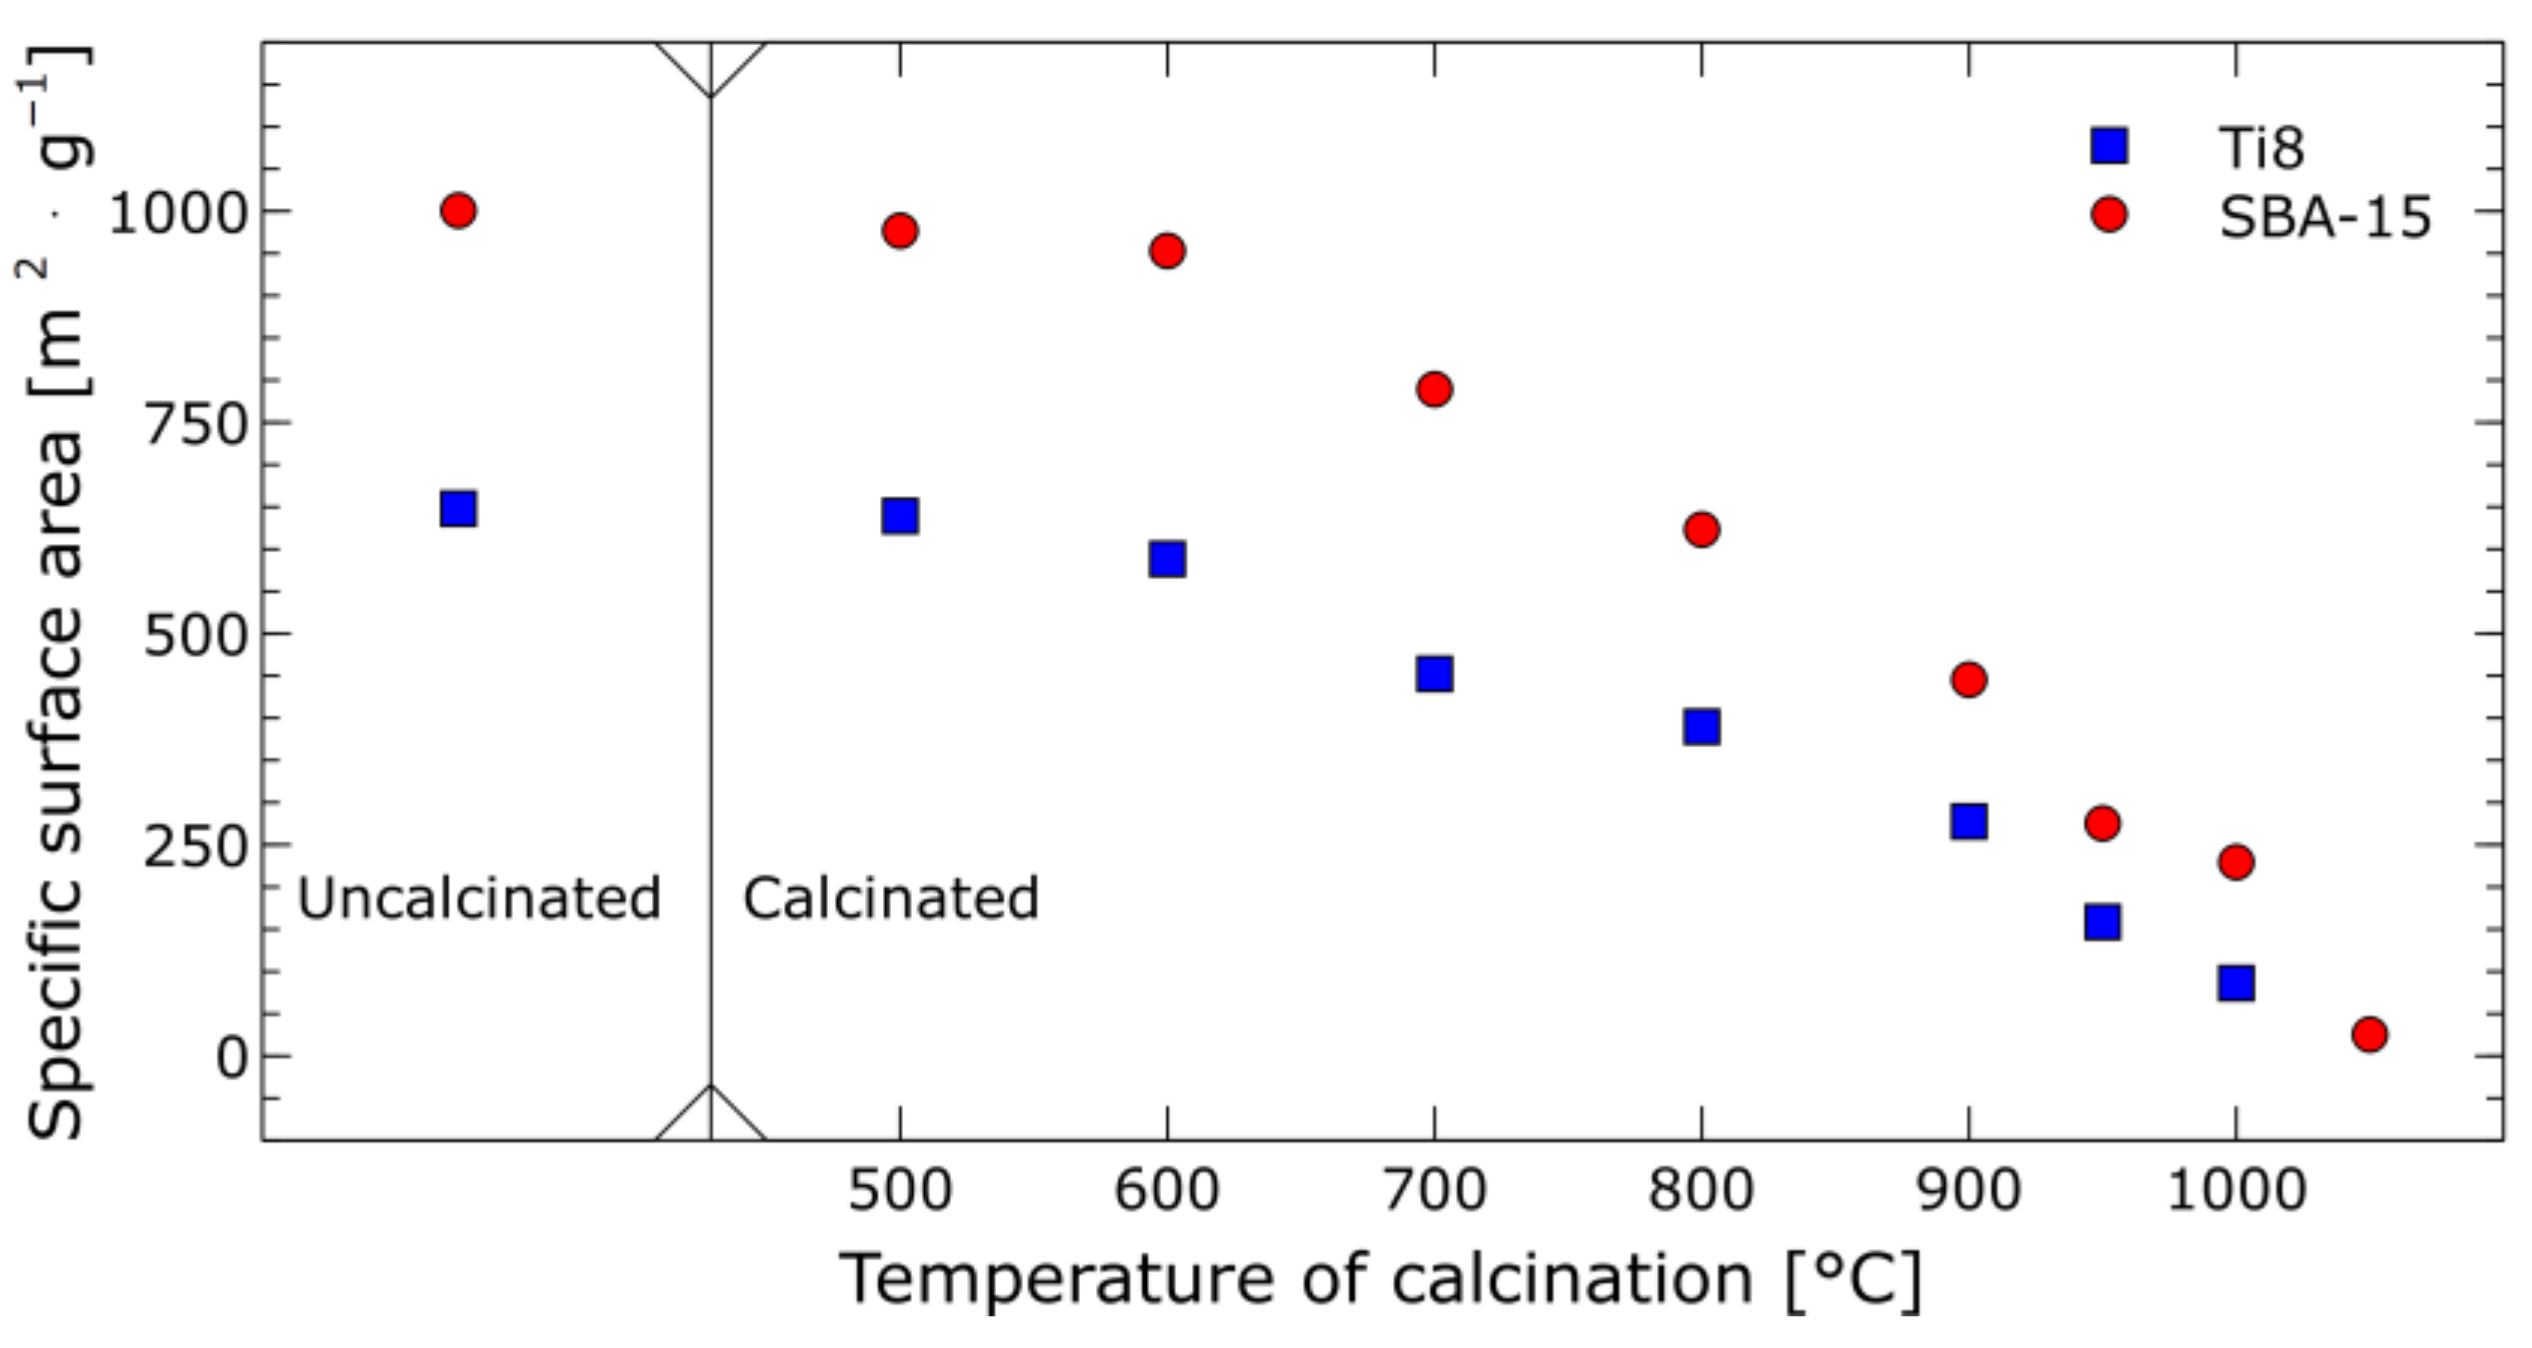
| Calcination Temperature [°C] | SSA [m2·g−1] | Pore Volume [cm3·g−1] | Micropore Volume [m3·g−1] | Pore Size [nm] |
| uncalcined | 647.9 | 0.773 | 0.068 | 4.8 |
| 500 | 639.2 | 0.817 | 0.077 | 5.1 |
| 600 | 588.3 | 0.774 | 0.060 | 5.3 |
| 700 | 452.3 | 0.634 | 0.035 | 5.6 |
| 800 | 389.7 | 0.612 | 0.019 | 6.3 |
| 900 | 277.6 | 0.403 | 0.002 | 7.1 |
| 950 | 158.6 | 0.270 | negative value | 6.8 |
| 1000 | 86.2 | 0.163 | negative value | 7.6 |
Disclaimer/Publisher’s Note: The statements, opinions and data contained in all publications are solely those of the individual author(s) and contributor(s) and not of MDPI and/or the editor(s). MDPI and/or the editor(s) disclaim responsibility for any injury to people or property resulting from any ideas, methods, instructions or products referred to in the content. |
© 2023 by the authors. Licensee MDPI, Basel, Switzerland. This article is an open access article distributed under the terms and conditions of the Creative Commons Attribution (CC BY) license (https://creativecommons.org/licenses/by/4.0/).
Share and Cite
Ruchomski, L.; Ozimek, J.; Siedliska, K.; Raftopoulos, K.N.; Pielichowski, K. Characterization of Ti/SBA-15 Composites Synthesized by Chemical Vapour Deposition of Organic Titanium Compounds. Crystals 2023, 13, 288. https://doi.org/10.3390/cryst13020288
Ruchomski L, Ozimek J, Siedliska K, Raftopoulos KN, Pielichowski K. Characterization of Ti/SBA-15 Composites Synthesized by Chemical Vapour Deposition of Organic Titanium Compounds. Crystals. 2023; 13(2):288. https://doi.org/10.3390/cryst13020288
Chicago/Turabian StyleRuchomski, Leszek, Jan Ozimek, Karolina Siedliska, Konstantinos N. Raftopoulos, and Krzysztof Pielichowski. 2023. "Characterization of Ti/SBA-15 Composites Synthesized by Chemical Vapour Deposition of Organic Titanium Compounds" Crystals 13, no. 2: 288. https://doi.org/10.3390/cryst13020288