

The Indentation Size Effect (ISE) of Ag–Cu Alloys


Institute of Materials and Quality Engineering, Faculty of Materials, Metallurgy and Recycling, Technical University of Kosice, Letna 1/9, 04200 Kosice-Sever, Slovakia
*
Author to whom correspondence should be addressed.
Crystals 2023, 13(1), 91; https://doi.org/10.3390/cryst13010091
Submission received: 6 December 2022
/
Revised: 22 December 2022
/
Accepted: 30 December 2022
/
Published: 4 January 2023
(This article belongs to the Special Issue Recent Developments of Inorganic Crystalline Materials)
Abstract
:The literature regarding the Indentation Size Effect (ISE) in metal alloys is scarce. The content of this article is the study of the relationship between the applied load and the measured values of the Vickers micro-hardness of silver and copper alloys, measured with a Hanemann hardness tester. The load values ranged between 0.09807 N (10 g) and 0.9807 N (100 g). The size and character of the ISE were evaluated using Meyer’s power law (index n), Proportional Specimen Resistance (PSR) and the Hays–Kendall method. Coins and utility objects of Central European provenance with a silver content of 50 to 99.99% were used as samples. All samples showed a reverse effect (RISE) with a value of n > 2, which is typical for plastic materials. The relatively high variability of the measured micro-hardness and consequently of the index n is related to other factors, such as the age of the sample (age hardening by the precipitation of copper), the uneven degree of deformation and microstructure. The analyzed Ag–Cu alloys show a gradual increase in the Meyer index n with the increase in the silver content, while the ISE has a reverse character throughout the range. The obtained data make it possible to determine the approximate age of artifacts from the mentioned alloys.
1. Introduction
The quality of materials used in industry is very important nowadays, both from the point of view of the guaranteed properties of the manufacturer’s product, and also from the point of view of the customer to whom the product is delivered [1]. It is important that all the properties of the materials that are used to manufacture the various products meet the criteria specified by the customer. These specific criteria must of course also be met from the point of view of legislation and from the point of view of standards that are valid for the use of a given type of product in an international environment.
The main task of the production and measurement process is to prevent various problems on the part of the manufacturer so that the customer is more than satisfied and returns to the supplier again. If various problems occur in the production process or during the measurement process, it is important to find out the real causes of the problems and eliminate them immediately [2,3].
The aim of our research was the measurement of the mechanical properties of alloys, namely the measurement of the micro-hardness of alloys. This micro-hardness measurement has the advantage that the measurement process does not damage the final product and the measurement process generally does not require the use of any special samples. On the other hand, the micro-hardness measurement process is sensitive to the test load, which distorts the measurement result as an ISE effect.
Silver is a light-colored metal with high light reflectance and the highest electrical and thermal conductivity among other metals. It is very malleable and can therefore be easily forged into very thin foils. The highest commercially achievable purity of silver is 99.95% (nominally considered 100%). Because of its softness and susceptibility to damage, silver is rarely used in its pure form, and mainly for the production of commemorative coins or medals, or as investment silver [4,5].
The mechanical properties of silver are significantly improved by various additives; the alloys are usually cheaper and at the same time retain the properties of pure silver. To increase hardness and strength, it is usually alloyed with copper. Silver and copper alloys are the two-component mixtures of metals in different percentages. The silver content in the alloy determines its purity [6]. As the copper content increases to 28%, the hardness and strength of Ag–Cu alloys increases and their ductility decreases. The color of silver becomes more and more yellowish with increasing copper content. A silver alloy with 50% copper becomes reddish and with 70% copper-red.
2. Characteristics of the Use of Ag–Cu Alloys in Practice
Possibilities of practical use of Ag–Cu alloys can be divided into two basic groups:
2.1. Ag–Cu Alloys Intended for Practical Use, Especially for the Production of Jewelry, Utensils, Table Decorations and Coins
The best-known Ag–Cu alloy is Sterling silver. It is a silver alloy containing 92.5% by weight of silver and 7.5% by weight of other metals, most often copper. Sterling silver is used for making jewelry, fine cutlery, watch cases and coins. The product retains its plasticity and is characterized by a noble shade. It is obtained by melting pure silver at 893 °C. Copper added under such conditions not only combines with the main component but also dissolves in it without residue and forms a solid solution. The mixing of the components alone is not enough; after the melting process, the material is first fired to remove the inhomogeneity of the metal and to increase its strength. To achieve the necessary plasticity of the alloy, it is necessary to harden it and then subject it to aging. After this stage, coin silver becomes 2.5 times stronger. The product processing is completed by cleaning and bleaching.
Mint silver is another type of Ag–Cu alloy. The silver content is at the level of Sterling silver or less (around 90%); it is commonly used for plating and in the jewelry industry [7]. The main advantages of coin silver are its attractive appearance and ductility with its high strength of an alloy. It is not prone to oxidation, and its products are durable enough for everyday use. Coin silver has bactericidal properties. The metal does not irritate the skin and after contact no stains remain on it. Silver is resistant to external influences and does not corrode. AgCu7.5, AgCu8 and AgCu10 alloys are suitable for the production of coins [3].
When alloying silver with copper, it must be remembered that silver has a high affinity for oxygen, which increases with temperature. When molten silver is exposed to air, it absorbs oxygen during the casting process. As with silver, copper also has a high affinity for oxygen, usually forming a copper oxide. The tendency of copper to oxidize when in contact with oxygen over time leads to a dark coating on the product. Therefore, unless air is excluded during the casting process, the cast product may be porous and characterized by the presence of internal voids. Thus, when smelting coin silver and other silver-copper alloys, care must be taken to prevent oxidation [5].
The alloys AgCu8.4, AgCu12.5, etc., are suitable for the production of decorations. Other types of silver alloys include, for example, Britannia or shibuichi silver. Britannia silver (95.84% silver and 4.16% copper) is cheaper than gold or platinum. It is also used to make tableware and in many countries as a currency. Shibuichi, an alloy consisting mostly of copper and 15 to 25% silver, was used in Japan for sword mountings [8].
2.2. Ag–Cu Alloys Intended for Industrial Use, Primarily in Electronics
Silver alloys intended for industrial use should generally be characterized by high electrical conductivity, as well as mechanical and functional properties that are stable even at elevated temperatures, wear resistance, resistance to unwanted welding and high corrosion resistance [5,9]. They find their application in the following electronic devices: contact wires, circuit breakers, voltage regulators, telephone relays, starters, conductive rings and circuit boards.
Because silver has the highest electrical conductivity of all metals, it is used in alloyed form to make electrical contacts. AgCu5, AgCu10, AgCu15, AgCu20, AgCuNi20-2, AgCu25, etc., are used as electrical contact materials. They have good mechanical properties, wear and welding resistance. It is mainly used for electrical contacts in high-voltage and high-current relays and circuits with low and medium loads [5].
Conductive wires made of AgCu alloys with a high Ag content, which are produced by the traditional melt casting method, subsequently require a series of heat treatments to avoid wire breakage during subsequent cold processing [6].
Silver and silver-copper alloys, although stable in air, become discolored in the presence of sulfur. To improve tarnish resistance, silver alloys with at least 40 percent palladium added are made for telephone relays, circuit breakers and other electrical switching devices. Silver electroplating is practiced to obtain silver’s luster and corrosion resistance on other metals and alloys. Palladium and nickel improve the metal’s chemical resistance to oxidation and sulfidation, as well as corrosion resistance [10].
AgCu7.5, AgCu25, AgCu28, AgCu55, etc., are used as the main soldering materials. They have good conductivity, fluidity and wettability. Due to their low resistance to long-term load at high temperature, they are only suitable for soldering parts whose working temperature is lower than 400 °C.
Silver solder fillers are suitable for soldering almost all types of steels and non-ferrous metals except aluminum, magnesium and titanium. Silver, copper and zinc alloys are a large group of silver alloys that are mainly used as solders. Silver solders are used when a low melting point is required and when the joint is to be stronger and tougher and more chemically resistant than can be achieved with brass solder. A typical composition of the solder alloy is 50 percent silver, 34 percent copper and 16 percent zinc [5,10]. Ag–CuO nanocomposites were developed as soldering materials for joining ceramics and metals [11]. Tin alloy (95%) with a small amount of copper and silver can also be used as a soldering material in electronic applications.
Cu-Ag alloys, which have high strength and high conductivity [9,12,13,14], are used as conductive materials in high-field pulse magnets [15].
In addition to these basic application areas, other possibilities for using Ag–Cu alloys are also being investigated. The application potential of Ag–Cu alloys has recently been moving into the area of nanoscale. Studies have been published that show the antibacterial effects of newly developed copper-silver alloy coatings. Copper helps deposit silver on the surface of the film, eventually forming Ag–Cu alloy nanoparticles. Testing the coatings in real conditions confirmed their high antibacterial efficiency against common pathogenic bacteria. Coating surfaces with a copper-silver alloy in clinical conditions can be an alternative to already existing disinfection measures [16,17,18]. The antifungal mechanisms of Ag–Cu alloy nanoparticles on wooden surfaces are also being analyzed [19].
The topic of silver and copper micro-hardness measurement was investigated by Petrík et al. [20]. They used technically pure or extremely pure semiconductor materials with a single-phase structure. The characteristics (the type and size) of the ISE effect were determined for these metals.
The micro-hardness test often serves for the provisional determination of mechanical properties. In contrast to Vickers (macro) hardness, “very low” loads are used in this case. The surface of the sample is subjected to a standard pressure for a standard time using a diamond pyramid with an apex angle of 136°. The diagonal length of the indentation, measured under a microscope, is inversely proportional to the hardness. The method requires the high-quality preparation of the measured surface. It should be kept in mind that the method of preparation of the measured surface (e.g., polishing time, roughness) can significantly affect the measured micro-hardness values and consequently the ISE.
Unlike (macro)hardness, indentations are small and can usually be tolerated even on the surface of the final product. It can also be used in metallography, for example, to determine the hardness of small particles or thin films and to identify individual phases.
Westbrook and Conrad state in [21] that “Hardness measurements are at once among the most maligned and the most magnificent of physical measurements” Maligned because they are often misinterpreted by the uninitiated, and magnificent because they are so effective in generating information for a competent/skilled practitioner.
Whereas the shape of the indentations in the Vickers method is geometrically similar, the measured value in the area of the (macro)hardness does not depend on the load. If the measured sample is sufficiently homogeneous, it is likely that the (macro)hardness will be practically the same.
If the load is “very low”, the measured hardness value becomes significantly affected by the load. The term “low load” is controversial. According to ISO 6507-1 ([22], Table 4), the loads for measuring micro-hardness range between 0.009807 N (1 g) and 0.9807 N (100 g). However, if we consider the recommendation of ISO 14577-1 [23], then the load for micro-hardness is less than 2 N (~200 g), while it is valid that the depth of the impression h > 0.2 μm.
If a “low load” is used and the measured micro-hardness values decrease with increasing load, a “normal“ ISE occurs. According to Gong et al. [24], the use of such influenced values in the interpretation may lead to unreliable conclusions.
The literature lists several reasons for the emergence of “normal” ISE, the most common of which are:
- The internal properties of the tested material, for example work hardening during indentation or penetration into the sample, indentation elastic recovery, the load needed to initiate plastic deformation, and the elastic resistance of the materials are possible sources in the work of Sangwal [28].
- The sample preparation method (grinding, polishing) and the resulting roughness [29].
In addition to the “normal” one, there is also a “reverse” ISE (RISE), in which the measured micro-hardness values increase as the load increases. It occurs in materials with dominant plastic deformation, mostly metals and alloys [25,28].
Regarding metallic materials, it is possible to say that the phenomenon of ISE is being studied primarily on single-phase materials. In the case of multiphase materials, the results are distorted by the fact that the indentation, especially with its small dimensions, can include only one phase or the interface of phases. As the test load increases and the dimensions of the indentations increase, the probability that the indentation will catch more phases increases and that the result will average out. It depends primarily on the ratio of the particle size of the given phase and its share in the structure on the one hand and the dimensions of the indentations on the other. A similar problem has been solved also in the evaluation of ISE in sintered materials [31].
To the small number of works focused on ISE alloys, we can assign the contribution of Chicot et al. [32], who experimented on copper and its alloys (bronze SAE660 with a content of 6.3–7.5 Sn and 6–8% Pb and brass 63/37 C27200 with a content of 37.5% Zn and 0.07% Pb at the load range from 0.05 N (50 g) to 30 N (3 kg)). Unfortunately, ISE is not quantified in the work, for example by Meyer’s index n.
It is also possible to mention an earlier work (1984) by Jönsson and S. Hogmark [33], where the effect of the load in the range of 0.049035 N (5 g)–2.9421 N (300 g) is analyzed by measuring the micro-hardness by the Vickers method of three types of steel and electrolytic copper with a very thin (down to a thickness of a few thousand ångströms, 1 A = 1×10⁻¹⁰ m, i.e., 10−4 μm) layer of chromium on the surface. Unfortunately, it also does not quantify the ISE of multiphase materials–steels, as the goal of the work was “the model... which separates the film hardness from the composite hardness”.
The thin layer on steels was also studied by Korsunsky et al. [34], p. 182. They used loads sufficient to break through this surface layer in the range of 0.49035 N (50 g) to 9.807 N (1000 g). As the authors state, in the presented analysis the impact of ISE on the measurements was consciously neglected, although the authors certainly had a rich database of data at their disposal. This is evidenced by the statement that the inclusion of ISE in the analysis required a more complicated approach and would be the subject of a future article.
H. Kaya et al. [35] measured the micro-hardness (HV0.05) of three Al alloys with 3% Si, Cu or Ti (note: three alloys) in the cast state under load. It was seen that the values of micro-hardness increased as the values of the primary dendrite arm spacing λ1, secondary dendrite arm spacing λ2, dendrite tip radius R and mushy zone depth d decreased.
The objective of this paper is to measure the (micro)hardness of Ag–Cu alloys with different silver contents, as well as that of reference samples of near-pure Ag and Cu at different loads, and subsequently to determine the types and sizes of ISEs, if any.
3. Materials and Methods
Considering the samples used—primarily coins or utility objects—the hardness was measured under small loads to avoid damage to the surface, i.e., in the range of microhardness. For the reasons stated below, possible measurement of nano-hardness was out of the question.
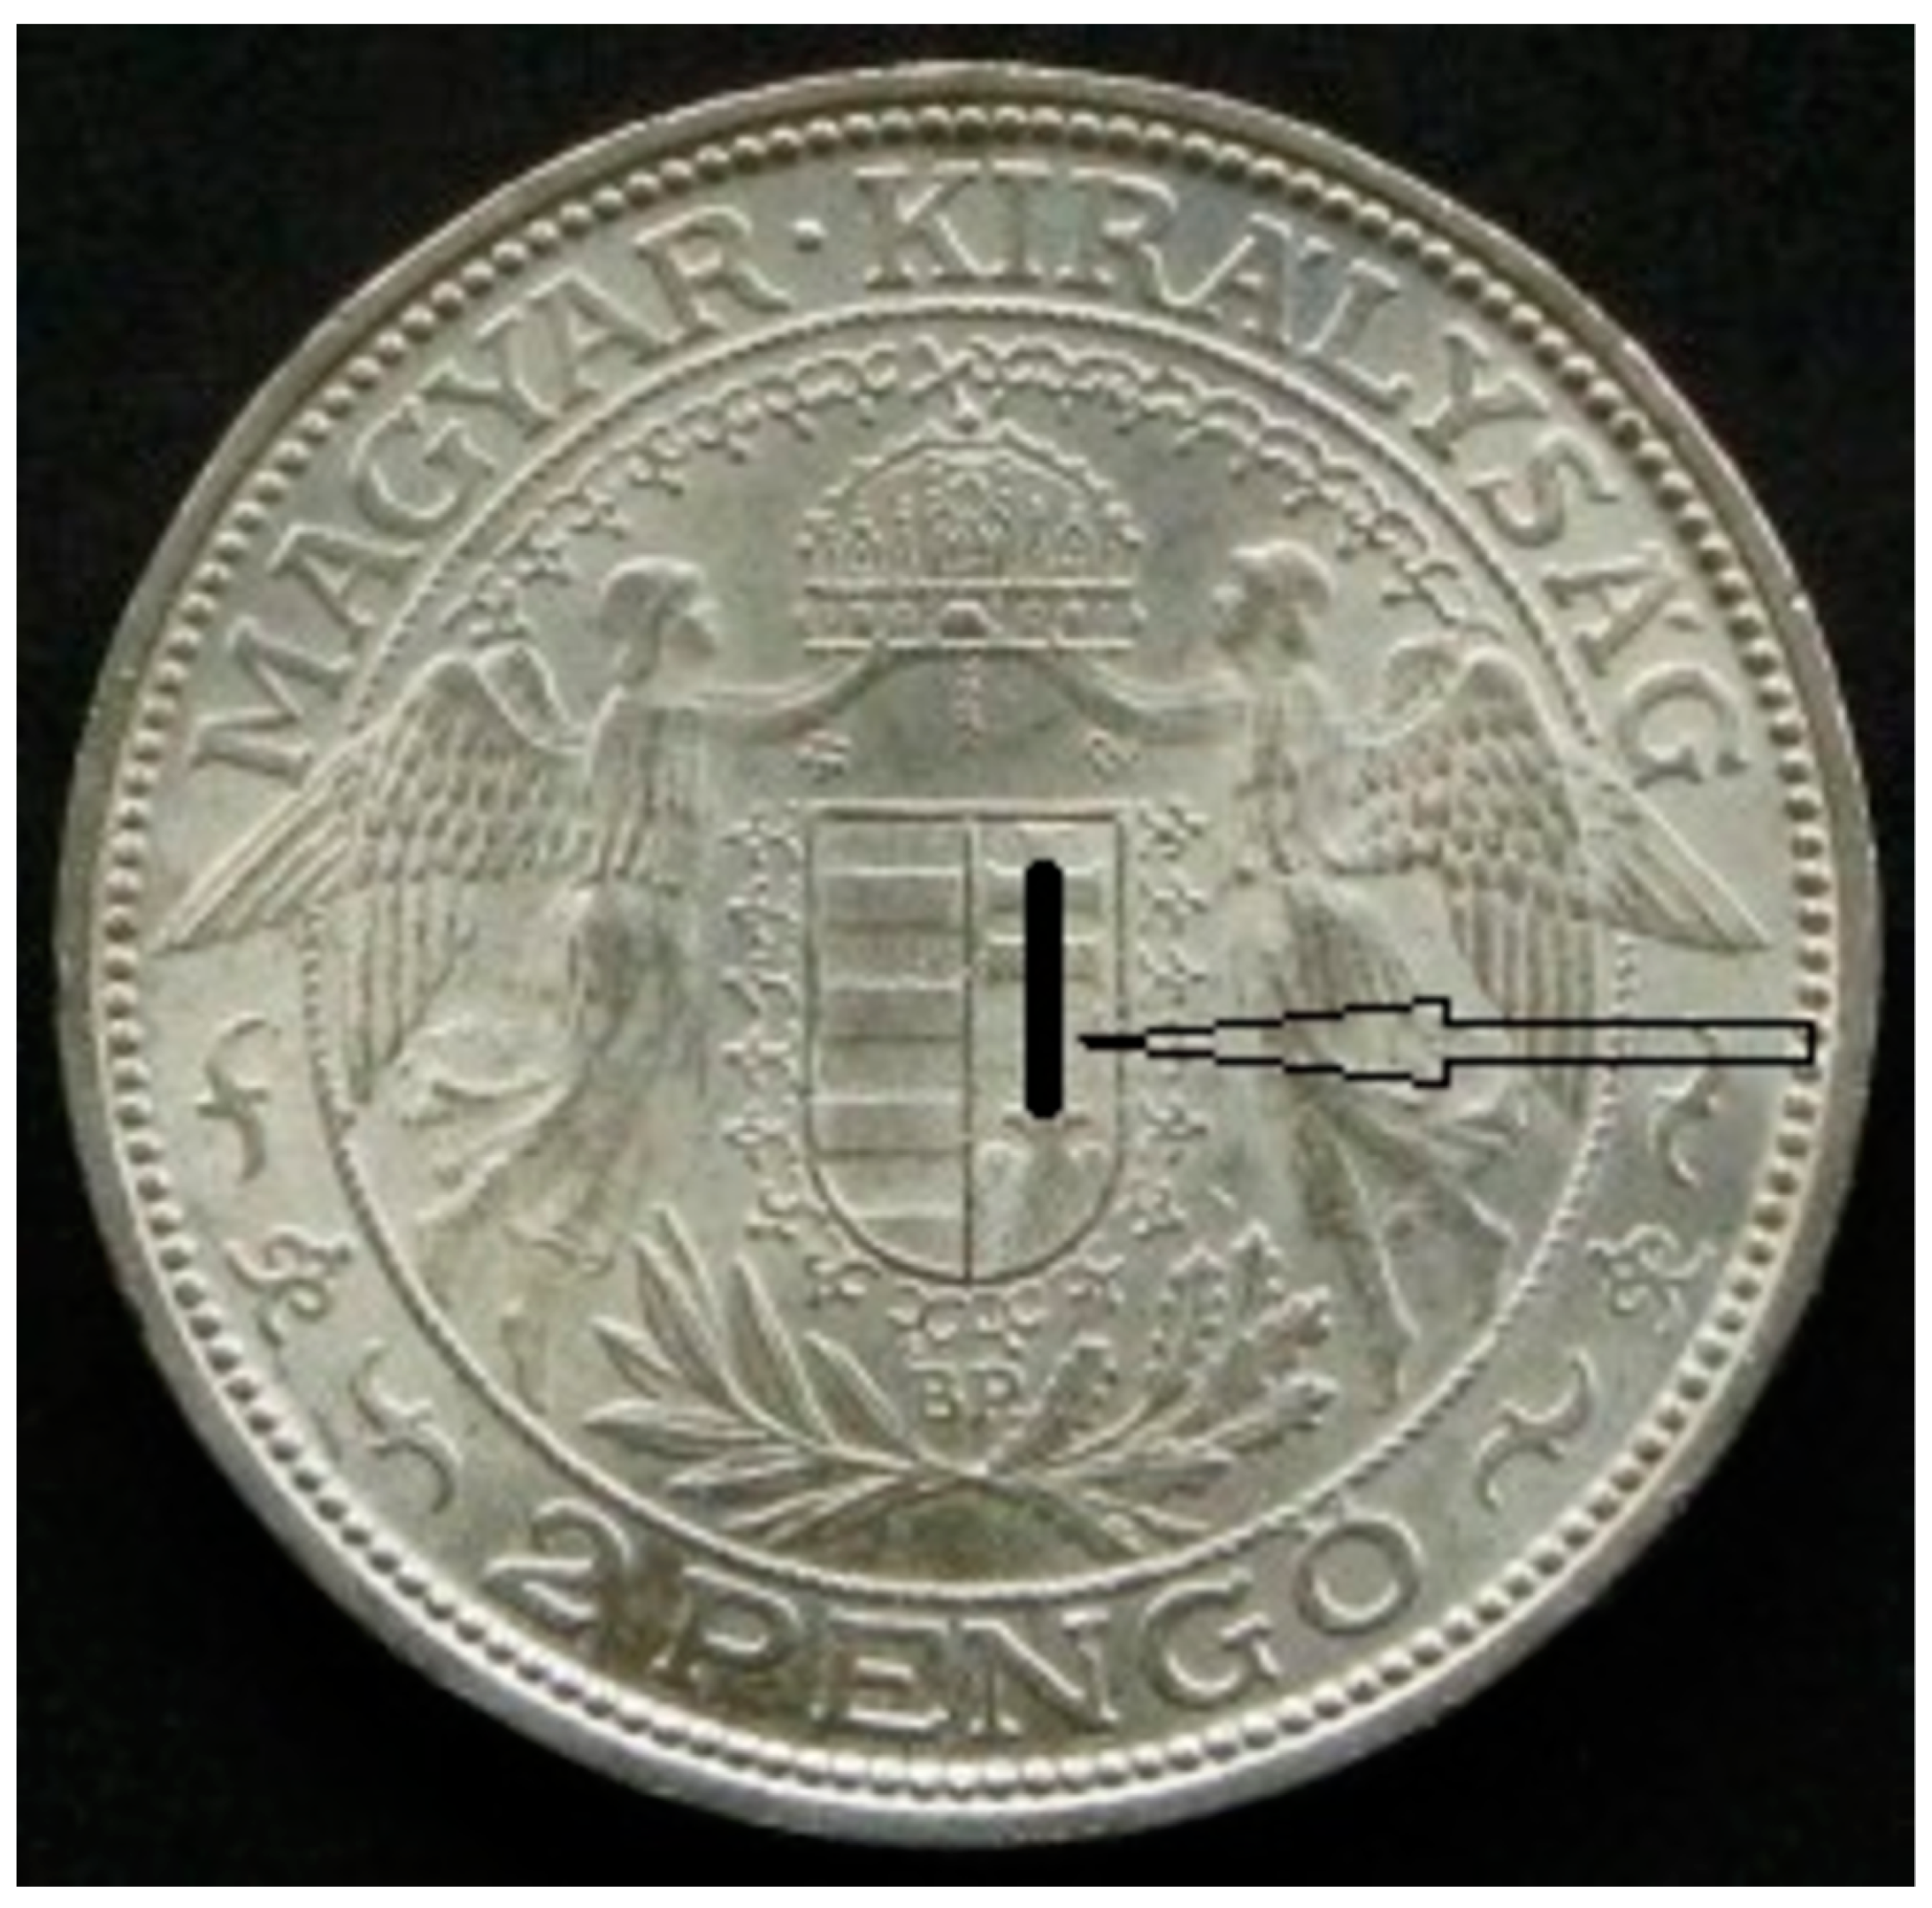
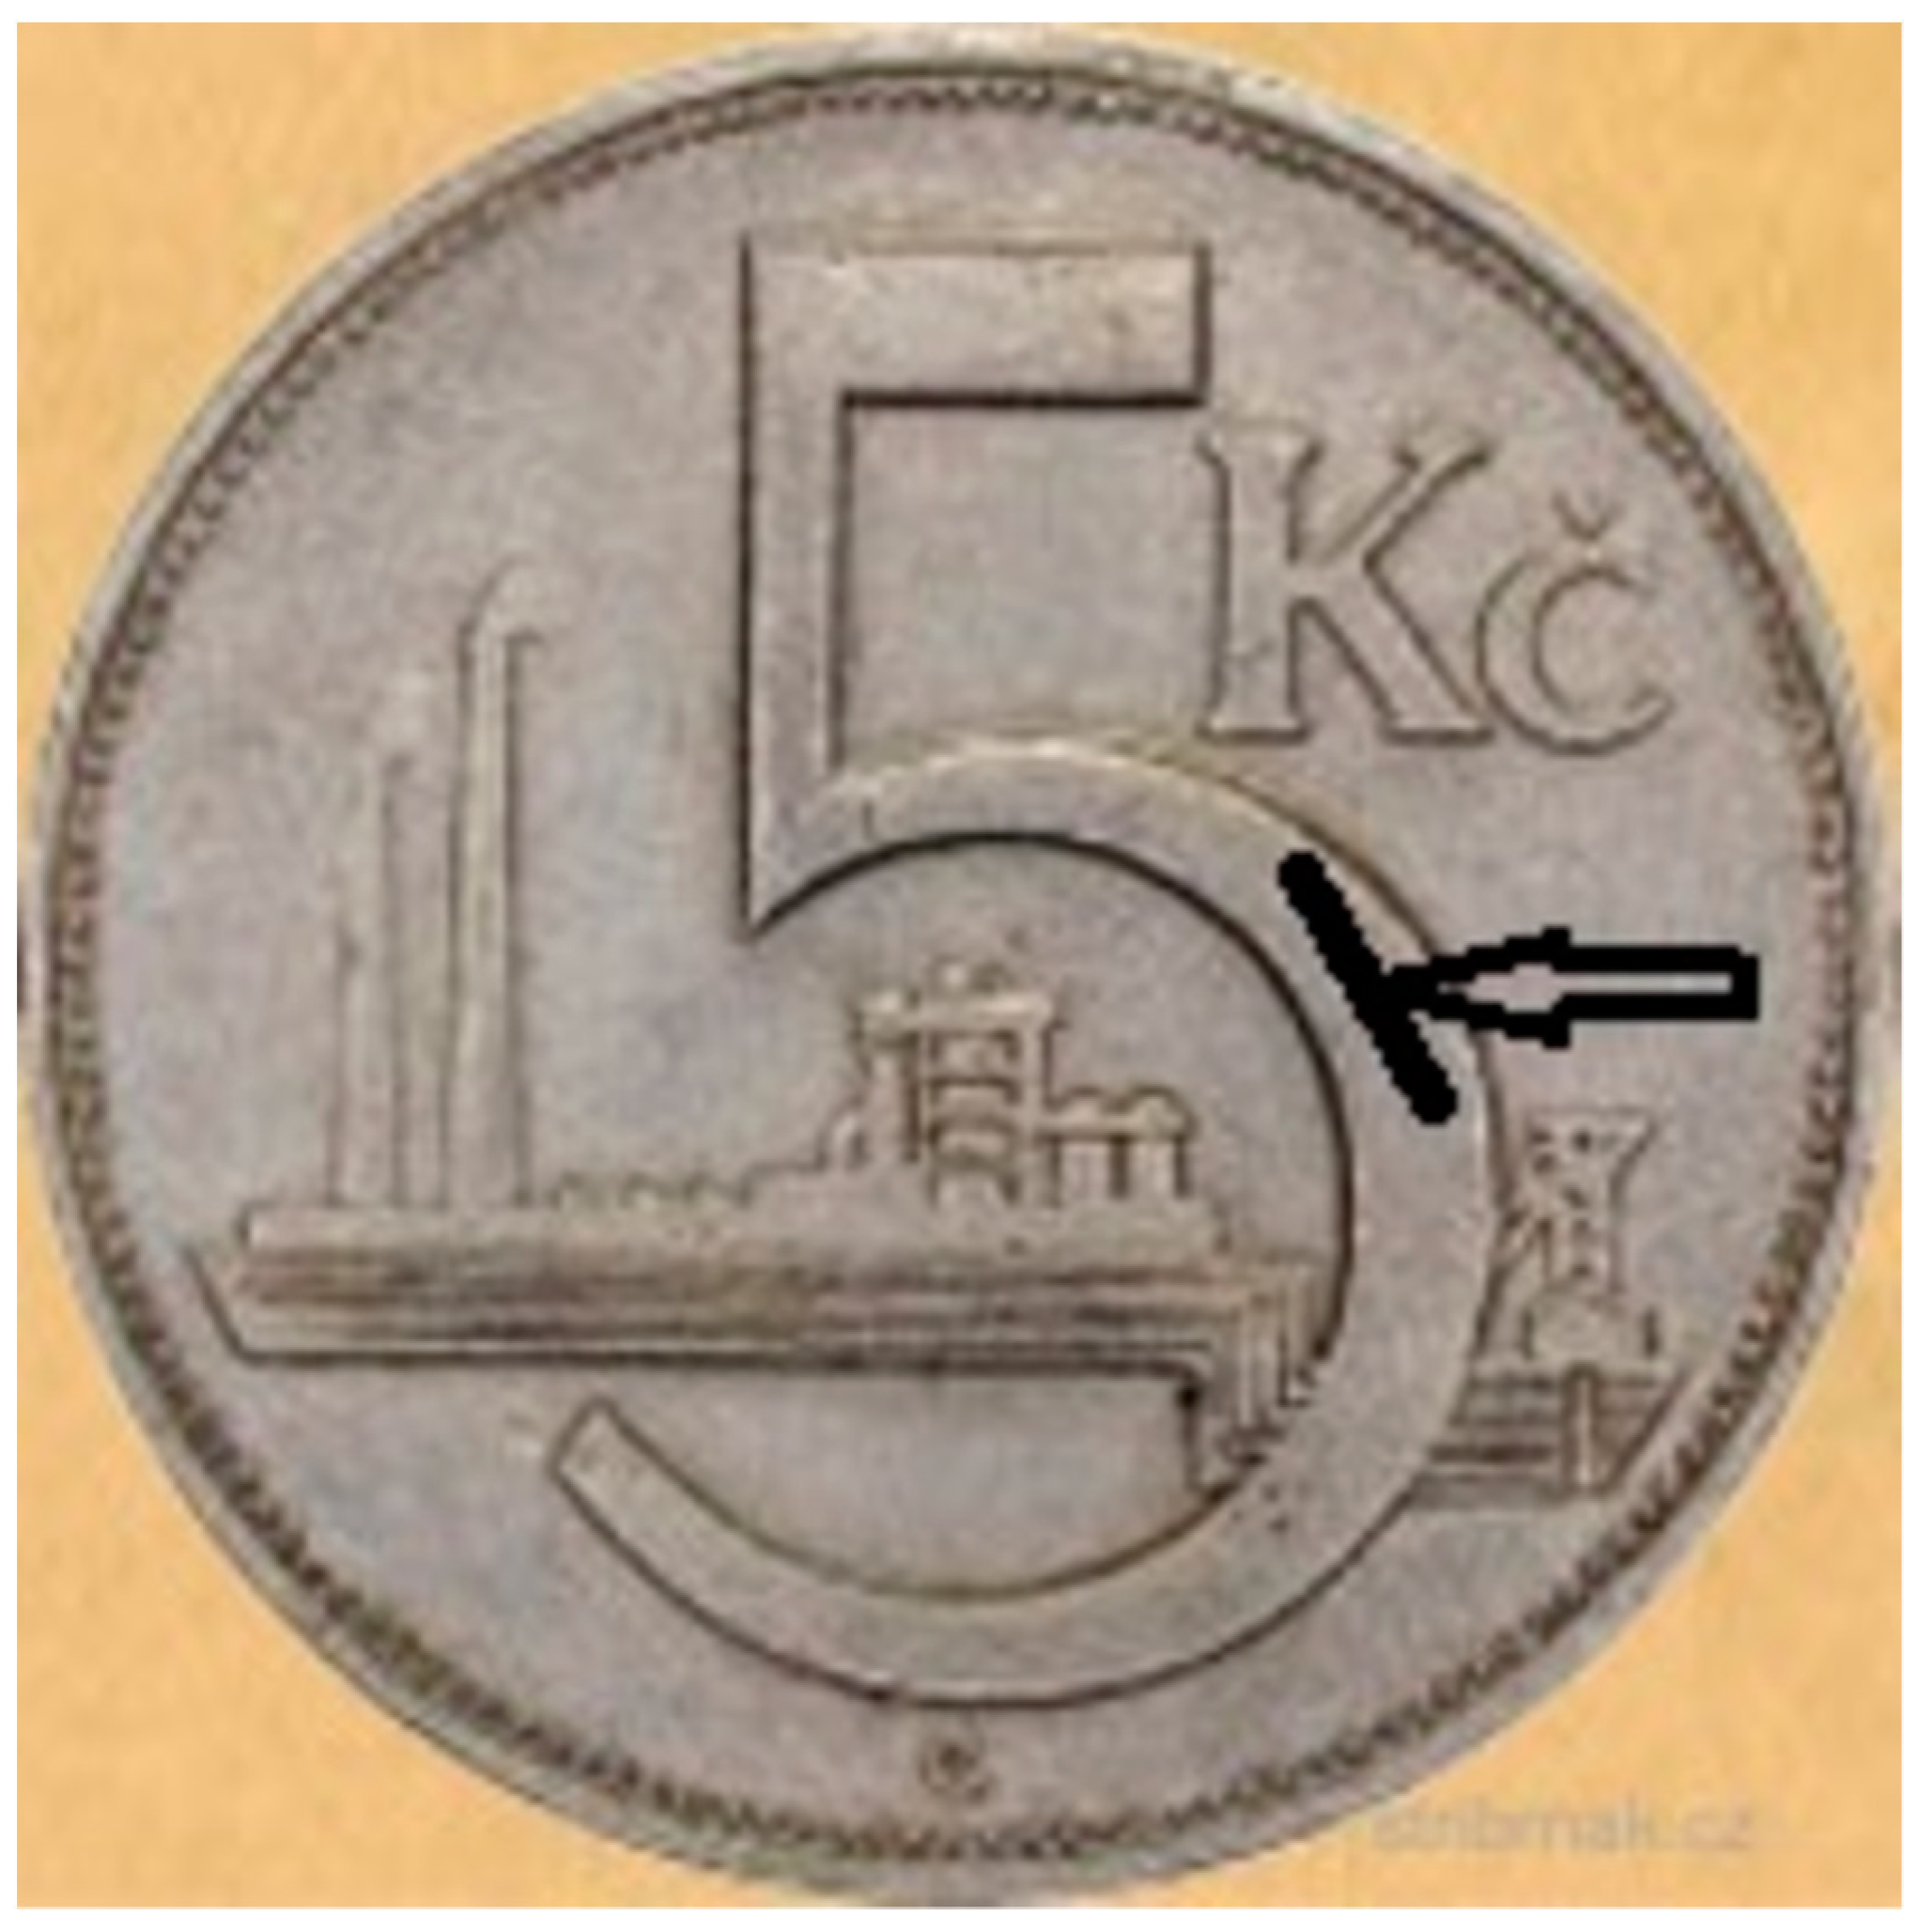
Electroconductive copper with a purity of 99.5% was used as the test material for comparison, and as the base material, the coins or other utility objects made of the Ag–Cu alloy with a content of 50–99.99% Ag, Table 1. Since for material reasons (except for samples 6, 9, 16) it was not possible to cut the samples, the hardness was measured on their surface, if possible on the most convex part (that is, where the smallest deformation was assumed, e.g., Figure 1 and Figure 2 (pengö, sample no. 13; 5 Kč, sample no. 16; the measurement locations are marked on the figures). Unfortunately, data on the technology/parameters of the final production operations (degree of deformation, whether the deformation was carried out cold or hot, possible heat treatment) are already practically unavailable. The content of secondary and trace elements (secondary and trace) was determined by spectral analysis with Niton XL3 Goldd and PGS 2 spectrometers. In addition to silver and copper, the samples contained Sn (up to 0.22%), Pb (up to 0.13%), Zn (up to 0.15%) and Fe (up to 0.82); some also contained traces of Au, Cd, Cr and V. Copper (sample no. 1) contained traces (up to 0.01%) of Fe, Mn, Ni, Co, Ag, Pb, Si, Sn, Ti, Zn and Al.
The silver samples were cleaned, especially from the surface oxidic layer, in an aqueous solution of 10% NaCl + 10% NaHCO3 heated to 90 °C in a container lined with aluminum foil. The sample was etched until a metallic luster surface was obtained. This was followed by fine polishing on a velvet disc with diamond grinding paste (0.5 μm grain size) moistened with kerosene. Samples 6, 9 and 16 were cut with a water-cooled diamond saw perpendicularly to the forming axis. After casting in epoxy resin (dentacryl), they were sanded on water-cooled sandpapers with a grain size of 220 to 3000 ANSI/CAMI grit, polished with an aqueous suspension of Al2O3, then with diamond paste (grain size of 0.5 μm) moistened with kerosene. The polished samples were etched with a 0.5% solution of HF in ethanol.
The copper sample (No. 1) was cut perpendicularly to the direction of deformation (drawing through dies) with a water-cooled diamond saw. After casting in epoxy resin, it was ground and polished as with the silver samples. The polished samples were etched with a solution of 1:1 distilled water and HNO3.
The microstructure was evaluated on a Neophot 32 optical microscope and ImageJ software. The micro-hardness was measured with a Hanemann micro-hardness tester, type Mod D32 (magnification 480×; the resolution of the smallest scale division of the device measuring the dimensions of the indentations is 0.000313 mm), part of the Neophot-32 microscope.
The CRM (certified reference material, reference block) with specified hardness Hc 195 HV0.05 and standard uncertainty uCRM 4.0 HV0.05 was used to calibrate the hardness tester. The results of calibration are expressed as the repeatability rrel, the error of tester Erel and the relative expanded uncertainty of calibration Urel, all in (%). Calibration was performed before each micro-hardness test; in all cases, the hardness tester met the requirements of ISO 6507-2 standard [36].
The same operator measured all the samples on the metallographic surface according to ISO 6507-1 standard [22] at loads of 0.09807 N (10 g), 0.24518 N (25 g), 0.49035 N (50 g) and 0.9807 N (100 g). The load duration was 15 s. The indenter penetrated the samples in the direction of the last deformation. For silver samples, as already mentioned, the hardness on the surface of the sample was measured. Easily accessible, “bulging“ areas were chosen, i.e., with the least deformation and with the best possible surface (no scratches, oxide residues), for example sample No. 13, Figure 1 and sample No. 16, Figure 2. The hardness of the copper sample was measured on the polished cut, near its edge. The average speed of the indenter penetration into the sample for a load of 0.49035 N is shown in Table 1. It can be seen from the measured values that the speed fluctuated significantly (due to the manual hardness tester, non-standard samples and the fact that the measurements could not be carried out at the same time), which could have affected the measured values. The applied method of the penetration rate measurement and its possible influence on the measured micro-hardness values are described in more detail in [37].
The measured values of micro-hardness are loaded with uncertainty (Urel); the average value decreases as the test load increases (20.27% for HV0.01 and 13.7% for HV0.1).
As the silver content in the alloy increases, the hardness decreases. This trend was observed for all applied test loads.
4. Results
Meyer’s power law, proportional specimen resistance (PSR) and the Hays–Kendall approach were used for the quantitative description of the ISE. The procedure for calculating ISE characteristics using the references Sangwal et al. [25], Li and Bradt [38], Michels et al. [39] and in particular the procedure of Kim et al. [40] for measuring the micro-hardness of the ceramic is presented in more detail in Petrík [41].
As demonstrated by Ren et al. [26], Meyer’s Power Law or the Proportional Specimen Resistance model (PSR) describe ISE quantitatively. Meyer’s Law can be expressed using Equation (1):
with Meyer’s index n, indentation diagonal d (mm), applied load P (N) and constant A.
The parameters n (Meyer’s index) and Aln are obtained from a plot of ln (d) versus ln (P), where d is the diagonal of the indentation (in mm) and P is the value of the test load (in N). Meyer’s index n is related to the “work-hardening index”. As reported by Sargent [42], Meyer’s law was originally derived for a ball-shaped indenter; later, it also became common practice to apply Tabor’s interpretation of deformation hardening to a pyramid-shaped indenter [43]. Index n < 2 for “normal” ISE and n > 2 for reverse ISE. If n = 2, the load-independent micro-hardness is given by Kick’s law. The values for Aln are given in Table 2.
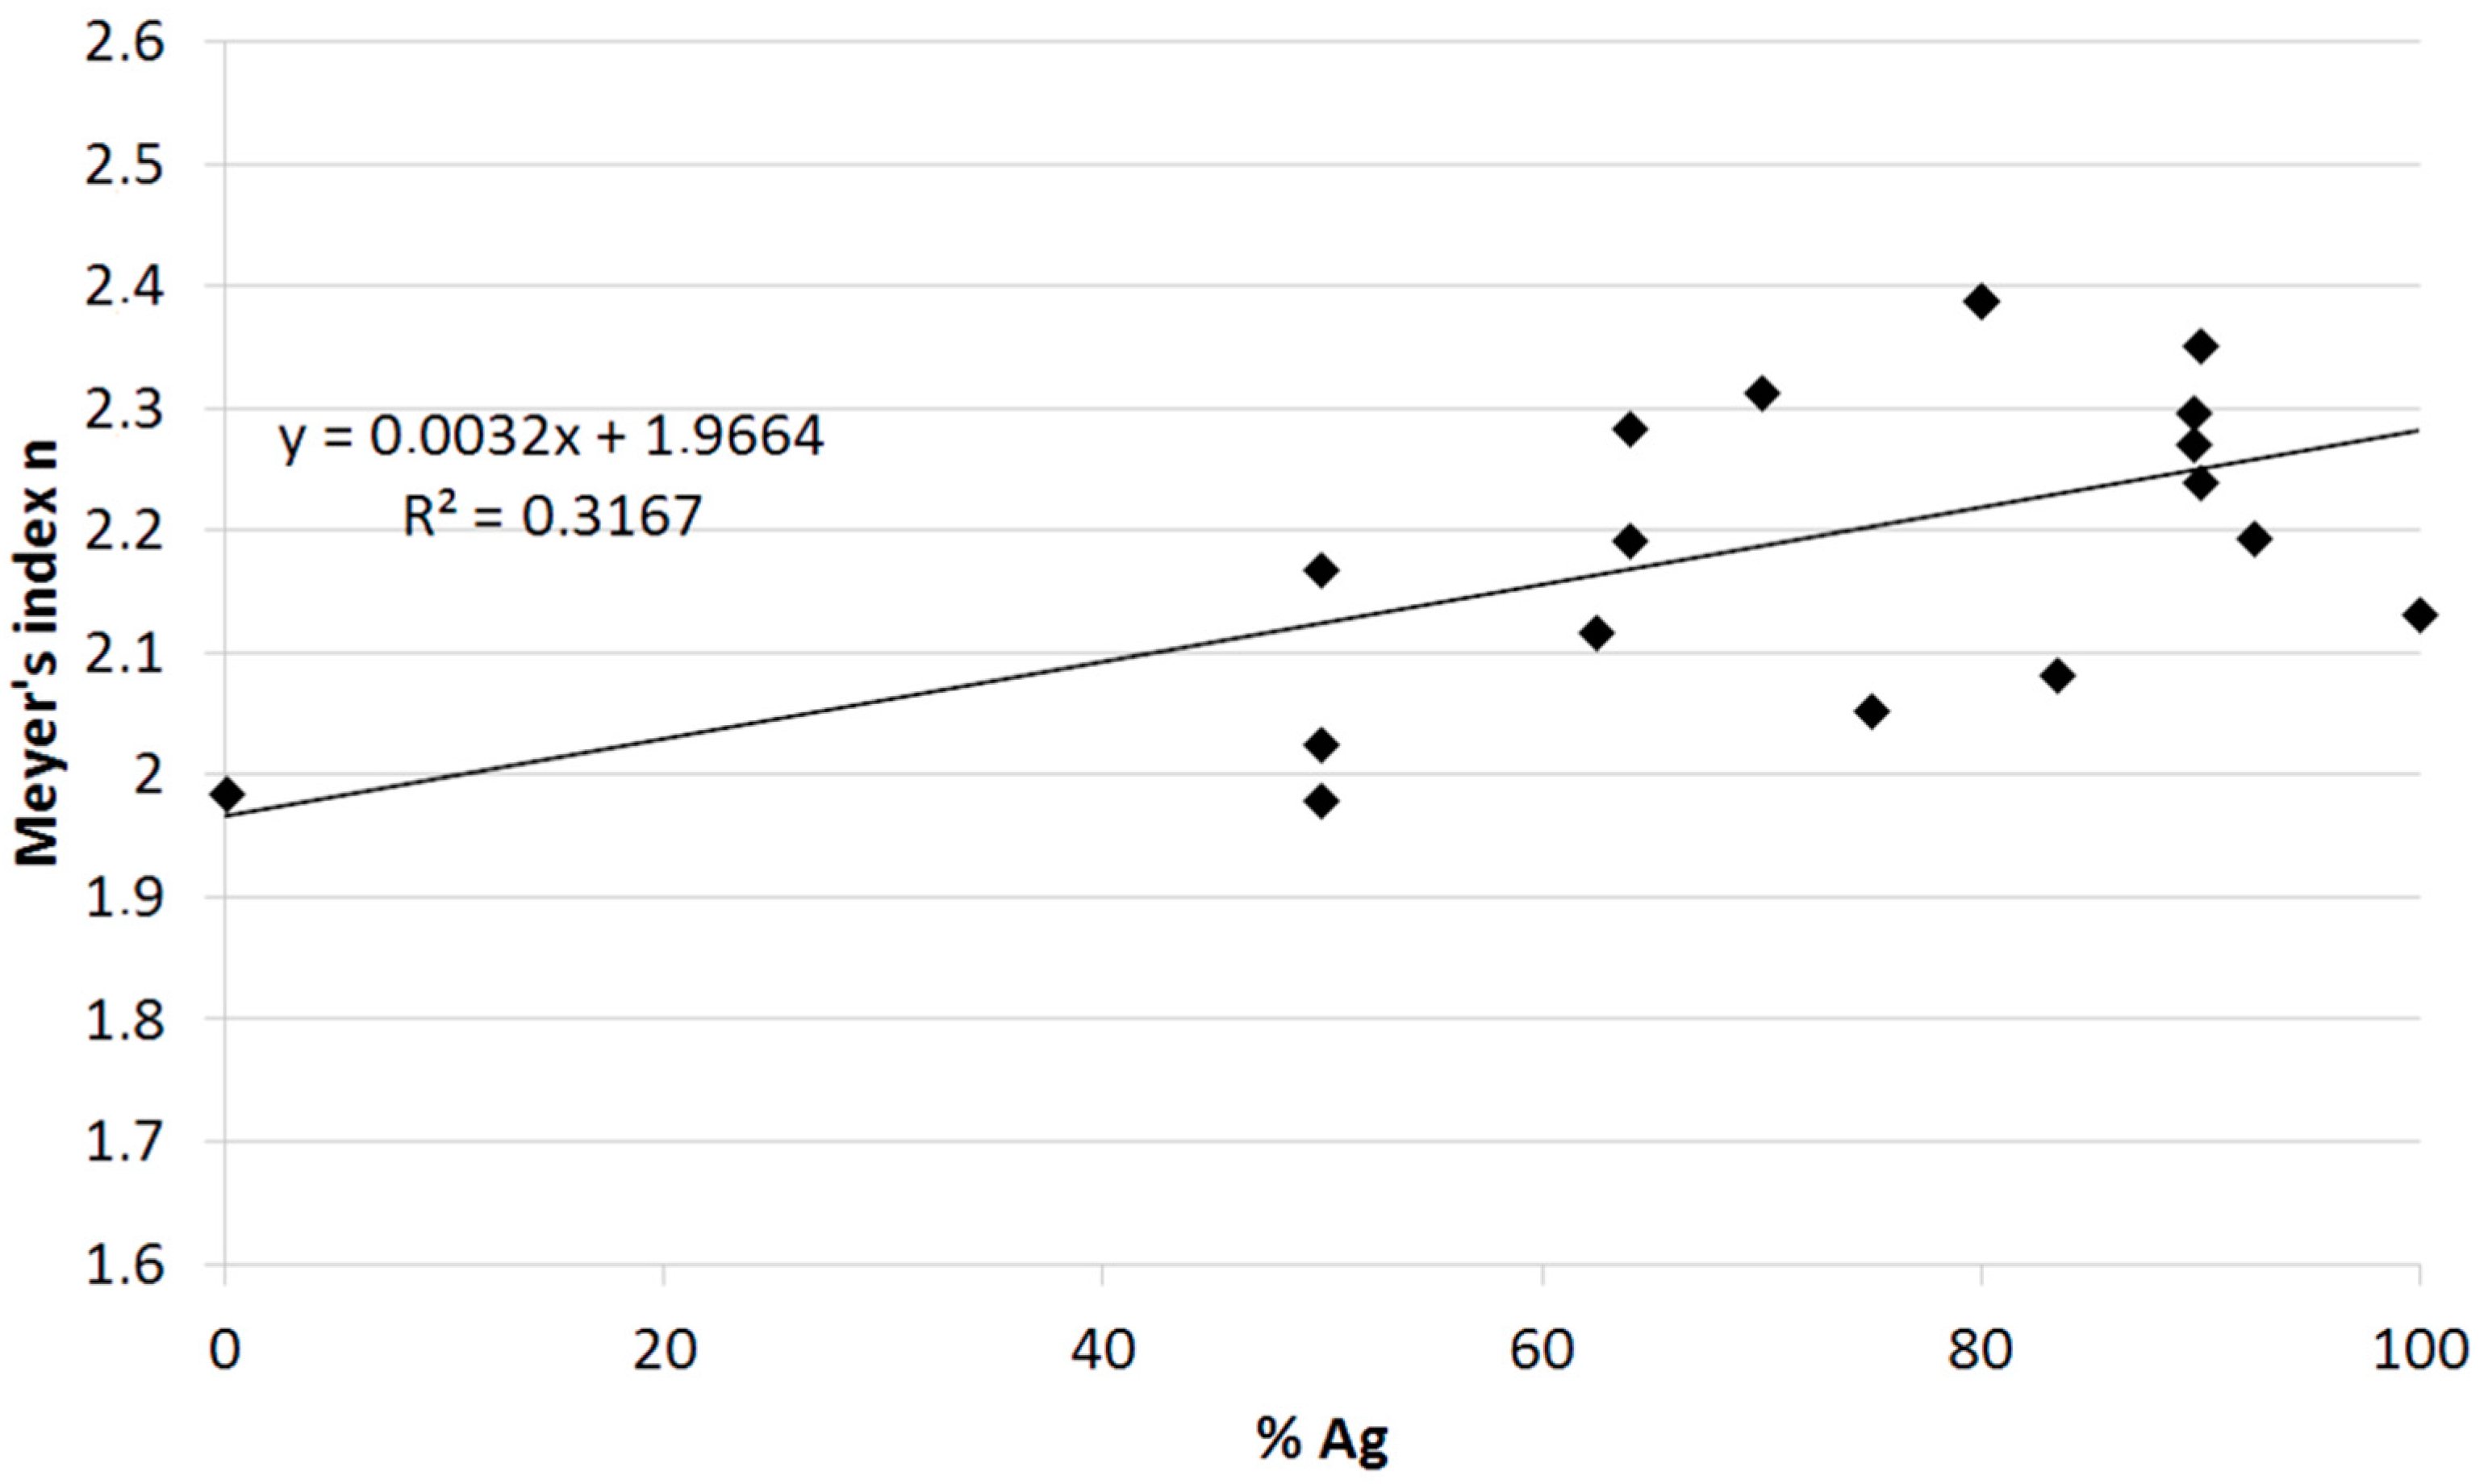
As follows from Figure 3, the Meyer’s index value increases with increasing silver content. In the case of copper (sample 1), the value of the index is probably influenced by deformation hardening; therefore, it has a slightly “normal” character. Ag–Cu alloys have a reverse ISE character that increases with increasing Ag content.
The parameters c0 (N), c1 (N.mm−1) and c2 (N.mm−2) can be obtained from the quadratic regression of P (N) against d (mm). Gong et al. [24] found that the parameter c0 is related to the residual surface tension in the sample and parameter c1 is related to the elastic and c2 to the plastic properties of the sample. Their values are given in Table 2.
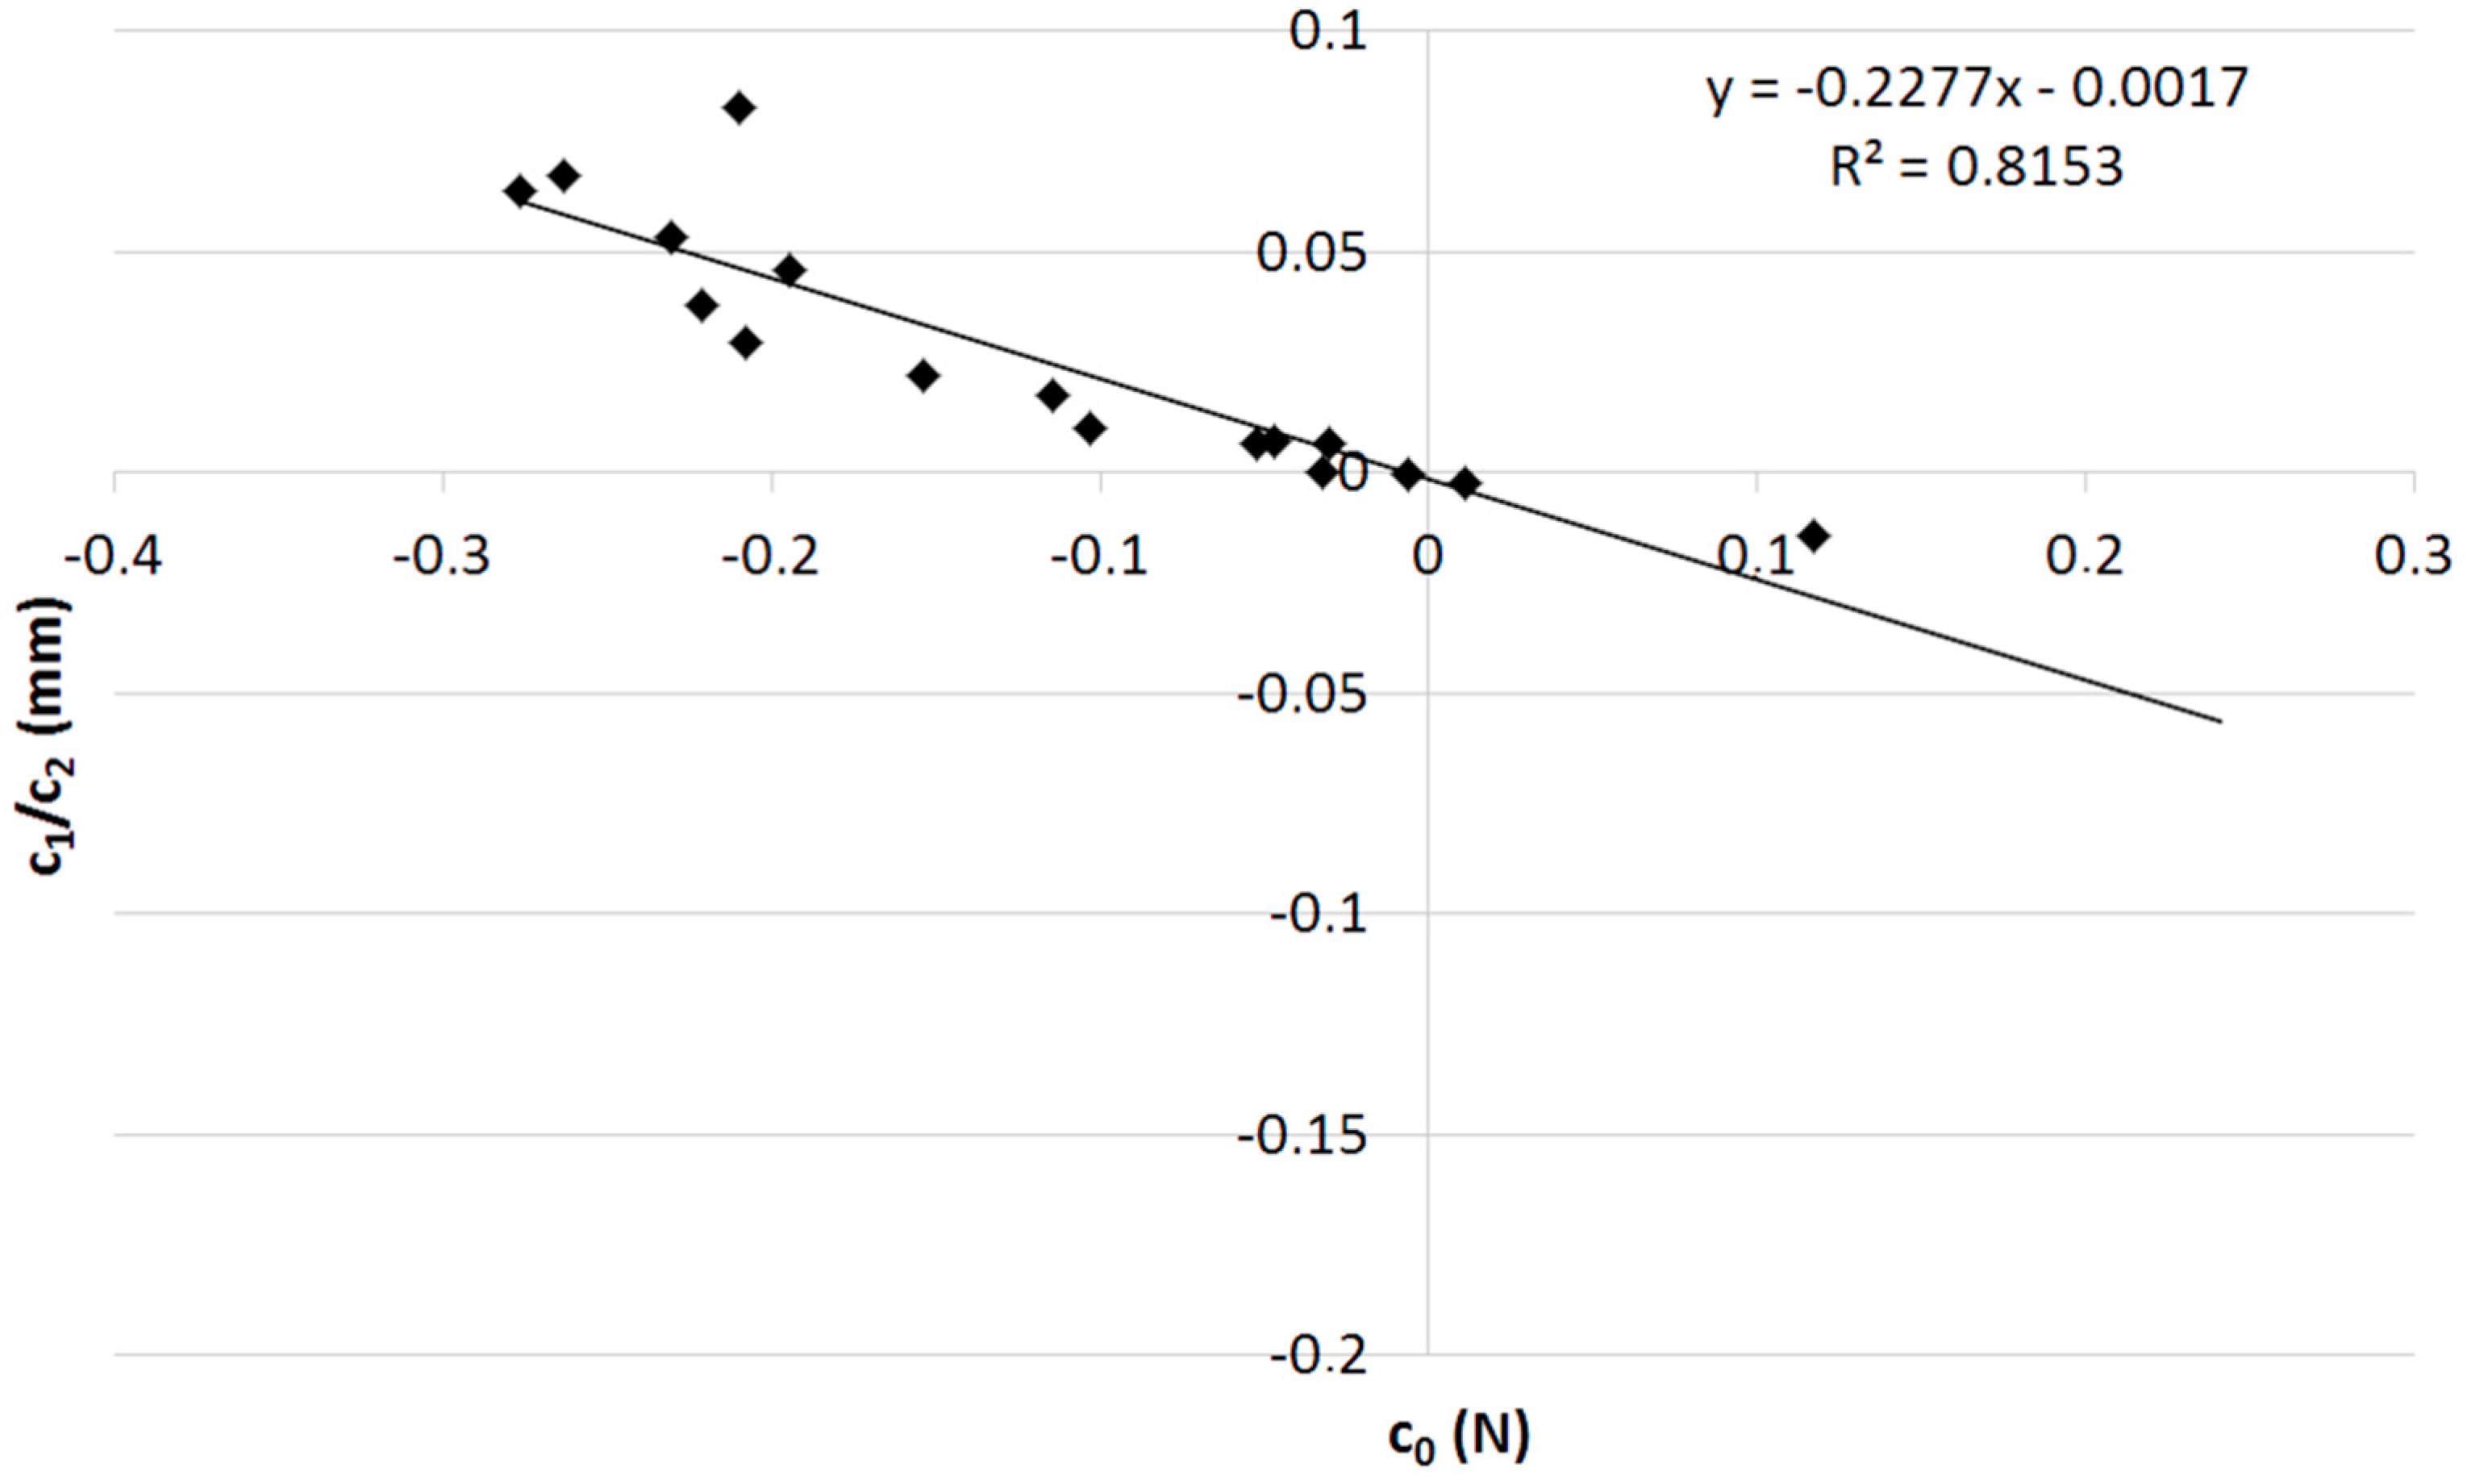
The c1/c2 ratio is a measure of the residual stress resulting from the cutting, grinding and polishing of the sample. According to the works of Sangwal et al. [25], an approximately linear dependence between c0 and the ratio c1/c2 is expected; this fact is confirmed by Figure 4.
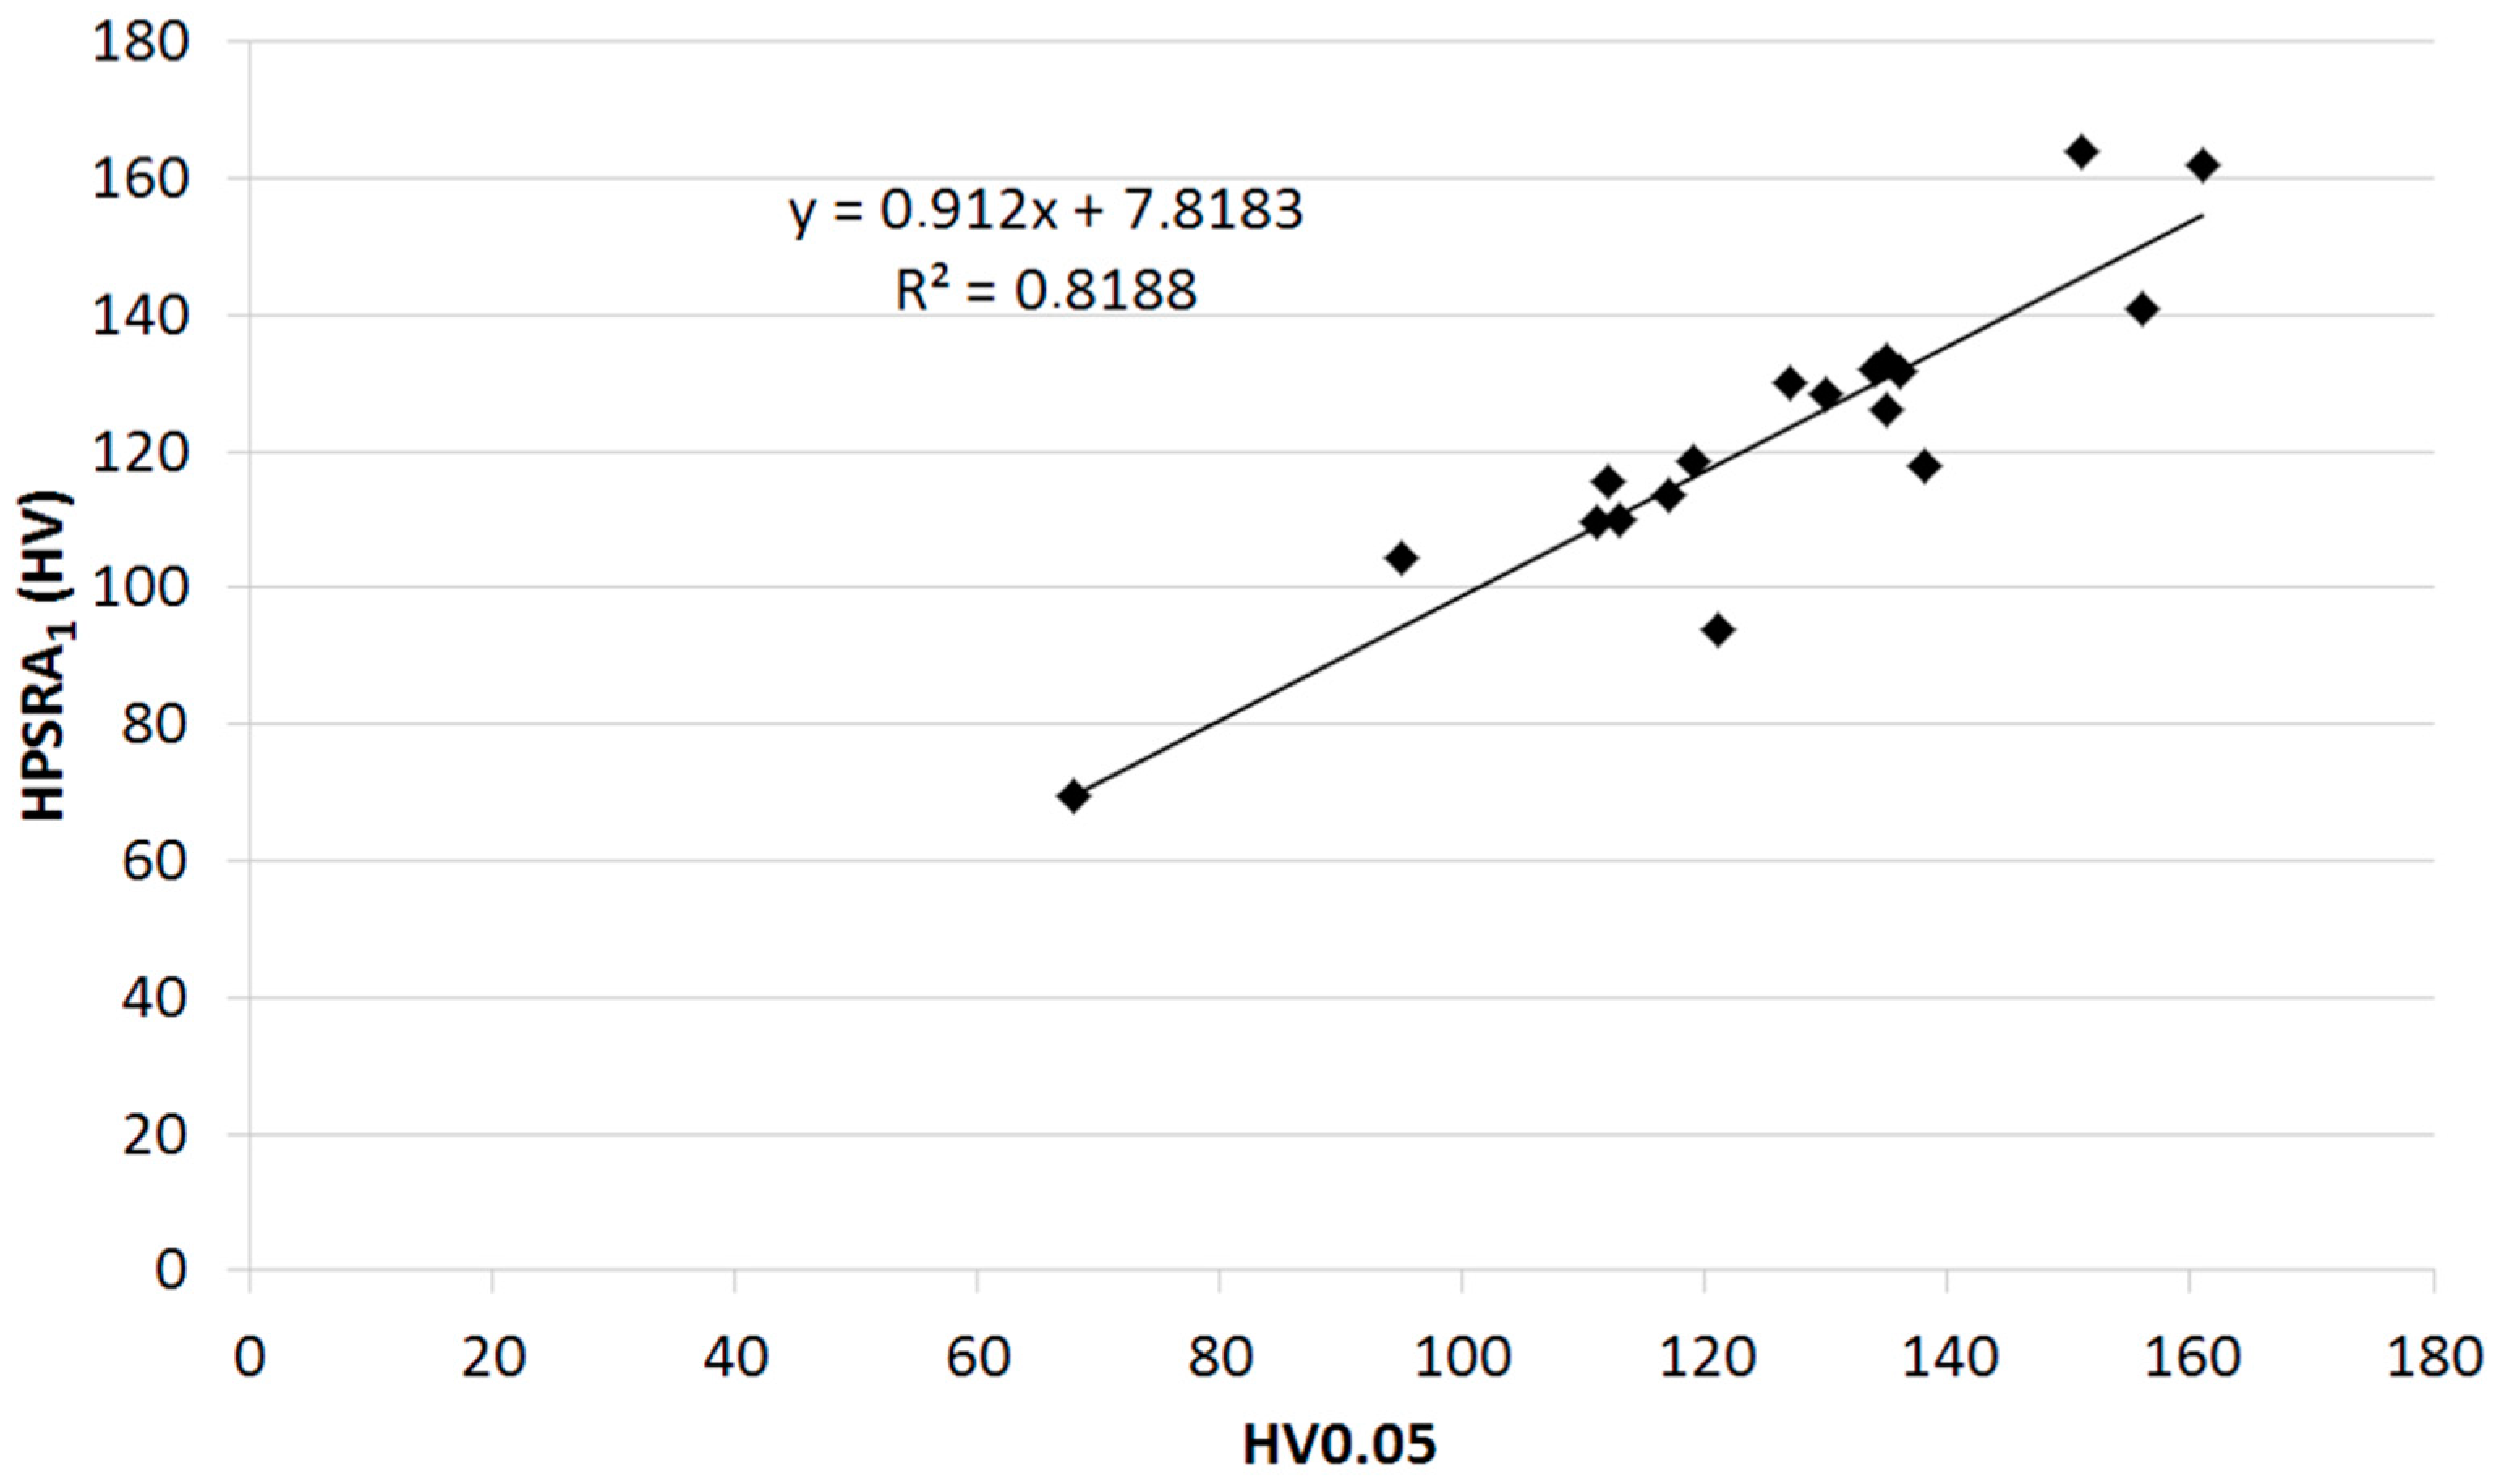
The minimum load W (N) is required to initiate plastic deformation, i.e., to create a visible impression. As reported by Sangwal et al. [25], the values of W and the parameter A1, (N.mm−2), which is not dependent on the load, can be obtained from the regression of P (N) against d2 (mm). Parameter A1 (as well as c2, which generally has less accuracy) can be used to calculate the “true hardness” of HPSRA1, the values of which are given, as well as the values of W and A1 in Table 2. The relationship between the measured hardness of HV0.05 and the “actual hardness” of HPSRA1 is presented in Figure 5.
5. Discussion
In articles dealing with the research of the ISE phenomenon in metals, authors usually do not mention the value of the Meyer index and other important parameters characterizing ISE. Among the valuable articles that lack these data, we can mention, for example, Elmustafa et al. [44] for Al, Elmustafa and Stone [45] for Al and brass and Atkinson [46] for Al, Cu, Fe and brass.
Moreover, the authors use a wide range of test loads, which often extend into the range used in the measuring of nano-hardness. Unlike (macro) hardness testers, the (indirect) calibration of used micro-hardness testers is not a routine matter. It is necessary to keep in mind that the calculation of the uncertainty (and thus also the variability) of the measured micro-hardness is impossible without the prior calibration of the used hardness tester. It is possible that “normal” and reverse ISE simultaneously result from the same input values, if the uncertainty is taken into account [27]. When analyzing ISE, it is appropriate to determine the capability of the measurement process, as described by Tošenovský and Tošenovský [47], Klaput et al. [48] and Petrík and Palfy [49].
The ambiguity in the measurement of small indentations, particularly if pile-up or sink-in effects are present, can lead to the over- or underestimation of diagonals (Petrík [50]). Moreover, measured values are the result of several factors including the operator’s subjective decision in determining the indentation edge as well as his/her eye strain as a result of the prolonged measurement, as Petrík and Palfy [49] state.
The Ag–Cu alloy system is a simple eutectic. The eutectic temperature is 779.1 °C and the eutectic composition is 28.41% wt. copper. The maximum solid solubility of copper in silver at the eutectic temperature is 8.27% wt.; the maximum solubility in the solid phase at room temperature is not known with certainty, but it is well below 1% wt. It is the resulting supersaturation of copper in the metastable solid solution of silver-copper alloys cooled at high temperature that is the primary factor in precipitation phenomena [51].
Greil et al. [52] analyzed the microstructure and hardness of Ag and Cu alloy coins. The microstructure of 95.2% Ag is formed by a silver-rich matrix and fine copper-rich precipitates. The microstructure of 333 Ag is even finer; it is formed by small amounts of primary copper-rich phase and the eutectic composition of silver-rich and copper-rich phases. The punch deformation texture of these samples is clearly visible. The measured values of micro-hardness (HV0.05) on sections parallel to the deformation direction made it possible to create a two-dimensional “map”.
The effect of the minting processes was confirmed on the coin. The difference from the hardest to the softest area is around 30%. With a content of 99.9% Ag, the area near the surface has an average hardness of 100 HV0.05. In addition, the hardness gradient from the edge to the center of the circular blank is also visible. The greater the distance from the edge, the lower the hardness.
With similar properties, 92.5% “Sterling silver” has a hardness decreasing from about 90 HV0.05 at the edge and the surface to 75 HV0.05 at the center.
In the case of 33.3% Ag, the maximum hardness at the surface (at the outermost rim region) is 165 HV0.05. Towards the center of the sample, it decreases with a minimum value of 85 HV0.05. Due to the fine Cu precipitates, 33.3% Ag is the hardest of the three mentioned studied materials.
Aligned areas with increased hardness (115 HV0. 05) are visible parallel to the surface of the sample. They can be the result of segregation due to the process of rolling metal strips, from which circular blanks are subsequently cut and coins are minted.
It follows from the above that we observe inhomogeneous deformation in the studied alloys, especially at higher deformation rates, characteristic for coin minting. Its result is uneven deformation hardening and thus the high variability of micro-hardness.
Northover and Northover [53] draw attention to the fact that objects made from silver alloyed with up to 10% Cu are well known to age-harden by the precipitation of copper, because of the difference in its solid solubility between typical annealing temperatures of up to 700 °C (7%) and room temperature (<1%). If the tested samples are of different ages, in addition to the fact of uneven deformation, it is necessary to keep this fact in mind when interpreting the results.
As mentioned above [51], the high inhomogeneity of deformation was observed during the minting of the studied alloys, which affected the measured micro-hardness. The micro-hardness measured on the surface of the coin is generally higher than in the center.
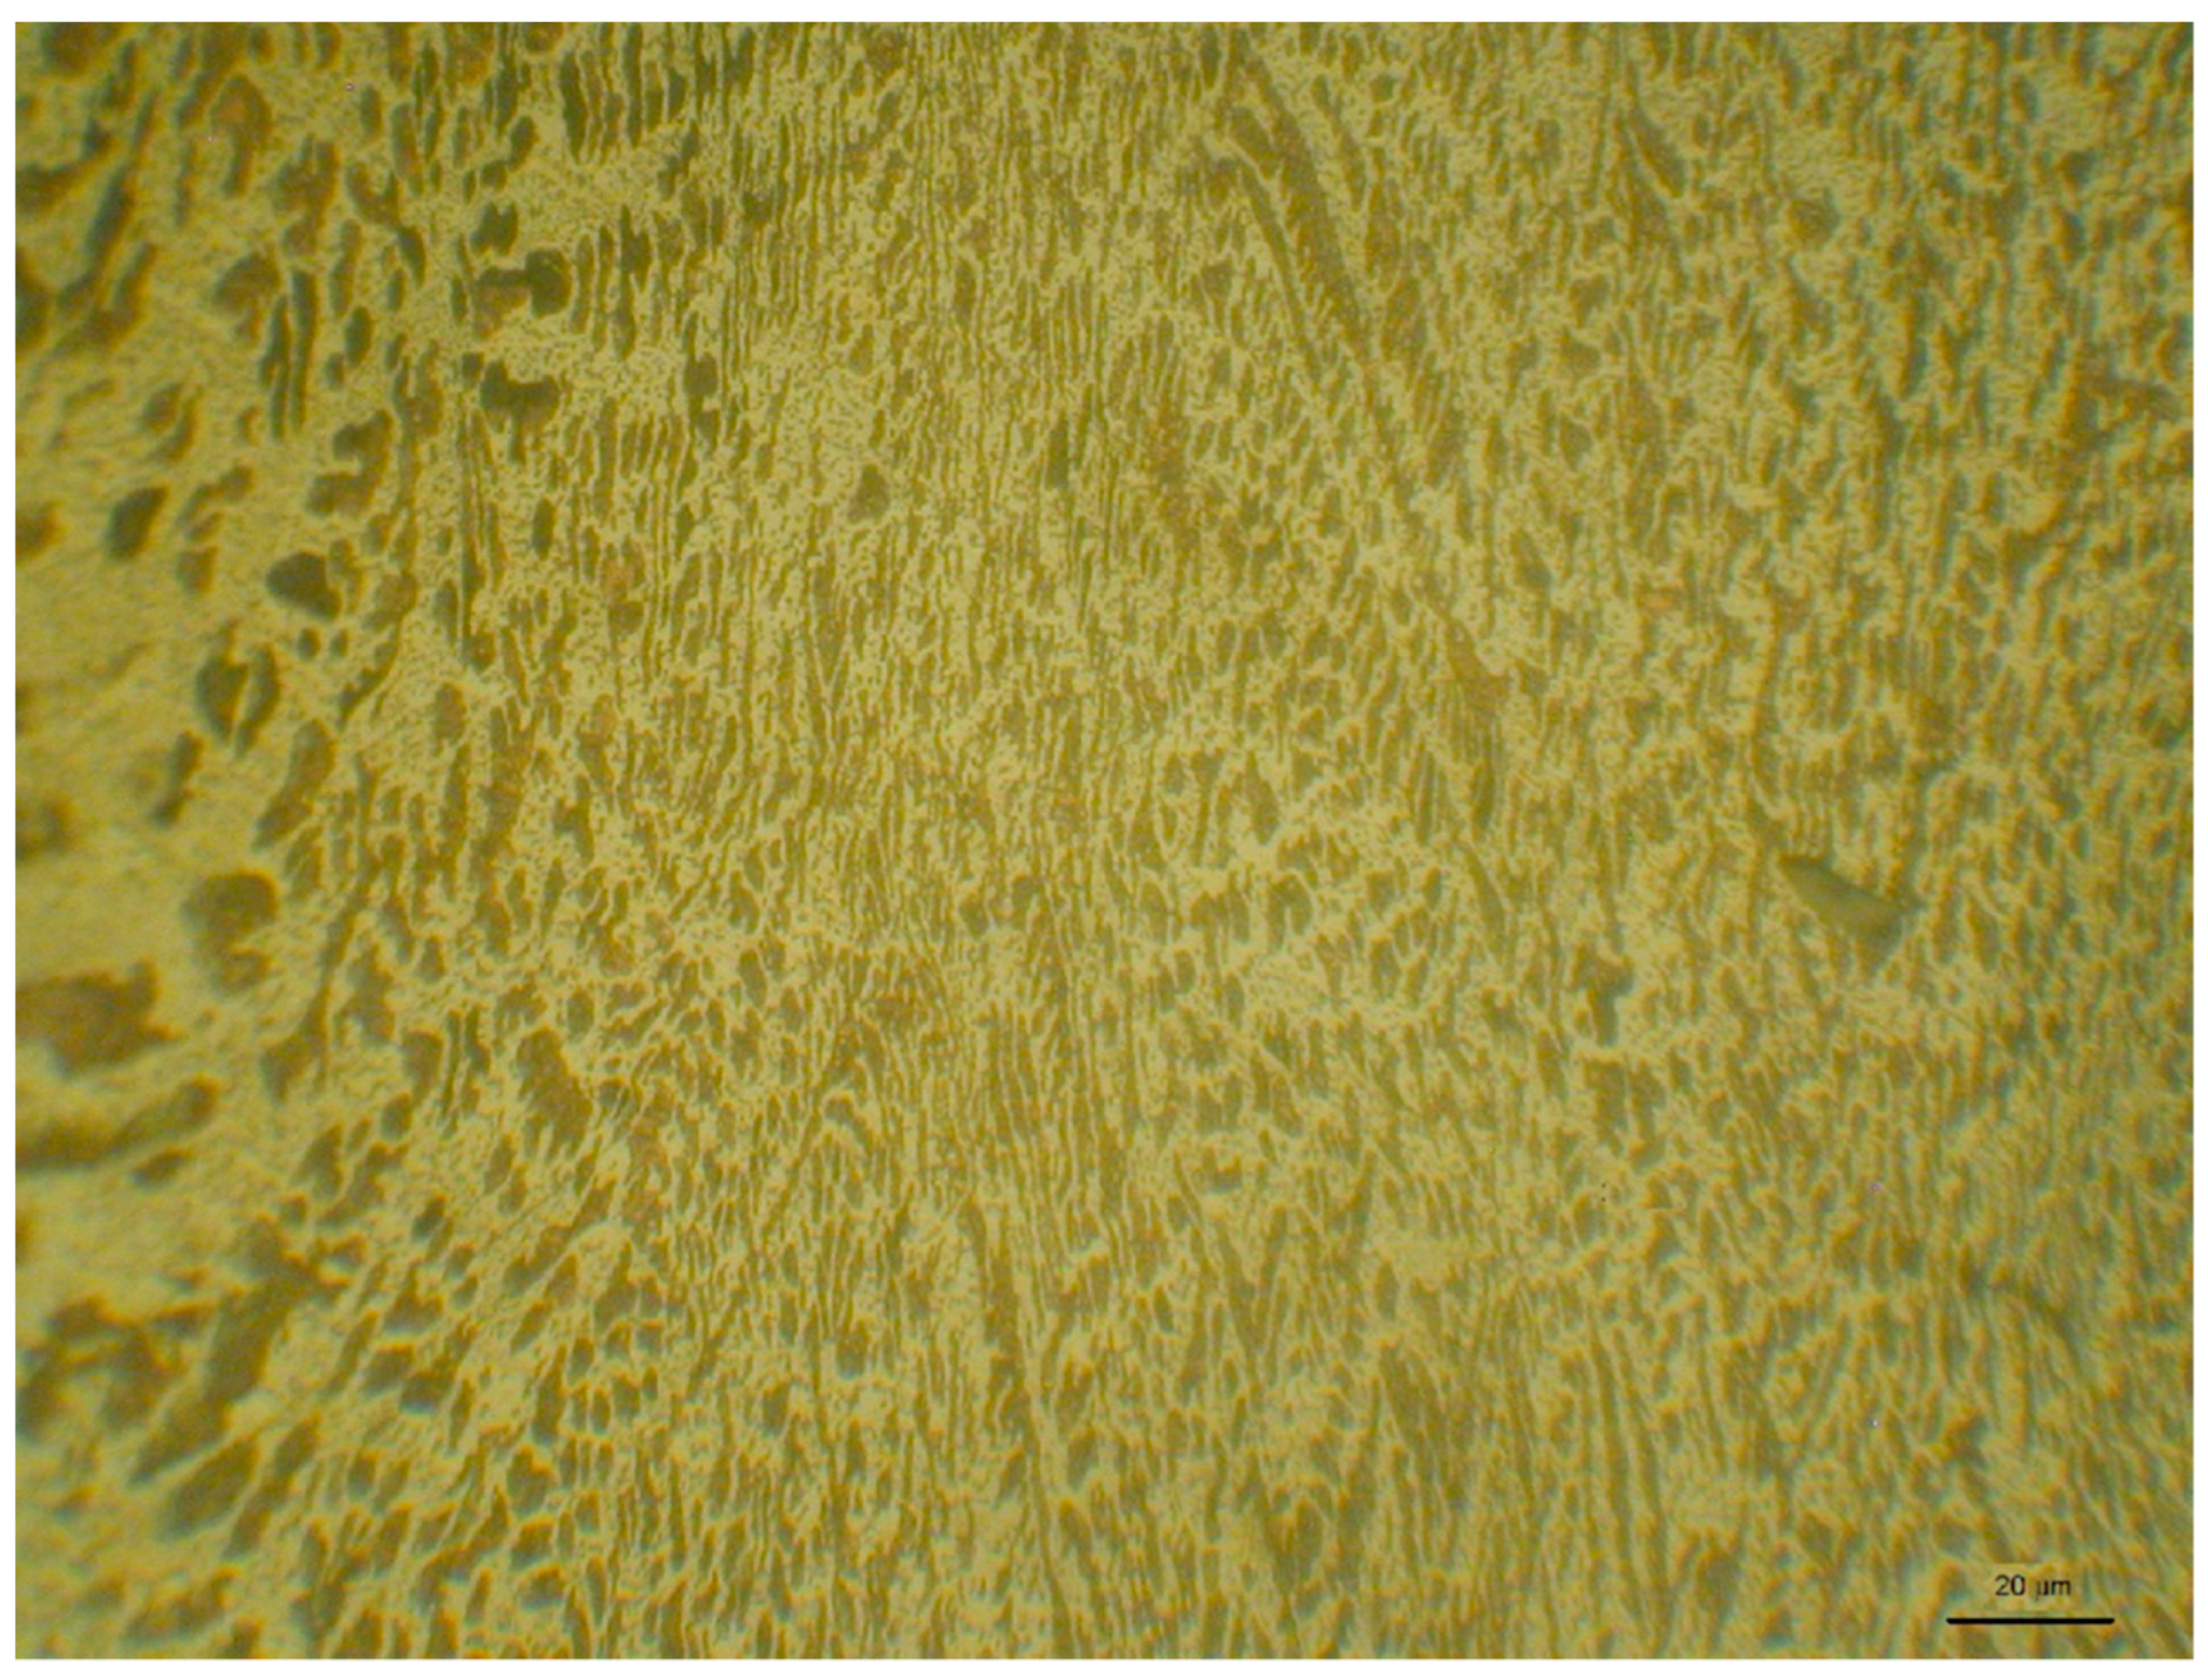
The interrelationship between the microstructure parameters, especially the grain size and the dimensions of the indentations, can also affect the results. Unfortunately, except for a few samples, it was not possible to evaluate the microstructure. As can be seen from Table 3, at 0.49035 and 0.9807 N indentations covered a few grains and the micro-hardness basically expresses an average value. At a minimum load of 0.09807 N, the size of the indentation is comparable to the size of the grain. For sample no. 16, the ratio of the area of the silver grains and the eutectic in the cut section (metallographic surface) is approximately 1:1 (determined by ImageJ software). It is therefore likely that the area of indentation will cover both the silver and eutectic in different proportions, which contributes to a higher variability of the measured micro-hardness values. The typical microstructure of sample no. 16 is in Figure 6. For samples 6 and 9, where the microstructure is strongly deformed, even fibrous, averaging out is also more likely.
As for the analyzed samples, their micro-hardness increases only slightly with age. This may be a consequence of the relatively modest age of the samples (maximum 129 years), which has not allowed for the development of precipitation processes and subsequent hardening. In addition, other mentioned influences (inhomogeneous deformation, the influence of measurement uncertainty, indenter penetration speed) may override the influence of the sample ageing.
The simultaneous influence of several factors on Meyer’s index was solved using multiple linear regression analysis (multiple regression, EXCEL→LINEST program). The value of the coefficient of determination R2 indicates a relationship between considered input factors (the content of secondary elements) and hardness. It means that 42.2% of the variation of Meyer’s index n can be explained by the effect of these factors [54,55].
The simultaneous influence of silver content and age on the value of Meyer’s index can be expressed by Equation (2):
if we also take into account the micro-hardness (HV0.05) in Equation (3):
The R2 values are relatively low, probably due to the action of other factors: in the opinion of the authors, primarily the degree of deformation.
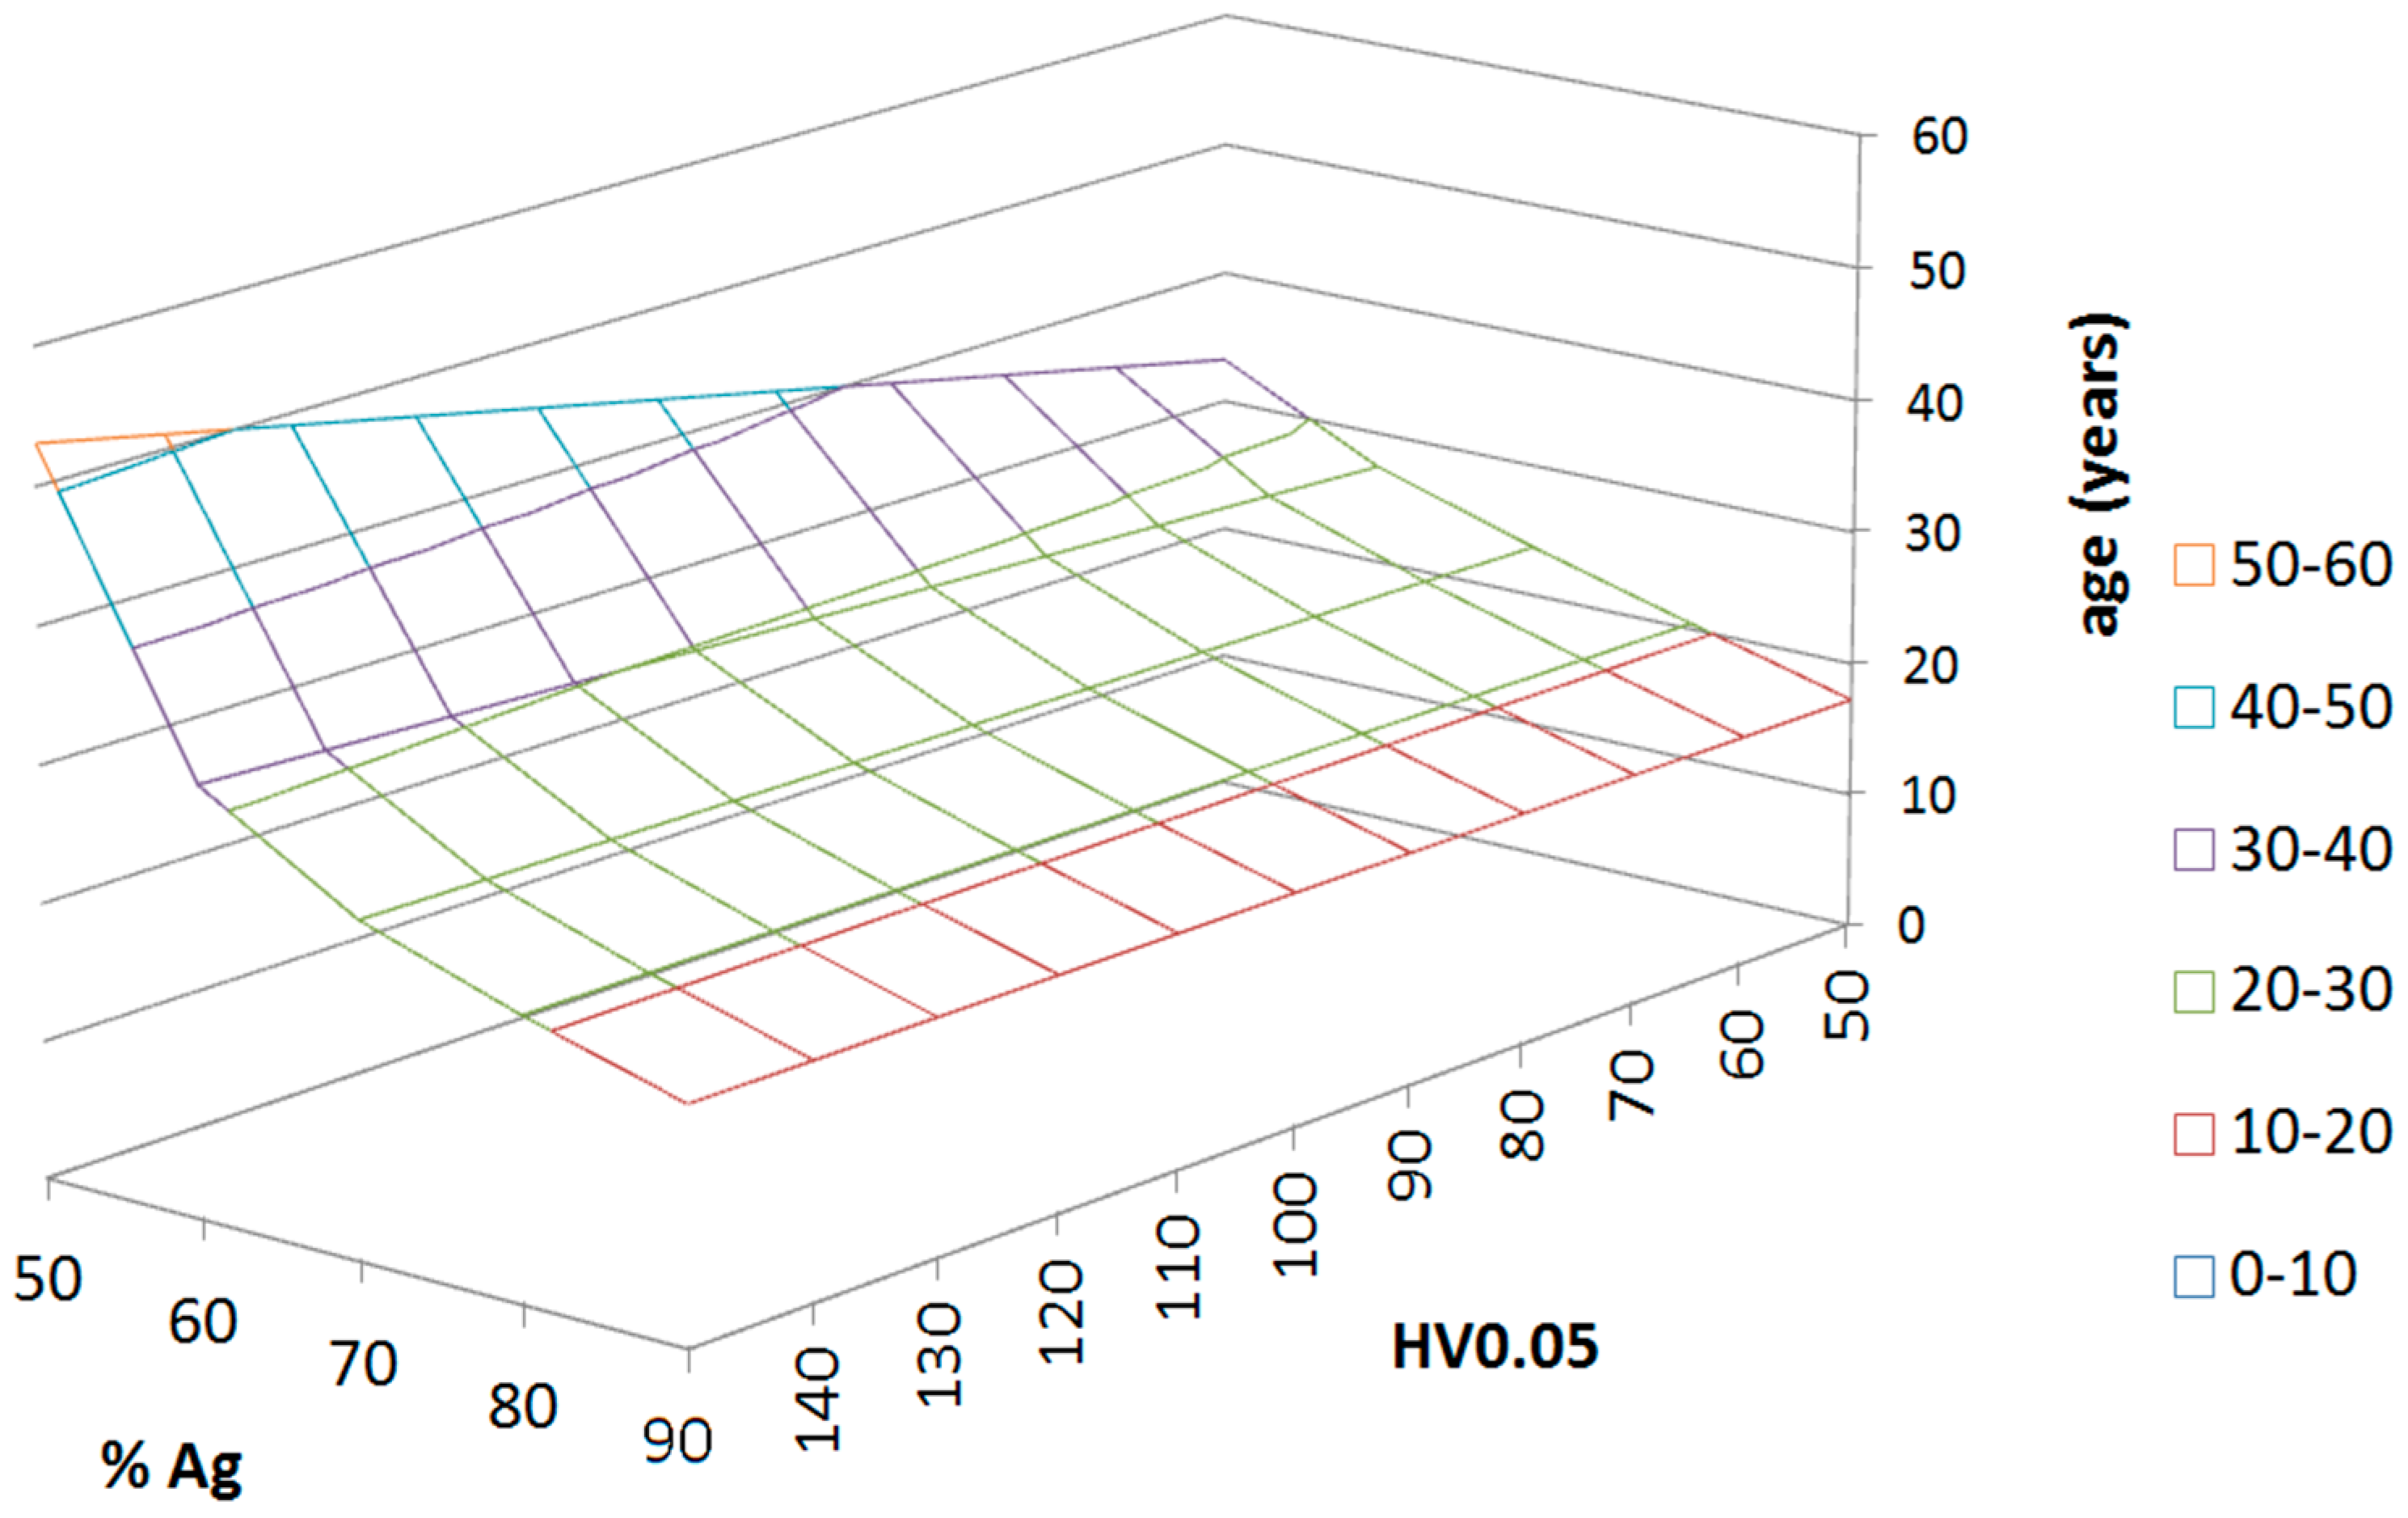
Figure 7 displays the dependence estimate of the age of the sample (based) on its Ag content and micro-hardness (HV0.05) at the value of n = 2. The graph has only indicative value, as R2 is only 0.171.
Due to the high variability of the results, it is necessary to understand this paper as a “pilot”; an introduction to the topic. To some extent, it identifies the factors that influence the micro-hardness and subsequently the parameters characterizing the ISE. It represents a call for a controlled experiment, preferably, due to the greater number of factors (composition, age, deformation, micro-hardness measurement parameters...) using the DoE (Design of experiments) method. A methodology for determining the age of artifacts from the Ag–Cu alloy could be a benefit, which could be used, e.g., in archaeology.
6. Conclusions
Ag–Cu alloys show a reverse ISE, and as the Ag content increases, its reverse character increases. In addition to the chemical composition, the ISE characteristics are influenced by other factors such as sample age, deformation and hardness measurement conditions. To quantify their synergistic effect, it is appropriate to use multiple regression analysis.
As the contribution suggests, the issue of determining “true hardness”, from which the other mechanical properties of Ag–Cu alloys can be derived, is complicated. If we use a smaller test load, the indentations are smaller and will degrade the final product less. On the other hand, measuring the dimensions of smaller impressions is burdened with greater uncertainty. The lower the applied load, the greater the influence of the ISE effect and the more the measured value of micro-hardness differs from “true hardness”. When measuring on alloys with multiple phases, the situation is also complicated by the phase ratio, grain size, residual stresses after previous deformation, the age of the alloy, which affects precipitation hardening, the nature of the surface, the presence of trace elements and other factors. Therefore, it is advisable to continue the research, even for the reason that in the professional literature few authors deal with the issue of ISE alloys, as was already mentioned in the introduction.
Author Contributions
Quality, preparation of samples, M.Š.; calculation ISE, P.B.; micro-hardness measurement, J.P.; translation, statistics, P.P.; literary review, L.G. All authors have read and agreed to the published version of the manuscript.
Funding
This research received no external funding.
Institutional Review Board Statement
Not applicable.
Informed Consent Statement
Not applicable.
Data Availability Statement
Not applicable.
Conflicts of Interest
The authors declare no conflict of interest.
References
- Pačaiová, H.; Sinay, J.; Turisová, R.; Hajduová, Z.; Markulik, Š. Measuring the Qualitative Factors on Copper Wire Surface. Measurement 2017, 109, 359–365. [Google Scholar] [CrossRef]
- Markulik, S.; Nagyova, A.; Turisova, R.; Villinsky, T. Improving Quality in the Process of Hot Rolling of Steel Sheets. Appl. Sci. 2021, 11, 5451. [Google Scholar] [CrossRef]
- Markulik, Š.; Cehlár, M.; Kozel, R. Process Approach in the Mining Conditions. Acta Montan. Slovaca 2018, 23, 7. [Google Scholar]
- Silver and Silver Alloys. Available online: https://www.totalmateria.com/page.aspx?ID=CheckArticle&site=ktn&NM=239 (accessed on 27 October 2022).
- Zliatiny Neželezných Kovov. Available online: http://kmi2.uniza.sk/wp-content/uploads/2020/01/5_Zliatiny-nezelezn%C3%BDch-kovov.pdf (accessed on 27 October 2022).
- Zhu, X.; Xiao, Z.; An, J.; Jiang, H.; Jiang, Y.; Li, Z. Microstructure and Properties of Cu-Ag Alloy Prepared by Continuously Directional Solidification. J. Alloy. Compd. 2021, 883, 160769. [Google Scholar] [CrossRef]
- Benefits of Alloying Ag with Copper Alloys. Available online: https://www.belmontmetals.com/benefits-of-alloying-ag-with-copper-alloys/ (accessed on 27 October 2022).
- What Is Silver Alloy? Available online: https://sciencing.com/silver-alloy-7239734.html (accessed on 27 October 2022).
- Tian, Y.Z.; Li, J.J.; Zhang, P.; Wu, S.D.; Zhang, Z.F.; Kawasaki, M.; Langdon, T.G. Microstructures, Strengthening Mechanisms and Fracture Behavior of Cu–Ag Alloys Processed by High-Pressure Torsion. Acta Mater. 2012, 60, 269–281. [Google Scholar] [CrossRef]
- Silver Processing—The Metal and Its Alloy. Available online: https://www.britannica.com/technology/silver-processing/The-metal-and-its-alloys (accessed on 27 October 2022).
- Feng, G.; Liu, M.; Liu, Y.; Jin, Z.; Wang, Y.; Deng, D. Wetting Behavior of the Ag-5CuO Brazing Alloy on ZTA Composite Ceramic with/without CuO Coating in Air. Crystals 2021, 11, 609. [Google Scholar] [CrossRef]
- Tian, Y.Z.; Han, W.Z.; Yang, H.J.; Li, S.X.; Wu, S.D.; Zhang, Z.F. Shear Banding Observations in Cu–16wt.% Ag Alloy Subjected to One-Pass Equal Channel Angular Pressing. Scr. Mater. 2010, 62, 183–186. [Google Scholar] [CrossRef]
- Raabe, D.; Mattissen, D. Microstructure and Mechanical Properties of a Cast and Wire-Drawn Ternary Cu–Ag–Nb in Situ Composite. Acta Mater. 1998, 46, 5973–5984. [Google Scholar] [CrossRef]
- Bao, G.; Xu, Y.; Huang, L.; Lu, X.; Zhang, L.; Fang, Y.; Meng, L.; Liu, J. Strengthening Effect of Ag Precipitates in Cu–Ag Alloys: A Quantitative Approach. Mater. Res. Lett. 2016, 4, 37–42. [Google Scholar] [CrossRef] [Green Version]
- Sengul, S.; Guder, V. Key Factors of Deformation Mechanism of Cu-Ag Alloy. J. Non-Cryst. Solids 2022, 576, 121270. [Google Scholar] [CrossRef]
- Chang, T.-L.; Zhou, X.; Liang, J. Synthesis and Characterization of Ag-Cu Alloy Nanoparticles for Antimicrobial Applications: A Polydopamine Chemistry Application. Mater. Sci. Eng. C 2019, 98, 675–684. [Google Scholar] [CrossRef] [PubMed]
- Ciacotich, N.; Kvich, L.; Sanford, N.; Wolcott, J.; Bjarnsholt, T.; Gram, L. Copper-Silver Alloy Coated Door Handles as a Potential Antibacterial Strategy in Clinical Settings. Coatings 2020, 10, 790. [Google Scholar] [CrossRef]
- Abdul Salam, A.; Singaravelan, R.; Vasanthi, P.; Bangarusudarsan Alwar, S. Electrochemical Fabrication of Ag–Cu Nano Alloy and Its Characterization: An Investigation. J. Nanostruct. Chem. 2015, 5, 383–392. [Google Scholar] [CrossRef] [Green Version]
- Qi, Y.; Dai, X.; Wei, L.; Luo, H.; Liu, Y.; Dong, X.; Yang, D.; Li, Y. Nano-AgCu Alloy on Wood Surface for Mold Resistance. Nanomaterials 2022, 12, 1192. [Google Scholar] [CrossRef] [PubMed]
- Petrík, J.; Blaško, P.; Markulík, Š.; Šolc, M.; Palfy, P. The Indentation Size Effect (ISE) of Metals. Crystals 2022, 12, 795. [Google Scholar] [CrossRef]
- Westbrook, H.; Conrad, H. The Science of Hardness Testing and Its Research Application; Metals Park American Society for Metals: Russell Township, OH, USA, 1973. [Google Scholar]
- ISO 6507-1; Metallic Materials—Vickers Hardness Test Part 1—Test Method. International Organization for Standardization ISO: Geneva, Switzerland, 2018.
- ISO 14577-1; Metallic Materials—Instrumented Indentation Test for Hardness and Materials Parameters Part 1—Test Method. International Organization for Standardization ISO: Geneva, Switzerland, 2015.
- Gong, J.; Wu, J.; Guan, Z. Examination of the Indentation Size Effect in Low-Load Vickers Hardness Testing of Ceramics. J. Eur. Ceram. Soc. 1999, 19, 2625–2631. [Google Scholar] [CrossRef]
- Sangwal, K.; Surowska, B.; Błaziak, P. Analysis of the Indentation Size Effect in the Microhardness Measurement of Some Cobalt-Based Alloys. Mater. Chem. Phys. 2003, 77, 511–520. [Google Scholar] [CrossRef]
- Ren, X.J.; Hooper, R.M.; Griffiths, C.; Henshall, J.L. Indentation Size Effect in Ceramics: Correlation with H/E. J. Mater. Sci. Lett. 2003, 22, 1105–1106. [Google Scholar] [CrossRef]
- Petrík, J.; Blaško, P.; Domovcová, L.; Sedlák, R.; Guzanová, A.; Ťavodová, M.; Pribulová, A.; Futaš, P. Influence of Testers on the ISE Effect. Mater. Test. 2022, 64, 550–562. [Google Scholar] [CrossRef]
- Sangwal, K. On the Reverse Indentation Size Effect and Microhardness Measurement of Solids. Mater. Chem. Phys. 2000, 63, 145–152. [Google Scholar] [CrossRef]
- Kim, J.-Y.; Kang, S.-K.; Lee, J.-J.; Jang, J.; Lee, Y.-H.; Kwon, D. Influence of Surface-Roughness on Indentation Size Effect. Acta Mater. 2007, 55, 3555–3562. [Google Scholar] [CrossRef]
- Navrátil, V.; Novotná, J. Some problems of microhardness of metals. J. Appl. Math. 2009, 2, 241–244. [Google Scholar]
- Blaško, P.; Kupková, M.; Petrík, J.; Futaš, P.; Vasilňaková, A. The Indentation Size Effect of Sintered Fe/3.3 wt-%Cu + Cn Hm Measured by Vickers Scale. Mater. Sci. Technol. 2020, 36, 403–408. [Google Scholar] [CrossRef]
- Chicot, D.; Puchi-Cabrera, E.S.; Iost, A.; Staia, M.H.; Decoopman, X.; Roudet, F.; Louis, G. Analysis of Indentation Size Effect in Copper and Its Alloys. Mater. Sci. Technol. 2013, 29, 868–876. [Google Scholar] [CrossRef] [Green Version]
- Jönsson, B.; Hogmark, S. Hardness Measurements of Thin Films. Thin Solid Film. 1984, 114, 257–269. [Google Scholar] [CrossRef]
- Korsunsky, A.M.; McGurk, M.R.; Bull, S.J.; Page, T.F. On the Hardness of Coated Systems. Surf. Coat. Technol. 1998, 99, 171–183. [Google Scholar] [CrossRef]
- Kaya, H.; Çadırlı, E.; Böyük, U.; Maraşlı, N. Variation of Microindentation Hardness with Solidification and Microstructure Parameters in the Al Based Alloys. Appl. Surf. Sci. 2008, 255, 3071–3078. [Google Scholar] [CrossRef]
- ISO 6507-2; Metallic Materials—Vickers Hardness Test Part 2—Verification and Calibration of Testing Machines. International Organization for Standardization ISO: Geneva, Switzerland, 2005.
- Petrík, J.; Palfy, P.; Blaško, P.; Girmanová, L.; Havlík, M. The Indentation Size Effect (ISE) and the Speed of the Indenter Penetration into Test Piece. Manuf. Technol. 2016, 16, 771–777. [Google Scholar] [CrossRef]
- Li, H.; Bradt, R.C. The Microhardness Indentation Load/Size Effect in Rutile and Cassiterite Single Crystals. J. Mater. Sci. 1993, 28, 917–926. [Google Scholar] [CrossRef]
- Michels, B.D.; Frischat, G.H. Microhardness of Chalcogenide Glasses of the System Se-Ge-As. J. Mater. Sci. 1982, 17, 329–334. [Google Scholar] [CrossRef]
- Kim, H.; Kim, T. Measurement of Hardness on Traditional Ceramics. J. Eur. Ceram. Soc. 2002, 22, 1437–1445. [Google Scholar] [CrossRef]
- Petrík, J. On the Load Dependence of Micro-Hardness Measurements: Analysis of Data by Different Models and Evaluation of Measurement Errors. Arch. Metall. Mater. 2016, 61, 1819–1824. [Google Scholar] [CrossRef]
- Sargent, P.M. Indentation Size Effect and Strain-Hardening. J. Mater. Sci. Lett. 1989, 8, 1139–1140. [Google Scholar] [CrossRef]
- Tabor, D. The Hardness of Metals; Oxford Classic Texts in the Physical Sciences; Clarendon Press; Oxford University Press: Oxford, NY, USA, 2000; ISBN 978-0-19-850776-5. [Google Scholar]
- Elmustafa, A.A.; Eastman, J.A.; Rittner, M.N.; Weertman, J.R.; Stone, D.S. Indentation Size Effect: Large Grained Aluminum versus Nanocrystalline Aluminum-Zirconium Alloys. Scr. Mater. 2000, 43, 951–955. [Google Scholar] [CrossRef]
- Elmustafa, A.A.; Stone, D.S. Indentation Size Effect in Polycrystalline F.C.C. Metals. Acta Mater. 2002, 50, 3641–3650. [Google Scholar] [CrossRef]
- Atkinson, M. Calculation of Characteristic Macro-Hardness from Low-Load Indentation Tests. Mater. Sci. Eng. A 1995, 197, 165–169. [Google Scholar] [CrossRef]
- Tošenovský, J.; Tošenovský, F. Possibilities of Using Graphical and Numerical Tools in the Exposition of Process Capability Assessment Techniques. QIP J. 2019, 23, 13. [Google Scholar] [CrossRef]
- Klaput, P.; Vykydal, D.; Tošenovský, F.; Halfarová, P.; Plura, J. Problems of Application of Measurement System Analysis (MSA) in Metallurgical Production. Metalurgija 2016, 55, 535–537. Available online: https://www.researchgate.net/publication/298850843_Problems_of_application_of_measurement_system_analysis_MSA_in_metallurgical_production (accessed on 30 October 2022).
- Petrík, J.; Palfy, P. The Influence of the Load on the Hardness. Metrol. Meas. Syst. 2011, 18, 223–234. [Google Scholar] [CrossRef] [Green Version]
- Petrík, J. The Micro-Hardness of Heat Treated Carbon Steel. Mater. Sci. 2014, 20, 21–24. [Google Scholar] [CrossRef] [Green Version]
- Northover, P.; Northover, S.; Wilson, A. Microstructures of Ancient and Historic Silver. Metal 2013, 16–25, 253–260. [Google Scholar]
- Greil, S.; Edtmaier, C.; Haubner, R.; Lauter, L. Metallographic Investigations of Silver Alloys Used for Minting. MSF 2017, 891, 89–94. [Google Scholar] [CrossRef]
- Northover, S.M.; Northover, J.P. Microstructures of Ancient and Modern Cast Silver–Copper Alloys. Mater. Charact. 2014, 90, 173–184. [Google Scholar] [CrossRef]
- Aakre, A. Statistical Functions and Tools in Microsoft Excel; Trondheim, Norway, 2004. Microsoft Silver Application Development Partner. Available online: http://trafikk.info/evu_tt_oslo_2007/litteratur/excel_all_statistical_functions_and_tools_a5.pdf (accessed on 30 November 2022).
- McDonald, J.H. Handbook of Biological Statistics (3rd ed.); Sparky House Publishing: Baltimore, MD, USA, 2014; Available online: http://www.biostathandbook.com/multipleregression.html (accessed on 28 November 2022).
Figure 1.
The place of measurement for sample No. 13.

Figure 2.
Place of measurement for sample No. 16.

Figure 3.
Dependence of Meyer’s index n on the Ag content.

Figure 4.
Relation between c0 and c1/c2.

Figure 5.
Relation between HV0.05 and HPSRA1.

Figure 6.
Microstructure of sample No. 16.

Figure 7.
Determination of the age of the sample based on the silver content and micro-hardness at the value of Meyer’s index n = 2.
Figure 7.
Determination of the age of the sample based on the silver content and micro-hardness at the value of Meyer’s index n = 2.


Table 1.
Sample origin, age (years), silver content (% wt.), micro-hardness (HV0.01, HV0.025, HV0.05, HV0.1); the average speed of the indenter penetration into the sample for a load of 0.49035 N.
Table 1.
Sample origin, age (years), silver content (% wt.), micro-hardness (HV0.01, HV0.025, HV0.05, HV0.1); the average speed of the indenter penetration into the sample for a load of 0.49035 N.
| Sample No. | Origin | Age (Years) | Silver Content (%wt.) | HV0.01 | HV0.025 | HV0.05 | HV0.1 | Indentator Speed (µm s−1) |
|---|---|---|---|---|---|---|---|---|
| 1 | Slovakia | 7 | 0.05 | 116 | 128 | 138 | 114 | 1.367 |
| 2 | Germany | 1 | 99.99 | 65 | 70 | 75 | 69 | 1.5 |
| 3 | Slovakia | 22 | 92.5 | 96 | 111 | 124 | 124 | 0.9 |
| 4 | Germany | 114 | 90 | 78 | 100 | 119 | 113 | 0.89 |
| 5 | Germany | 114 | 90 | 83 | 102 | 113 | 106 | 1.038 |
| 6 | Slovakia | 22 | 89.75 | 94 | 110 | 122 | 124 | 0.851 |
| 7 | Slovakia | 22 | 89.75 | 99 | 109 | 134 | 140 | 0.89 |
| 8 | Austria–Hungary | 129 | 83.5 | 101 | 116 | 127 | 128 | 0.864 |
| 9 | Austria–Hungary | 122 | 80 | 86 | 119 | 125 | 127 | 0.934 |
| 10 | Austria–Hungary | 122 | 80 | 101 | 121 | 131 | 139 | 0.856 |
| 11 | Slovakia | 21 | 75 | 106 | 125 | 138 | 119 | 0.86 |
| 12 | Czechoslovakia | 90 | 70 | 92 | 105 | 119 | 111 | 1.131 |
| 13 | Hungary | 85 | 64 | 95 | 110 | 121 | 102 | 1.875 |
| 14 | Hungary | 85 | 64 | 98 | 110 | 135 | 131 | 1.35 |
| 15 | Poland | 48 | 62.5 | 97 | 111 | 122 | 108 | 0.874 |
| 16 | Czechoslovakia | 87 | 50 | 105 | 115 | 125 | 105 | 1.21 |
| 17 | Czechoslovakia | 87 | 50 | 110 | 124 | 136 | 129 | 1.19 |
| 18 | Slovakia | 81 | 50 | 105 | 125 | 138 | 138 | 0.942 |
Table 2.
Parameters of ISE.
| Sample No. | n | Aln | c0 | c1 | c2 | W | A1 | c1/c2 | HPSR A1 |
|---|---|---|---|---|---|---|---|---|---|
| 1 | 1.9847 | 6.4802 | −0.0306 | 3.441 | 537.13 | 0.0095 | 599.95 | 0.00641 | 113.4505 |
| 2 | 2.1312 | 6.1450 | −0.0471 | 2.412 | 333.66 | −0.0095 | 367.24 | 0.007230 | 69.4451 |
| 3 | 2.1928 | 7.3783 | −0.1946 | 16.473 | 361.54 | −0.0012 | 666.66 | 0.04556 | 126.0654 |
| 4 | 2.2399 | 7.7507 | −0.221 | 14.316 | 379.43 | −0.0369 | 626.85 | 0.03773 | 118.5400 |
| 5 | 2.3501 | 7.1725 | −0.2632 | 18.354 | 273.48 | −0.0223 | 582.34 | 0.06711 | 110.1205 |
| 6 | 2.2960 | 7.4393 | −0.1540 | 10.570 | 485.30 | −0.0270 | 678.70 | 0.02178 | 128.3422 |
| 7 | 2.2698 | 8.4805 | −0.0326 | −0.024 | 866.67 | −0.0329 | 866.17 | −2.8E−05 | 163.7927 |
| 8 | 2.0802 | 7.3272 | −0.0060 | −0.472 | 696.50 | −0.0120 | 687.40 | −0.00068 | 129.9873 |
| 9 | 2.3881 | 7.7988 | −0.2766 | 20.500 | 322.60 | −0.0281 | 697.57 | 0.06355 | 131.9105 |
| 10 | 2.3808 | 8.1287 | −0.2080 | 15.690 | 538.00 | −0.0360 | 855.70 | 0.02916 | 161.8129 |
| 11 | 2.0513 | 6.9040 | −0.2098 | 20.425 | 247.76 | 0.0272 | 623.56 | 0.08244 | 117.9152 |
| 12 | 2.3120 | 7.0618 | −0.1030 | 5.293 | 519.30 | −0.0360 | 611.00 | 0.01019 | 115.5401 |
| 13 | 2.1910 | 6.3104 | −0.4490 | 35.370 | −70.17 | 0.0280 | 495.70 | −0.50406 | 93.7369 |
| 14 | 2.2821 | 7.6449 | −0.2302 | 18.735 | 353.30 | −0.0111 | 704.83 | 0.05303 | 133.2834 |
| 15 | 2.1159 | 6.7737 | −0.0523 | 3.2906 | 523.18 | −0.0115 | 580.67 | 0.00629 | 109.8047 |
| 16 | 1.9779 | 6.4455 | 0.1171 | −10.744 | 741.50 | −0.0134 | 552.57 | −0.01449 | 104.4910 |
| 17 | 2.1679 | 7.1045 | −0.1144 | 9.1285 | 523.18 | −0.0097 | 696.70 | 0.01745 | 131.7460 |
| 18 | 2.0240 | 8.0925 | 0.0110 | −2.130 | 788.60 | −0.0110 | 745.80 | −0.00207 | 141.0308 |
Table 3.
The relationship between the diameter of the grain and the diagonal of the indentation.
| Sample No. | Grain Diameter (µm) | Diagonal of the Indentation (µm) | |||
|---|---|---|---|---|---|
| HV0.01 | HV0.025 | HV0.05 | HV0.1 | ||
| 6 | 0.7–3.0 | 14.06 | 20.53 | 27.57 | 38.67 |
| 9 | 1.0–6.0 | 14.70 | 19.74 | 27.24 | 38.21 |
| 16 | 2.0–10.0 | 13.29 | 20.08 | 27.24 | 42.03 |
Disclaimer/Publisher’s Note: The statements, opinions and data contained in all publications are solely those of the individual author(s) and contributor(s) and not of MDPI and/or the editor(s). MDPI and/or the editor(s) disclaim responsibility for any injury to people or property resulting from any ideas, methods, instructions or products referred to in the content. |
© 2023 by the authors. Licensee MDPI, Basel, Switzerland. This article is an open access article distributed under the terms and conditions of the Creative Commons Attribution (CC BY) license (https://creativecommons.org/licenses/by/4.0/).
Share and Cite
MDPI and ACS Style
Šolc, M.; Blaško, P.; Petrík, J.; Palfy, P.; Girmanová, L. The Indentation Size Effect (ISE) of Ag–Cu Alloys. Crystals 2023, 13, 91. https://doi.org/10.3390/cryst13010091
AMA Style
Šolc M, Blaško P, Petrík J, Palfy P, Girmanová L. The Indentation Size Effect (ISE) of Ag–Cu Alloys. Crystals. 2023; 13(1):91. https://doi.org/10.3390/cryst13010091
Chicago/Turabian StyleŠolc, Marek, Peter Blaško, Jozef Petrík, Pavol Palfy, and Lenka Girmanová. 2023. "The Indentation Size Effect (ISE) of Ag–Cu Alloys" Crystals 13, no. 1: 91. https://doi.org/10.3390/cryst13010091
Note that from the first issue of 2016, this journal uses article numbers instead of page numbers. See further details here.