
Comparative Study on Gemological and Mineralogical Characteristics and Coloration Mechanism of Four Color Types of Fluorite

Abstract
:1. Introduction
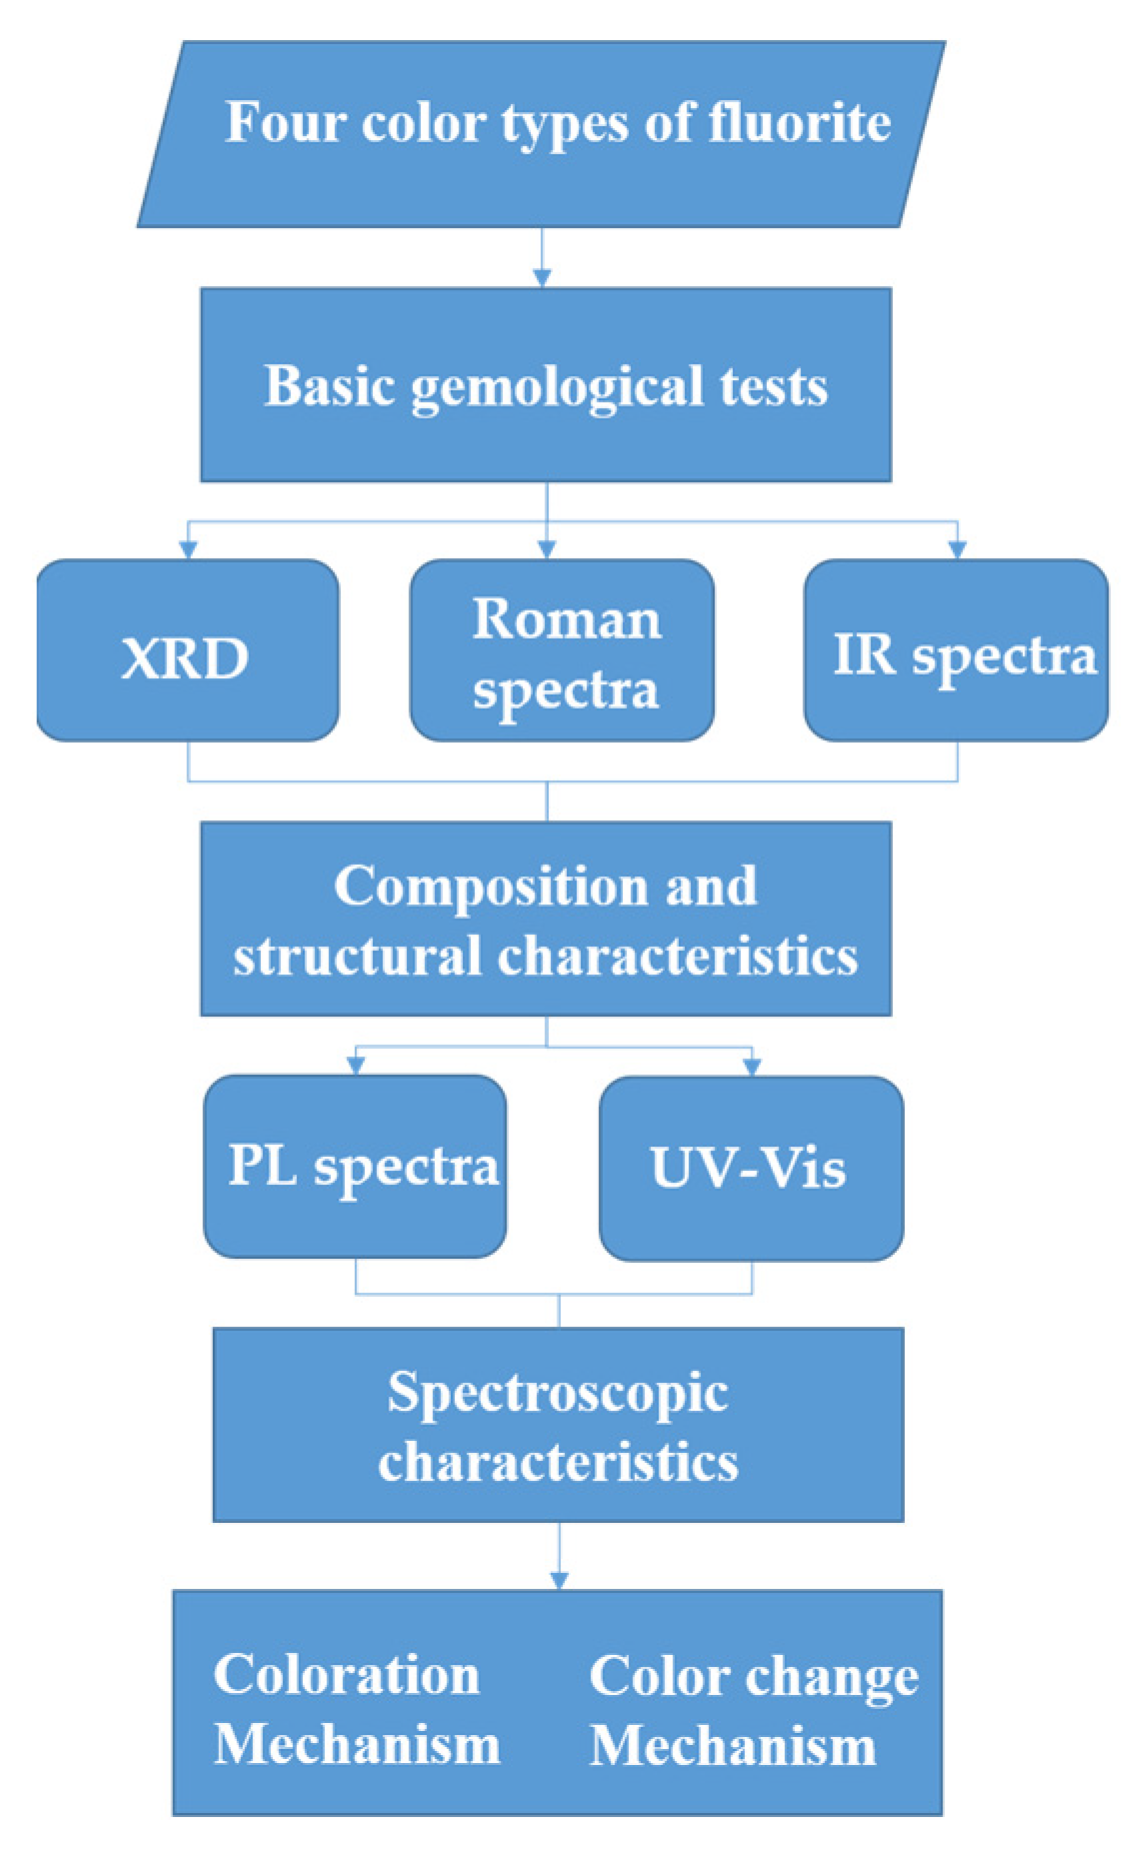
2. Materials and Methods
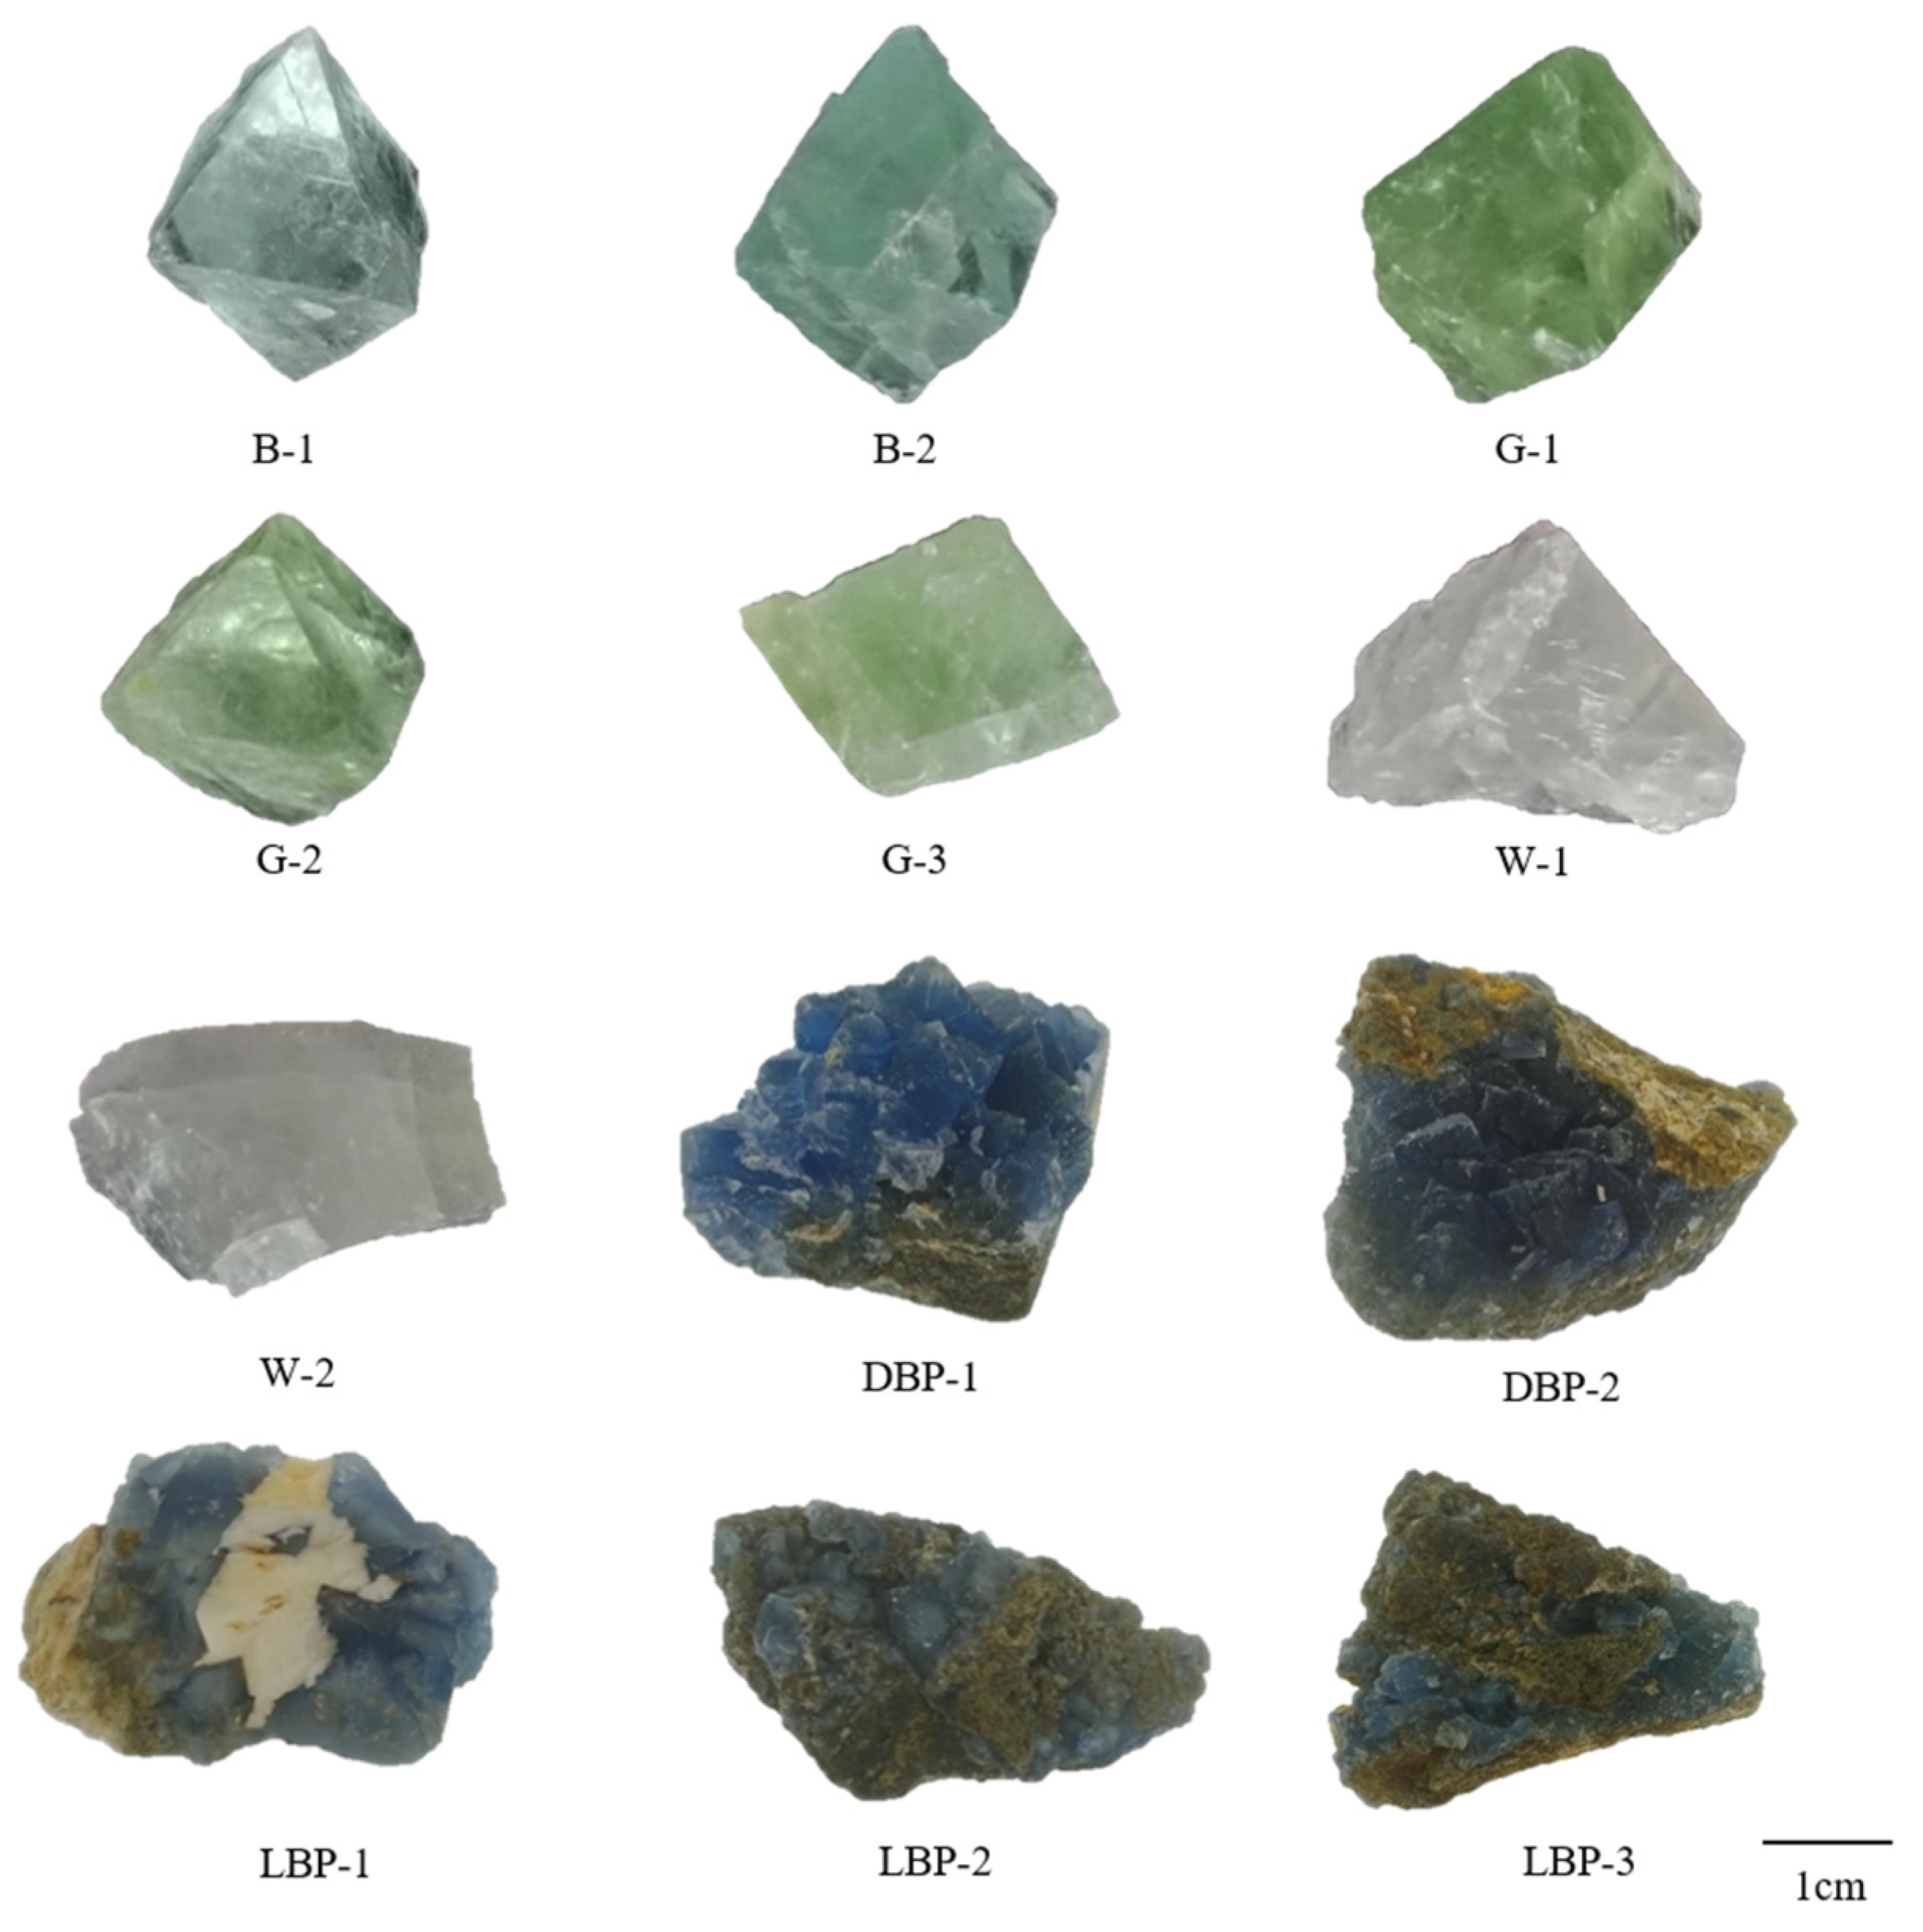
2.1. Flourite Samples
2.2. Methods
3. Results and Discussion
3.1. Basic Gemological Features
3.2. Structure and Composition Characteristics
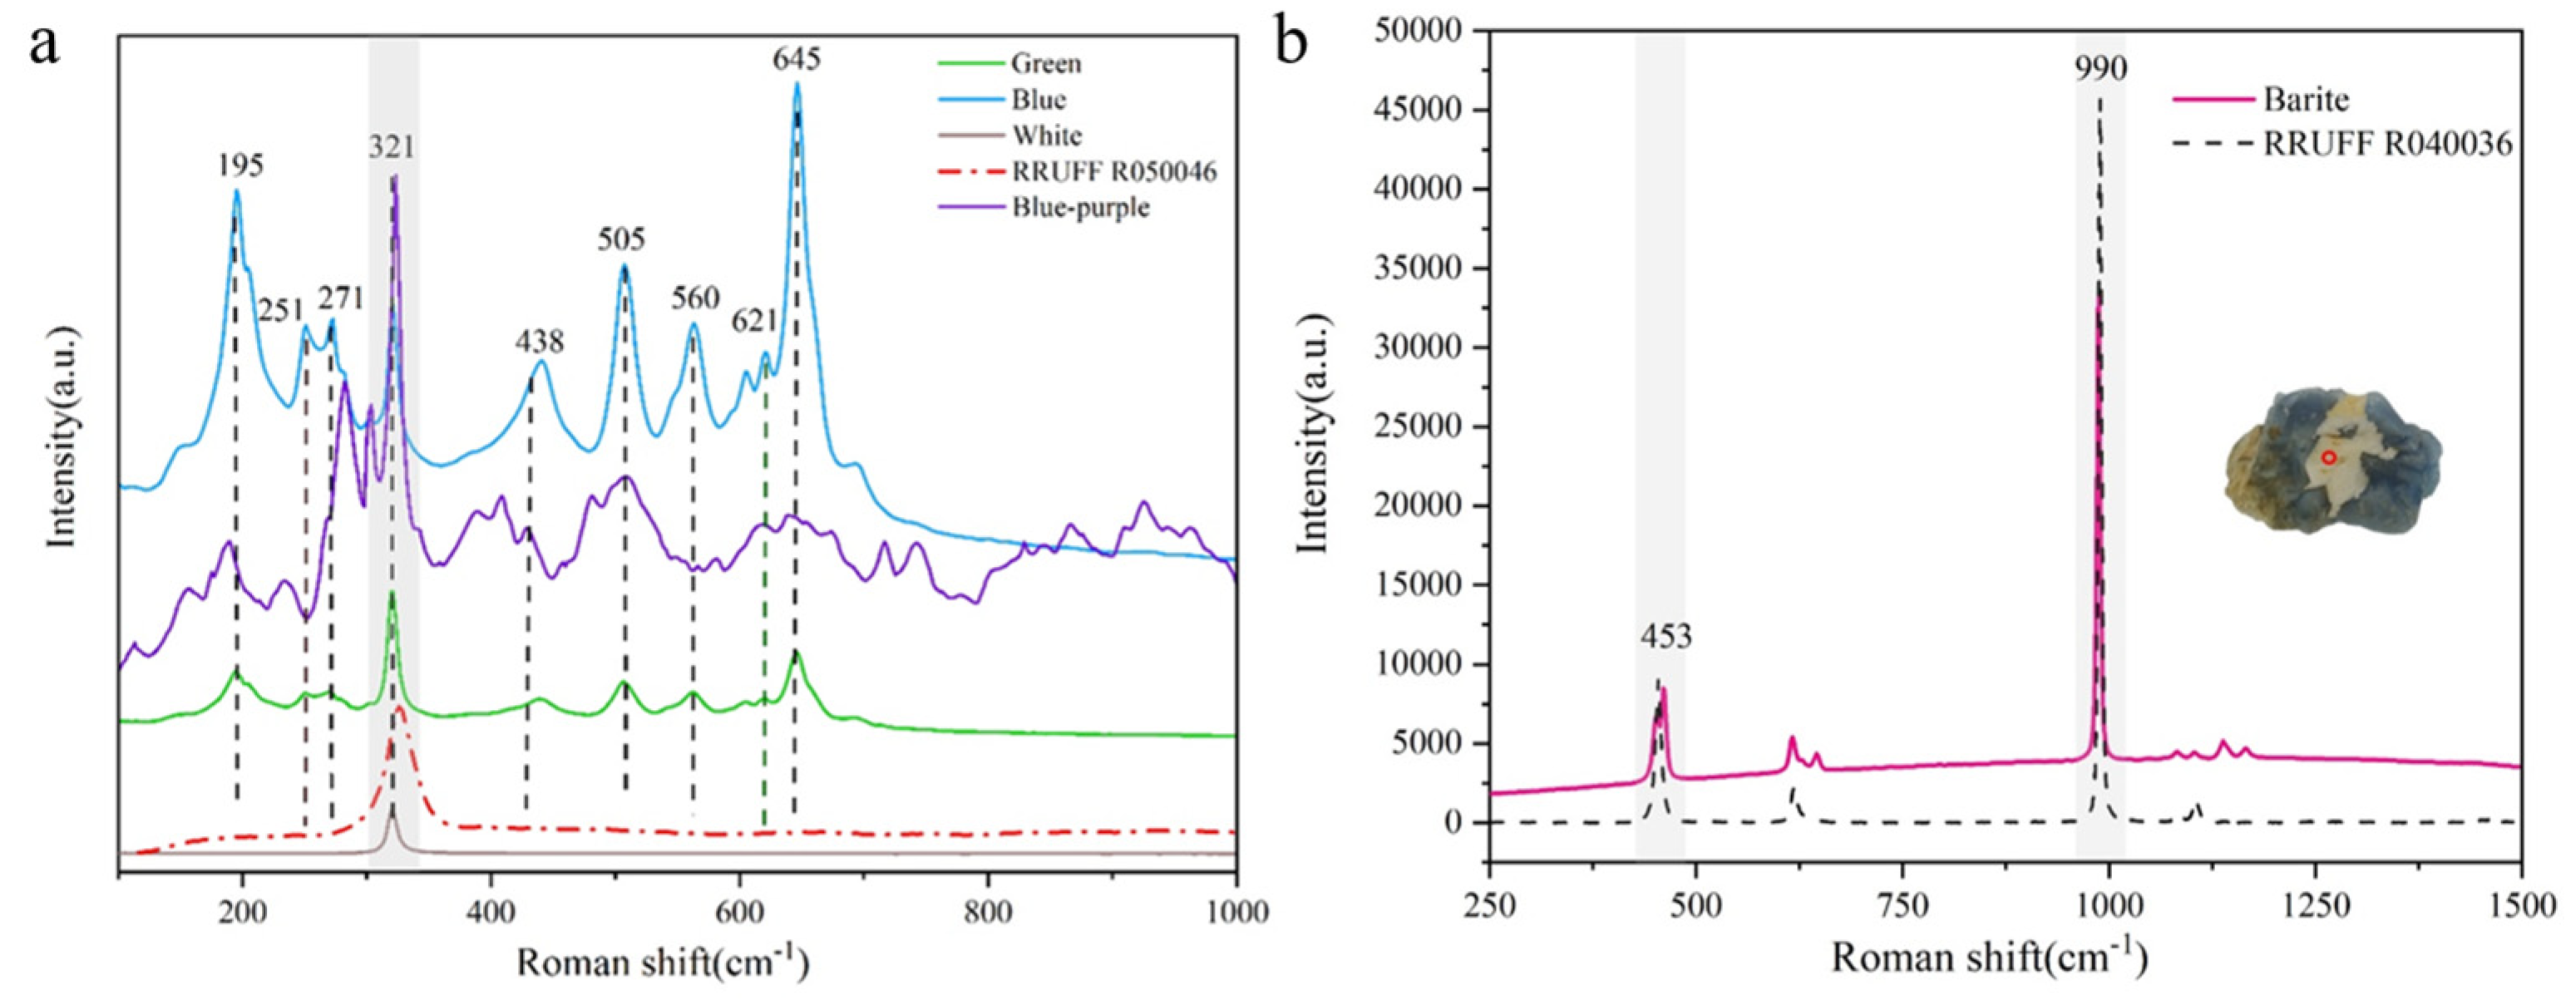
3.3. Spectroscopic Characterization Tests
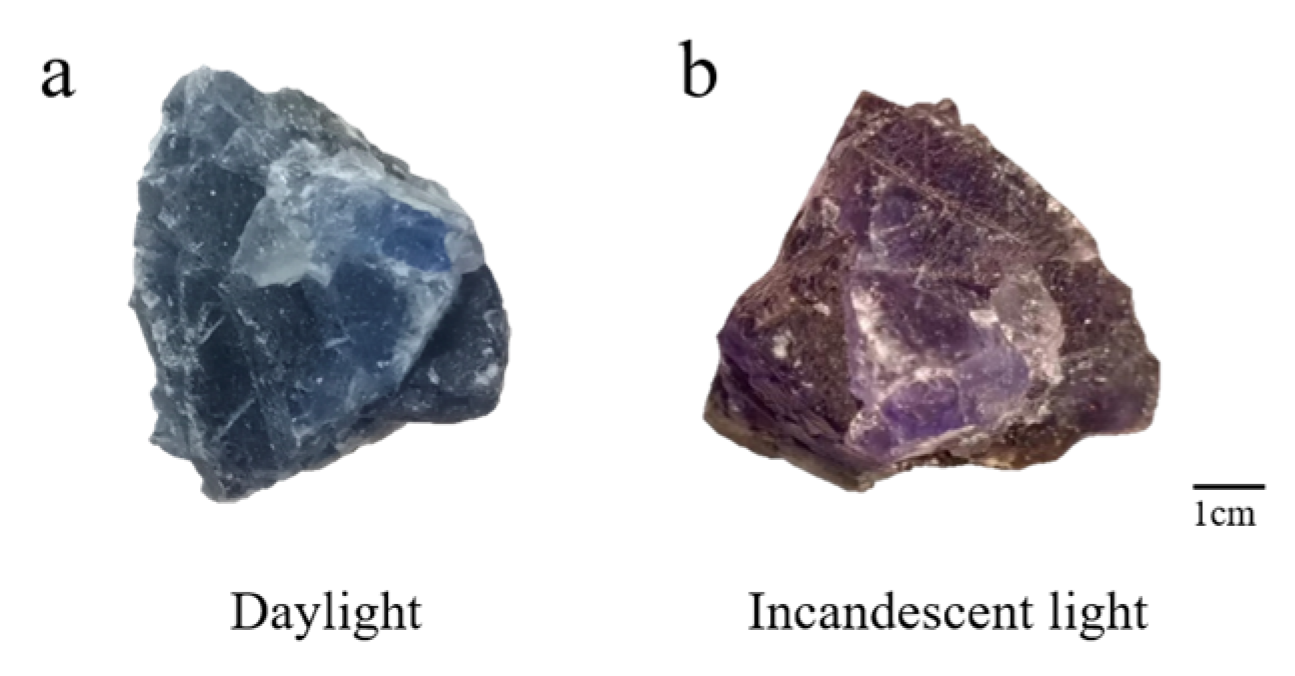
3.3.1. Luminescence Properties
3.3.2. UV-Vis Spectra
4. Conclusions
Supplementary Materials
Author Contributions
Funding
Data Availability Statement
Conflicts of Interest
References
- Dudkin, V.A.; Rukhin, V.B. Optical strength of mirrors on fluorite substrates subjected to cw radiation from a chemical CO laser. Sov. J. Quantum Electron. 1994, 24, 153–154. [Google Scholar] [CrossRef]
- Apollonov, V. Spectroscopic investigation of rare earth doped Na, (Y, Lu)-fluorite crystals as promising UV and VUV laser materials. In Proceedings of the Technical Digest of International Quantum Electronics Conference, Moscow, Russia, 1 January 2002. [Google Scholar]
- Miller, J.D.; Hu, J.S.; Jin, R. Thermochemistry of oleate adsorption at the fluorite/water interface. Colloids Surf. 1989, 42, 71–84. [Google Scholar] [CrossRef]
- Gao, Z.; Wang, C.; Sun, W.; Gao, Y.; Kowalczuk, P.B. Froth flotation of fluorite: A review. Adv. Colloid Interface Sci. 2021, 290, 102382. [Google Scholar] [CrossRef] [PubMed]
- Yuan, K. Preliminary Discussion on the Characteristics and Mining Prospect of Chinese Ornamental Stones. J. Guilin Inst. Technol. 1991, S1, 1–7. [Google Scholar]
- Zheng, H.; Li, B.; Luo, Y.; Zhu, X. The Research Status of Fluorite Color. J. Henan Sci. Technol. 2015, 566, 105–107. [Google Scholar]
- Sturman, N.; Al-Alawi, A. Gem news international: Color-change fluorite. Gems Gemol. 2006. [Google Scholar]
- Macri, M.; Maras, A.; Melis, E.; Ballirano, P. Fluorite from Ethiopia. Gems Gemol. 2007, 43, 168–169. [Google Scholar]
- Liu, W. Restudy of the Black Fluorite in the Huayuan Pb Zn Deposit. J. Chengdu Univ. Technol. 1999, 02, 1–6. [Google Scholar]
- Ogundare, F.O.; Balogun, F.A.; Hussain, L.A. Kinetic characterization of the thermoluminescence of natural fluorite. Radiat. Meas. 2004, 38, 281–286. [Google Scholar] [CrossRef]
- Yegingil, Z.; Nur, N.; Dogan, T.; Yazici, N.; Topaksu, M. Effects of annealing and high radiation dose on the thermoluminescence characteristics of natural fluorite. Radiat. Meas. 2012, 47, 981–987. [Google Scholar] [CrossRef]
- Mukerji, K.S.; Sengupta, S.; Kaul, I.K. Studies on some influencing parameters in the thermoluminescence of natural fluorites. Mod. Geol. 1981, 8, 1–11. [Google Scholar]
- Rubloff, G.W.; Freeouf, J.; Fritzsche, H.; Murase, K. Far-Ultraviolet Reflectance Spectra of Ionic Crystals. Phys. Rev. Lett. 1971, 27, 1317–1320. [Google Scholar] [CrossRef]
- Bill, H.; Calas, G. Color centers, associated rare-earth ions and the origin of coloration in natural fluorites. Phys. Chem. Miner. 1978, 3, 117–131. [Google Scholar] [CrossRef]
- Staebler, D.L. Optical Studies of a Photochromic Color Center in Rare-Earth-Doped CaF2. Phys. Rev. B 1971, 38, 281–286. [Google Scholar] [CrossRef]
- Allen, R.D. Variations in chemical and physical properties of fluorite. Am. Mineral. 1952, 37, 910–930. [Google Scholar]
- Dill, H.G.; Weber, B. Variation of color, structure and morphology of fluorite and the origin of the hydrothermal F-Ba deposits at Nabburg-Wolsendorf, SE Germany. Neues Jahrb. Mineral. Abh. 2010, 187, 113–132. [Google Scholar] [CrossRef]
- Xiang, X.; Zu, X.T.; Zhu, S.; Ding, T.H.; Wang, L.M. Effects of electron irradiation and subsequent annealing on the optical absorption and photoluminescence of CaF2 single crystals. Opt. Mater. 2006, 28, 930–934. [Google Scholar] [CrossRef]
- Ryskin, A.I.; Fedorov, P.P.; Lushchik, A.; Generalov, M.E.; Kudryavtseva, I. Absorption spectrum of dark purple fluorite, Kent deposit, Kazakhstan. J. Fluor. Chem. 2020, 240, 109654. [Google Scholar] [CrossRef]
- O’Connor, J.R.; Chen, J.H. Color Centers in Alkaline Earth Fluorides. Phys. Rev. 1963, 130, 1790–1791. [Google Scholar] [CrossRef]
- Scouler, W.J.; Smakula, A. Coloration of Pure and Doped Calcium Fluoride Crystals at 20 °C and −190 °C. Phys. Rev. 1960, 120, 1154–1161. [Google Scholar] [CrossRef]
- Jeran, M.; Smrekolj, N.; Horváth, P. Phenomenon of light emission in inorganic materials: Fluorescence activity of fluorite mineral. In Proceedings of the Socratic Lectures: 3rd International Minisymposium, Ljubljana, Slovenia, 17 April 2020; pp. 90–96, ISBN 978-961-7112-00-9. Available online: https://www.zf.uni-lj.si/images/stories/datoteke/Zalozba/Sokratska_2020.pdf (accessed on 1 December 2022).
- Gaft, M.; Waychunas, G.A.; Rossman, G.R.; Nagli, L.; Raichlin, Y. Red photoluminescence and purple color of naturally irradiated fluorite. Phys. Chem. Miner. 2020, 47, 46. [Google Scholar] [CrossRef]
- Ge, X.; Guo, Q.; Wang, Q.; Li, T.; Liao, L. Mineralogical Characteristics and Luminescent Properties of Natural Fluorite with Three Different Colors. Materials 2022, 15, 1983. [Google Scholar] [CrossRef] [PubMed]
- Sidike, A.; Kusachi, I.; Yamashita, N. Natural fluorite emitting yellow fluorescence under UV light. Phys. Chem. Miner. 2003, 30, 478–485. [Google Scholar] [CrossRef]
- Pagel, M.; Barbin, V.; Blanc, P.; Ohnenstetter, D. Systematic Cathodoluminescence Spectral Analysis of Synthetic Doped Minerals: Anhydrite, Apatite, Calcite, Fluorite, Scheelite and Zircon; Springer: Berlin/Heidelberg, Germany, 2000; pp. 127–160. [Google Scholar]
- Ye, S.; Zhu, B.; Chen, J.; Luo, J.; Qiu, J.R. Infrared quantum cutting in Tb3+, Yb3+ codoped transparent glass ceramics containing CaF2 nanocrystals. Appl. Phys. 2008, 92, 34–36. [Google Scholar] [CrossRef]
- Tallant, D.R.; Wright, J.C. Selective laser excitation of charge compensated sites in CaF2: Er3+. J. Chem. Phys. 1975, 63, 2074–2085. [Google Scholar] [CrossRef]
- Blanchard, F.N. Thermoluminescence of fluorite and age of deposition. Am. Mineral. J. Earth Planet. Mater. 1966, 51, 474–485. [Google Scholar]
- Dubourg, R.; Schvoerer, M.; Dumercq, B.; Berger, R. Mechanisms of thermoluminescence in natural and synthetic fluorites CaF2. Phys. Status Solidi A 1989, 115, 335–345. [Google Scholar] [CrossRef]
- Yang, F.; Xiao-Yan, Y.U.; Lei, Y.P. Study on Colour-Change Effect of Fluorite from Fuping, Hebei Province. J. Gems Gemmol. 2006, 2, 4–8. [Google Scholar]
- Baatartsogt, B.; Wagner, T.; Taubald, H.; Mierdel, K.; Markl, G. Hydrogen isotope determination of fluid inclusion water from hydrothermal fluorite: Constraining the effect of the extraction technique. Chem. Geol. 2007, 244, 474–482. [Google Scholar] [CrossRef]
- Pandurangappa, C.; Lakshminarasappa, B.N.; Nagabhushana, B.M. Synthesis and optical studies of gamma irradiated Eu doped nanocrystalline CaF2. J. Alloys Compd. 2011, 509, 7671–7673. [Google Scholar] [CrossRef]
- Ruan, Y.; Zhang, S.; Lu, S.; Li, G.; Li, W.; Liu, J. Growth and spectrum properties of Ce: YVO4 single crystal. J. Rare Earths 2007, 25, 122–124. [Google Scholar]
- Yuan, L.I.; Wang, C.Q.; Wang, S.Q.; Yang, Y. Thermoluminescence in natural fluorite. Acta Petrol. Mineral. 2016, S1, 68–72. [Google Scholar]
- Zidarova, B. Formation temperature, REE contents and optical spectra of fluorite from the Mikhalkovo deposit (Central Rhodopes, Bulgaria): Genetic implications and practical significance. Neues Jahrb. Mineral. Abh. 2011, 188, 257–283. [Google Scholar] [CrossRef] [PubMed]
- Kim, M.; Yoon, Y.; Kang, M.; Shin, D. Spectroscopic characteristics of natural fluorite induced by electron-beam irradiation. J. Ceram. Process. Res. 2012, 13, 541–546. (In English) [Google Scholar]


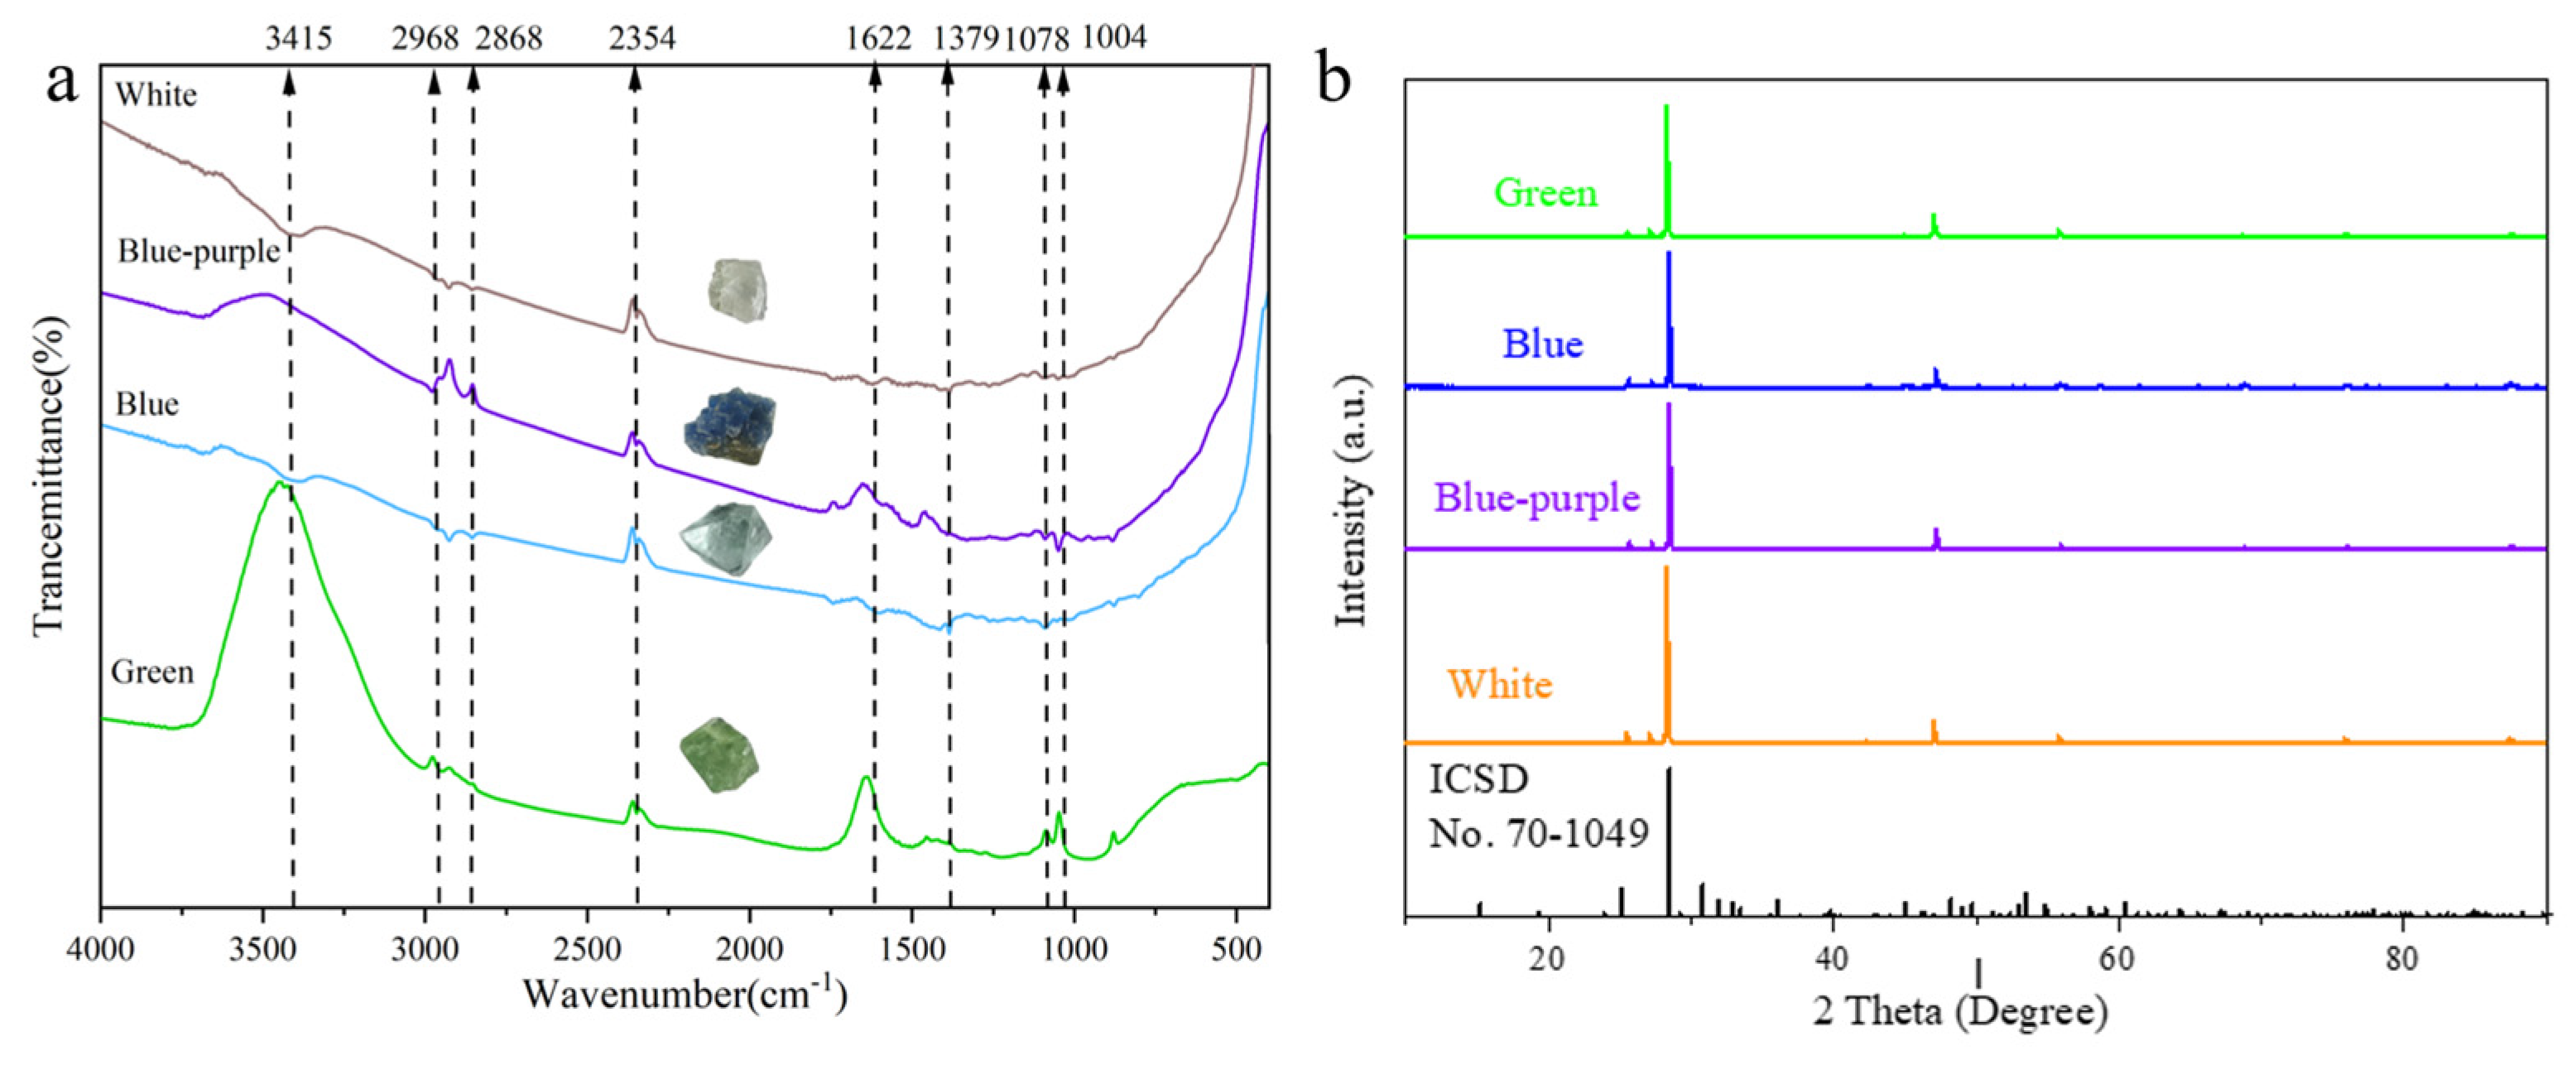
| Sample Number | a, b, c (Å) | Cell Volume (Å3) | Fit (R) | Relative Density (d) |
|---|---|---|---|---|
| White | 5.4595 | 162.72 | 8.35% | 3.19 |
| Green | 5.4358 | 160.61 | 7.33% | 3.23 |
| Blue | 5.4320 | 160.28 | 7.29% | 3.24 |
| Blue-purple | 5.4629 | 163.03 | 11% | 3.18 |
| ICSD No.70-1049 | 5.4502 | 161.90 | 3.20 |
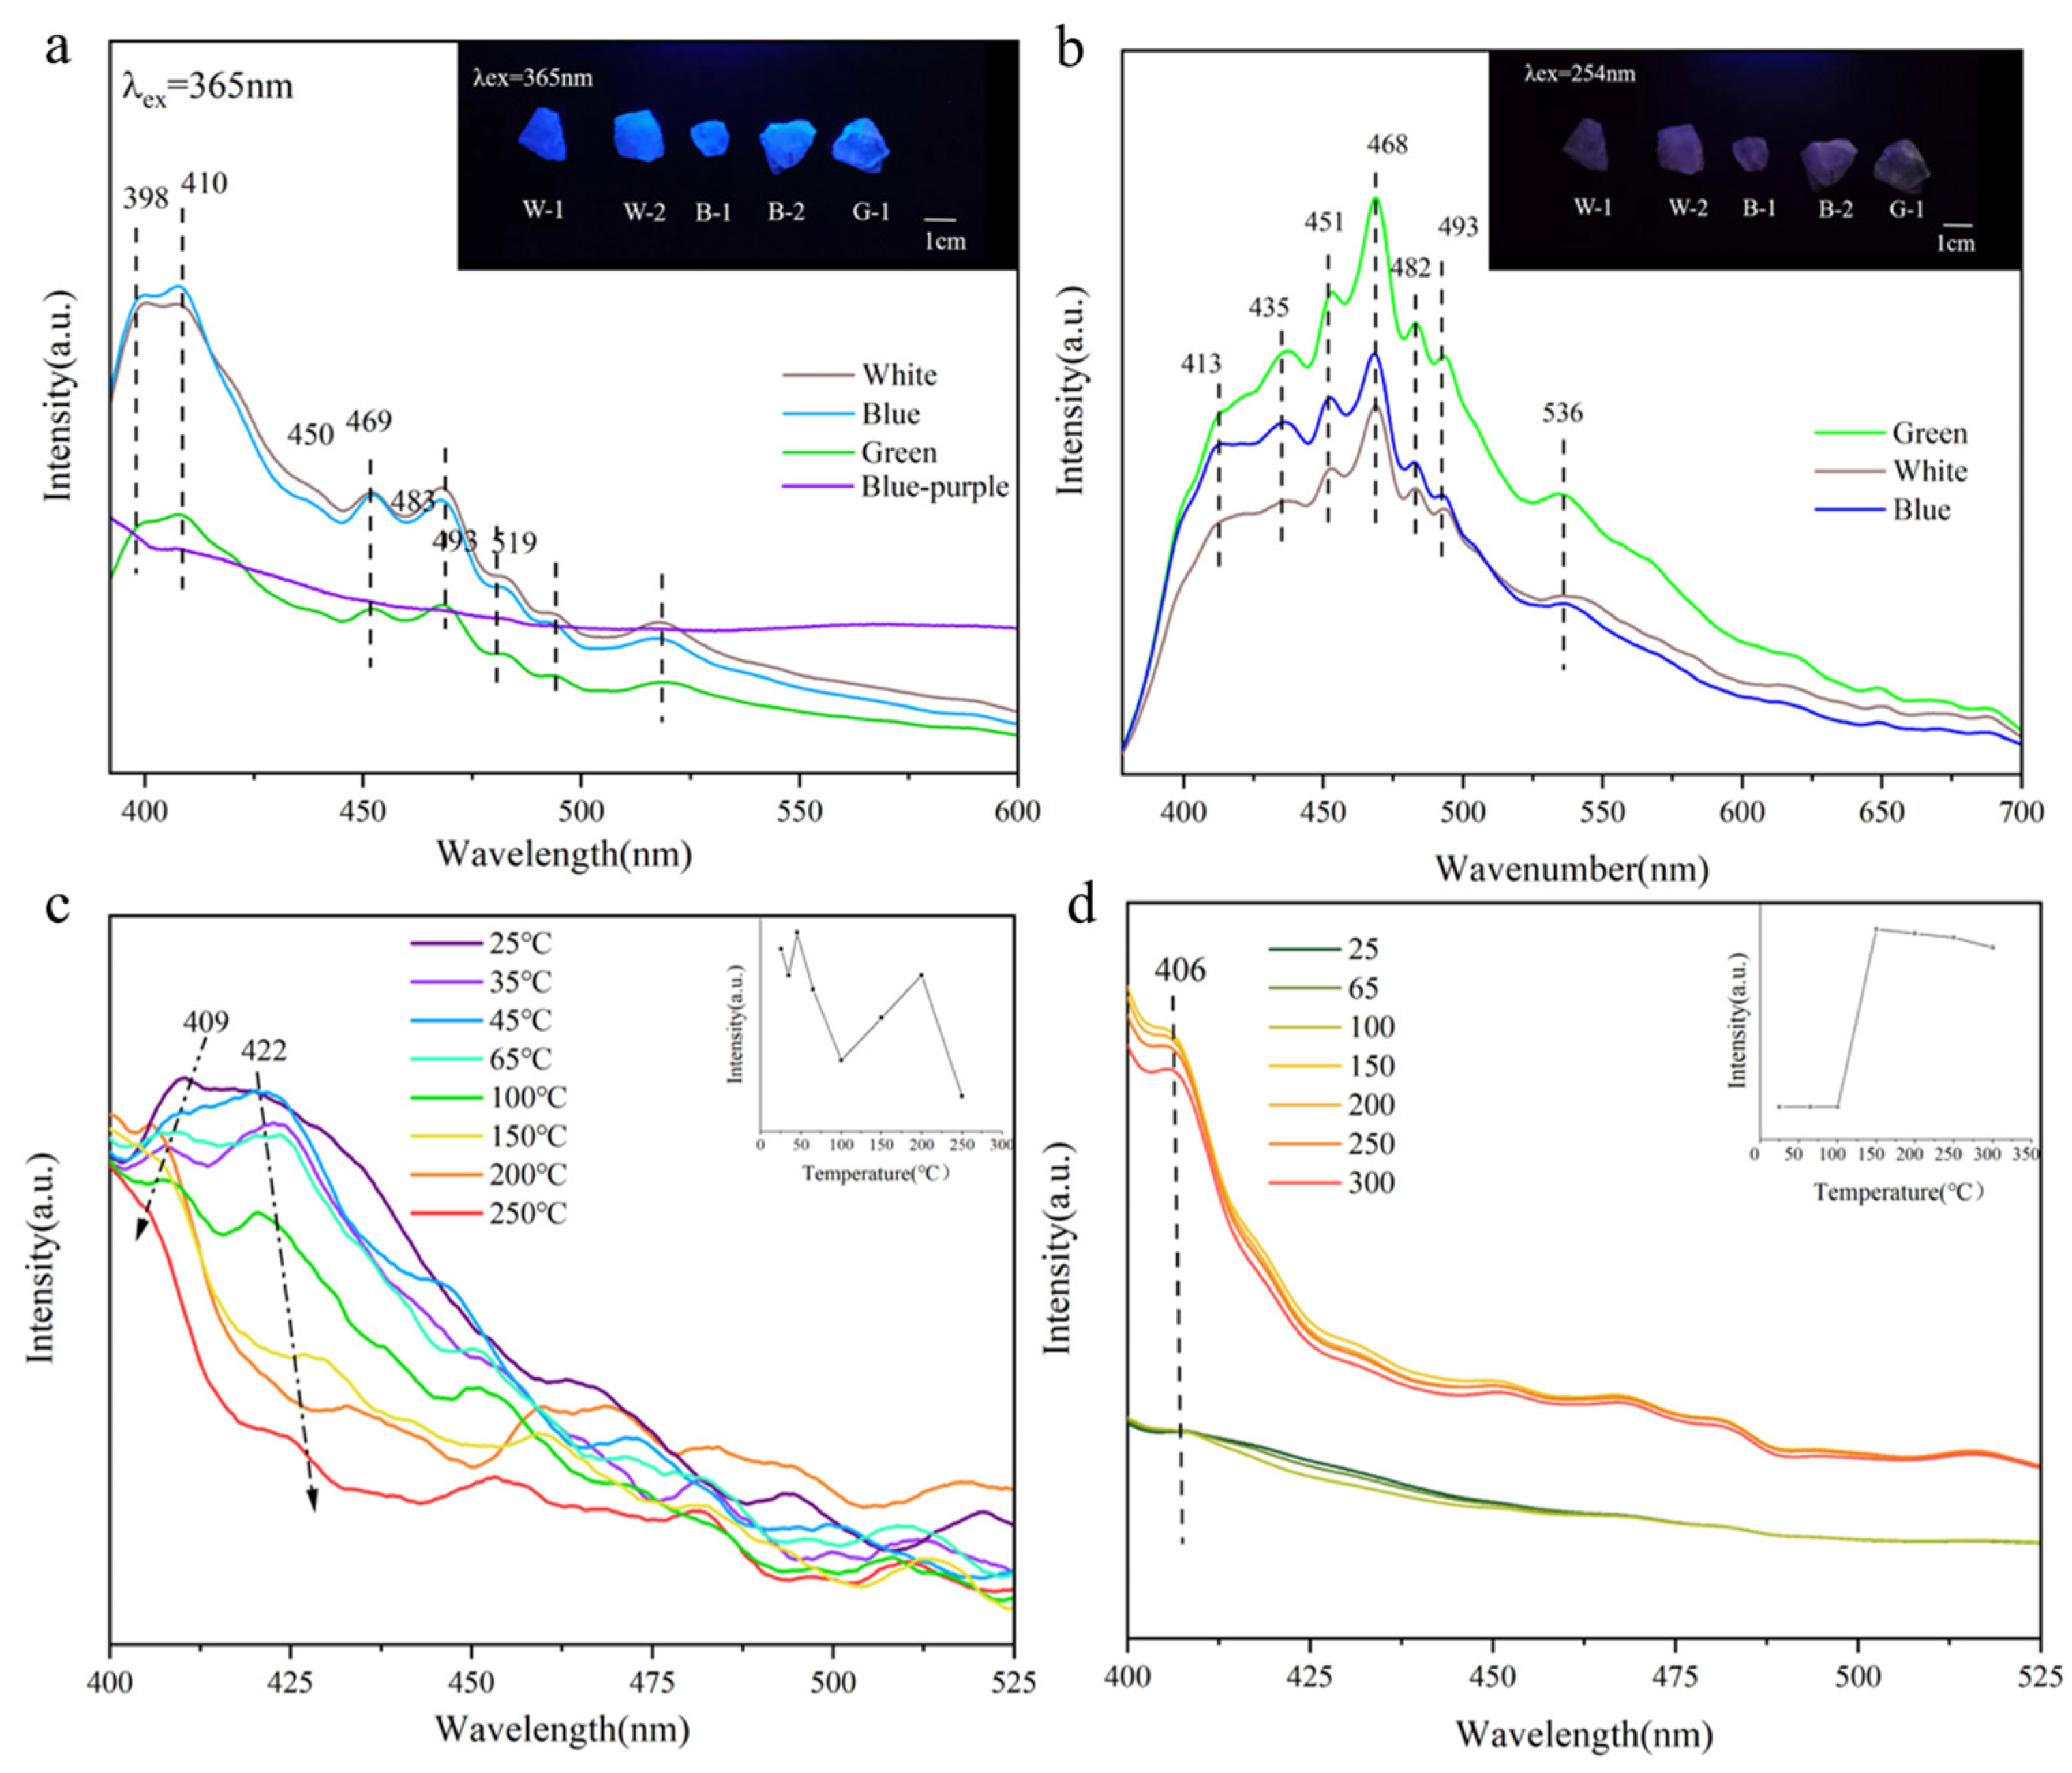
| Color | Emission Lines | Possible Rare Earth Ions | Electronic Transitions |
|---|---|---|---|
| Blue Green White | 398 and 410 nm 468 nm 452 nm 482–483 nm 493–494 nm 540 nm | Eu2+ Tm3+ Tm3+ Pr3+ Tb3+ Er3+ | 4f65d→8S7/2 1G4→3H6 1D2→3H4 3H4→3P0 5D4→3F6 4S3/2→4I15/2 |
| Blue-Purple | 398 and 410 nm | Eu2+ | 4f65d→8S7/2 |
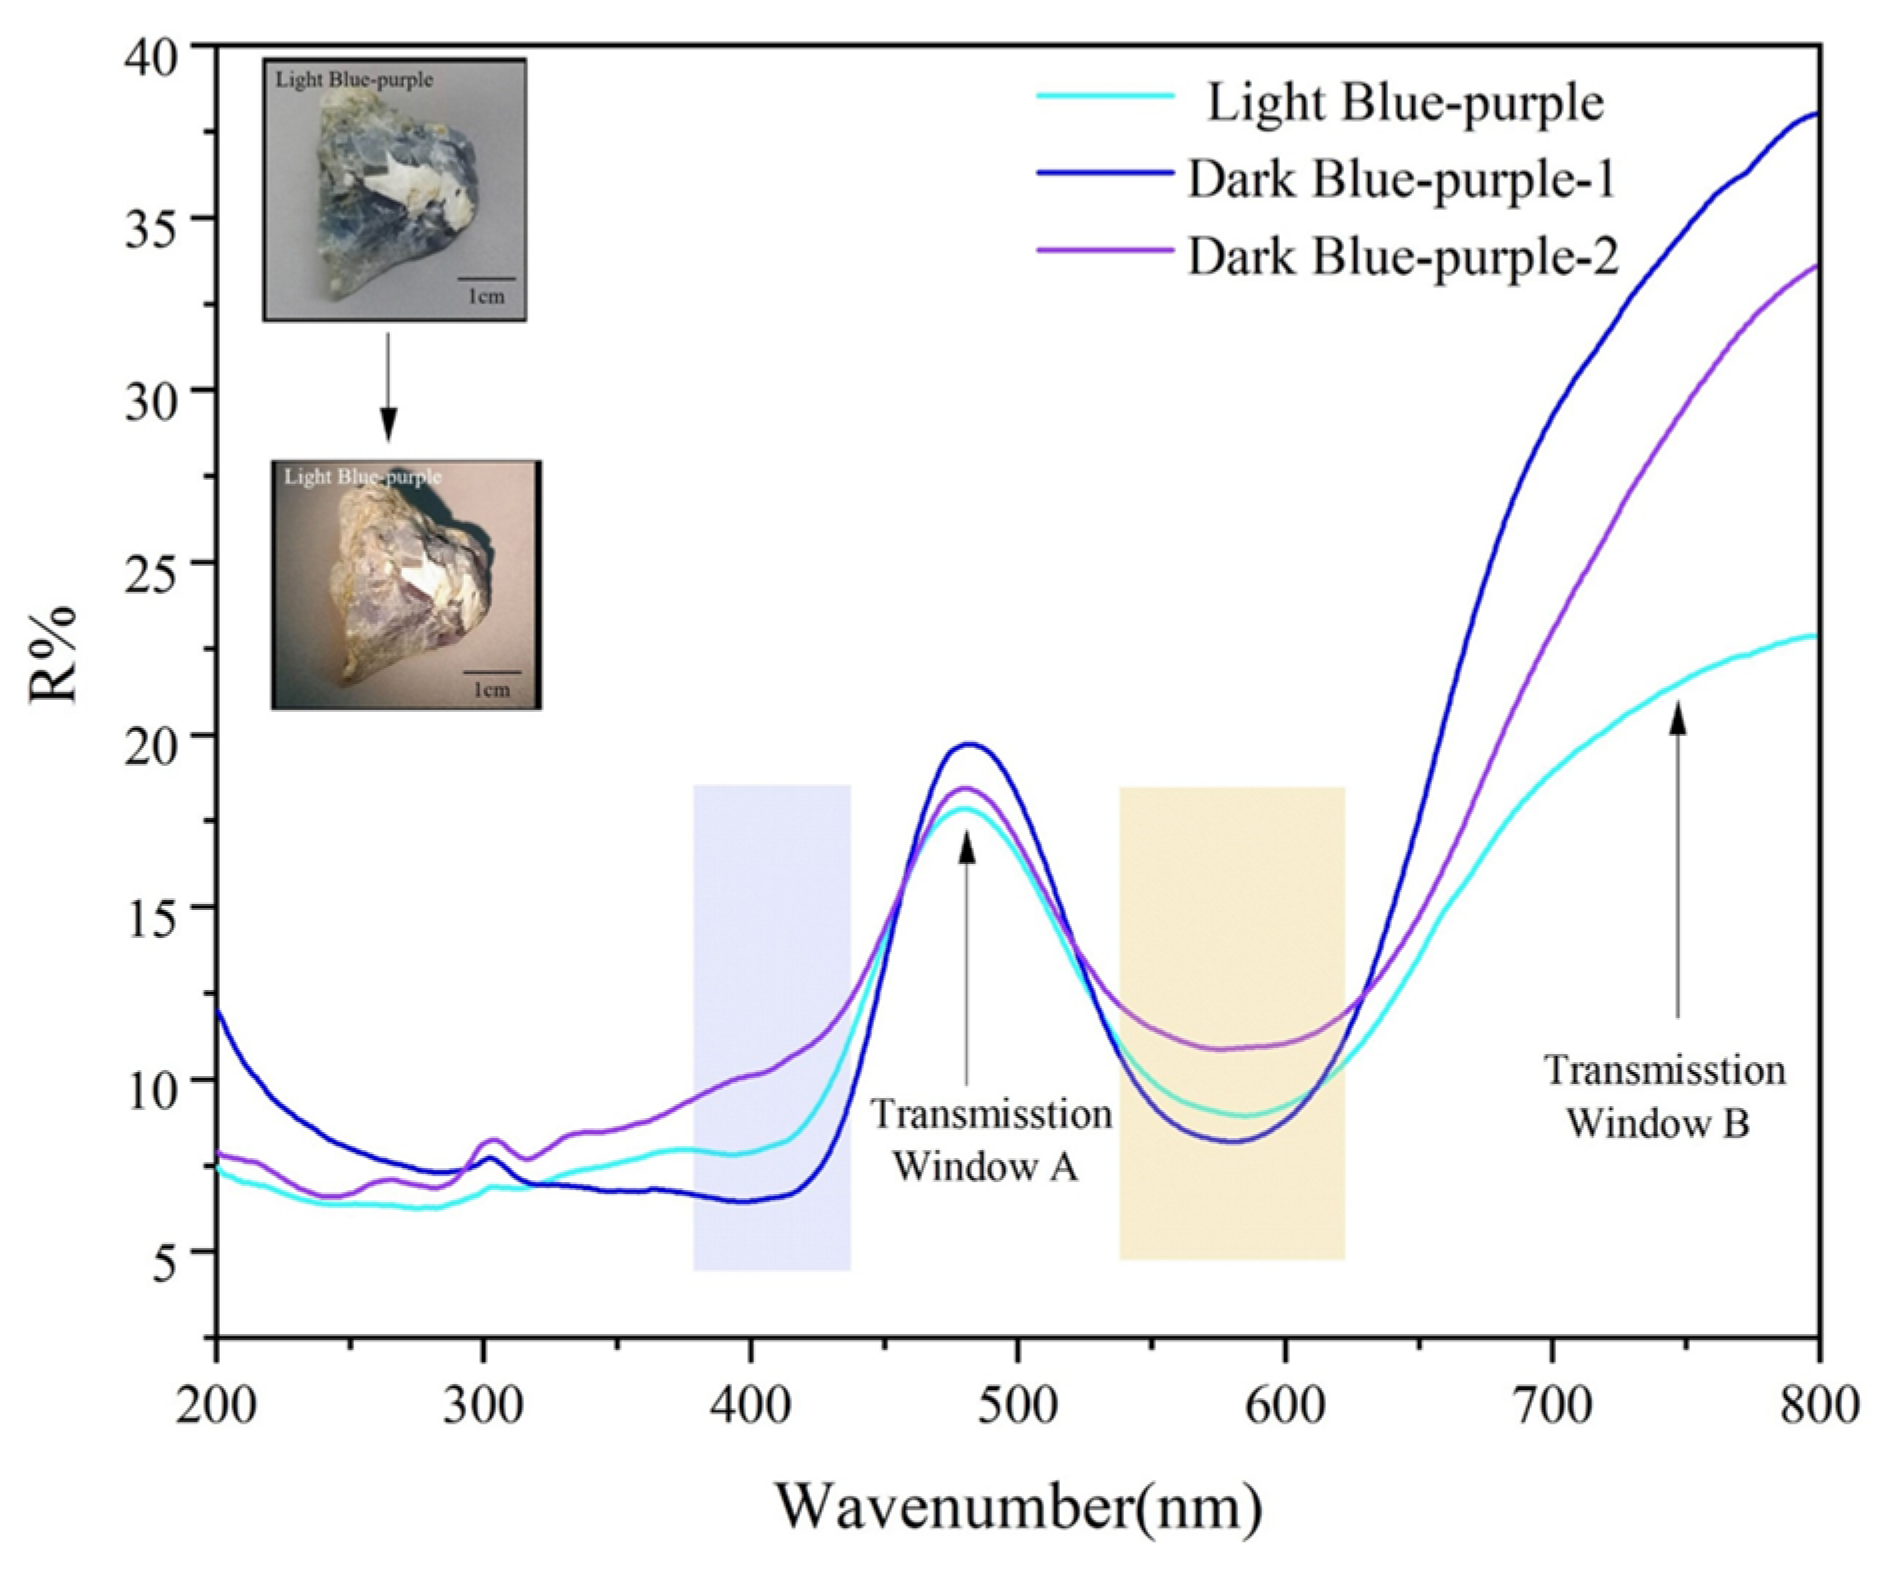
| Color | Possible Causes | Absorption | References | |
|---|---|---|---|---|
| Main | Secondary | |||
| Blue | Y3+-F− Center. | 300~400 | 500~600 | [14,15] |
| Colloidal calcium | 580 | / | [14,17,19] | |
| 2F− center | 580 | / | [36] | |
| Green | Colloidal calcium | 573~600 | / | [14,17,19] |
| Sm2+ | 440 | 611 | [14,16] | |
| Y3+-Ce2+-F− | 300 | 590 and 712 | [14,16] | |
| Purple | Colloidal calcium | 570 | / | [14,16,17,19] |
Disclaimer/Publisher’s Note: The statements, opinions and data contained in all publications are solely those of the individual author(s) and contributor(s) and not of MDPI and/or the editor(s). MDPI and/or the editor(s) disclaim responsibility for any injury to people or property resulting from any ideas, methods, instructions or products referred to in the content. |
© 2023 by the authors. Licensee MDPI, Basel, Switzerland. This article is an open access article distributed under the terms and conditions of the Creative Commons Attribution (CC BY) license (https://creativecommons.org/licenses/by/4.0/).
Share and Cite
Liu, Y.; Guo, Q.; Liu, L.; Zhang, S.; Li, Q.; Liao, L. Comparative Study on Gemological and Mineralogical Characteristics and Coloration Mechanism of Four Color Types of Fluorite. Crystals 2023, 13, 75. https://doi.org/10.3390/cryst13010075
Liu Y, Guo Q, Liu L, Zhang S, Li Q, Liao L. Comparative Study on Gemological and Mineralogical Characteristics and Coloration Mechanism of Four Color Types of Fluorite. Crystals. 2023; 13(1):75. https://doi.org/10.3390/cryst13010075
Chicago/Turabian StyleLiu, Yang, Qingfeng Guo, Liangyu Liu, Sixue Zhang, Qingling Li, and Libing Liao. 2023. "Comparative Study on Gemological and Mineralogical Characteristics and Coloration Mechanism of Four Color Types of Fluorite" Crystals 13, no. 1: 75. https://doi.org/10.3390/cryst13010075