Article

Interfacial Characteristics of Graphene-Reinforced Iron Composites: A Molecular Dynamics Study

1
School of Materials Science and Engineering, Northeastern University, Shenyang 110819, China
2
State Key Lab of Rolling and Automation, Northeastern University, Shenyang 110819, China
3
State Key Laboratory of Nonlinear Mechanics, Institute of Mechanics, Chinese Academy of Sciences, Beijing 100190, China
*
Authors to whom correspondence should be addressed.
Crystals 2023, 13(1), 27; https://doi.org/10.3390/cryst13010027
Submission received: 26 November 2022 / Revised: 17 December 2022 / Accepted: 21 December 2022 / Published: 24 December 2022
(This article belongs to the Section Inorganic Crystalline Materials)

Abstract

:
Interface has a significant effect on mechanical properties of graphene reinforced metal composites. Taking graphene nanosheet reinforced iron composite (Gr/Fe) as an example, the interfacial characteristics of Gr/Fe (110), (111), ( 11 2 ¯ ), and (001) interfaces have been studied using molecular dynamics (MD) simulations. Two types of interfacial bonding have been examined: physical and chemical bonding. The results show that when the graphene and iron form a physical adsorption (weak-bonded) interface, the interactive energy of the graphene and Fe (110), (111), ( 11 2 ¯ ), and (001) interface is −1.00 J/m2, −0.73 J/m2, −0.82 J/m2, and −0.81 J/m2, respectively. The lengths of the Fe-C bonding are distributed in the range of 2.20–3.00 Å without carbide formation, and no distinct patterns of atomic structure are identified. When the graphene and iron form a chemical (strong-bonded) interface, the corresponding interactive energy is −5.63 J/m2, −4.32 J/m2, −4.39 J/m2, and −4.52 J/m2, respectively. The lengths of the Fe-C bonding are mainly distributed in the ranges of 1.80–2.00 Å and 2.30–2.50 Å, which the carbides such as Fe3C and Fe7C3 are formed at the interface. Moiré patterns are observed at different-oriented interfaces, because of the lattice geometrical mismatch between graphene and different-oriented iron crystal structures. The pattern of diamond stripe is at the (110) interface, which is in good accordance with the experiment. Other patterns are the hexagonal pattern at the (111) interface, the wavy stripe pattern at the ( 11 2 ¯ ) interface, and the chain pattern at the (001) interface. These moiré patterns are formed through the competition and coordination of the three binding sites (Hollow, Bridge, and Top) of graphene with Fe atoms.

1. Introduction

Graphene, as a model of two-dimensional carbon material with excellent mechanical, physical, and chemical properties, is potentially used in new-generation composites. By combining unique electricity [1,2,3], heat [4], mechanics [5,6,7,8], and other properties [9,10,11], graphene reinforced metal matrix composites such as copper [12,13,14], aluminum [15,16,17], nickel [18,19], and iron [20,21] are prosperous in the applications of future aerospace, military, transportation, and energy industries. For instance, compared with unreinforced aluminum matrix, the tensile strength and elongation of nano-graphene reinforced aluminum matrix composites increased from 233 MPa to 287 MPa and 5.5% to 5.8%, respectively [17]. The yield strength of graphene nanosheet reinforced iron matrix composite can be increased up to 1647 MPa, compared with 110 MPa of pure iron matrix [22]. Since graphene has a large contact area with metal matrix, graphene/metal interface, as a transition region connecting the reinforcement phase and matrix, significantly affects the properties of composites.
The interfacial characteristics of graphene/metal are crucial in graphene reinforced metal matrix composites, where the interfacial reaction often occurs, for instance Al-C reaction [23] and Fe-C reaction [24]. In graphene/metal composites, the structure and bonding features at the interface are very complex. By utilizing advanced technology, such as X-ray photoelectron spectroscopy (XPS), scanning tunneling microscopy (STM), and low-energy electron diffraction (LEED), the orderly cyclical atomic structures (termed as moiré patterns) were often observed at the graphene/metal interfaces [25,26,27]. Jacobberger et al. presented a comprehensive study of the evolution of graphene/Cu interface as a function of the matrix orientation, which provided a new way to adjust the structure and morphology of graphene reasonably [28]. Rasool et al. studied the atomic-scale characterization of graphene grown on Cu (100) surface by STM and graphene was firstly observed over copper steps, corners, and screw dislocations [29]. Through LEED and STM, Vinogradov et al. found that on the graphene/Fe (110) interface showed a new periodic moiré pattern, and the observed topography of the graphene/Fe superstructure was well reproduced by density functional theory (DFT) calculations, resulted from a unique combination of the lattice mismatch and strong interfacial interaction [30]. Based on near-edge X-ray absorption fine structure (NEXAFS) and photoelectron spectroscopy (PES), Preobrajenski et al. found that the degree of corrugation of graphene critically depended on the strength of chemical bonding at the interface, which was rising in the series of Pt (111)-Ir (111)-Rh (111)-Rh (001) [31].
Meanwhile, interfacial characteristics of graphene reinforced metal matrix composite have been studied through simulations. Pang et al. investigated the effect of defects and grain boundaries on the morphology of graphene on different planes of single crystalline copper substrate through molecular dynamics (MD) simulations, which provided a theoretical basis for the manipulation of graphene morphology in engineering applications [32]. Wang et al. used MD simulations to study the dislocation and graphene interaction in graphene nanosheet reinforced iron matrix composite (Gr/Fe) and the results showed that the yield stress of the composite with a strong interfacial bonding could be enhanced up to 200 MPa over that in the weak-bonded Gr/Fe composite [33]. The relationship between dislocation evolution and graphene orientation in the Gr/Fe composite during compression was investigated [34], in which the yield stress was around 10 GPa and three possible interaction mechanisms of transmission, reflection, and gliding were revealed to be dependent on graphene location. Furthermore, the effects of the number of graphene layers, amorphous layer structure, the bond strength of C-C atoms in graphene, and boundary conditions on dislocation-graphene interaction were also studied by MD simulations [35,36].
The Gr/Fe composites were successfully synthesized through the DC electro–plating method, where this process was carried out under low temperature for avoiding the reaction between Fe and C elements to form carbide phases and ensuring the stability of graphene morphology and structures for excellent performance [37]. Moreover, through a controlled carburization process, graphene-Fe3C-Fe composites can be obtained [24]. In our previous work, adhesion energy and structure of monolayer, bilayer or trilayer graphene nanosheets located on four differently oriented iron surfaces were studied by MD simulations using two types of Fe-C potentials [38]. However, the interfacial characteristics in Gr/Fe composites are still elusive.
In this work, taking graphene nanosheet reinforced iron composite as an example, the interfacial characteristics of Gr/Fe (110), (111), ( 11 2 ¯ ), and (001) interfaces are studied using molecular dynamics (MD) simulations, in which two types of interfacial bonding (weak and strong) are considered. The interaction energy of different graphene/iron interfaces is calculated and the corresponding moiré pattern is further analyzed.

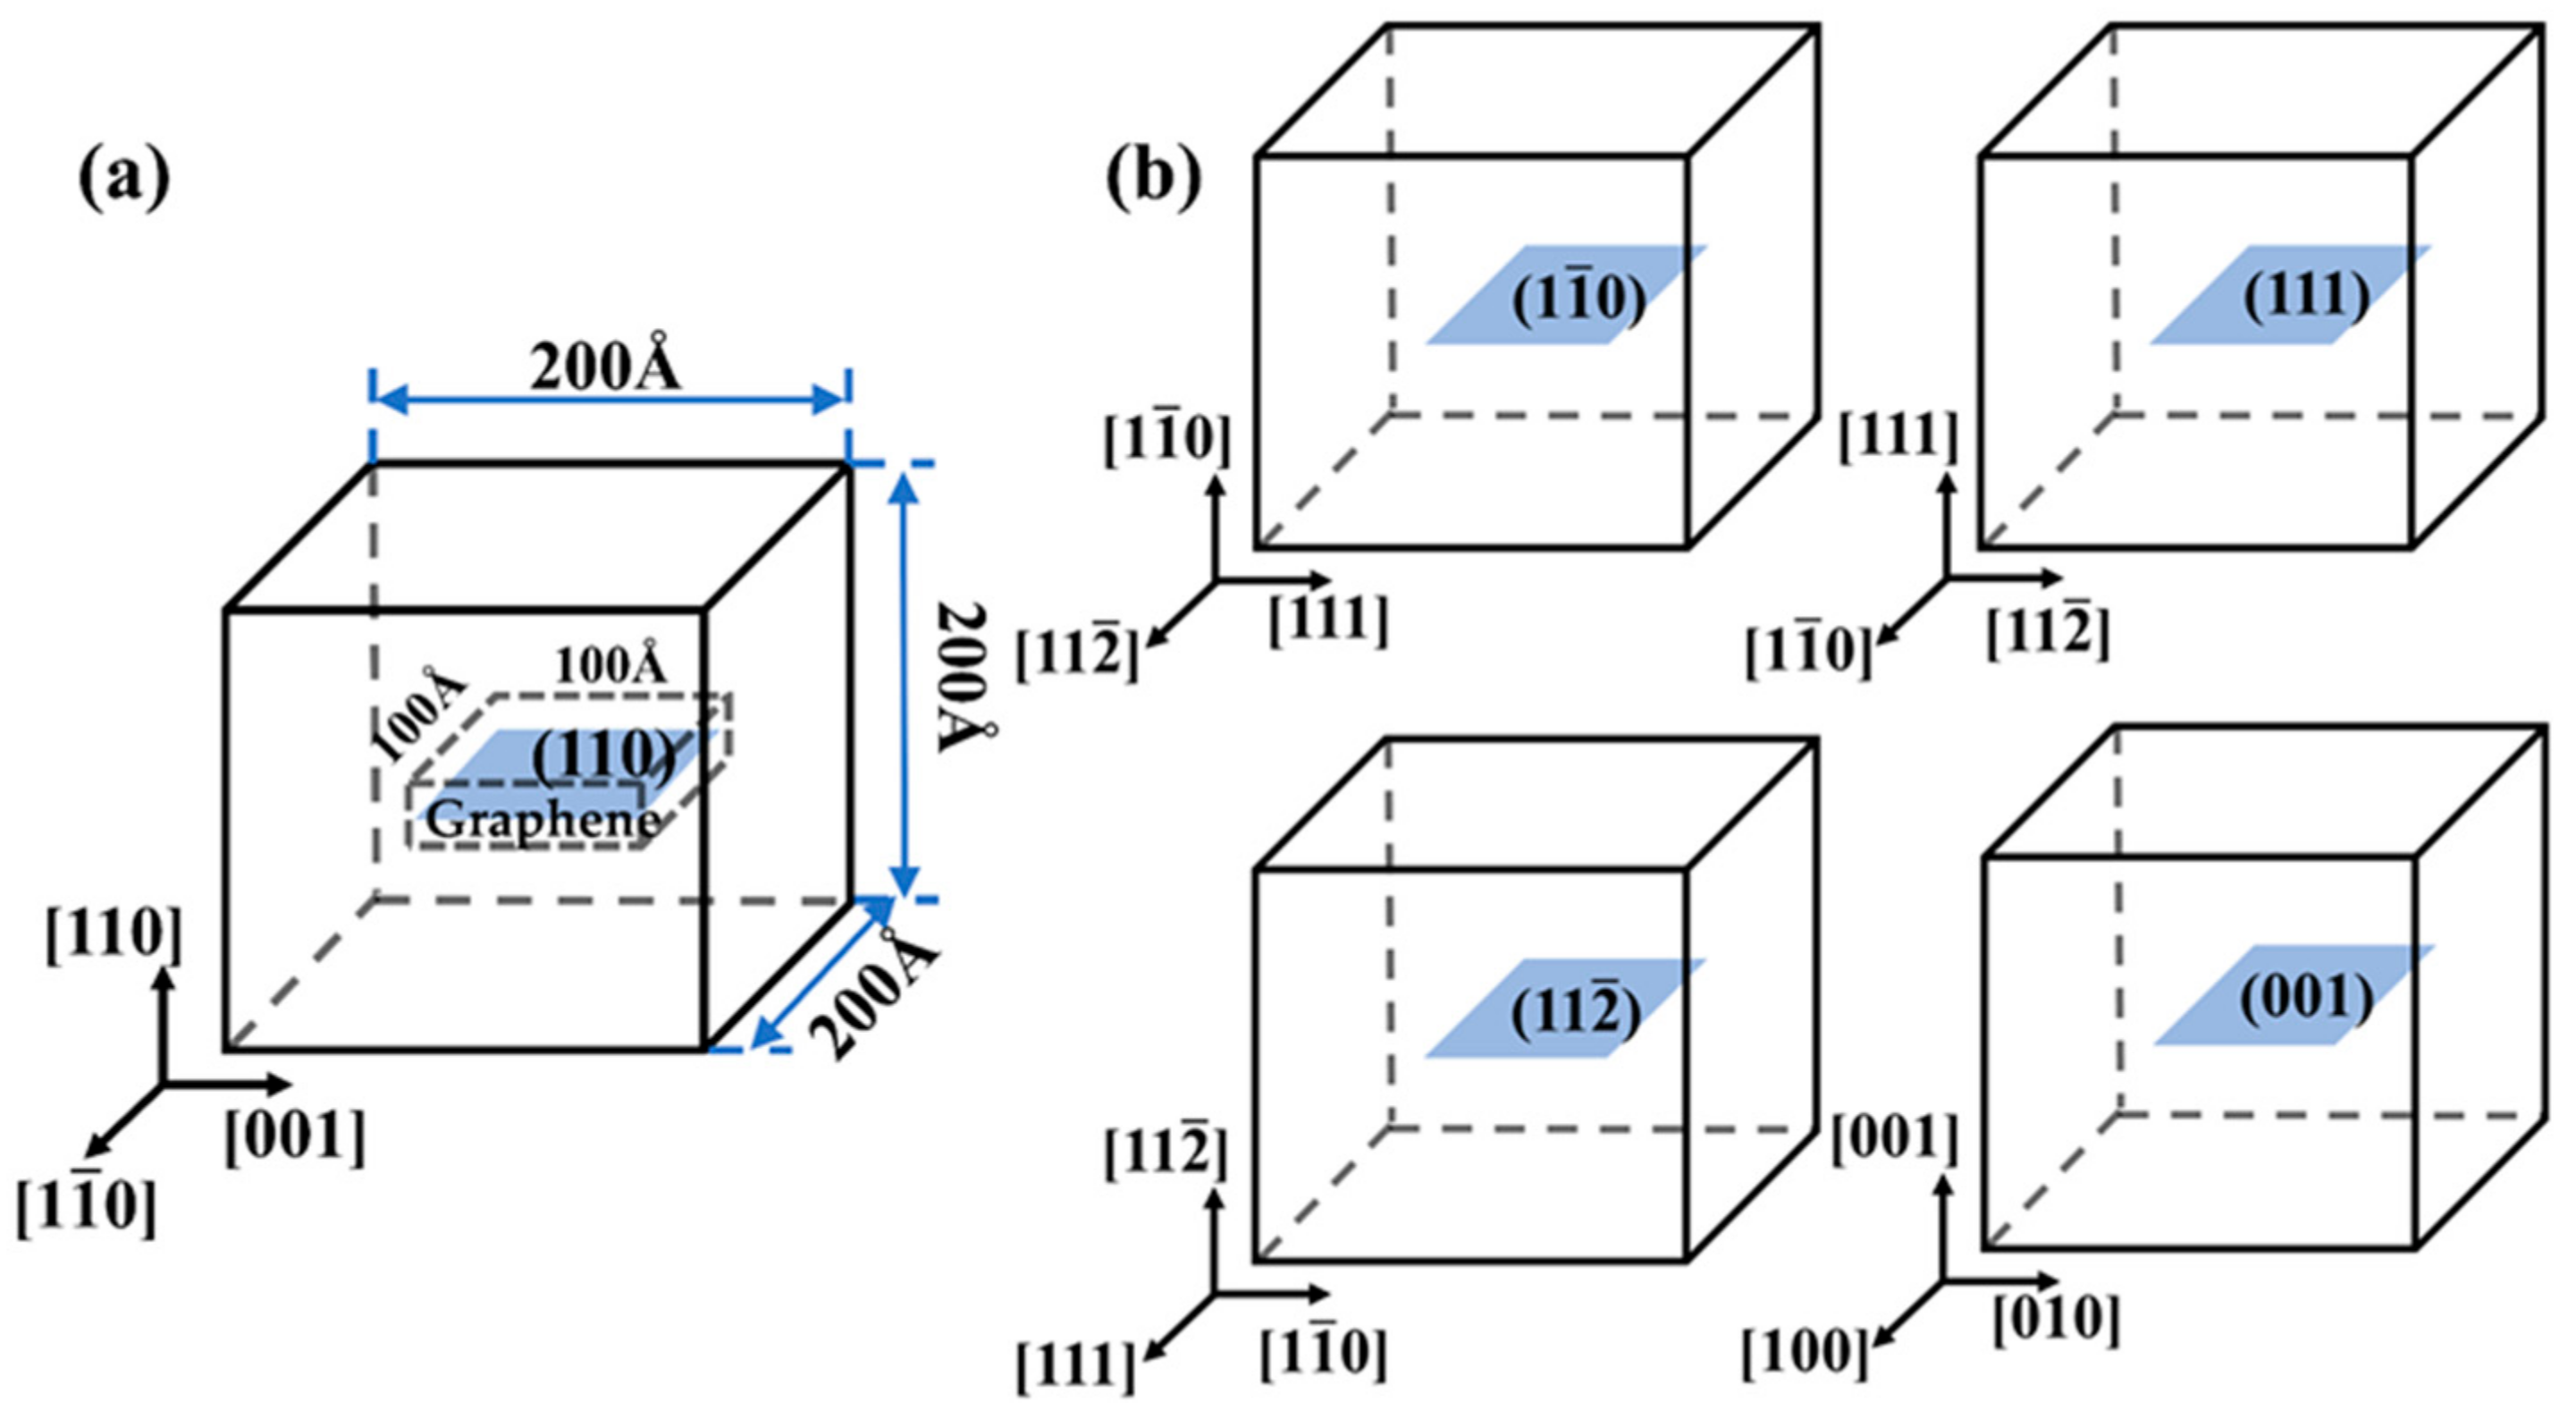
2. Molecular Dynamics (MD) Model and Setup

The MD simulations were performed by Large-scale Atomic/Molecular Massively Parallel Simulator (LAMMPS) software [39]. In Figure 1, the simulation cell was about 200 × 200 × 200 Å3, which included a cubic single crystalline α-iron matrix and a graphene nanosheet with an area of 100 × 100 Å2, parallel to the (110), ( 1 1 ¯ 0 ), (111), ( 11 2 ¯ ), and (001) crystallographic plane of matrix, respectively. The corresponding X, Y and Z axis settings were [ 1 1 ¯ 0 ]-[001]-[110], [ 11 2 ¯ ]-[111]-[ 1 1 ¯ 0 ], [ 1 1 ¯ 0 ]-[ 11 2 ¯ ]-[111], [111]-[ 1 1 ¯ 0 ]-[ 11 2 ¯ ], and [100]-[010]-[001], respectively, the periodic boundary conditions were applied to the three directions. Among them, the first and second orientations represented two different {110} interfaces, defined as the type-I and type-II {110} interface. The lattice constant of iron and graphene is 2.856 Å and 1.420 Å, respectively.
In the simulation, the C-C interactions were described by Adaptive Intermolecular Reactive Empirical Bond Order (AIREBO) potential [40], the Fe-Fe interactions were modeled by the Embedded-Atom Method (EAM) potential [41]. Considering the complex interactions among Fe-C atoms, two different types of Fe-C potential were selected to describe the chemical (strong-bonded) or physical adsorption (weak-bonded) interfaces of Gr/Fe composites. The results calculated by Lennard-Jones (LJ) potential [42] (ε = 0.0168 eV and σ = 2.221 A˚) agreed well with first-principle calculation results, so it was selected to simulate weak/von der Waals force of Fe-C interaction. The EAM potential proposed by Hepburn [41] can reproduce the main structure of cementite and it was selected to describe strong chemical bonding of Fe-C atoms.
The MD simulation process was performed as follows. Firstly, conjugate gradient algorithm [43] was employed to minimize the energy of the system, preliminary static equilibrium of the system was carried out. Graphene and iron matrix were allowed to relax in three directions, and the fluctuation of the stress component in all three directions of the final system was controlled less than 10 MPa. Then, the system was heated to 300 K, the isothermal-isobaric (NPT) ensemble [44] was employed and the system temperature kept at 300 K using Nose-Hoover algorithm [45] running 100 ps. Graphene and iron were initially bound in the thermally activated state. Finally, when the system reached the thermodynamic equilibrium state, the quenching process was used to reduce the temperature of the system to 0 K. After minimizing the whole system energy, the stable interfacial structure of the graphene and iron was obtained. The OVITO software [46] was used to visualize atomic structure (e.g., moiré pattern) at the Gr/Fe interface.

3. Results and Discussion

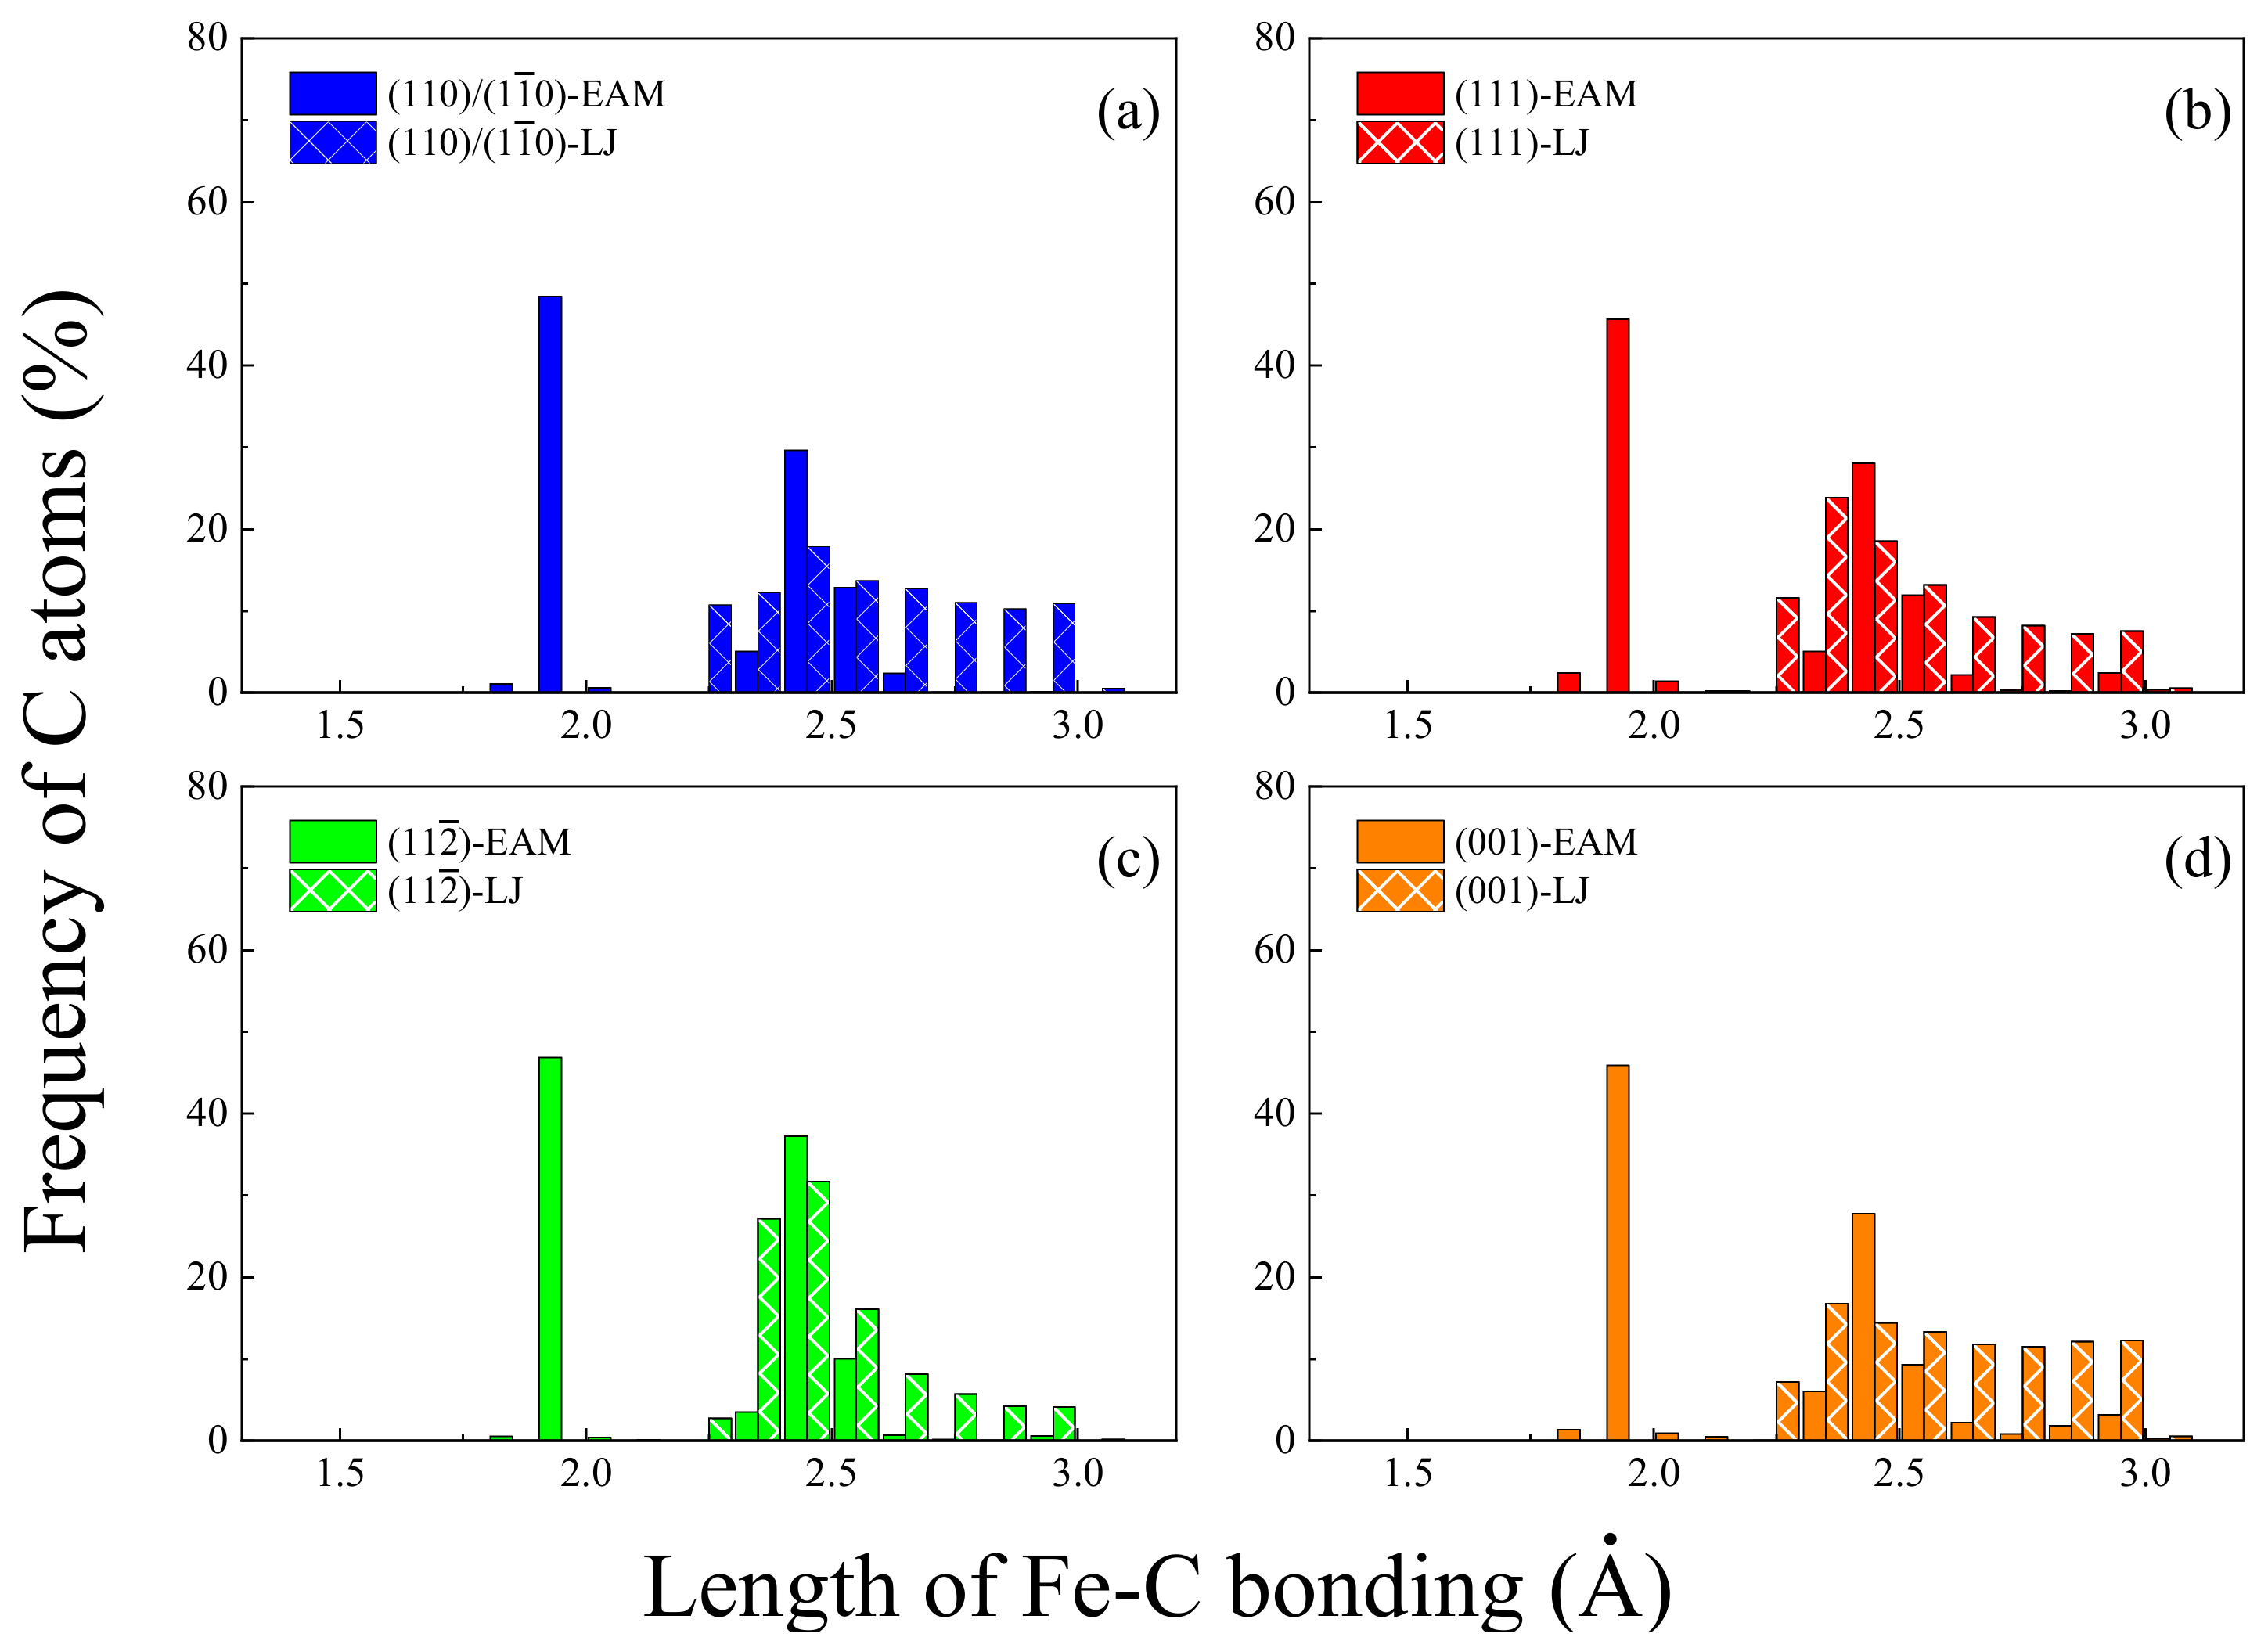
3.1. Interfacial Characteristics of Gr/Fe Interface

The interactive energy E, defined as the energy per unit area to connect graphene nanosheet with iron matrix, is calculated by:
E = i = 1 N F e j = 1 N C ϕ i j / A G r
where ϕ i j is the potential energy between the i t h Fe atom and the j t h C atom, N F e and N C is the total number of Fe and C atoms in the system, respectively, and A G r is the contact area between the graphene nanosheet and the iron. The interactive energy (E) and average vertical distance ( D i ¯ ) of Gr/Fe type-I {110}-(110), type-II {110}-( 1 1 ¯ 0 ), (111), ( 11 2 ¯ ), and (001) interfaces are summarized in Table 1. Compared with adhesion energy, the interactive energy excludes the interactions between C-C and Fe-Fe atoms, which could be more directly to measure the interaction between graphene and iron.
The result shows that when graphene and iron form a weak-bonded interface, the interactive energy of the Gr/Fe (110), ( 1 1 ¯ 0 ), (111), ( 11 2 ¯ ), and (001) interface is −1.00 J/m2, −1.00 J/m2, −0.73 J/m2, −0.82 J/m2, and −0.81 J/m2, respectively. When graphene and iron form a strong-bonded interface, the corresponded interactive energy is −5.63 J/m2, −5.63 J/m2, −4.32 J/m2, −4.39 J/m2, and −4.52 J/m2, respectively, which is roughly five times larger than the weak-bonded one. Both the weak- and strong-bonded interfaces show the similar tendencies: the {110} plane is the most stable crystallographic plane among the graphene-iron interfaces, while the {111} one has the lowest stability, which is consistent with the observations in other work [47].
In the weak- and strong-bonded Gr/Fe composites, the average vertical distance ( D 1 ¯ ) between the graphene nanosheet and the 1st-closed iron atom layer at the Gr/Fe (111) interface is the shortest one, with the value of 1.66 Å and 2.05 Å, respectively. The D 1 ¯ at other interfaces are very close within the range of 2.15–2.17 Å in the weak-bonded Gr/Fe and 1.73–1.76 Å in the strong-bonded one. Compared to the initial distance ( D 0 ¯ ), there is no significant difference between the D 0 ¯ and D 1 ¯ in the weak-bonded composite. However, the D 1 ¯ in the strong-bonded one changes considerably, indicating that the 1st-closed iron atoms layer are greatly attracted by graphene.
The average vertical distance ( D 2 ¯ ) between the graphene nanosheet and the 2nd-closed iron atom layer is 4.16/3.78 Å (weak/strong), 3.61/2.36 Å, 3.27/2.76 Å, and 4.19/3.19 Å at the (110), (111), ( 11 2 ¯ ), and (001) interface, respectively. The D 2 ¯ in the weak-bonded composite equals to the D 1 ¯ plus the layer spacing of iron matrix, which means little interaction between graphene and 2nd-layer Fe atoms at the interface. However, the D 2 ¯ in the strong-bonded composite are much shorter, indicating the existence of strong interfacial interaction. The smaller the Fe-Fe interlayer spacing, the stronger the attraction between graphene and Fe atoms.
The distributions of the length (L) of Fe-C bonding at the Gr/Fe (110)/( 1 1 ¯ 0 ), (111), ( 11 2 ¯ ), and (001) interface is provided in Figure 2. It is found that when graphene and iron form a weak-bonded interface, the L is distributed in 2.20–3.00 Å without carbide formation. However, when graphene and iron form a strong-bonded interface, the L is divided into two ranges of 1.80–2.00 Å and 2.30–2.50 Å, indicating the carbide formation (e.g., Fe3C and Fe7C3) at the interface.

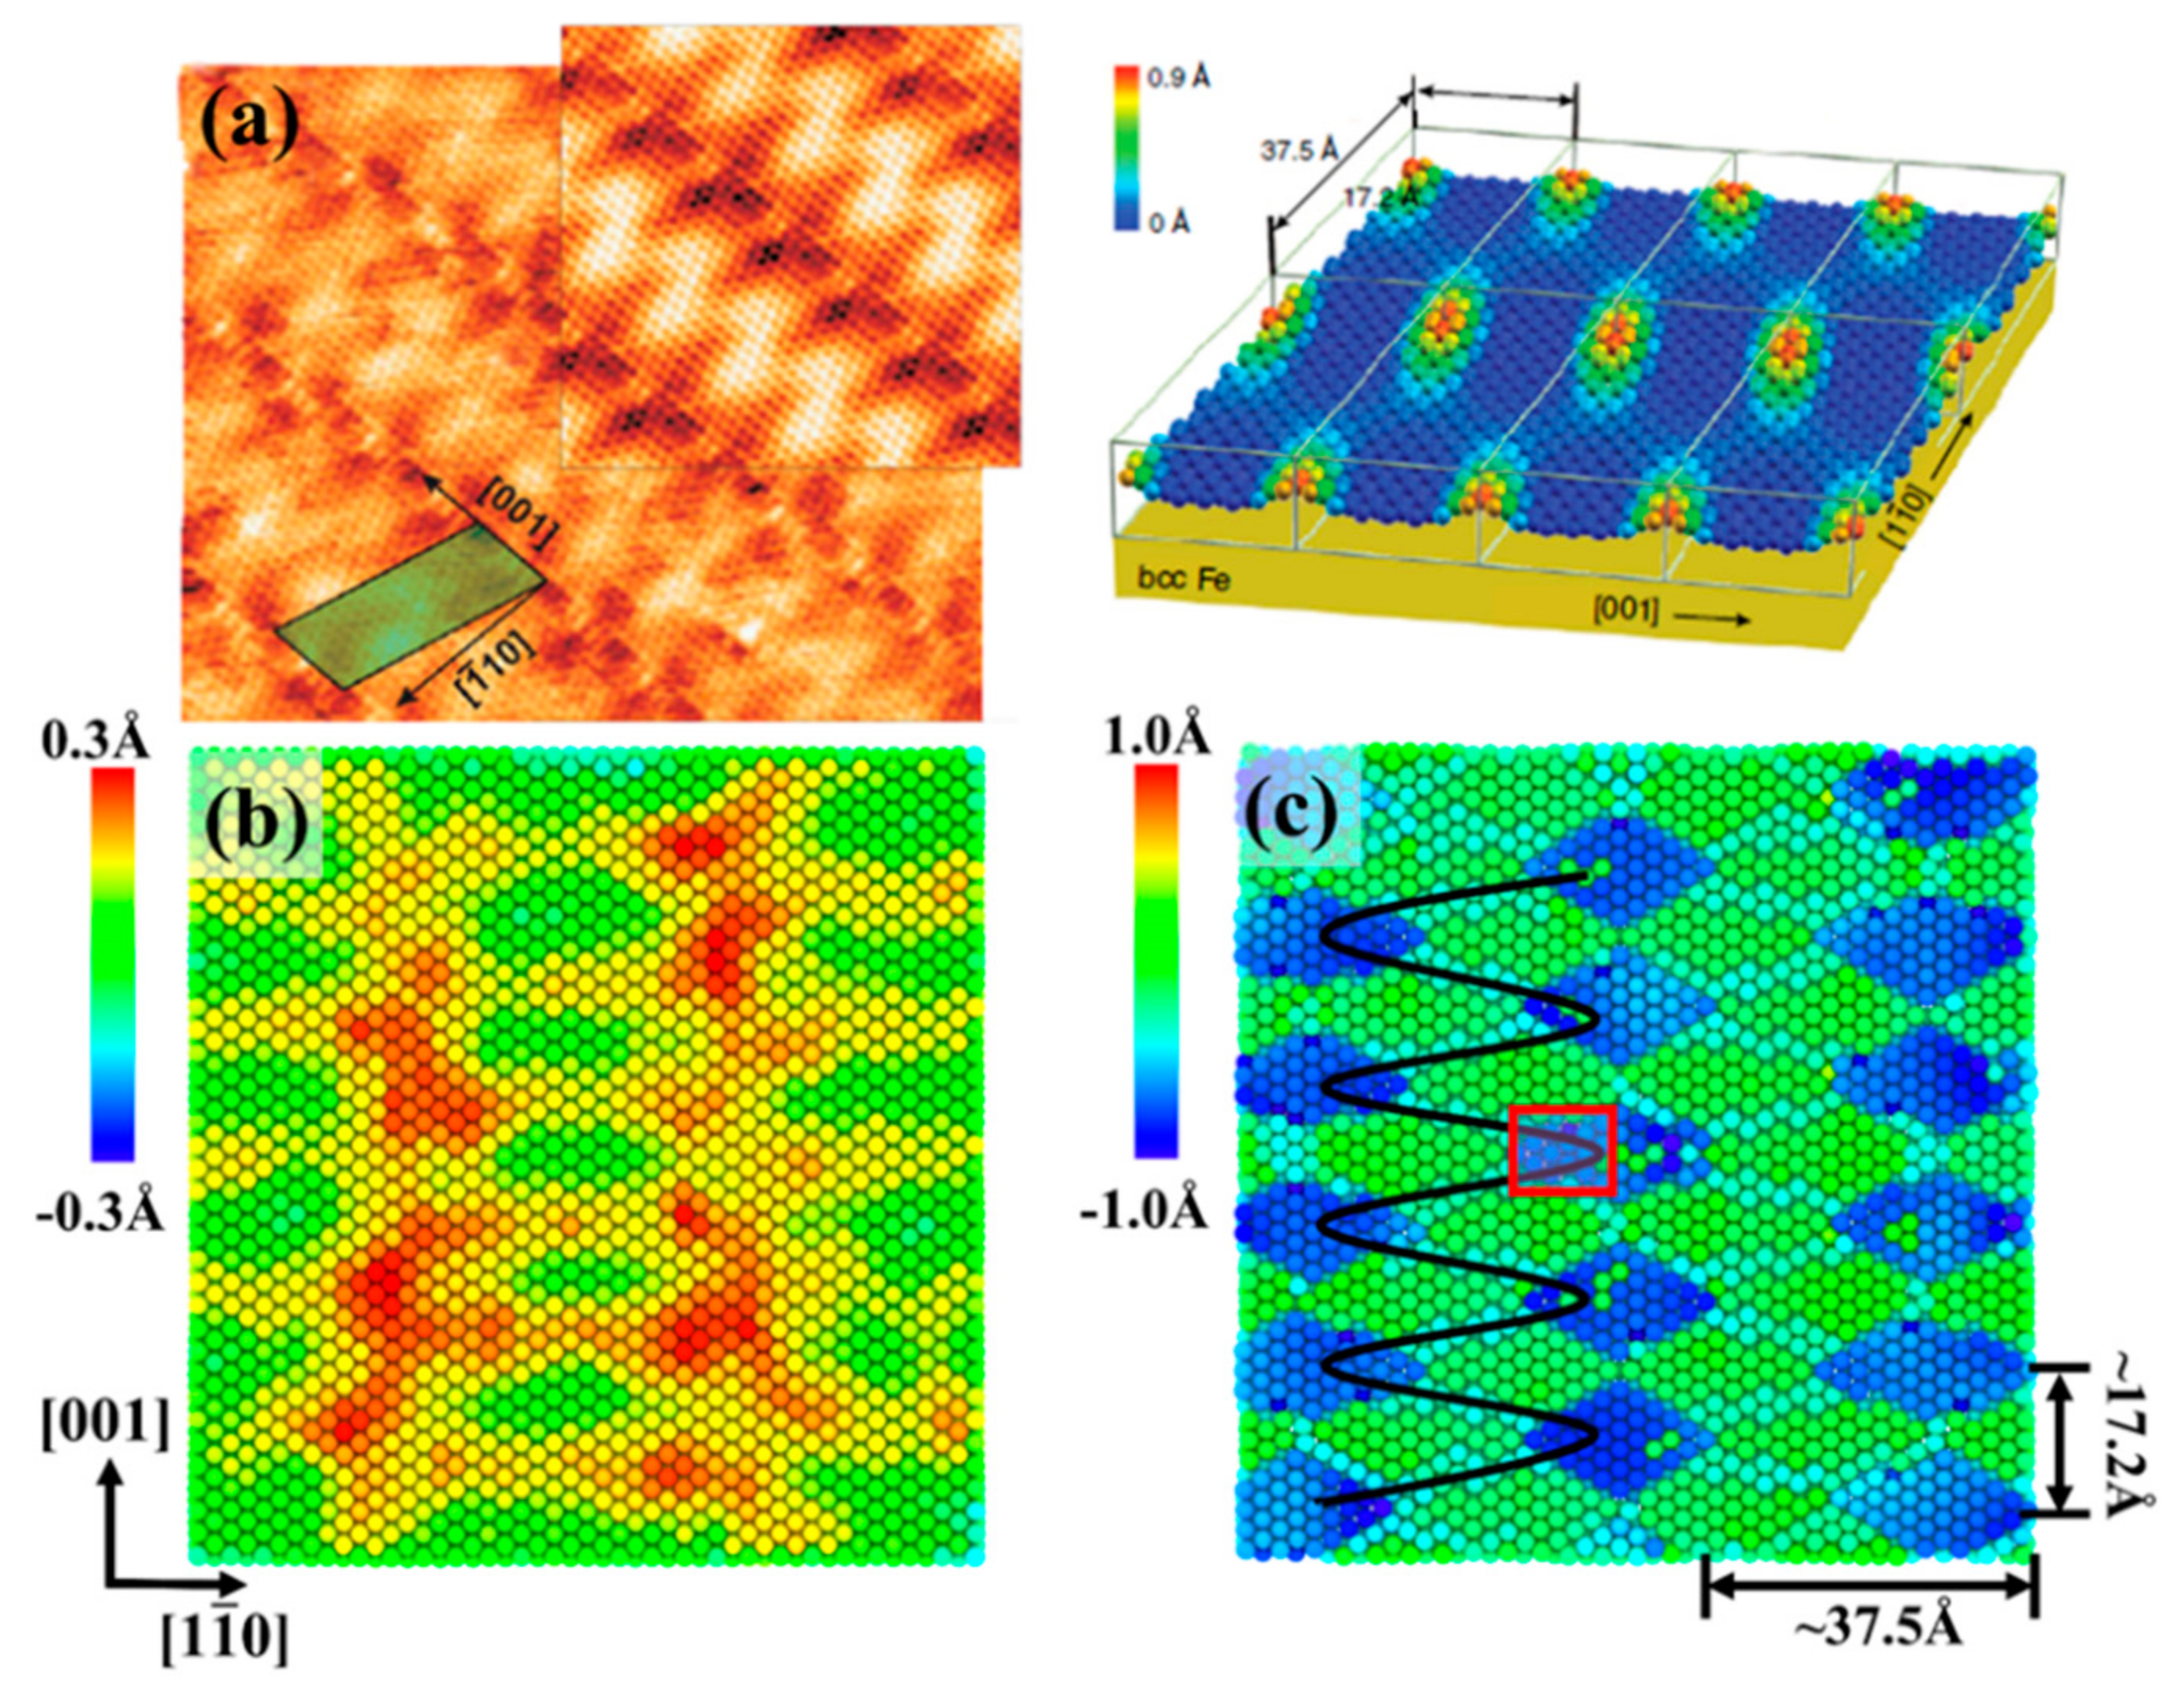
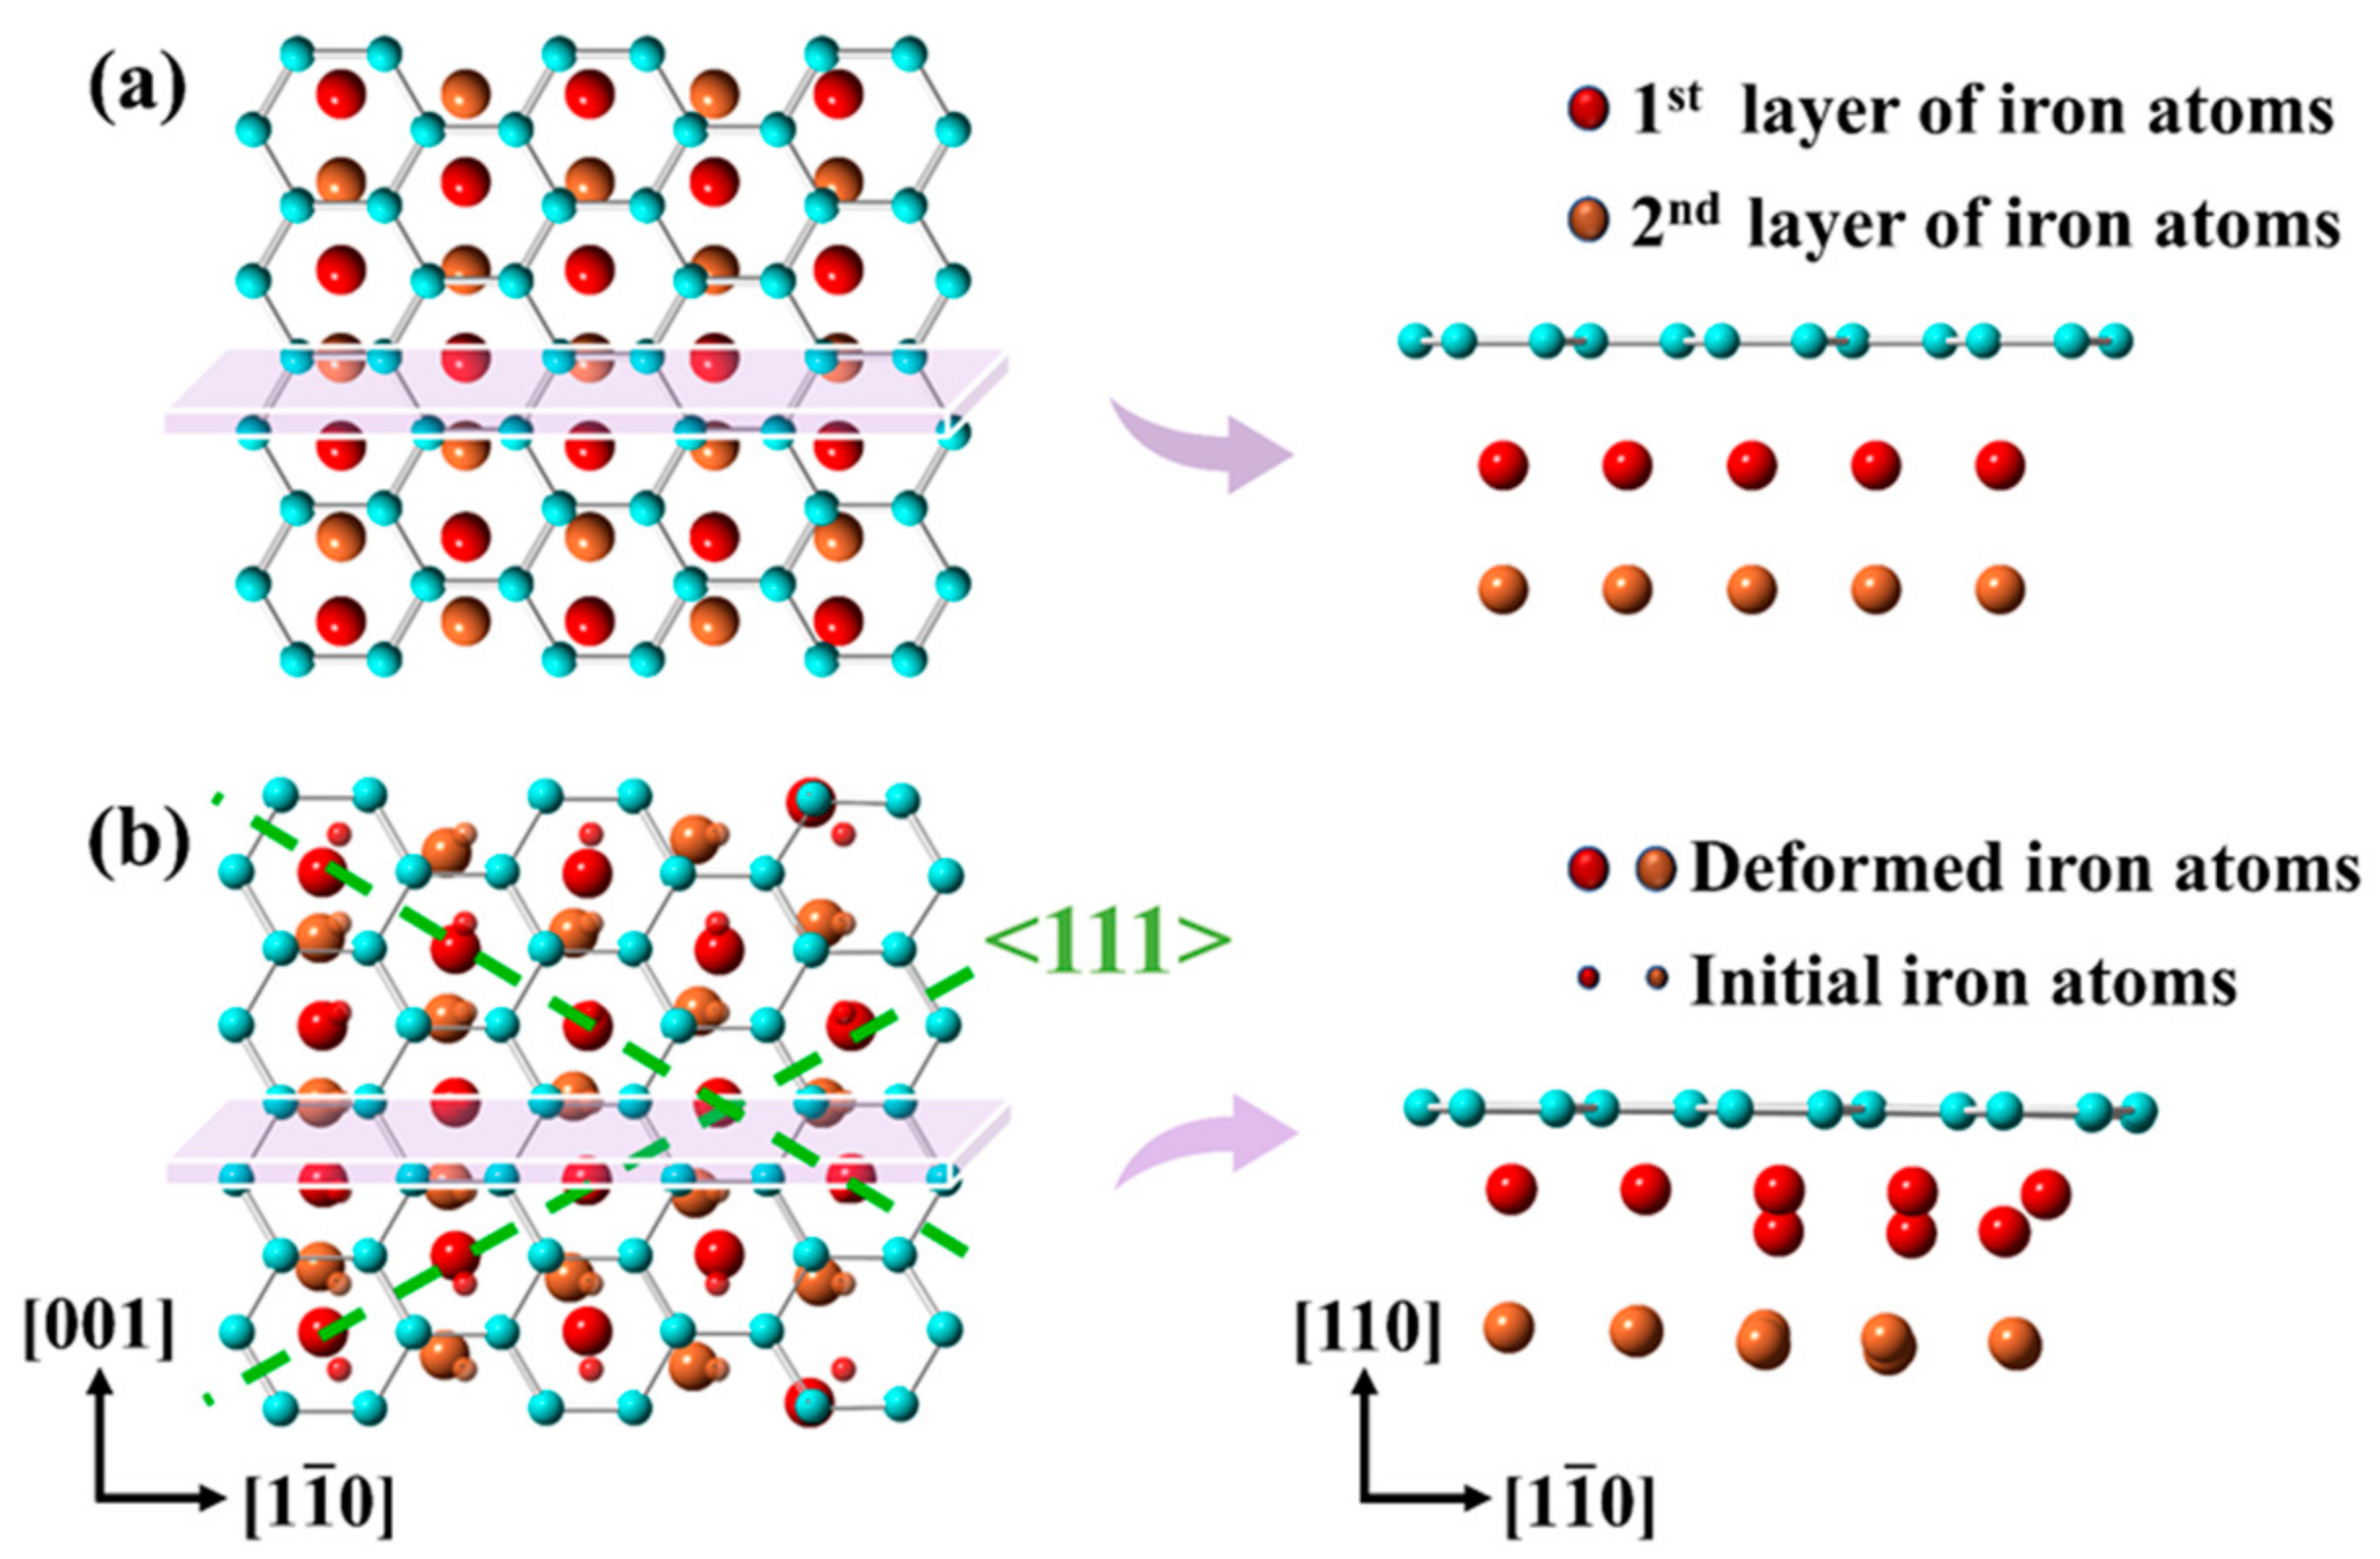
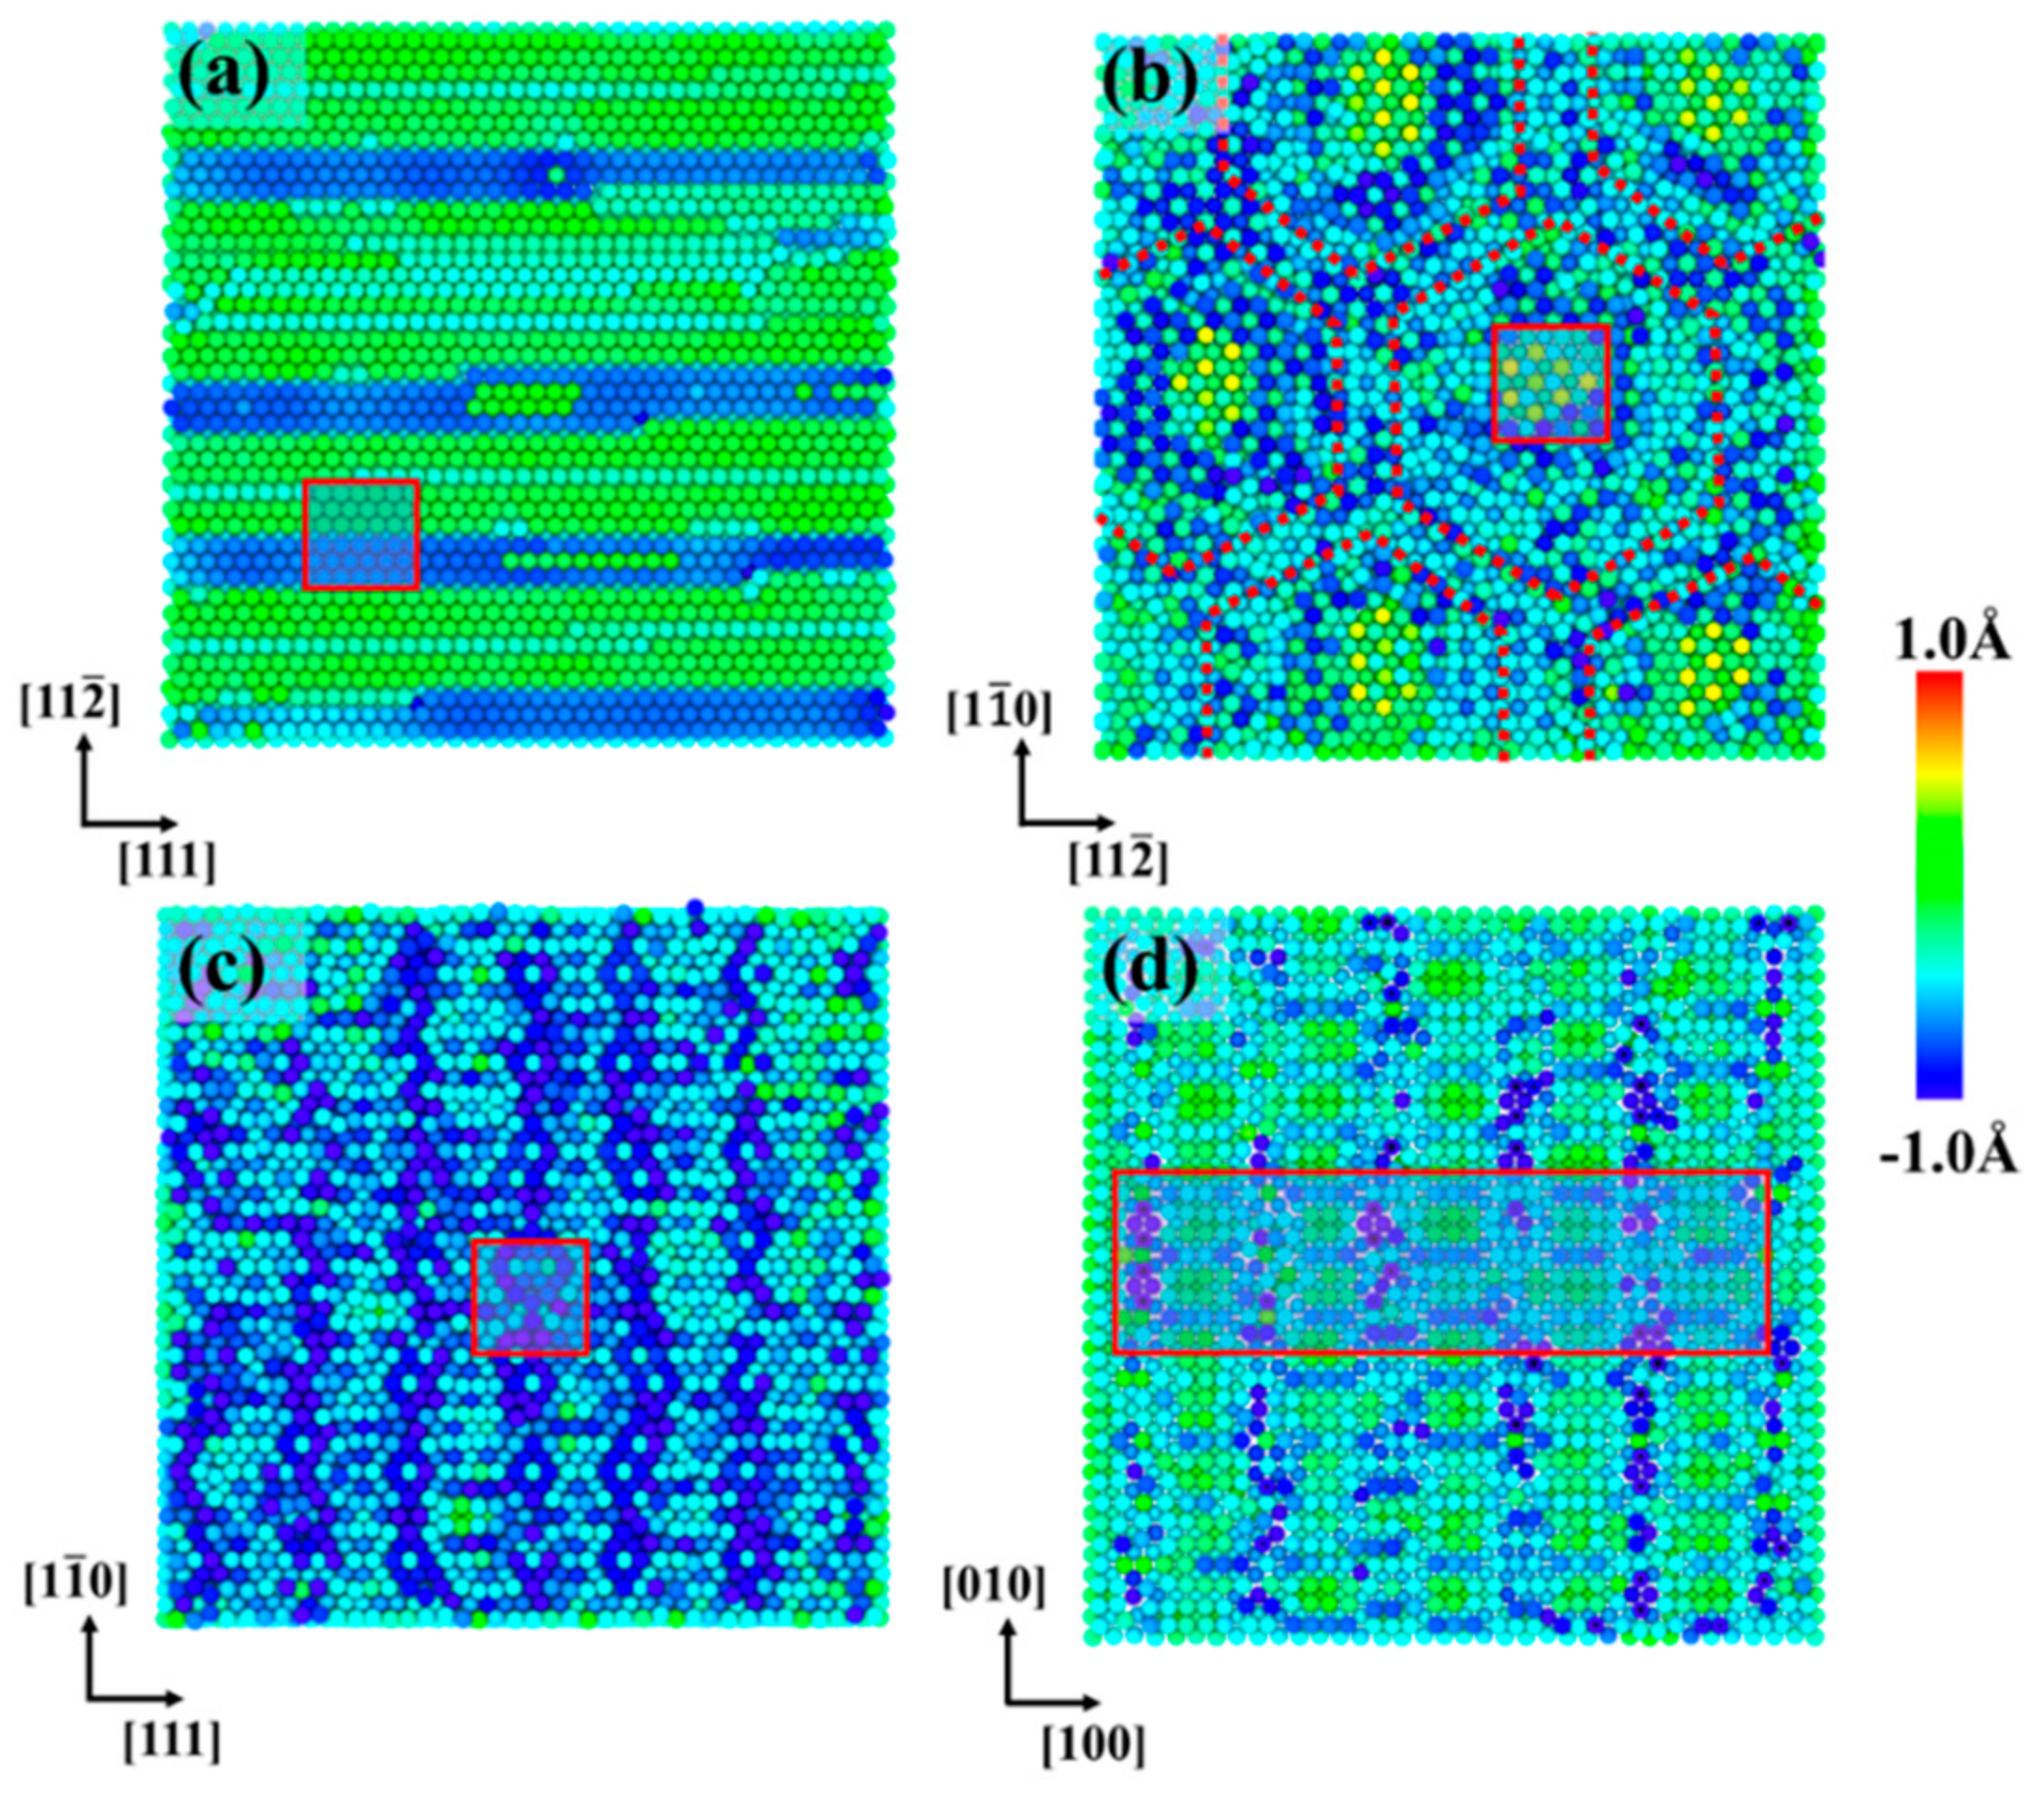
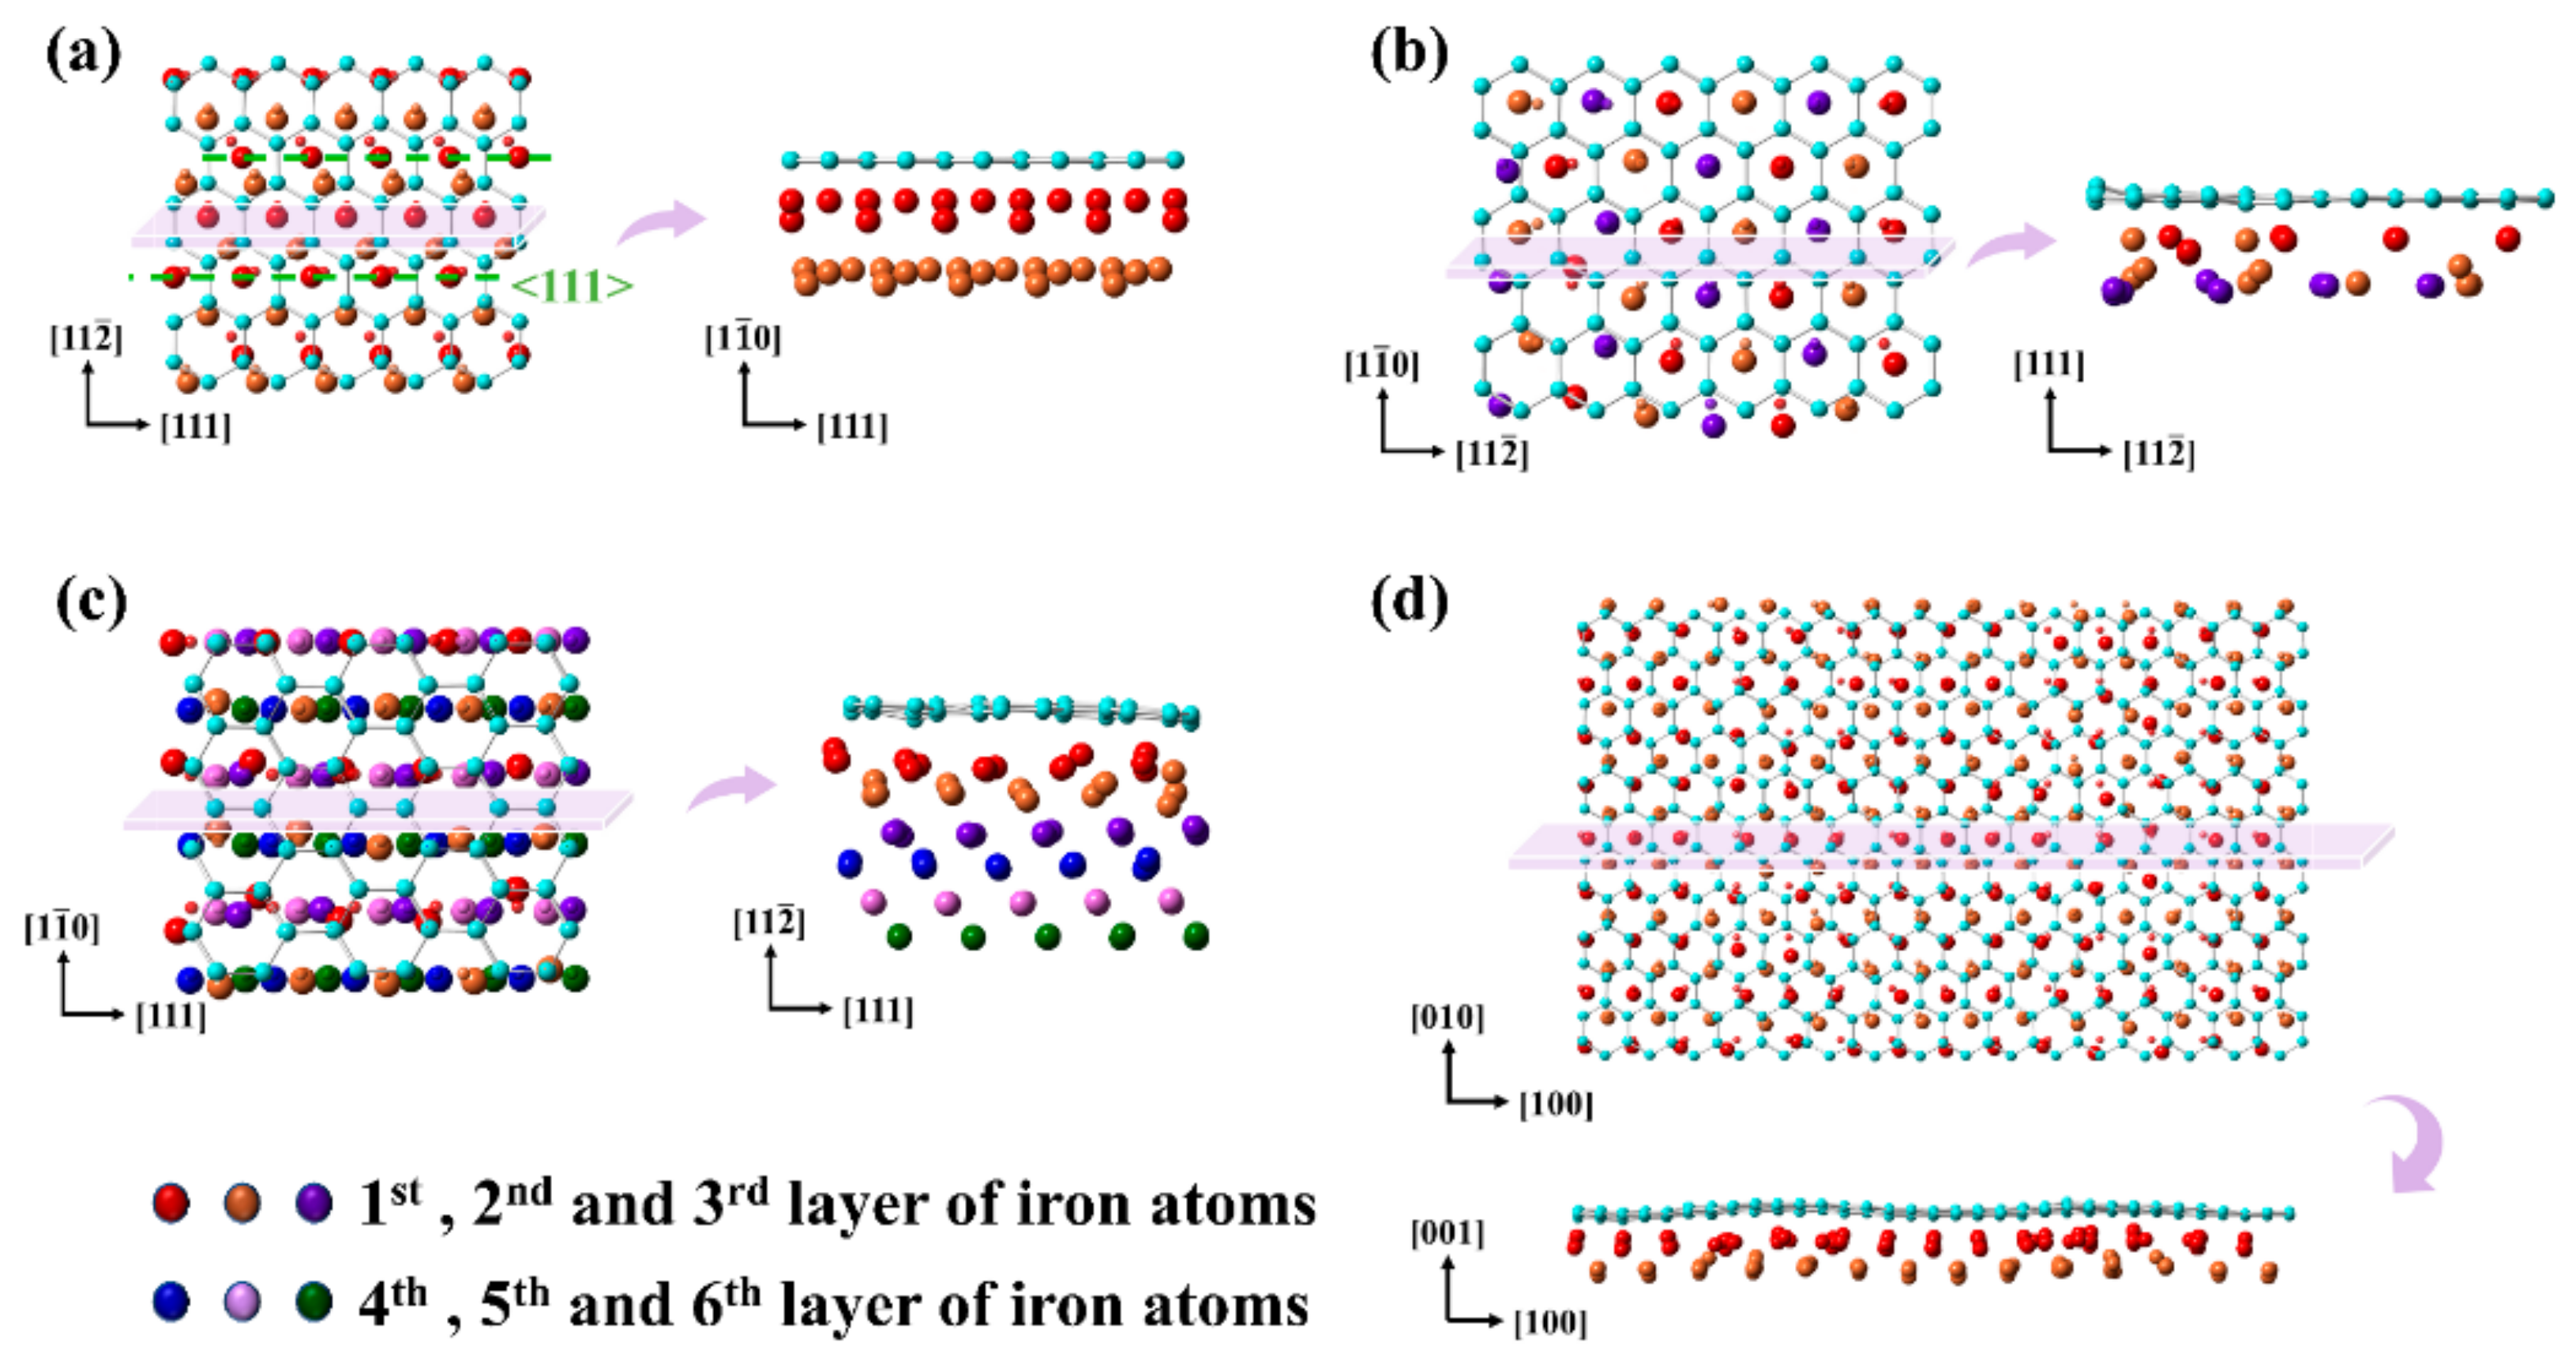
3.2. Moiré Pattern of Gr/Fe Typed-I {110} Interface

The Gr/Fe {110} interface, with the lowest interactive energy and the most stable atomic structure, has always been recognized as the easiest crystallographic plane for graphene to grow on. In 2012, Vinogradov et al. made a graphene grown on Fe {110} crystallographic plane at relatively low temperature, and a rhombic moiré pattern was observed periodically along the [001] direction through LEED and STM with an amplitude of 40 Å along the [ 1 1 ¯ 0 ] direction [30], as shown in Figure 3a. After enlarging the moiré structure, it could be found that the fluctuation of graphene in the vertical direction were about 0.60 ± 0.20 Å. Furthermore, the moiré structure at the Gr/Fe (110) interface was found by DFT calculations, as shown in Figure 3b, in which the vertical distance between the graphene layer and the iron surface fluctuated within the range of 2.12–3.03 Å, and the vertical fluctuation of graphene was about 0.90 Å [30].
Due to the limitation of experimental conditions and the spatial scale of DFT calculations, an atomic-scale analysis of the Gr/Fe {110} interface in details is still lacking. Therefore, MD simulation is used to analyze this type of interface. The setup of MD model shows in Figure 1a, in which the armchair and zigzag edge of graphene nanosheet is along [ 1 ¯ 10 ] and [001] direction, respectively. Figure 3b,c show the atomic structure at the weak- and strong-bonded Gr/Fe (110) interface. When graphene and iron form a weak-bonded interface, the (110) interface cannot reveal a clear interfacial topography, the amplitude of Fe atoms at the interface is only 0.2 Å. However, for the strong-bonded interface, the fluctuation range of Fe atoms is two times larger than that of weak-bonded one and a clear shaped pattern can be observed. Therefore, in the following section, we only focus on moiré patterns in the strong-bonded Gr/Fe composites.
In Figure 3c, a diamond-shaped moiré pattern presented by the displacement of Fe atom is characterized by 35 × 17 Å2 corrugation structure, in which every 18 graphene rings match 19 columns of Fe atoms (−35 Å) in the zigzag direction (i.e., the [ 1 ¯ 10 ] direction) and 6 graphene rings match 7 Fe–Fe distances (−17 Å) in the armchair direction (i.e., the [001] direction), in consistent with the pattern in Figure 3a. The lattice compatibility of graphene and Fe matrix is the main factor to dominate the periodicity of this pattern.
Figure 4 shows a detailed atomic structure of this moiré pattern. After the system reaches the equilibrium state, Fe atoms are located in three sites: graphene ring center (Hollow-H site), C-C covalent bond center (Bridge-B site), and the site directly above the C atom (Top-T site). After relaxation, the position of C atom is nearly unchanged, while the 1st-layer Fe atom produces a large displacement along the normal direction of the interface, changing from the initial value of 2.02 Å to −1.3 Å (H site) and −2.0 Å (B or T site), and the displacement of 2nd layer Fe atoms is relatively small. To study the stability of different binding site, a single Fe atom is placed in the highly symmetrical H, B, and T site, respectively, and the results show that the stable sequence is H > B > T site, consistent with the DFT results [48,49,50]. Therefore, the Fe atom in the moiré pattern is mainly located in the H site. However, due to the effect of the lattice mismatch along other orientations of the pattern edge, the Fe atoms can move from the H site to the B or T site.

3.3. Moiré Pattern at Different Gr/Fe Interface

When graphene nanosheet is parallel to different crystallographic plane of the iron, the moiré patterns at the interface shows differently.
After rotating the graphene nanosheet on the {110} plane of the iron, type II-( 1 1 ¯ 0 ) interface is built with the armchair along the [ 11 2 ¯ ] and the zigzag along the [111] direction. In Figure 5a, the moiré pattern at the ( 1 1 ¯ 0 ) interface exhibits a linear stripe structure, which is different from the (110) interface. The fringes at the interface extend along the [111] direction with the Gr/Fe lattice mismatch less than 0.5%, where the lattice interval of graphene and Fe is 2.46 Å and 2.47 Å, respectively. Along the [ 11 2 ¯ ] direction, the stripe width is about 4.30 Å. The atoms inside the stripe are compressed up to 7% after relaxation and form a clear boundary. In the [ 11 2 ¯ ] direction, there is no obvious regularity of the stripe spacing. The Fe atoms are undulating along the vertical direction at the interface with the positions of 1.27–2.04 Å, which is 13–41% larger than that at the (110) interface.
When graphene sheet with the armchair along the [ 11 2 ¯ ] and the zigzag along the [ 1 1 ¯ 0 ] direction is embedded into the Fe (111) plane, the moiré structure is identified in Figure 5b. A remarkable highly symmetrical hexagonal structure is observed, and its six sides are along the {111} and ( 1 1 ¯ 0 ) directions. There is a transition zone between the hexagons with the width of 7.0 Å. The periodicity of the hexagons is about 59.5 Å, which is similar to the graphene structure in ruthenium (0001), nickel (111), rhodium (111), and copper (111) interfaces.
When the embedded graphene sheet is on the ( 11 2 ¯ ) plane, a wavy linear stripe pattern along the [ 11 0 ¯ ] direction with an equal spacing of 9.3 Å in the [111] direction is observed, as shown in Figure 5c. In the normal direction of interface, the 1st-layer Fe atoms move toward the graphene and the displacement amplitude is up to 0.87 Å. A chain-like pattern is formed at the Gr/Fe (001) interface in Figure 5d. The Fe atoms fluctuate greatly at the chain junction, compared with those inside.
Moreover, atomic structure characteristics in the red regions of Figure 5 are further analyzed in detail, as shown in Figure 6. The 1st–6th layer Fe atoms are marked with the color of red, orange, purple, blue, pink, and green, respectively.
Figure 6a shows the atomic structure at the Gr/Fe Type-II ( 1 1 ¯ 0 ) interface. The D 0 ¯ is 2.02 Å. After the relaxation, the vertical spacing of the H, B, and T site is 1.27–1.40 Å, 1.75–1.81 Å, and 1.99–2.04 Å, respectively. Therefore, the 1st-closed layer Fe atoms present a wave-shaped undulation with the amplitude of 0.77 Å. The 2nd-closed layer Fe atoms also present relatively less fluctuations in the vertical direction with the corresponding spacing of 3.45–3.50 Å (H site), 3.62–3.71 Å (B site), and 3.95–4.10 Å (T site) and the amplitude of 0.65 Å.
The atomic structure at the Gr/Fe (111) interface shows in Figure 6b. The D 0 ¯ is 2.06 Å, and the average spacing between the 1st- and 2nd-closed layer Fe atoms is only 0.82 Å. Due to the sparse arrangement of Fe atoms on the {111} plane, the graphene has enough space to form wrinkles. Moreover, owing to a smaller planar spacing between the {111} planes of iron, the graphene has a strong interaction with the three layers of Fe atoms, leading to a displacement fluctuation up to 0.89 Å. After relaxation, the Fe atoms in the central area of the hexagon are mainly located at the H site, while those at the boundary are located at the B and T sites. The vertical spacing between the graphene and the 1st-, 2nd- and 3rd-closed layer Fe atoms reduces 1.27–1.94 Å, 1.51–2.87 Å, and 2.78–3.64 Å, respectively.
Figure 6c shows the atomic structure at the Gr/Fe ( 11 2 ¯ ) interface. The six-layered Fe atoms are periodically arranged along the [111] direction and only the 1st, 2nd and 3rd-closed layer Fe atoms produce obvious displacements. The Fe atoms on the {112} plane are also sparsely arranged with a smaller planar spacing, similar to the case of {111} plane. After relaxation, the graphene sheet fluctuates up to 0.88 Å. The D 0 ¯ changes from the 2.32 Å to the D 1 ¯ of 1.45–2.03 Å with a maximum fluctuation of 0.84 Å. It is also found that the fluctuation of graphene plays a certain role in changing the layer spacing. The vertical spacing between the graphene and 2nd and 3rd-closed layer Fe atoms is 2.04–3.21 Å and 3.78–4.24 Å, respectively, indicating that the vertical displacement of the 2nd layer atoms is significantly greater than the 3rd ones.
Figure 6d shows atomic structure at the Gr/Fe (001) interface. The graphene sheet exhibits a wave-like undulation with the amplitude of 0.55–0.61 Å and the periodic spacing of 8.61 Å. The wrinkles cause the fluctuation of the vertical spacing between the graphene and Fe atoms, leading to the rearrangement of Fe atoms, especially the 1st-layer Fe atoms. It is also found that along the [100] direction, every 3–4 Fe atoms collectively move to the adjacent stable binding position in a row, and finally stabilize at or near the H, B or T site. These atoms are periodically rearranged to form a chain-like pattern. In additional, most of the 2nd-closed layer Fe atoms are only displaced in vertical direction, but due to the wrinkles of the graphene, their bonding positions also changes to a certain extent.
Generally, the proposed approach and the results obtained, especially in terms of considering moiré patterns, can be further applied to a wide class of graphene reinforced metal matrix materials.

4. Conclusions

In this work, interfacial characteristics in graphene reinforced iron matrix composite (Gr/Fe) are systematically investigated using molecular dynamics simulations, associated with the chemical bonding (strong) and physical adsorption (weak) interfaces. The main conclusions are as follows:
(1) When the graphene sheet is embedded in the iron and forms a weak interface, the Gr/Fe (110), ( 1 1 ¯ 0 ), (111), ( 11 2 ¯ ), and (001) interface interactive energy is −1.00 J/m2, −1.00 J/m2, −0.73 J/m2, −0.82 J/m2, and −0.81 J/m2, respectively. The average vertical distance between the graphene sheet and the iron interface fluctuates in the range of 2.05–2.15 Å, the bond length of Fe-C atoms is continuously distributed in the range of 2.20–3.00 Å, and the Fe-C atoms tend to be combined by van der Waals force without specific bonding types.
(2) When the graphene sheet is embedded in the iron and forms a strong interface, the interactive energy of Gr/Fe (110), ( 1 1 ¯ 0 ), (111), ( 11 2 ¯ ) and (001) interfaces are −5.63 J/m2, −5.63 J/m2, −4.32 J/m2 −4.39 J/m2, and −4.52 J/m2. The average vertical distance between the graphene sheet and the iron interface fluctuates in the range of 1.66–1.76 Å. The bond length of Fe-C atoms is mainly discontinuously distributed in the two intervals of 1.80–2.00 Å and 2.30–2.50 Å. The Fe-C atoms are bonded by chemical bonds, and the carbides such as Fe3C and Fe7C3 are formed at the interface.
(3) When the graphene sheet and the iron form a strong interface, the Gr/Fe (110) interface presents a periodic diamond-shaped moiré structure with size of 35 × 17 Å2, which is consistent with the experimental observation.
(4) Under the strong interface, different Gr/Fe interface shows different moiré pattern: The Gr/Fe ( 1 1 ¯ 0 ) interface has a linear stripe pattern, the Gr/Fe (111) interface has a highly symmetrical hexagonal pattern, the Gr/Fe ( 11 2 ¯ ) interface has a wavy linear stripe pattern, and the Gr/Fe (001) interface has a chain-like pattern.
(5) Due to the lattice mismatch between graphene and iron crystal structures, the system can reach the equilibrium state through the competition and coordination of interfacial Fe atoms at the three stable binding positions of Hollow (H), Bridge (B) and Top(T) sites of the graphene, leading to the formation of moiré pattern at the interface.

Author Contributions

J.J., L.W. and Q.P. conceived and designed the simulations; M.S., L.W. and H.W. performed the simulations; M.S., J.J., S.L., L.W., S.T. and Q.P. analyzed the data; M.S., J.J. and L.W. wrote the paper. All authors have read and agreed to the published version of the manuscript.

Funding

This research was funded by Fundamental Research Funds for the Central Universities in China (No. N2007011) and Program of Introducing Talents of Discipline to Universities- ‘111’ Project in China (No. B20029). Q.P. would like to acknowledge the support provided by would like to acknowledge the support provided by National Natural Science Foundation of China (No. 12378272) and Li Ying Program of the Institute of Mechanics, Chinese Academy of Sciences (No. E1Z1011001).

Data Availability Statement

The data that support the findings of this study are available from the corresponding author upon reasonable request.

Conflicts of Interest

The authors declare no conflict of interest.

References

  1. Raccichini, R.; Varzi, A.; Passerini, S.; Scrosati, B. The role of graphene for electrochemical energy storage. Nat. Mater. 2015, 14, 271–279. [Google Scholar] [CrossRef] [PubMed]
  2. Morozov, S.V.; Novoselov, K.S.; Katsnelson, M.I.; Schedin, F.; Elias, D.C.; Jaszczak, J.A.; Geim, A.K. Giant Intrinsic Carrier Mobilities in Graphene and Its Bilayer. Phys. Rev. Lett. 2008, 100, 016602. [Google Scholar] [CrossRef] [PubMed] [Green Version]
  3. Hwang, J.; Yoon, T.; Jin, S.H.; Lee, J.; Kim, T.-S.; Hong, S.H.; Jeon, S. Enhanced Mechanical Properties of Graphene/Copper Nanocomposites Using a Molecular-Level Mixing Process. Adv. Mater. 2013, 25, 6724–6729. [Google Scholar] [CrossRef] [PubMed]
  4. Balandin, A.A.; Ghosh, S.; Bao, W.; Calizo, I.; Teweldebrhan, D.; Miao, F.; Lau, C.N. Superior Thermal Conductivity of Single-Layer Graphene. Nano Lett. 2008, 8, 902–907. [Google Scholar] [CrossRef] [PubMed]
  5. Lee, C.; Wei, X.; Kysar, J.W.; Hone, J. Measurement of the elastic properties and intrinsic strength of monolayer graphene. Science 2008, 321, 385–388. [Google Scholar] [CrossRef]
  6. Galiotis, C.; Frank, O.; Koukaras, E.N.; Sfyris, D. Graphene Mechanics: Current Status and Perspectives. Annu. Rev. Chem. Biomol. Eng. 2015, 6, 121–140. [Google Scholar] [CrossRef]
  7. Cao, Q.; Geng, X.; Wang, H.; Wang, P.; Liu, A.; Lan, Y.; Peng, Q. A Review of Current Development of Graphene Mechanics. Crystals 2018, 8, 357. [Google Scholar] [CrossRef] [Green Version]
  8. Peng, Q.; Liang, C.; Ji, W.; De, S. A theoretical analysis of the effect of the hydrogenation of graphene to graphane on its mechanical properties. Phys. Chem. Chem. Phys. 2013, 15, 2003–2011. [Google Scholar] [CrossRef]
  9. Bonaccorso, F.; Colombo, L.; Yu, G.; Stoller, M.; Tozzini, V.; Ferrari, A.C.; Ruoff, R.S.; Pellegrini, V. Graphene, related two-dimensional crystals, and hybrid systems for energy conversion and storage. Science 2015, 347, 1246501. [Google Scholar] [CrossRef]
  10. Hou, J.; Deng, B.; Zhu, H.; Lan, Y.; Shi, Y.; De, S.; Liu, L.; Chakraborty, P.; Gao, F.; Peng, Q. Magic auxeticity angle of graphene. Carbon 2019, 149, 350–354. [Google Scholar] [CrossRef]
  11. Deng, B.; Hou, J.; Zhu, H.; Liu, S.; Liu, E.; Shi, Y.; Peng, Q. The normal-auxeticity mechanical phase transition in graphene. 2D Mater. 2017, 4, 021020. [Google Scholar] [CrossRef]
  12. Kim, Y.; Lee, J.; Yeom, M.S.; Shin, J.W.; Kim, H.; Cui, Y.; Kysar, J.W.; Hone, J.; Jung, Y.; Jeon, S.; et al. Strengthening effect of single-atomic-layer graphene in metal-graphene nanolayered composites. Nat. Commun. 2013, 4, 2114. [Google Scholar] [CrossRef] [Green Version]
  13. Wang, M.; Sheng, J.; Wang, L.-D.; Yang, Z.-Y.; Shi, Z.-D.; Wang, X.-J.; Fei, W.-D. Hot rolling behavior of graphene/Cu composites. J. Alloys Compd. 2020, 816, 153204. [Google Scholar] [CrossRef]
  14. Wang, S.; Huang, X.; He, Y.; Huang, H.; Wu, Y.; Hou, L.; Liu, X.; Yang, T.; Zou, J.; Huang, B. Synthesis, growth mechanism and thermal stability of copper nanoparticles encapsulated by multi-layer graphene. Carbon 2012, 50, 2119–2125. [Google Scholar] [CrossRef]
  15. Dixit, S.; Mahata, A.; Mahapatra, D.R.; Kailas, S.V.; Chattopadhyay, K. Multi-layer graphene reinforced aluminum-Manufacturing of high strength composite by friction stir alloying. Compos. Part B Eng. 2018, 136, 63–71. [Google Scholar] [CrossRef]
  16. Wang, X.; Xiao, W.; Wang, L.; Shi, J.; Sun, L.; Cui, J.; Wang, J. Investigation on mechanical behavior of multilayer graphene reinforced aluminum composites. Phys. E Low-dimens. Syst. Nanostruct. 2020, 123, 114172. [Google Scholar] [CrossRef]
  17. Jiang, Y.; Xu, R.; Tan, Z.; Ji, G.; Fan, G.; Li, Z.; Xiong, D.-B.; Guo, Q.; Li, Z.; Zhang, D. Interface-induced strain hardening of graphene nanosheet/aluminum composites. Carbon 2019, 146, 17–27. [Google Scholar] [CrossRef]
  18. Kuang, D.; Xu, L.Y.; Liu, L.; Hu, W.B.; Wu, Y.T. Graphene-nickel composites. Appl. Surf. Sci. 2013, 273, 484–490. [Google Scholar] [CrossRef]
  19. Kurapova, O.Y.; Lomakin, I.V.; Sergeev, S.N.; Solovyeva, E.N.; Zhilyaev, A.P.; Archakov, I.Y.; Konakov, V.G. Fabrication of nickel-graphene composites with superior hardness. J. Alloys Compd. 2020, 835, 155463. [Google Scholar] [CrossRef]
  20. Xu, J.; Yao, Y.; Jiang, X. Research on preparation process and performance of graphene reinforced iron matrix composites. Mach. Bldg. Auto. 2018, 47, 53–57. [Google Scholar]
  21. Lin, D.; Motlag, M.; Saei, M.; Jin, S.; Rahimi, R.M.; Bahr, D.; Cheng, G.J. Shock engineering the additive manufactured graphene-metal nanocomposite with high density nanotwins and dislocations for ultra-stable mechanical properties. Acta Mater. 2018, 150, 360–372. [Google Scholar] [CrossRef]
  22. Wang, L.; Jin, J.; Cao, J.; Yang, P.; Peng, Q. Interaction of Edge Dislocations with Graphene Nanosheets in Graphene/Fe Composites. Crystals 2018, 8, 160. [Google Scholar] [CrossRef] [Green Version]
  23. Rodríguez-Guerrero, A.; Sánchez, S.; Narciso, J.; Louis, E.; Rodríguez-Reinoso, F. Pressure infiltration of Al-12wt.% Si-X (X=Cu, Ti, Mg) alloys into graphite particle preforms. Acta Mater. 2006, 54, 1821–1831. [Google Scholar] [CrossRef]
  24. You, Y.; Yoshimura, M.; Cholake, S.; Lee, G.-H.; Sahajwalla, V.; Joshi, R. A Controlled Carburization Process to Obtain Graphene-Fe3C-Fe Composites. Adv. Mater. Interfaces 2018, 5, 1800599. [Google Scholar] [CrossRef]
  25. Wintterlin, J.; Bocquet, M.-L. Graphene on metal surfaces. Surf. Sci. 2009, 603, 1841–1852. [Google Scholar] [CrossRef]
  26. Politano, A.; Slotman, G.J.; Roldán, R.; Chiarello, G.; Campi, D.; Katsnelson, M.I.; Yuan, S. Effect of moiré superlattice reconstruction in the electronic excitation spectrum of graphene-metal heterostructures. 2D Mater. 2017, 4, 021001. [Google Scholar] [CrossRef] [Green Version]
  27. Liu, X.; Han, Y.; Evans, J.W.; Engstfeld, A.K.; Behm, R.J.; Tringides, M.C.; Hupalo, M.; Lin, H.-Q.; Huang, L.; Ho, K.-M.; et al. Growth morphology and properties of metals on graphene. Prog. Surf. Sci. 2015, 90, 397–443. [Google Scholar] [CrossRef] [Green Version]
  28. Jacobberger, R.M.; Arnold, M.S. Graphene Growth Dynamics on Epitaxial Copper Thin Films. Chem. Mater. 2013, 25, 871–877. [Google Scholar] [CrossRef]
  29. Rasool, H.I.; Song, E.B.; Mecklenburg, M.; Regan, B.C.; Wang, K.L.; Weiller, B.H.; Gimzewski, J.K. Atomic-Scale Characterization of Graphene Grown on Copper (100) Single Crystals. J. Am. Chem. Soc. 2011, 133, 12536–12543. [Google Scholar] [CrossRef]
  30. Vinogradov, N.; Zakharov, A.; Kocevski, V.; Rusz, J.; Simonov, K.A.; Eriksson, O.; Mikkelsen, A.; Lundgren, E.; Vinogradov, A.; Mårtensson, N.; et al. Formation and Structure of Graphene Waves on Fe (110). Phys. Rev. Lett. 2012, 109, 026101. [Google Scholar] [CrossRef]
  31. Preobrajenski, A.B.; Ng, M.L.; Vinogradov, A.S.; Mårtensson, N. Controlling graphene corrugation on lattice-mismatched substrates. Phys. Rev. B 2008, 78, 073401. [Google Scholar] [CrossRef]
  32. Pang, Z.; Deng, B.; Liu, Z.; Peng, H.; Wei, Y. Defects guided wrinkling in graphene on copper substrate. Carbon 2019, 143, 736–742. [Google Scholar] [CrossRef] [Green Version]
  33. Wang, L.; Jin, J.; Yang, P.; Li, S.; Tang, S.; Zong, Y.; Peng, Q. Effect of interfacial bonding on dislocation strengthening in graphene nanosheet reinforced iron composite: A molecular dynamics study. Comput. Mater. Sci. 2021, 191, 110309. [Google Scholar] [CrossRef]
  34. Shuang, F.; Aifantis, K.E. Relating the strength of graphene/metal composites to the graphene orientation and position. Scr. Mater. 2020, 181, 70–75. [Google Scholar] [CrossRef]
  35. Shuang, F.; Aifantis, K.E. Modelling dislocation-graphene interactions in a BCC Fe matrix by molecular dynamics simulations and gradient plasticity theory. Appl. Surf. Sci. 2021, 535, 147602. [Google Scholar] [CrossRef]
  36. Shuang, F.; Aifantis, K.E. Dislocation-graphene interactions in Cu/graphene composites and the effect of boundary conditions: A molecular dynamics study. Carbon 2021, 172, 50–70. [Google Scholar] [CrossRef]
  37. Yang, Y.; Song, G.; Fu, Q.; Pan, C. Preparation of Fe-Gr composite layer via DC electro-plating for high performances. J. Alloys Compd. 2018, 768, 859–865. [Google Scholar] [CrossRef]
  38. Wang, L.; Jin, J.; Yang, P.; Zong, Y.; Peng, Q. Graphene Adhesion Mechanics on Iron Substrates: Insight from Molecular Dynamic Simulations. Crystals 2019, 9, 579. [Google Scholar] [CrossRef] [Green Version]
  39. Plimpton, S. Fast Parallel Algorithms for Short-Range Molecular Dynamics. J. Comput. Phys. 1995, 117, 1–19. [Google Scholar] [CrossRef] [Green Version]
  40. Stuart, S.J.; Tutein, A.B.; Harrison, J.A. A reactive potential for hydrocarbons with intermolecular interactions. J. Chem. Phys. 2000, 112, 6472–6486. [Google Scholar] [CrossRef] [Green Version]
  41. Hepburn, D.J.; Ackland, G.J. Metallic-covalent interatomic potential for carbon in iron. Phys. Rev. B 2008, 78, 165115. [Google Scholar] [CrossRef]
  42. He, X.; Bai, Q.; Shen, R. Atomistic perspective of how graphene protects metal substrate from surface damage in rough contacts. Carbon 2018, 130, 672–679. [Google Scholar] [CrossRef]
  43. Parrinello, M.; Rahman, A. Polymorphic transitions in single crystals: A new molecular dynamics method. J. Appl. Phys. 1981, 52, 7182–7190. [Google Scholar] [CrossRef]
  44. Bussi, G.; Donadio, D.; Parrinello, M. Canonical sampling through velocity rescaling. J. Chem. Phys. 2007, 126, 014101. [Google Scholar] [CrossRef] [PubMed] [Green Version]
  45. Hoover, W.G. Canonical dynamics: Equilibrium phase-space distributions. Phys. Rev. A 1985, 31, 1695–1697. [Google Scholar] [CrossRef] [Green Version]
  46. Stukowski, A. Visualization and analysis of atomistic simulation data with OVITO-the Open Visualization Tool. Modelling. Simul. Mater. Sci. Eng. 2009, 18, 015012. [Google Scholar] [CrossRef]
  47. Bai, Q.-S.; Dou, Y.-H.; He, X.; Zhang, A.-M.; Guo, Y.-B. Deposition and growth mechanism of graphene on copper crystal surface based on molecular dynamics simulation. Acta Phys. Sin. 2020, 69, 226102. [Google Scholar] [CrossRef]
  48. Ding, J.; Qiao, Z.H.; Feng, W.X.; Yao, Y.; Niu, Q. Engineering quantum anomalous/valley Hall states in graphene via metal-atom adsorption: An ab-initio study. Phys. Rev. B 2011, 84, 195444. [Google Scholar] [CrossRef] [Green Version]
  49. Hu, L.; Hu, X.; Wu, X.; Du, C.; Dai, Y.; Deng, J. Density functional calculation of transition metal adatom adsorption on graphene. Phys. B Condens. Matter 2010, 405, 3337–3341. [Google Scholar] [CrossRef]
  50. Chan, K.T.; Neaton, J.B.; Cohen, M.L. First-principles study of metal adatom adsorption on graphene. Phys. Rev. B 2008, 77, 235430. [Google Scholar] [CrossRef]
Figure 1. Schematic of molecular dynamic (MD) setting for the graphene nanosheet embedded into iron aligned along different crystallographic plane in the Gr/Fe composites: (a) (110) and (b) other four plane of ( 1 1 ¯ 0 ), (111), ( 11 2 ¯ ) and (001), respectively.
Crystals 13 00027 g001
Figure 2. Distribution histograms of the length of Fe-C bonding (L) at the Gr/Fe (a) (110) or ( 1 1 ¯ 0 ), (b) (111), (c) ( 11 2 ¯ ), and (d) (001) interface, respectively, calculated from MD simulations using LJ and EAM potentials.
Crystals 13 00027 g002
Figure 3. (a) Close-up STM image and positions of Gr/Fe (110) interface calculated by DFT [30], atomic structures from MD simulations using (b) LJ and (c) EAM potentials of Fe-C.
Crystals 13 00027 g003
Figure 4. (a) Initial and (b) the relaxed atomic structures of graphene/Fe (110) interface, corresponding to the red region in Figure 3c.
Crystals 13 00027 g004
Figure 5. Displacement distribution of graphene/Fe (a) ( 1 1 ¯ 0 ), (b) (111), (c) ( 11 2 ¯ ), and (d) (001) interface, calculated from MD simulations using EAM potential of Fe-C.
Crystals 13 00027 g005
Figure 6. Atomic structures at the graphene/Fe (a) ( 1 1 ¯ 0 ), (b) (111), (c) ( 11 2 ¯ ), and (d) (001) interfaces, corresponding to the red region in Figure 5a–d, respectively.
Crystals 13 00027 g006
Table 1. Interactive energy (E) and average vertical distance ( D 1 ¯ , D 2 ¯ ) between the graphene nanosheet and the 1st- or 2nd-closed iron atom layer at the interface, where the graphene nanosheet is aligned on different crystallographic plane of iron matrix, and D 0 ¯ is the initial setting distance between the graphene and iron matrix.
Interface
Properties
(110)( 1 1 ¯ 0 )(111)( 11 2 ¯ )(001)
LJEAMLJEAMLJEAMLJEAMLJEAM
E (J/m2)−1.00−5.63−1.00−5.63−0.73−4.32−0.82−4.39−0.81−4.52
D 0 ¯ (Å)2.022.022.062.322.15
D 1 ¯ (Å)2.151.732.151.732.051.662.171.752.151.76
D 2 ¯ (Å)4.163.784.163.783.612.363.272.764.163.19
Note: LJ and EAM represent the weak and strong bonding of Fe-C, respectively.
Disclaimer/Publisher’s Note: The statements, opinions and data contained in all publications are solely those of the individual author(s) and contributor(s) and not of MDPI and/or the editor(s). MDPI and/or the editor(s) disclaim responsibility for any injury to people or property resulting from any ideas, methods, instructions or products referred to in the content.

