Article

Effect of Sc Addition on High-Temperature Oxidation Performance of Al-Li Alloy

School of Materials Science and Engineering, Northeastern University, Shenyang 110819, China
*
Author to whom correspondence should be addressed.
Crystals 2023, 13(1), 22; https://doi.org/10.3390/cryst13010022
Submission received: 17 November 2022 / Revised: 11 December 2022 / Accepted: 15 December 2022 / Published: 23 December 2022

Abstract

:
Aluminum–lithium alloys were treated by high-temperature oxidation. The oxidation kinetics were analyzed by oxidation weighing. The surface morphology of the oxidized samples was observed by FESEM scanning electron microscopy. A phase analysis of the oxidized alloys was conducted by XRD. The outcomes demonstrate that the aluminum–lithium alloy with a Sc element is oxidized at a high temperature under the same conditions, improving the high-temperature oxidation resistance, the weight increase from oxidation is minimal, and the oxidation kinetic reaction index is decreased. The resulting oxidation product is Li2CO3. The addition of a Sc element can prevent the movement of metal cations, improve the high-temperature oxidation resistance of Al–Li alloy to a certain extent, and the resulting oxide film is more complete and compact.

1. Introduction

The “crown” of the modern manufacturing sector is the aerospace manufacturing sector, which integrates cutting-edge high and new technologies. The lightweight design and production of aircraft is one of the aerospace sector’s development hotspots [1]. Al–Li alloys are often used in the aerospace industry and other industries because of their high strength, low density, resistance to fatigue cracks, and outstanding mechanical properties at low temperatures [2,3].
The term “aluminum–lithium alloy” describes an alloy of aluminum that contains lithium (Li). For every 1.0% Li added to the aluminum alloy, the density of the aluminum alloy decreases by 3% and the elastic modulus increases by 6% [4]. The research on Al–Li alloys has been of great importance in the world. The research on Al–Li alloys began in 1924 when German researchers successfully developed the Scleron alloy [5]. Chinese research on Al–Li alloys began in the 1980s, mainly imitations in the early stage, and independent development of Al–Li alloys began after the 21st century [6].
Because of its excellent performance, Al–Li alloys have been widely used in many industries and fields. The service environment and processing technology of Al–Li alloys are gradually complicated and diversified. However, in the process of welding, heat treatment and other hot processing, when it comes into contact with oxygen and water, the surface of the Al–Li alloy is easy to form lithium compounds because of the strong chemical activity of Li and other elements in the Al-Li alloy, such as Li2O, Li2O, and LiOH with deliquesce. Moreover, Li has a strong ability to bind to oxygen, and the oxide film formed on the alloy’s surface at high temperature is loose and porous, forming a layered oxide rich in lithium. Current research on the oxidation of aluminum–lithium alloys is focused on surface modification and alloying. The research on surface modification is mainly focused on anodic oxidation to form an oxide film on the surface to protect the substrate. However, this method is costly and does not fundamentally solve the easy oxidation characteristics of aluminum–lithium alloy. Through alloying can fundamentally solve the characteristics of the alloy’s poor high-temperature oxidation resistance, in the subsequent processing it can enhance the alloy’s high-temperature oxidation resistance. Therefore, it is necessary to study the oxidation behavior of Al–Li alloys with an Sc element at high temperatures.
Rare earth elements are widely used in aluminum alloys, and remarkable results have been achieved in many fields [7,8,9,10]. The Sc element is both a rare earth element and a 3D transition element, which not only has the advantages of both but also has a better effect than other elements in the same group. In Al–Li alloys, Sc not only plays a role in purifying the alloy of rare earth metals and improving the ingot structure, but also plays a role in inhibiting recrystallization of transition metals, refining grains and reducing casting defects [11,12,13], and has an important influence on the improvement of its mechanical properties, welding properties and corrosion resistance [14].The role of rare earth elements in the high-temperature oxidation resistance of alloys is mainly to reduce the outward diffusion rate of cations along the grain boundary of the oxide film, thus reducing the oxidation rate of the alloy [15]. However, there are few studies on the high-temperature oxidation resistance of Al-Li alloys with the addition of a Sc element at present.
In this paper, by studying the oxidation of an Al-Li binary alloy with a Sc element added at different temperatures (oxidation duration is 5 h), the influence of the Sc element added to the oxidation performance of Al–Li alloys is compared and analyzed, and the oxidation kinetics of the Al–Li alloy is analyzed by investigating its oxidation morphology, oxide phase, and oxidation weight gain. The oxidation kinetics are then plotted against the real-time oxidation weight gain per unit area.

2. Experimental Materials and Methods

2.1. Experimental Alloys and Preparation

The temperature environment during the oxidation of the Al–Li alloy has a great influence on the oxidation, so this experiment mainly investigates the effect of a Sc addition on the high-temperature oxidation performance of an Al-Li alloy at different temperatures. As the content of Li in the third-generation aluminum–lithium alloy is 1~2 wt%, the content of Li in the alloy used in this experiment is 2 wt%. The experimental alloy was smelted in a resistance furnace, and the mixed molten salt of LiF and LiCl was used as the covering agent, in which LiF:LiCl = 1:4. Argon gas was passed into the melting process for gas protection, and after melting, iron mold was used for casting. The composition of the alloy after ICP fluorescence analysis is shown in Table 1.

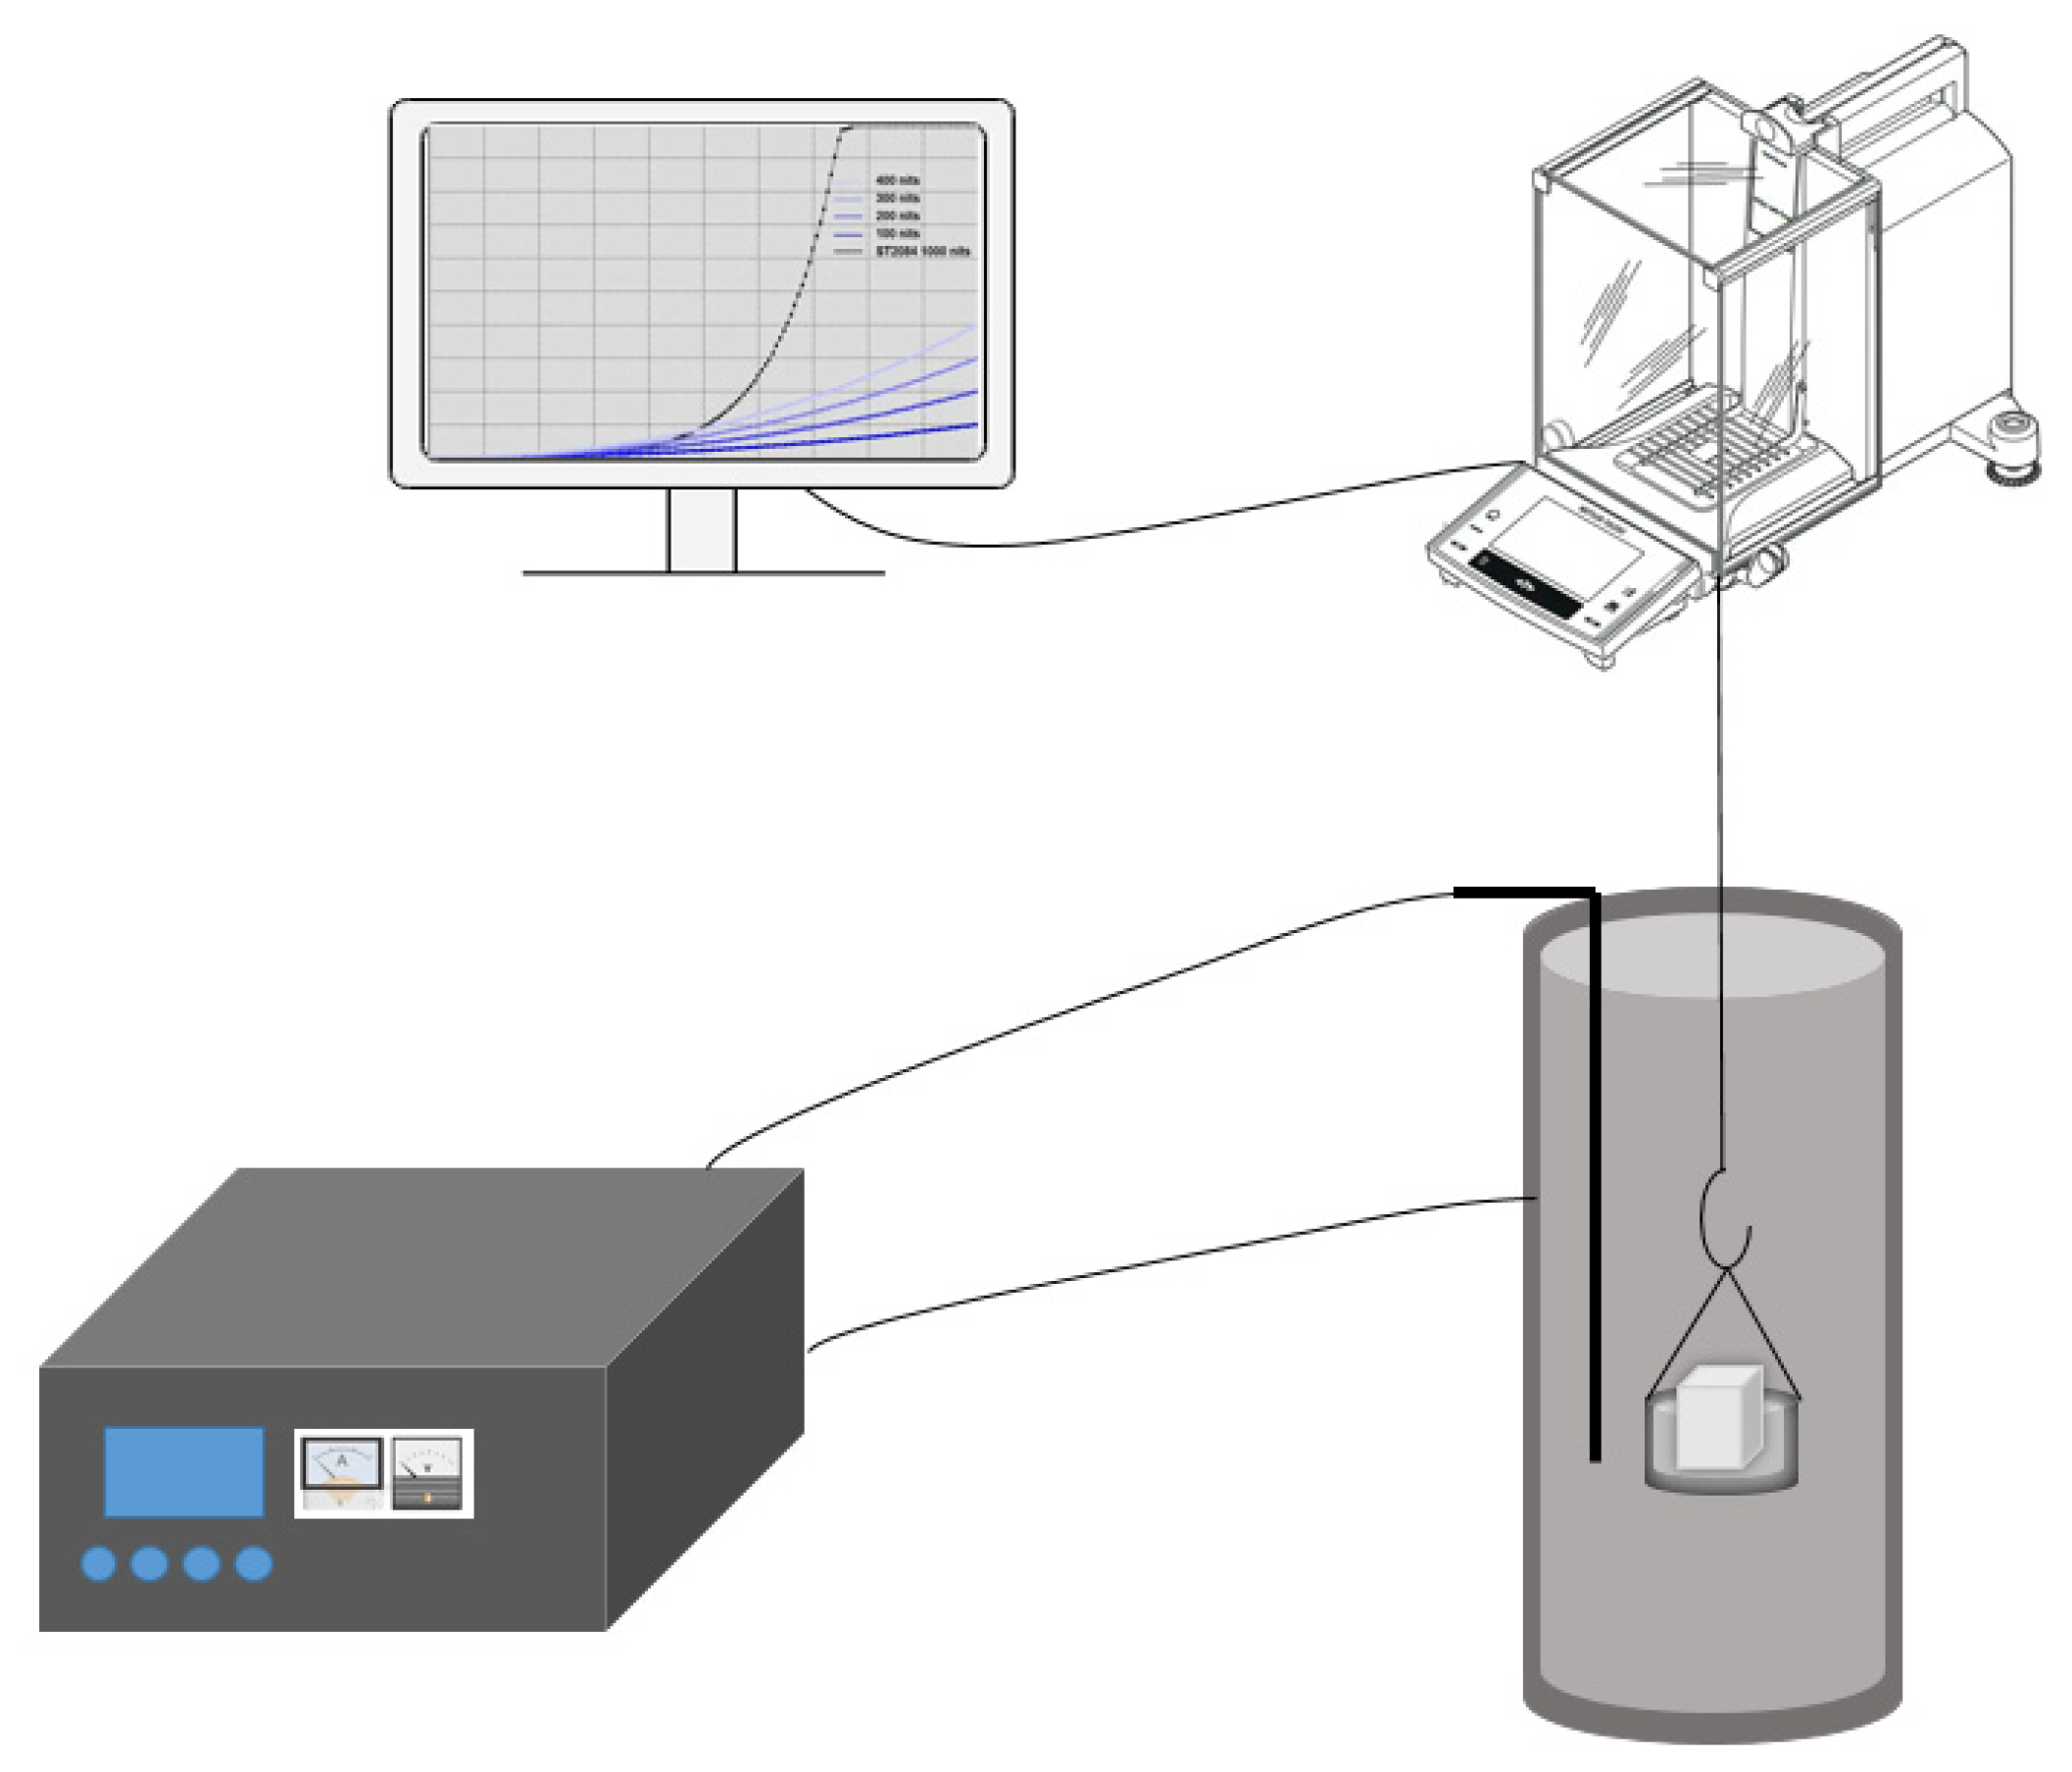
2.2. Experimental Apparatus and Method

The aluminum–lithium alloy high-temperature oxidation device used in this paper is shown in Figure 1, which included three parts: weighing scales, resistance furnace, and temperature control device. The test sample of 15 mm × 15 mm × 20 mm was used for high-temperature oxidation, and each edge was chamfered to avoid the influence of the corner effect caused by thermal stress concentration. In addition, the sample surface was flat and smooth. Before the test, the furnace was first heated to a predetermined temperature, and then the sample was dried. After drying, the sample was preheated to the set temperature in the furnace and then put into the furnace, and the timing and real-time weighing were started. The oxidation kinetics were then plotted against the real-time oxidation weight gain per unit area.

3. Results and Analysis

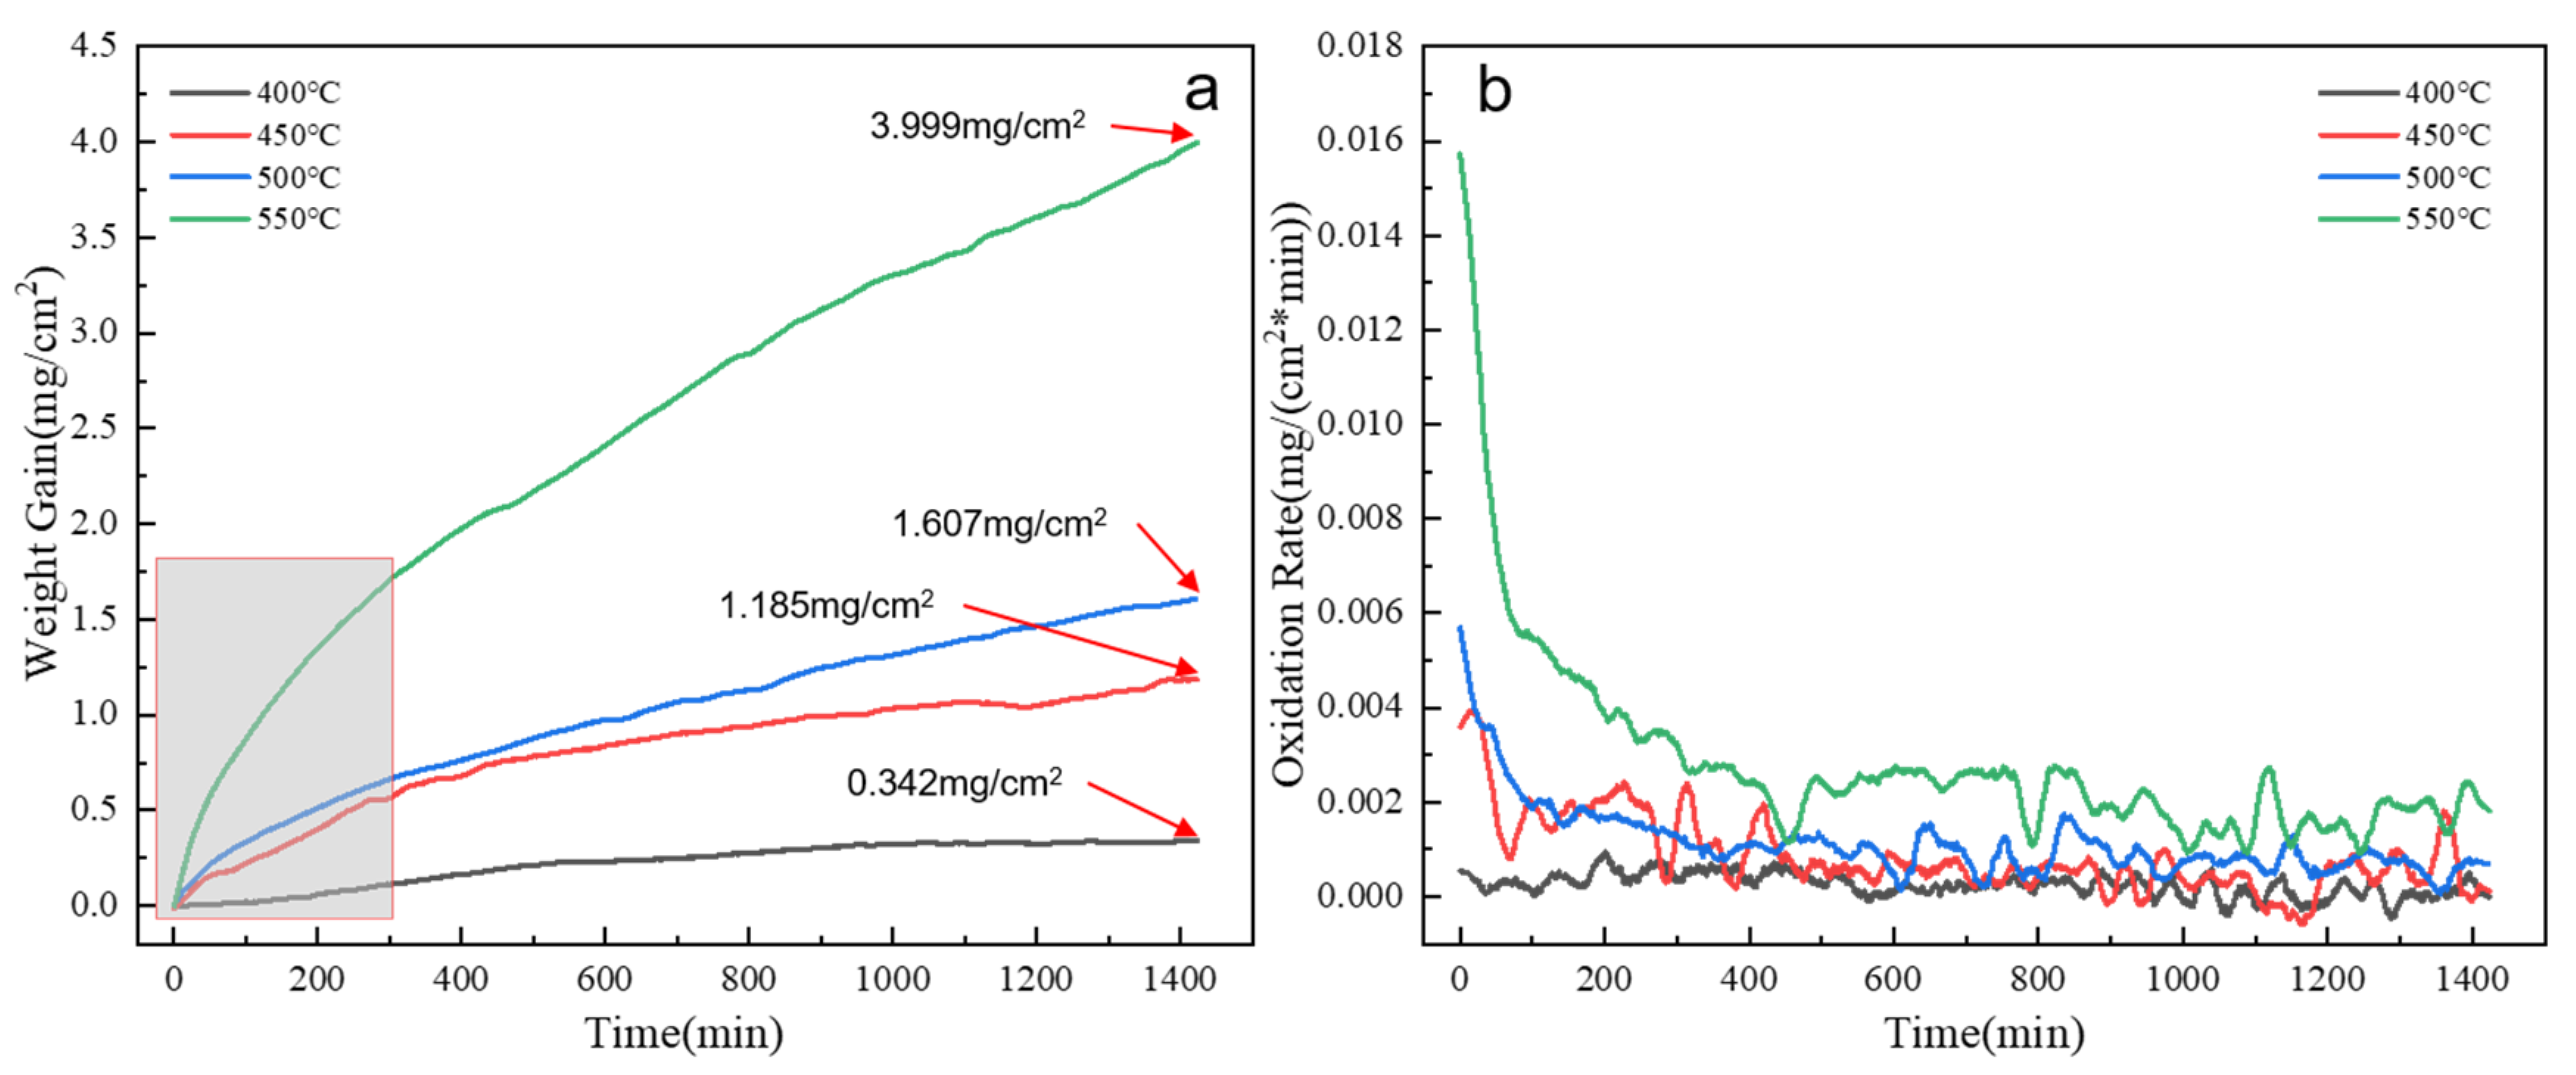
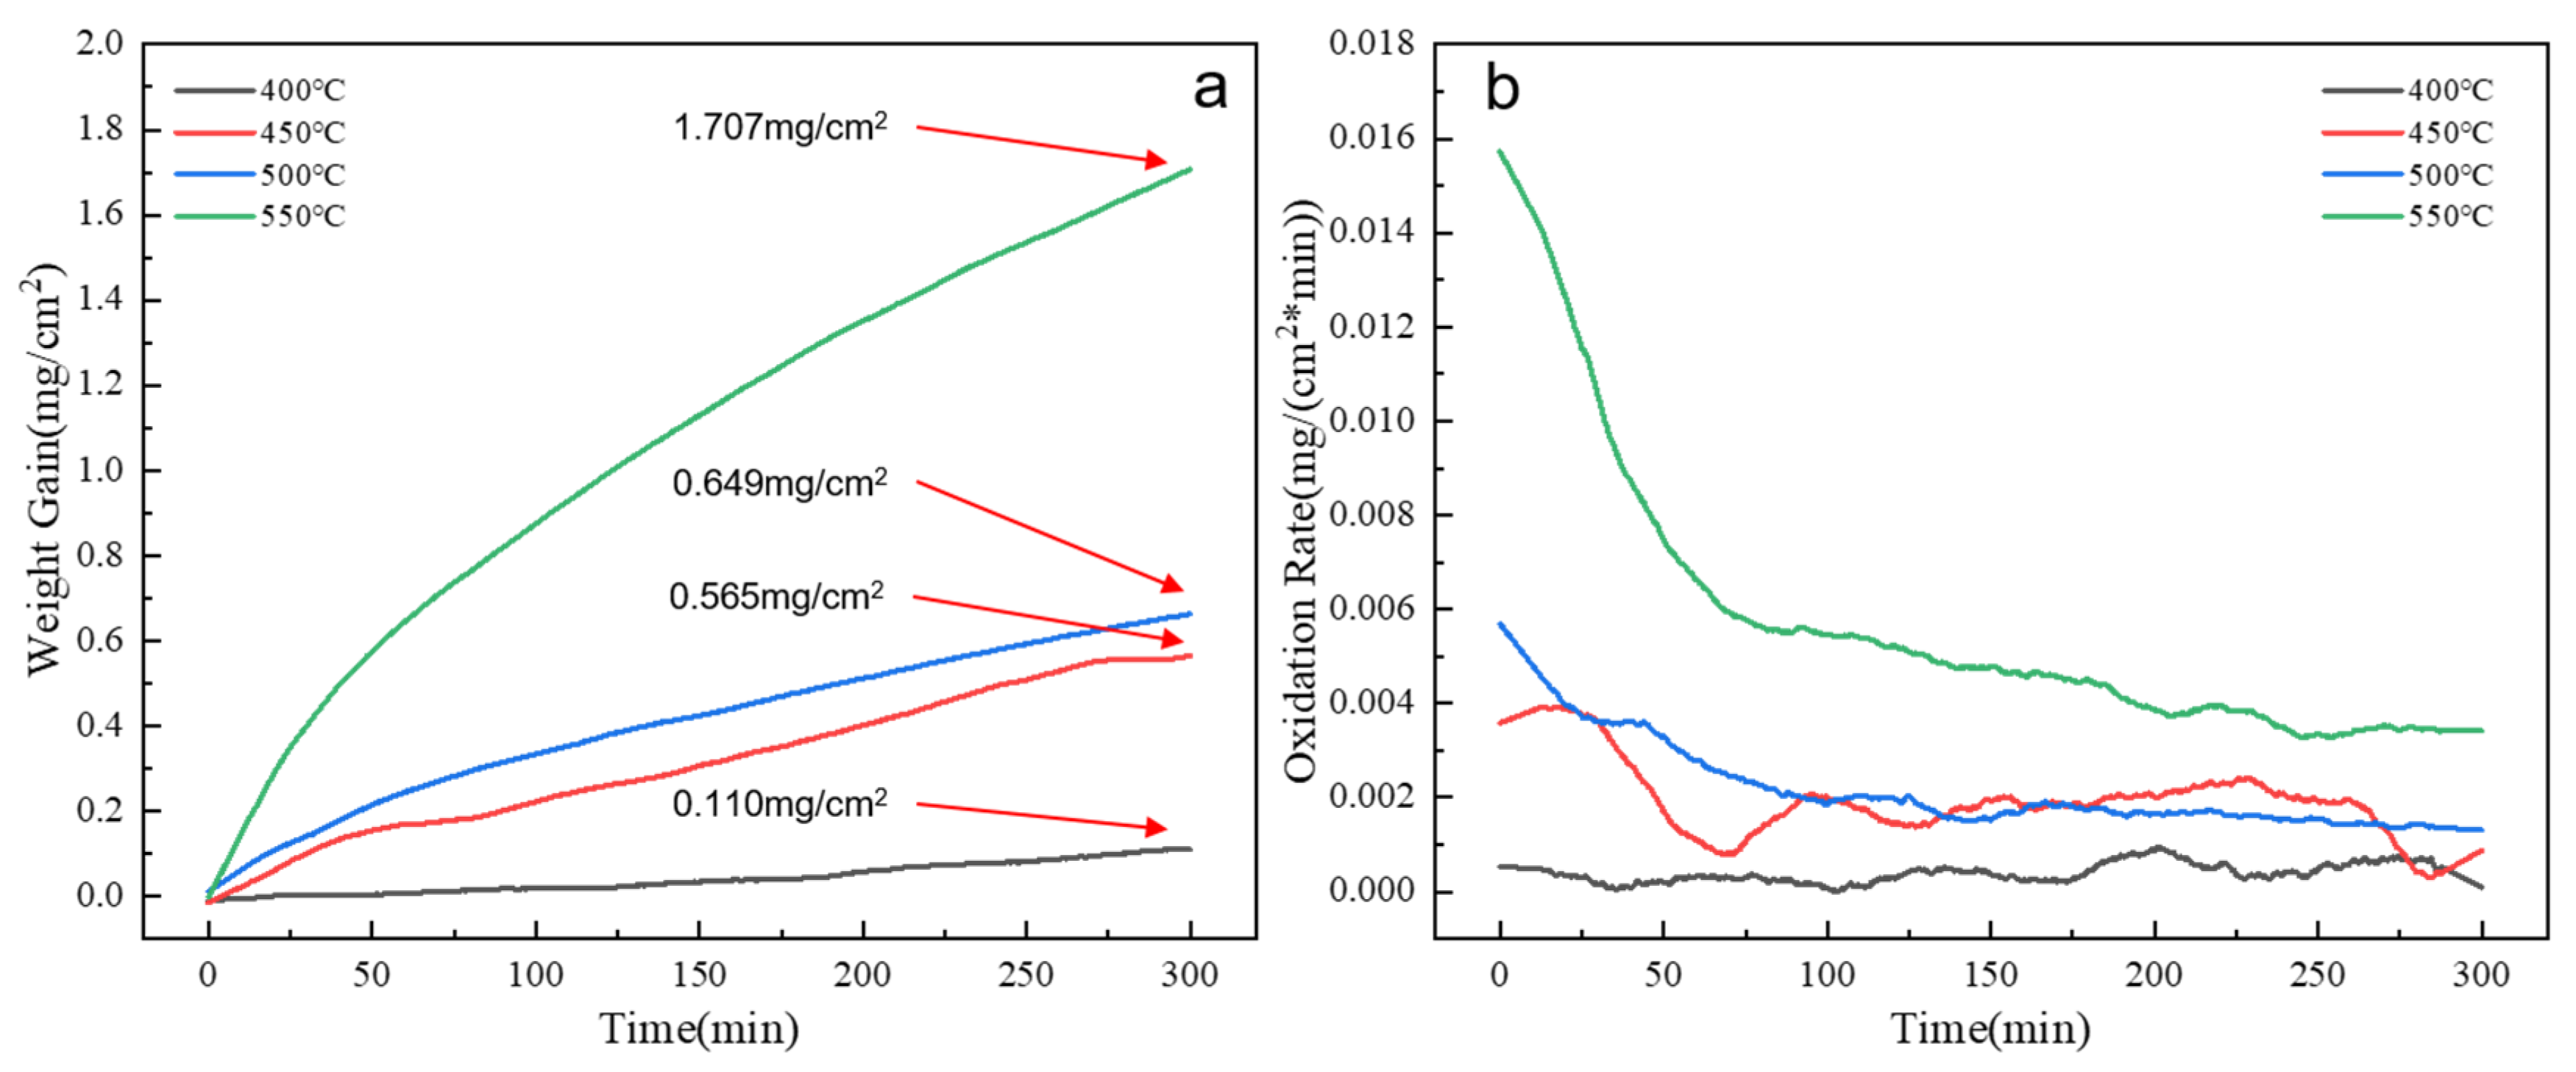
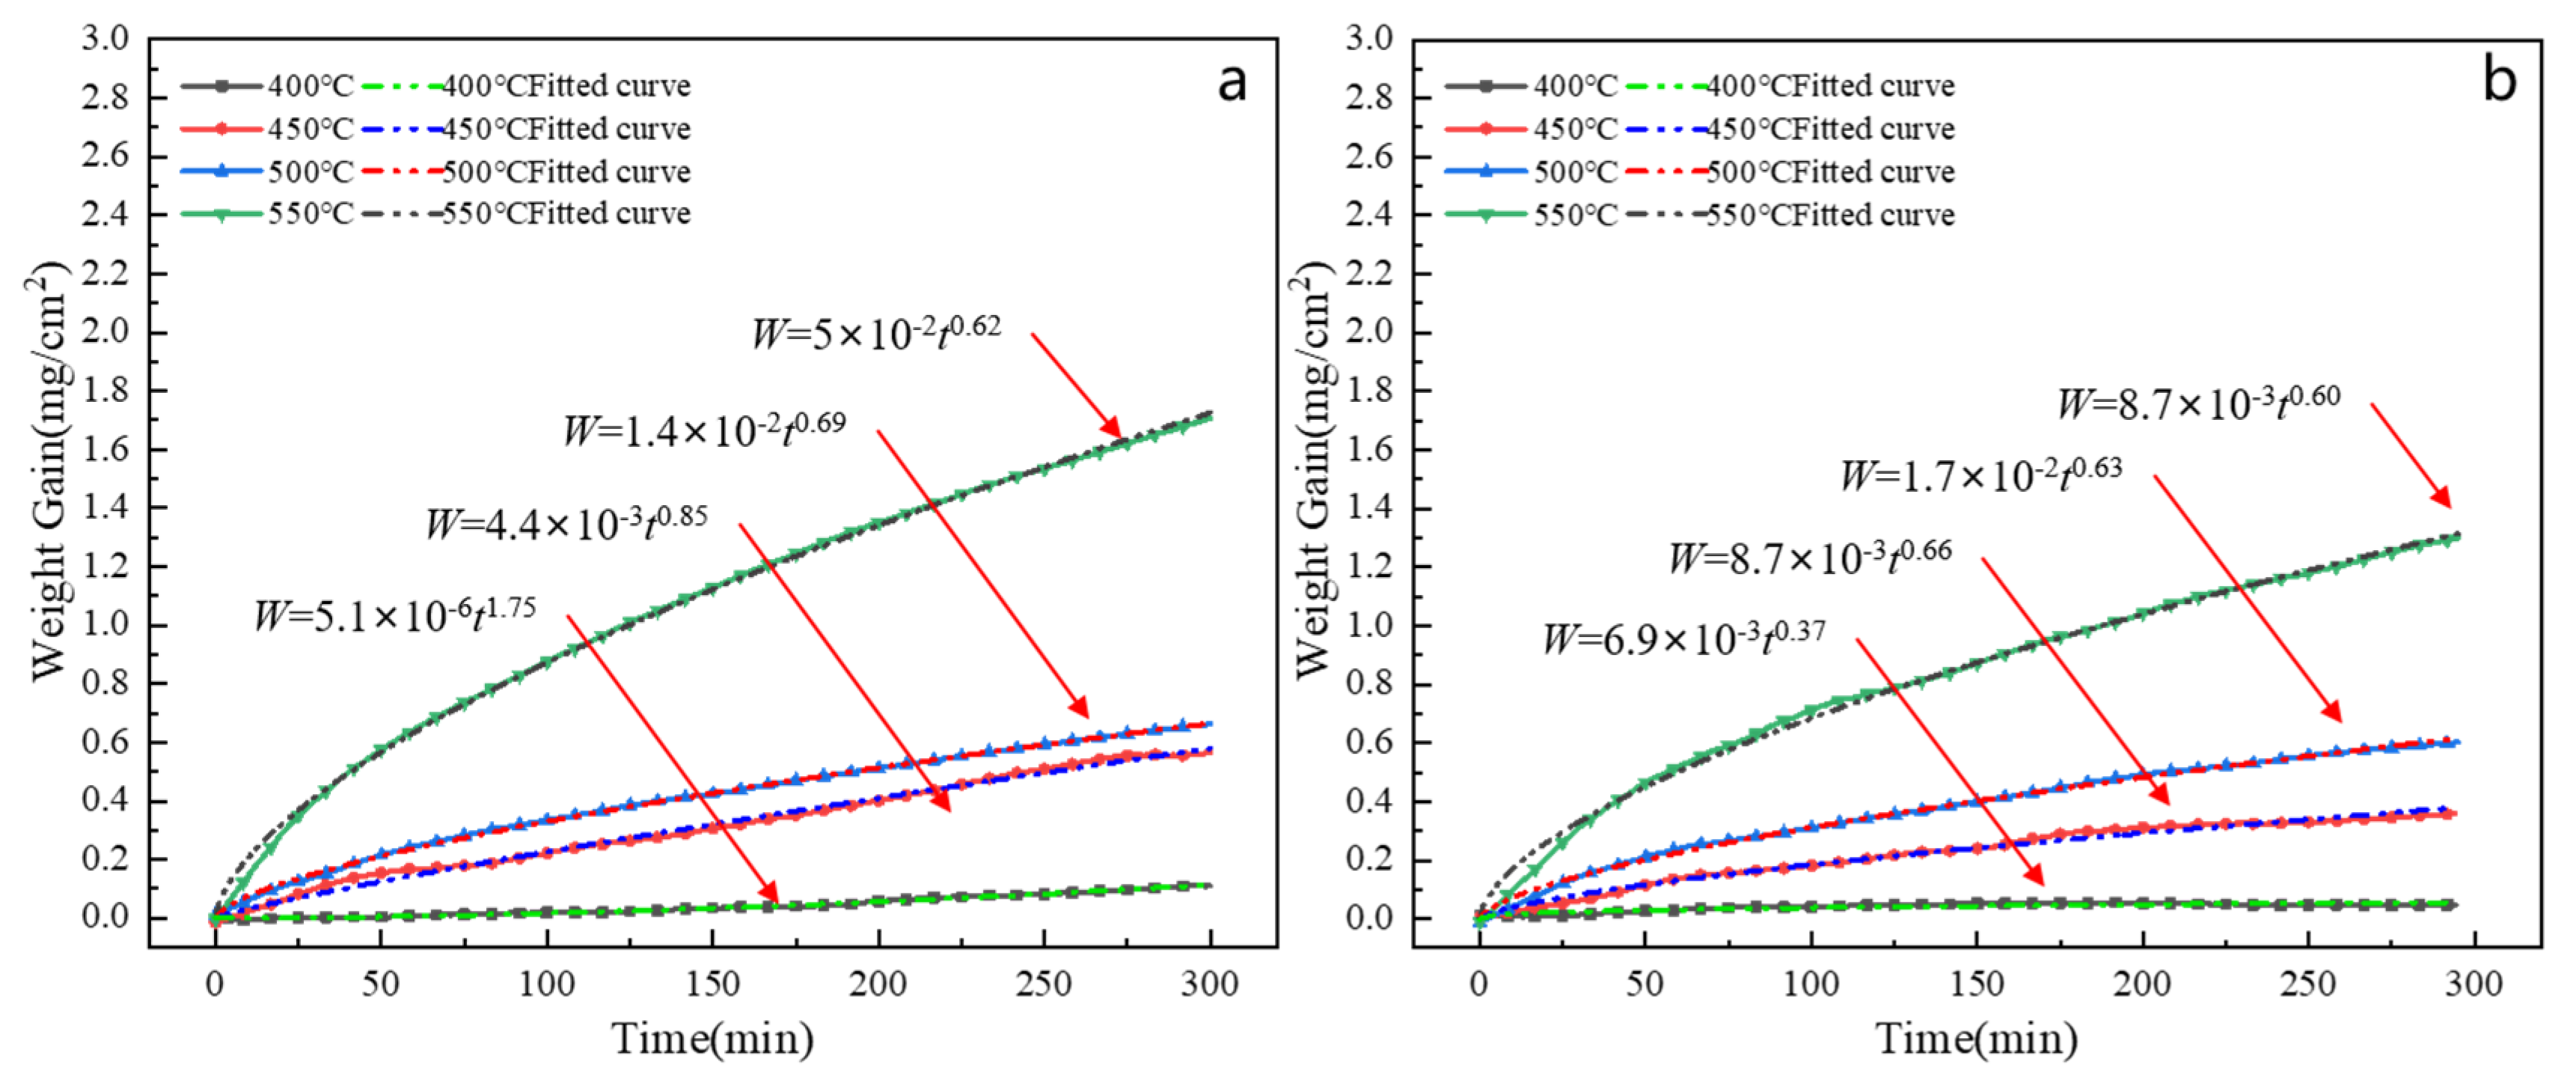
3.1. Effect of Temperature on High-Temperature Oxidation Behavior of Al-Li Alloy

The samples were oxidized at 400, 450, 500 and 550 °C for 24 h, and the weight gain curve and weight gain rate are shown in Figure 2.
As shown in the figure, the oxidation weight gain after 24 h oxidation at 400 °C, 450 °C, 500 °C, and 550 °C is 0.342 mg/cm2, 1.185 mg/cm2, 1.607 mg/cm2 and 3.999 mg/cm2, respectively. As the temperature increases, so does the weight gain of the oxidation. Under the condition of the same oxidation time, the higher the temperature, the more obvious the oxidation weight gain. In addition, the oxidation reaction is relatively fast in the initial stage. Due to the large contact surface between the sample and the air in the initial stage of oxidation, and the easy oxidation of the alloy, the alloy oxidation rate is relatively fast. However, with the extension of time, oxide film gradually forms on the surface of the sample. The existence of oxide film reduces the outward diffusion of metal cations and the inward diffusion of oxygen ions to a certain extent, so the oxidation trend gradually slows down and tends to be stable.
At 400 °C, the oxidation rate is relatively slow in the early stages, and there is a small difference in the pre-oxidation rate at 450 °C and 500 °C, while the oxidation rate at 550 °C is the fastest compared with 400 °C, 500 °C, and 550 °C. However, with the progress of oxidation, the oxidation rate gradually decreases in a fluctuating state, but the overall oxidation tends to be stable.
At 400 °C, 450 °C, 500 °C, and 550 °C, the oxidation rate has undergone a process from fast to slow. In addition, the oxidation rate changes significantly in the first 5 h, and then the oxidation rate changes gently. Therefore, the oxidation weight gain and the oxidation rate in the first 5 h are analyzed.

3.2. Effect of Sc on Oxidation Resistance of Al-Li Alloy at High Temperature

The weight gain curve and weight gain rate of the Al–2Li alloy after oxidation for 5 h at different temperatures are shown in Figure 3. The oxidation weight gain after oxidation for 5 h at 400 °C, 450 °C, 500 °C, and 550 °C is 0.110 mg/cm2, 0.565 mg/cm2, 0.649 mg/cm2, and 1.707 mg/cm2, respectively. The oxidation weight gain rate of the alloy increases with the increase of temperature. At 400 °C, the oxidation rate of the alloy is small and the fluctuation is small. With the increase of oxidation temperature, the oxidation rate fluctuates greatly. In the initial oxidation stage, the oxidation rate of the alloy can reach 0.016 mg/(cm2·min) at 550 °C, but with the progress of oxidation, the oxidation rate decreases rapidly. In the first 75 min, the oxidation rate of the alloy was more intense, but the oxidation rate showed a downward trend. Although the oxidation rate fluctuated after 75 min, the overall oxidation rate showed a stable trend.
The oxidation weight gain and oxidation rate of the Al–2Li–0.2Sc alloy with a 0.2 wt% Sc element added after oxidation for 5 h are shown in Figure 4. The oxidation weight gain and oxidation rate are positively correlated with oxidation temperature. The oxidation weight gain at 400 °C, 450 °C, 500 °C, and 550 °C for 5 h was 0.046 mg/cm2, 0.531 mg/cm2, 0.602 mg/cm2, and 1.182 mg/cm2, respectively.
After the addition of Sc element, the alloys oxidized at 400 °C, 450 °C, 500 °C, and 550 °C for 5 h decreased by 0.064 mg/cm2, 0.034 mg/cm2, 0.047 mg/cm2, and 0.525 mg/cm2, respectively, compared with the same temperature. The oxidation weight gain decreased by 58.2%, 6.02%, 7.24%, and 30.8%, respectively. By comparing the oxidation rate, it can be found that the oxidation rate of the alloy with a Sc element decreases at different temperatures, and the oxidation rate decreases most significantly at 550 °C.

3.3. Oxidation Kinetics Analysis of Sc Alloyed Alloy

The oxidation weight gain curves of the Al–2Li and Al–2Li–0.2Sc alloys were further analyzed to investigate the oxidation kinetics. The weight gain curve after fitting is shown in Figure 5. The oxidation kinetic curves of the Al–2Li and Al–2Li–0.2Sc alloys were fitted by referring to the oxidation kinetic knowledge of nonferrous and ferrous metals [16,17]:
W = k t n
where W: oxidation weight gain per unit area of the alloy surface (mg/cm2), k: oxidation rate constant, t: oxidation duration, and n: time exponent. When n = 0.5, the oxidation kinetics follow the theoretical parabolic linear rate, in which cations control the growth rate of the oxide film through the growing oxide film. When n = 1, the oxidation kinetics follow the theoretical linear growth rate, which means that the chemical reaction at the interface of the oxide film—metal or oxide film—gas controls the growth rate of oxide film. When n > 1, the oxidation kinetics follow the ultra linear rate law, which is related to the rupture of oxide film during the growth process. In addition, due to the complexity of oxidation kinetics in the actual oxidation process, it is not appropriate to define the parabolic linear rate law as n = 0.5, but it should be defined in a range, such as 0.35~0.85, and the alloy oxidation kinetics follow the parabolic linear rate law. When n is between 0.85 and 1.3, the oxidation kinetics of the alloy follow the linear rate law. When n > 1.3, the oxidation kinetics of the alloy follow the ultra linear rate rule. Therefore, a larger n value means that the alloy will suffer more severe oxidation after oxidation under the corresponding conditions.
The reaction indices of Al–2Li and Al–2Li–0.2Sc at different temperatures are shown in Table 2. When oxidized at 400 °C, 450 °C, 500 °C, and 550 °C, the reaction index after Sc alloying decreases, which means that the high-temperature oxidation resistance of the Al–2Li alloy is improved by Sc alloying.

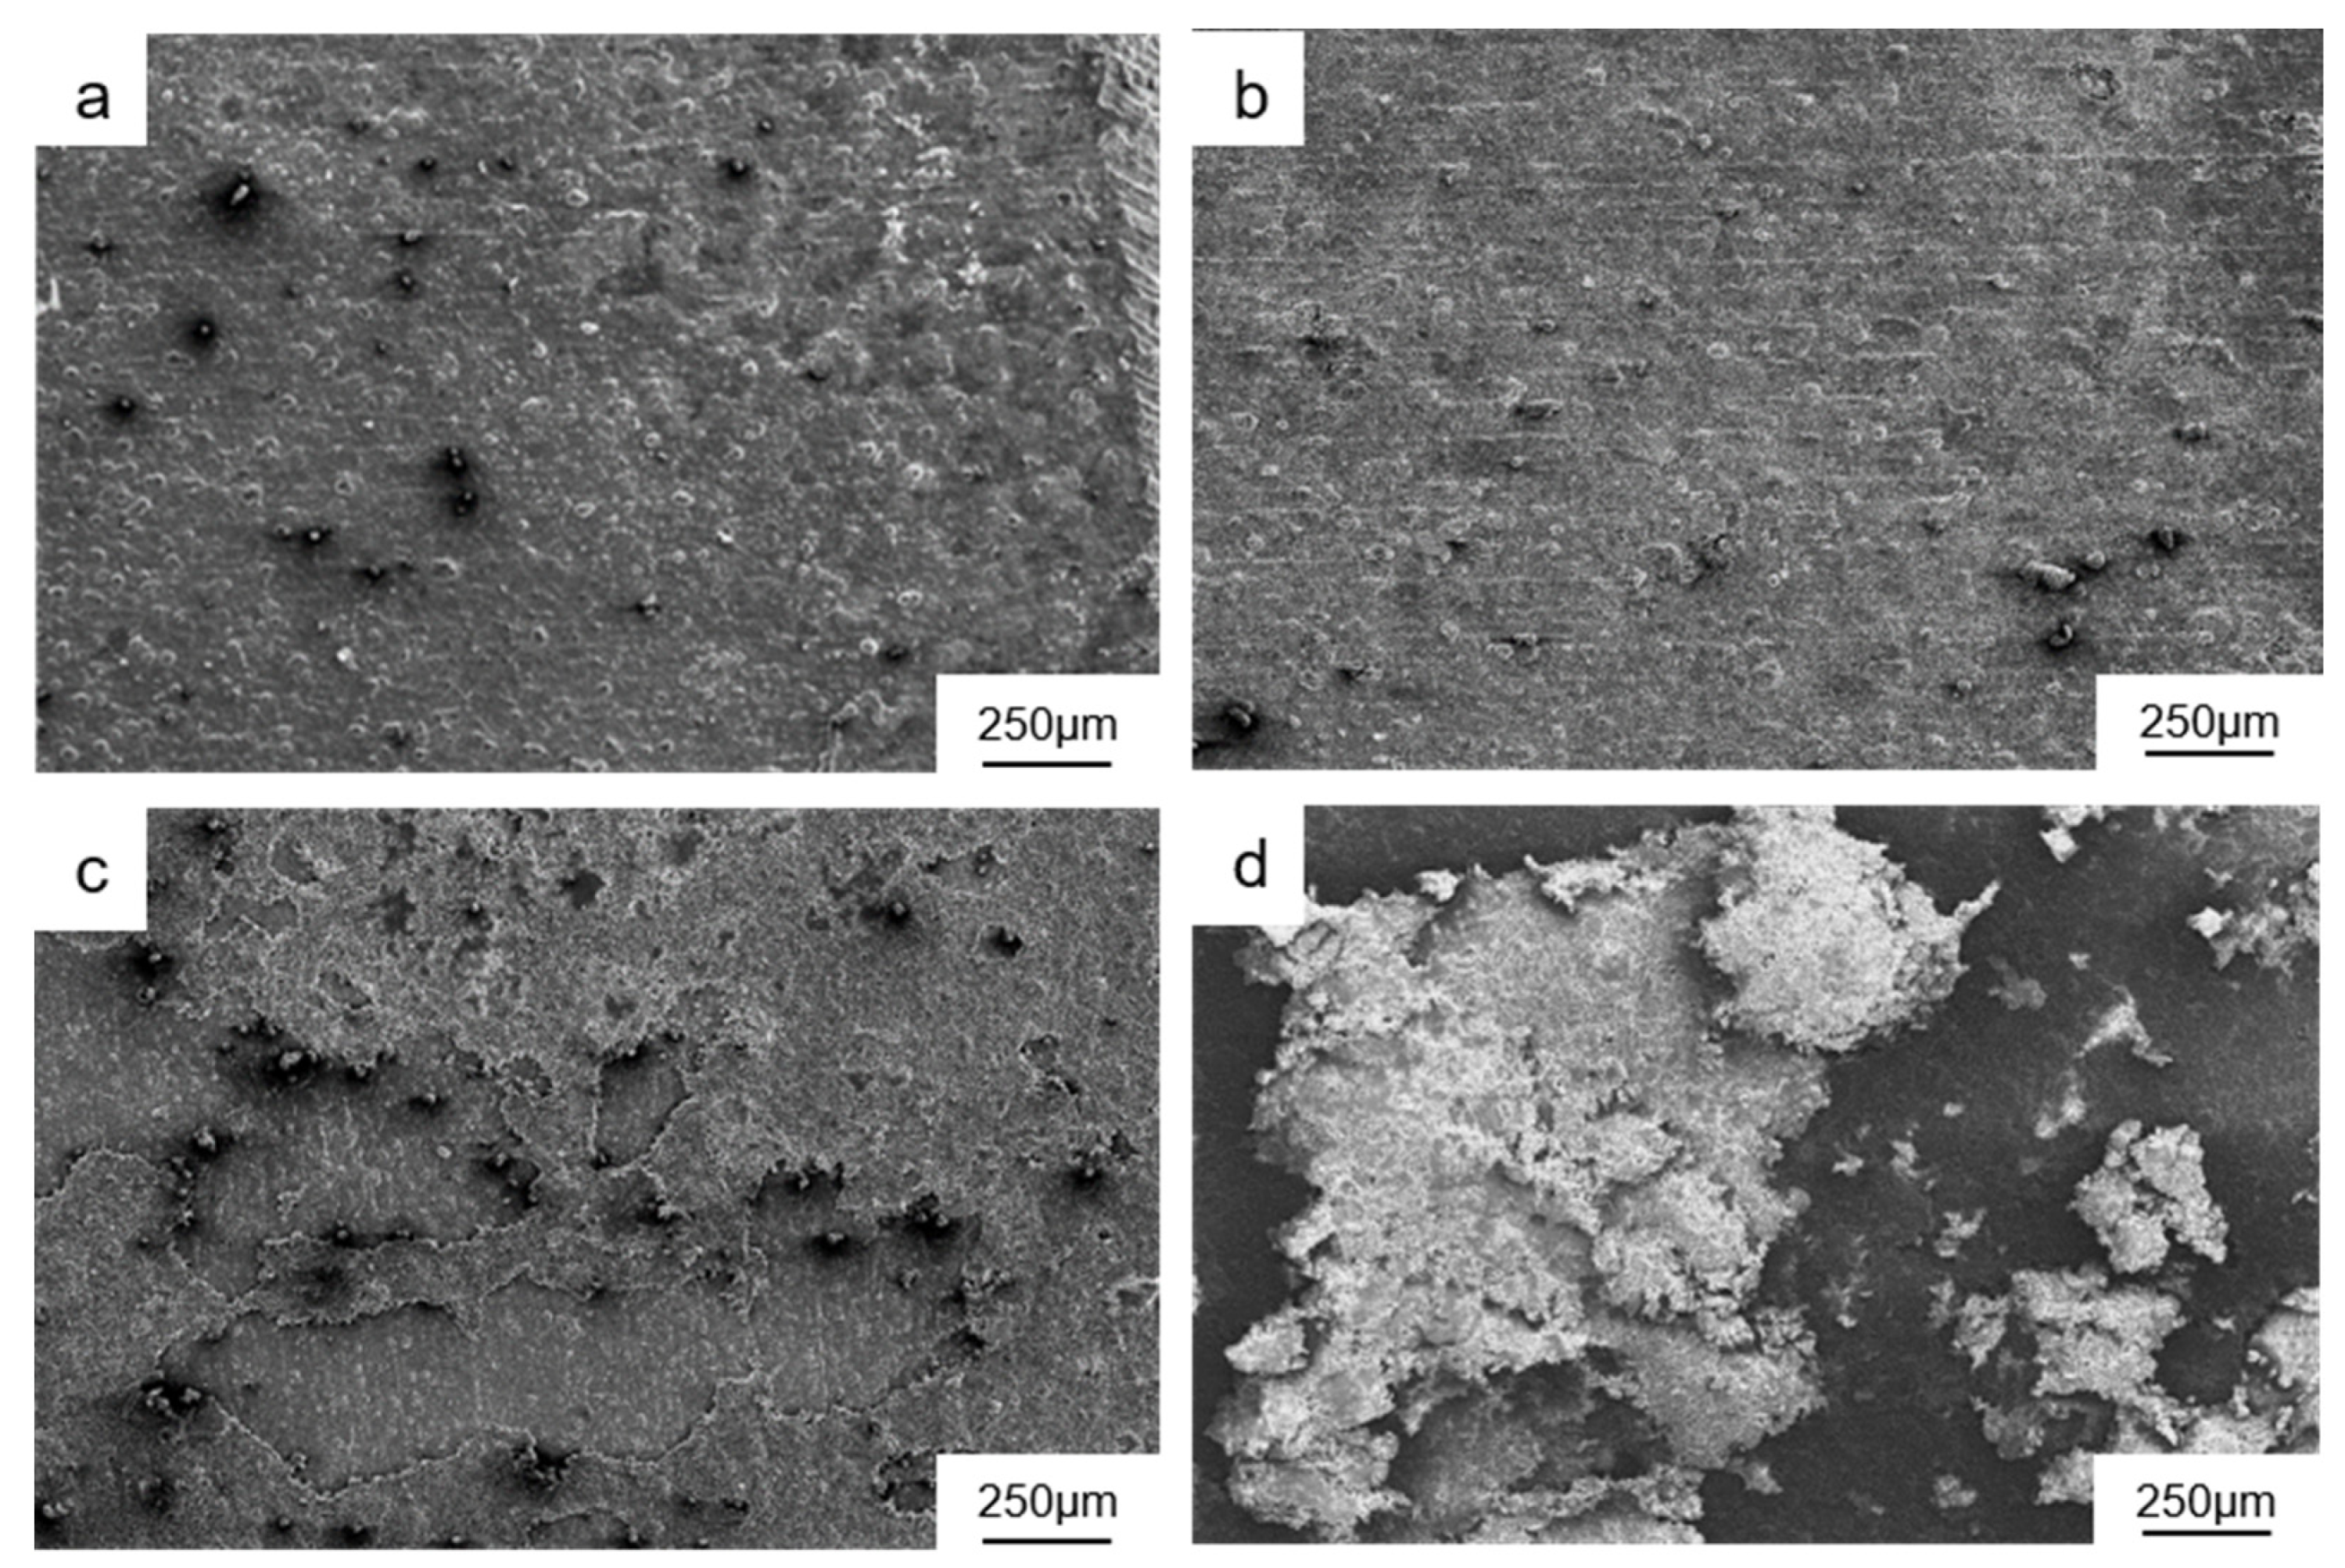
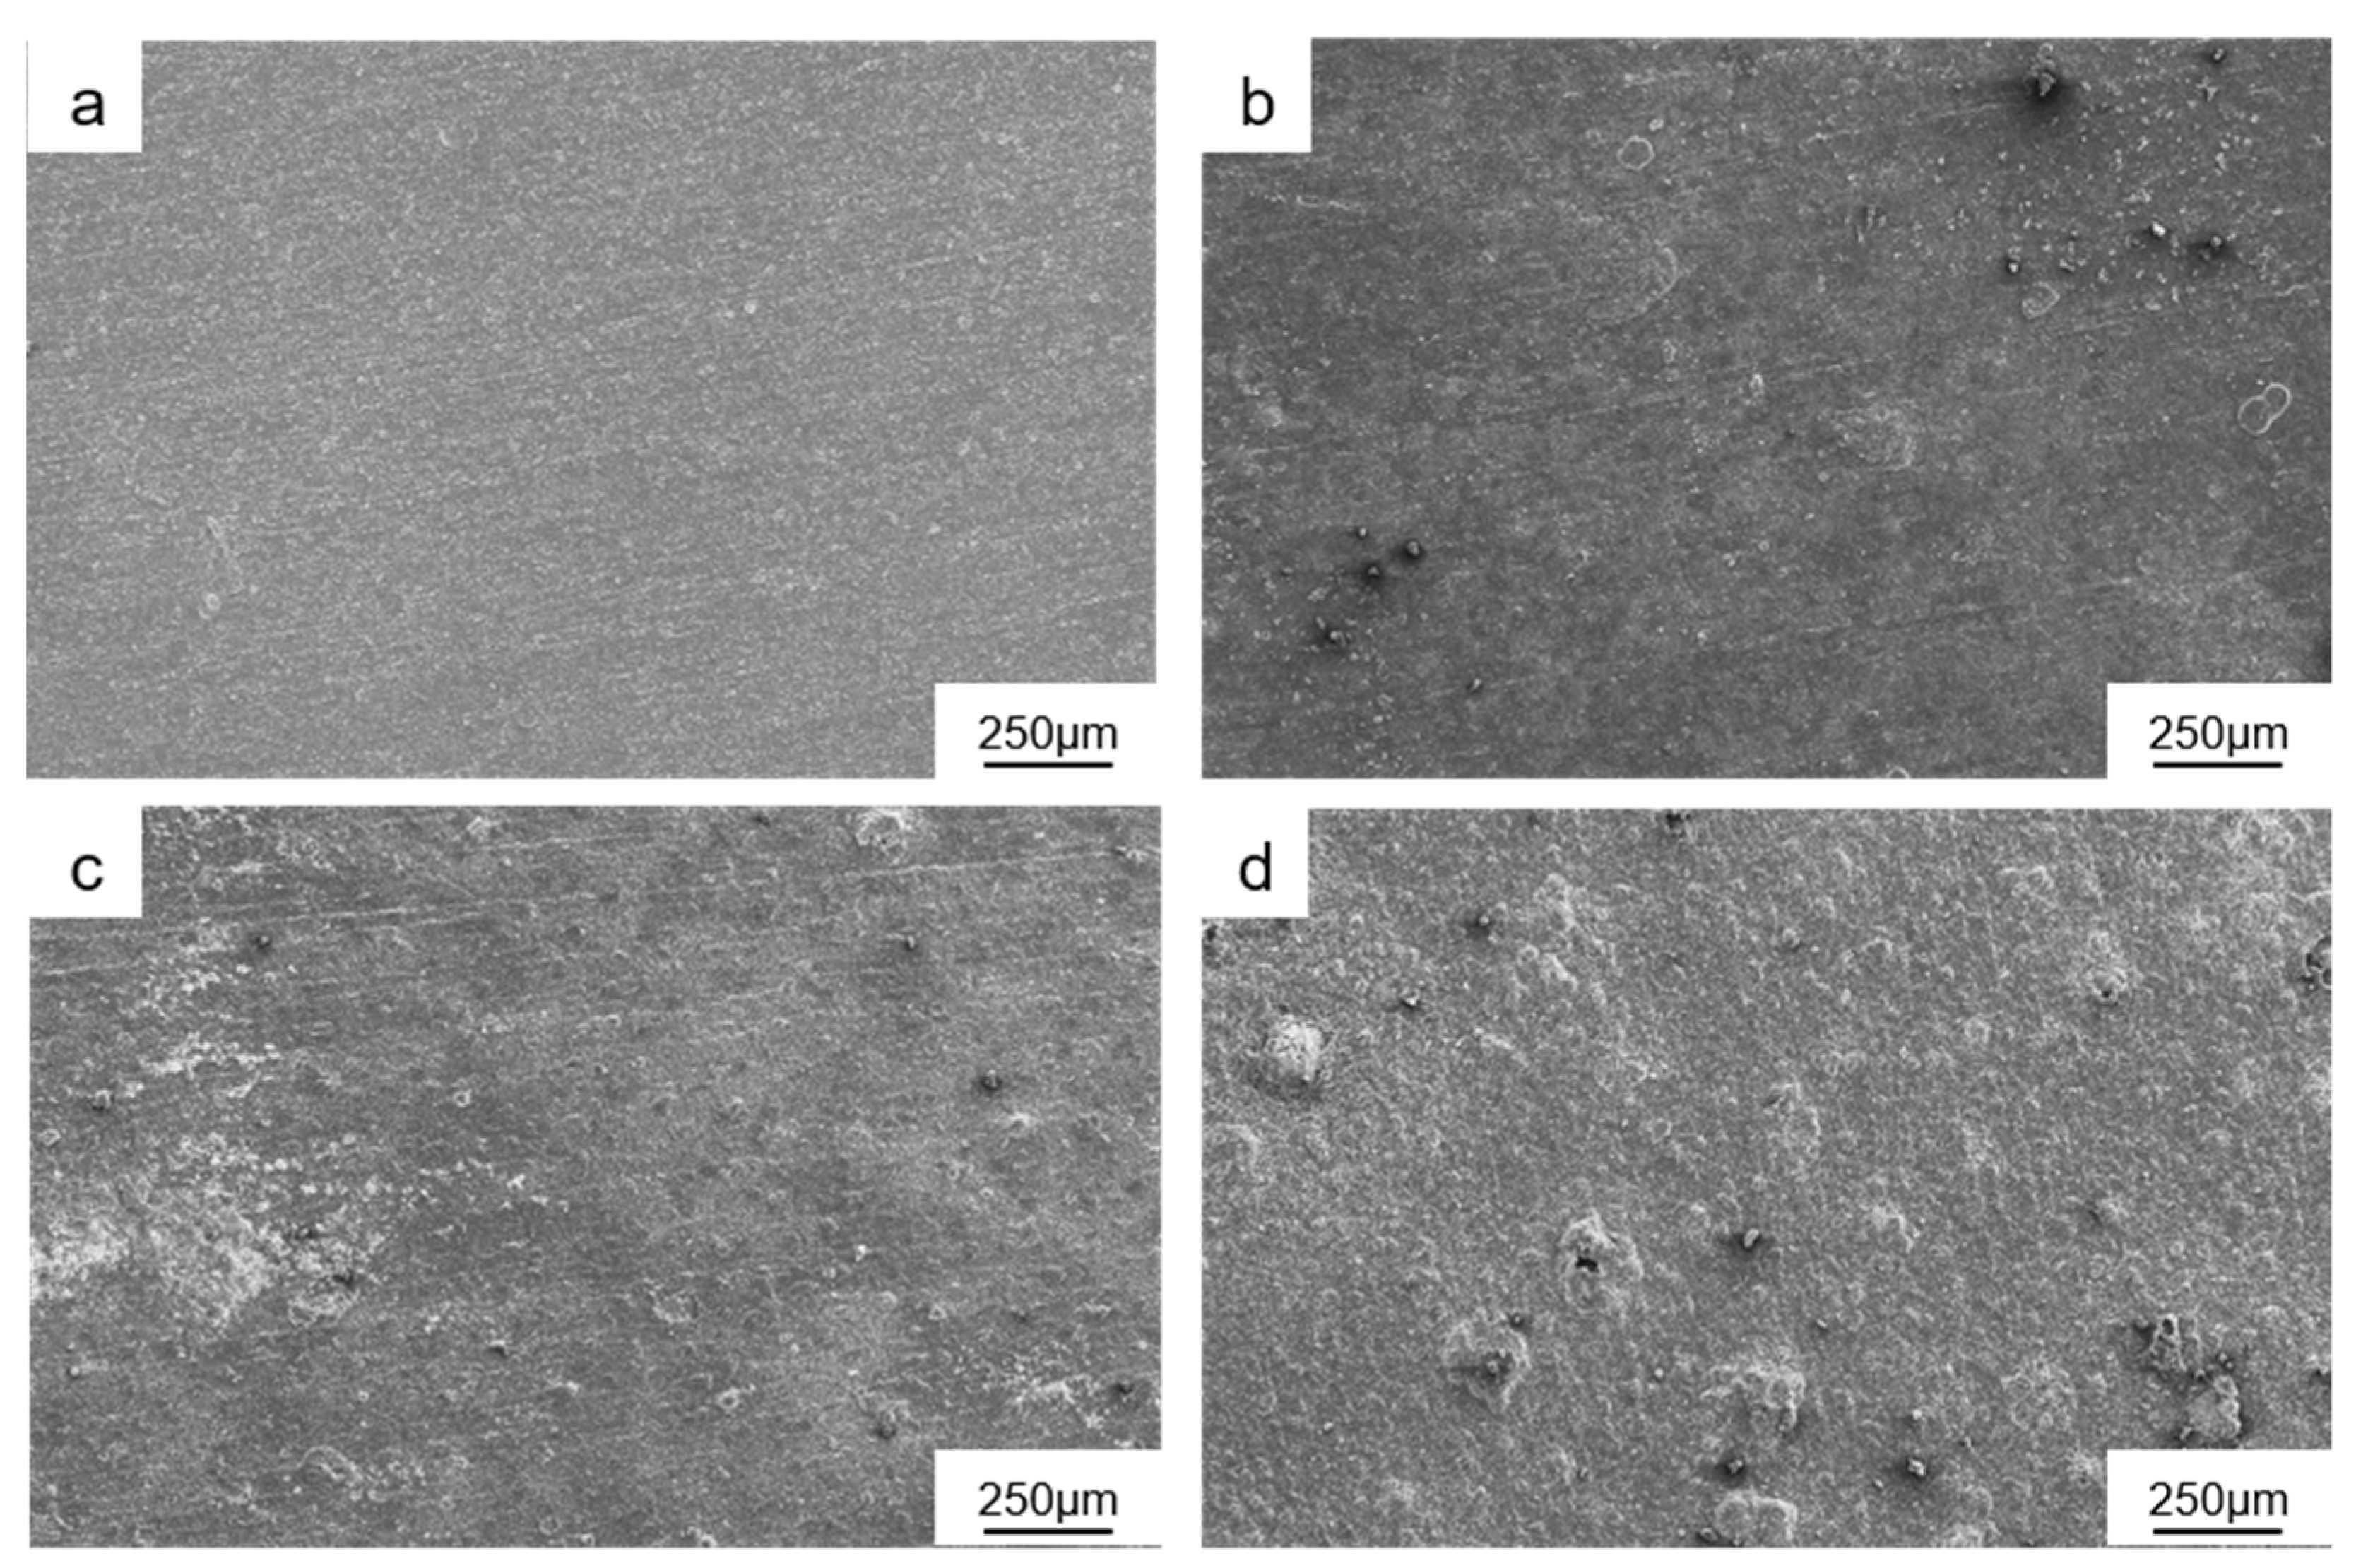
3.4. Effect of Temperature on Oxidation Morphology of Alloy

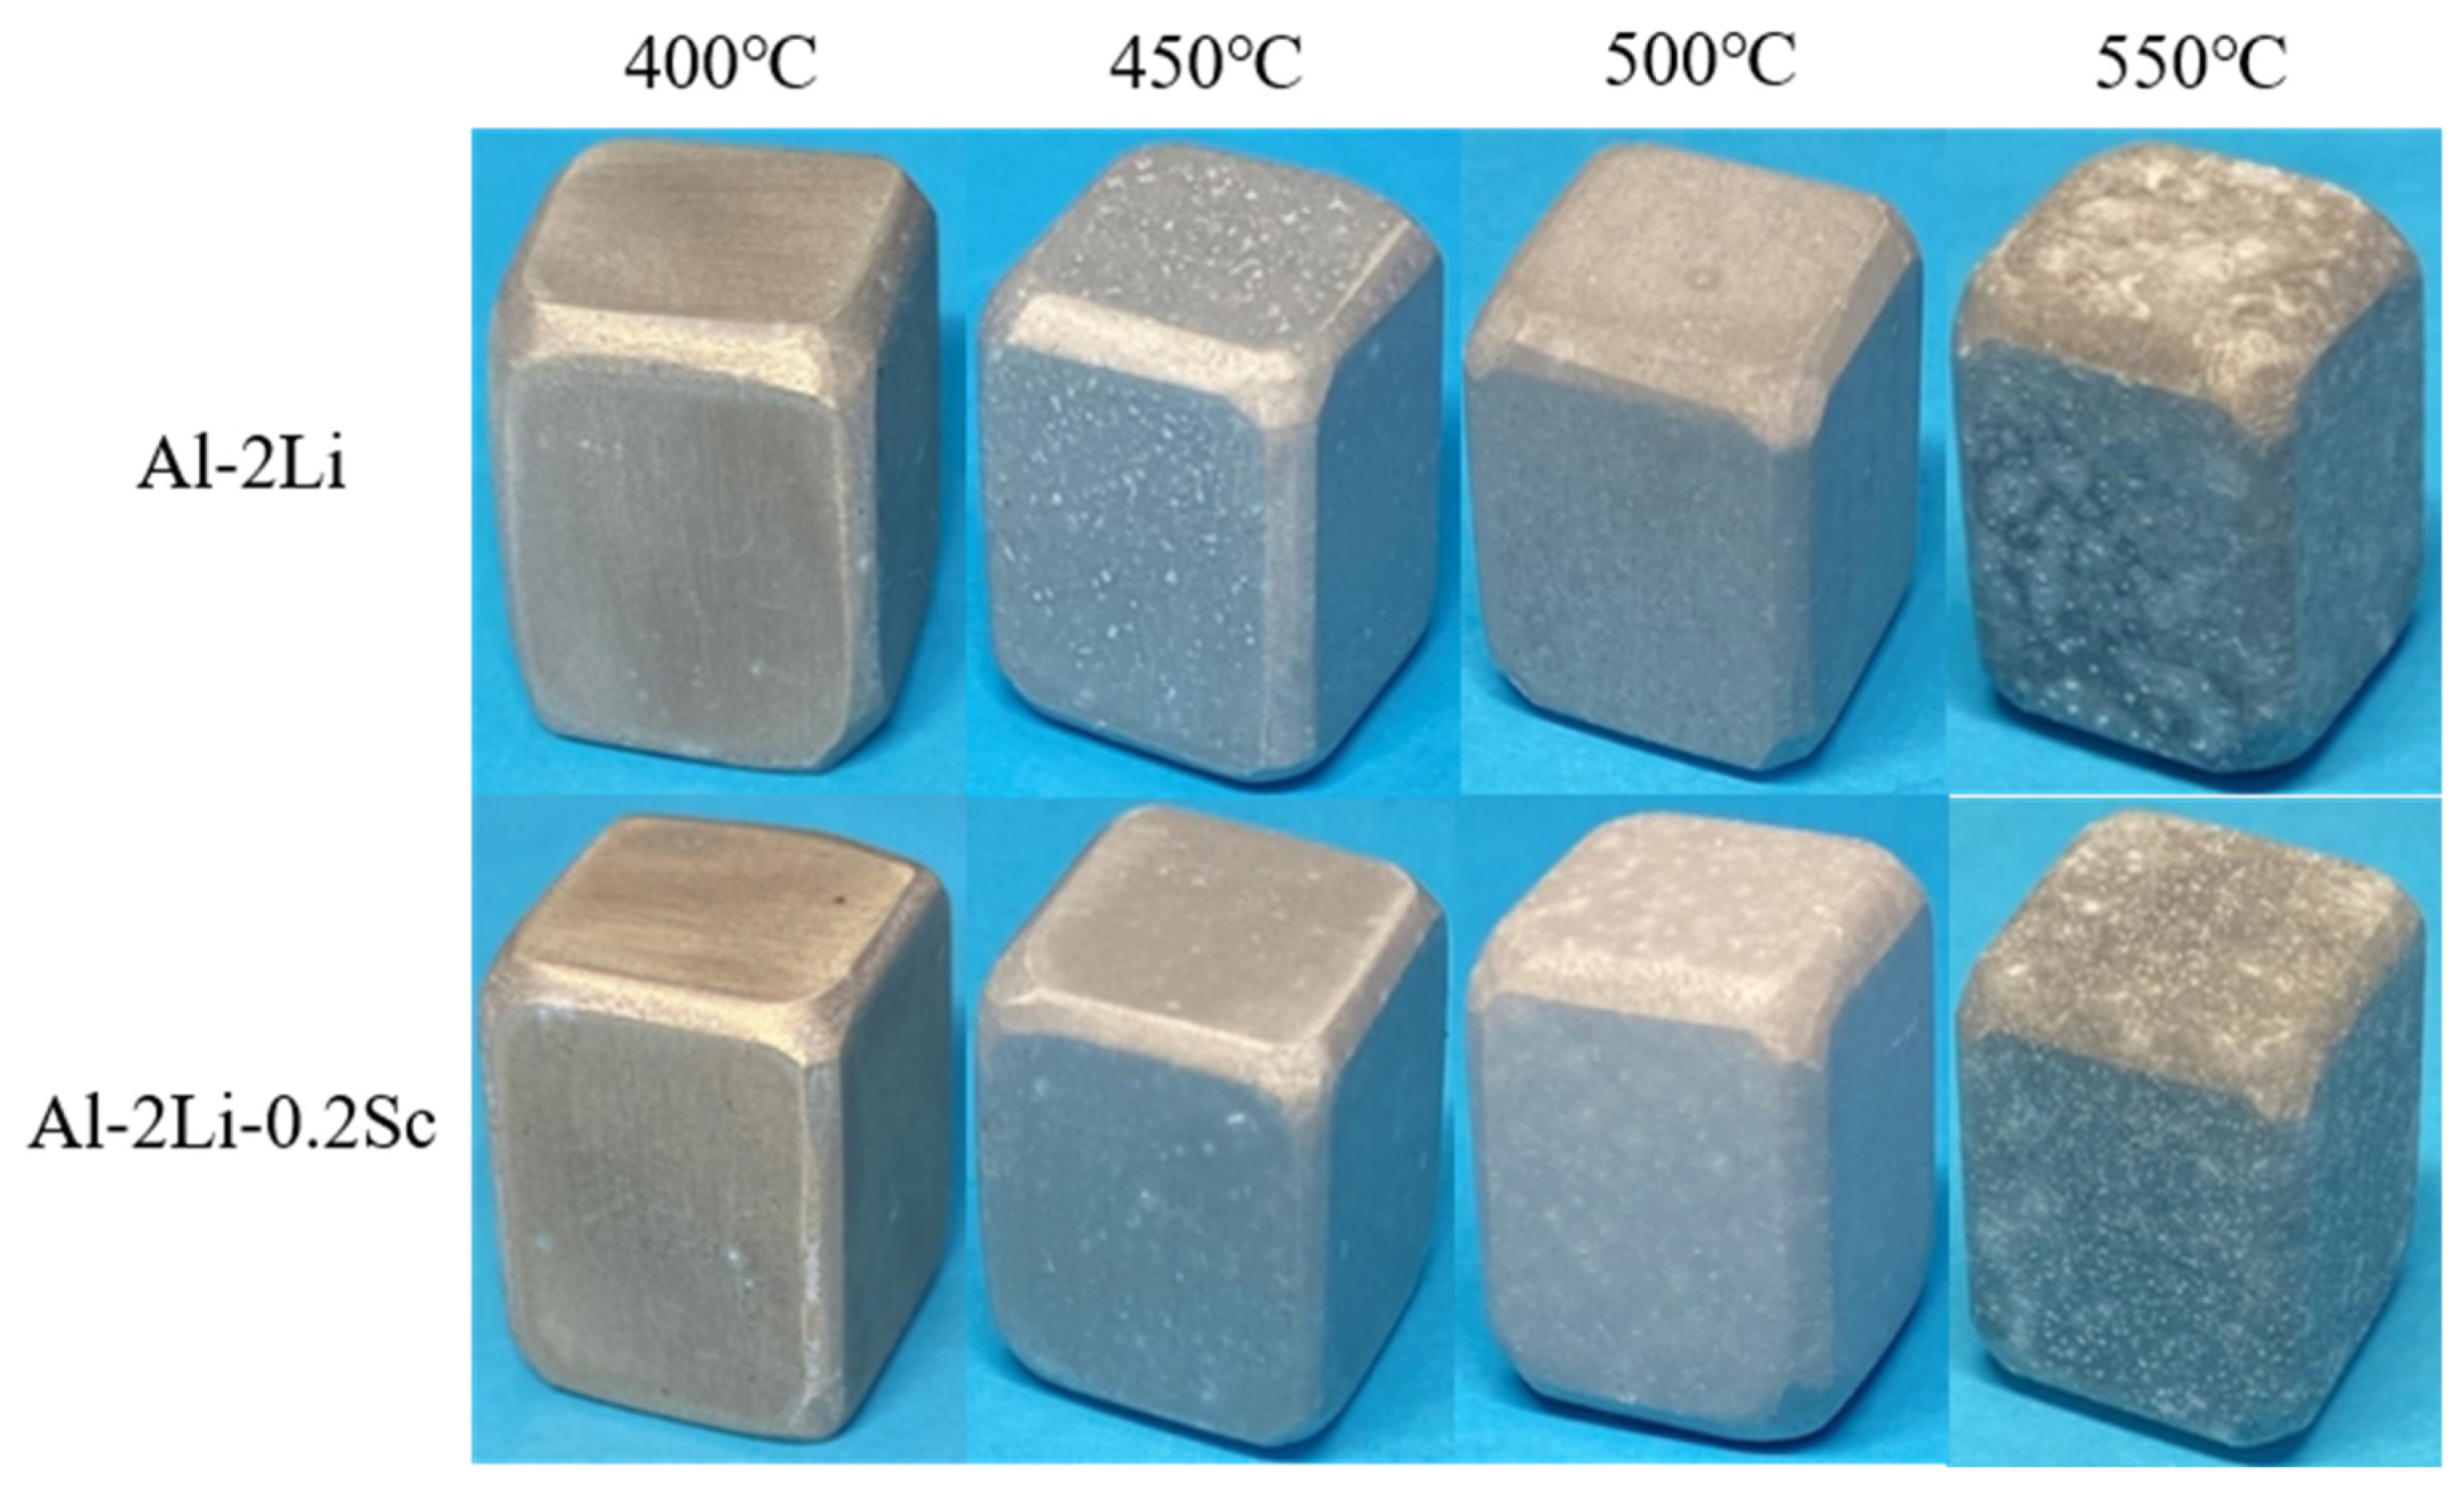
3.4.1. Macroscopic Morphology of Al–Li Alloy Oxidized at Different Temperatures

The samples after processing are oxidized at different temperatures, and the macro morphology after oxidation is shown in Figure 6. The higher the oxidation temperature is, the more gray and white oxidation cells are generated on the surface, and the greater the difference of macroscopic oxidation morphology.
After the addition of a Sc element, the alloy was oxidized at 400 °C. The surface of the alloy was smooth and the whole metal luster was still there, but there were oxidation cells under the macro condition—that is, the oxidation degree was small. With the increase of oxidation temperature, the number of oxidized cells on the surface increased gradually at 450 °C, 500 °C, and 550 °C, showing a milky white convex distribution. The oxide film generated at 450 °C is more than that at 400 °C, and has lost its metallic luster and is gray and white. The oxidation bumps in the oxide film formed at 500 °C are larger than those formed at 450 °C, and the distribution of the oxide cells is more dense. At 550 °C, the oxide film was relatively loose, and the white oxide cells gradually grew and fused, and distributed on the surface in the shape of “spots”.

3.4.2. Effect of Temperature on Surface Morphology of Aluminum–Lithium Alloy after Oxidation

The microstructure of the oxidized Al−2Li alloy is shown in Figure 7. With the increase of oxidation temperature, the coherence and integrity of the oxide film become worse. At 400 °C, the oxide film on the surface is relatively dense and the bulge is small. At 450 °C, the surface bulges are more and more dense, the oxide film is damaged due to lithium vapor leakage, and the oxide cell cracks and appears “tumor” shape. At 500 °C, due to the damage caused by leakage, there is the formation of a “tumor” shaped oxide aggregation, showing as a band. At 550 °C, the cracking causes the alloy matrix to contact with the air, which leads to further oxidation. In addition, the oxidation temperature increases, the reaction is violent, and the generated oxide particles gather, showing in the shape of a cauliflower.
The microstructure of the Al−2Li−Sc alloy after adding 0.2 wt% Sc is shown in Figure 8. After high-temperature oxidation (400 °C, 450 °C, 500 °C, and 550 °C), the surface of the oxide film was improved. After oxidation at 400 °C for 5 h, the surface was relatively complete. After oxidation at 450 °C for 5 h, the planarity of the oxide film was improved. As the oxidation temperature continued to rise, the convex oxidation cell formed at 500 °C had holes. After oxidation at 550 °C for 5 h, the protrusions on the surface were large, showing “tumor” shaped distribution, and the formed “tumor” shaped oxides were large, and there were many holes.
The comparative analysis shows that the addition of Sc improves the surface morphology of the Al−2Li alloy after high-temperature oxidation to a certain extent, and makes the oxide film of the Al-2Li alloy formed under the same conditions more complete. According to the theoretical model proposed by Rapp and Pieraggi [18], due to the addition of a Sc element, the formation of rare earth and its compounds inhibited the diffusion and movement of metal cations and to a certain extent reduced the contact between the Li element and air to form oxides.

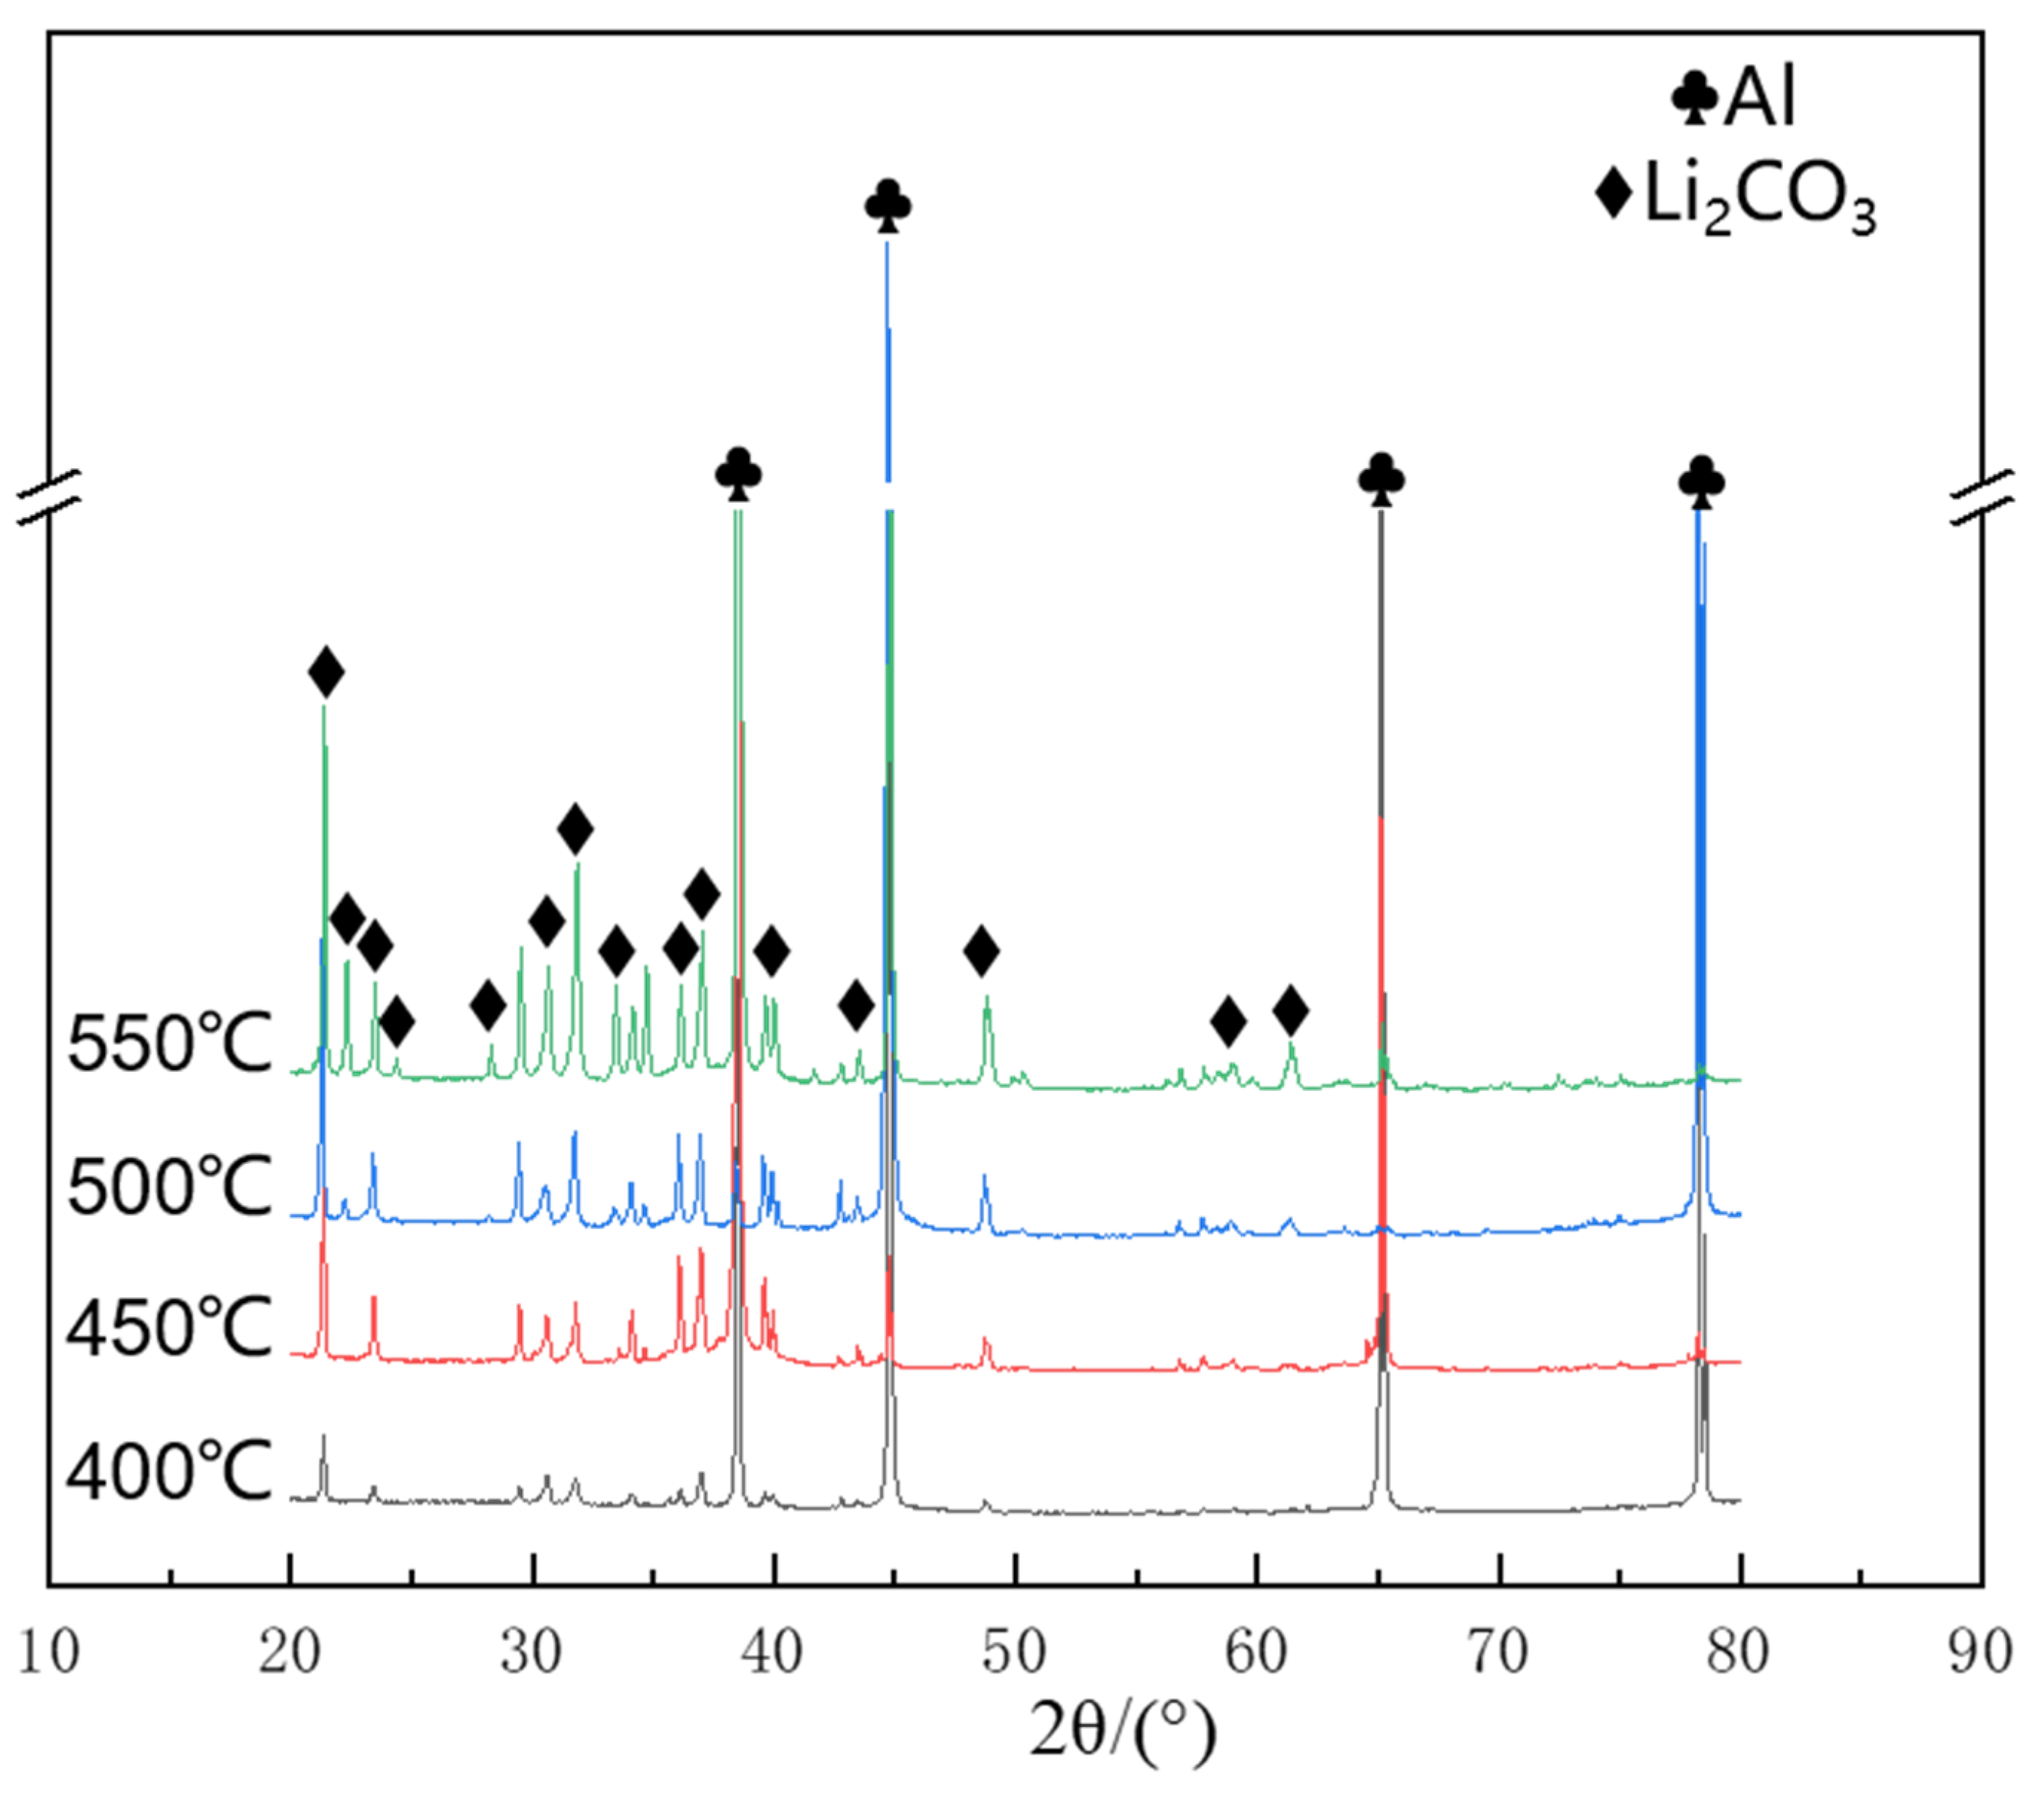
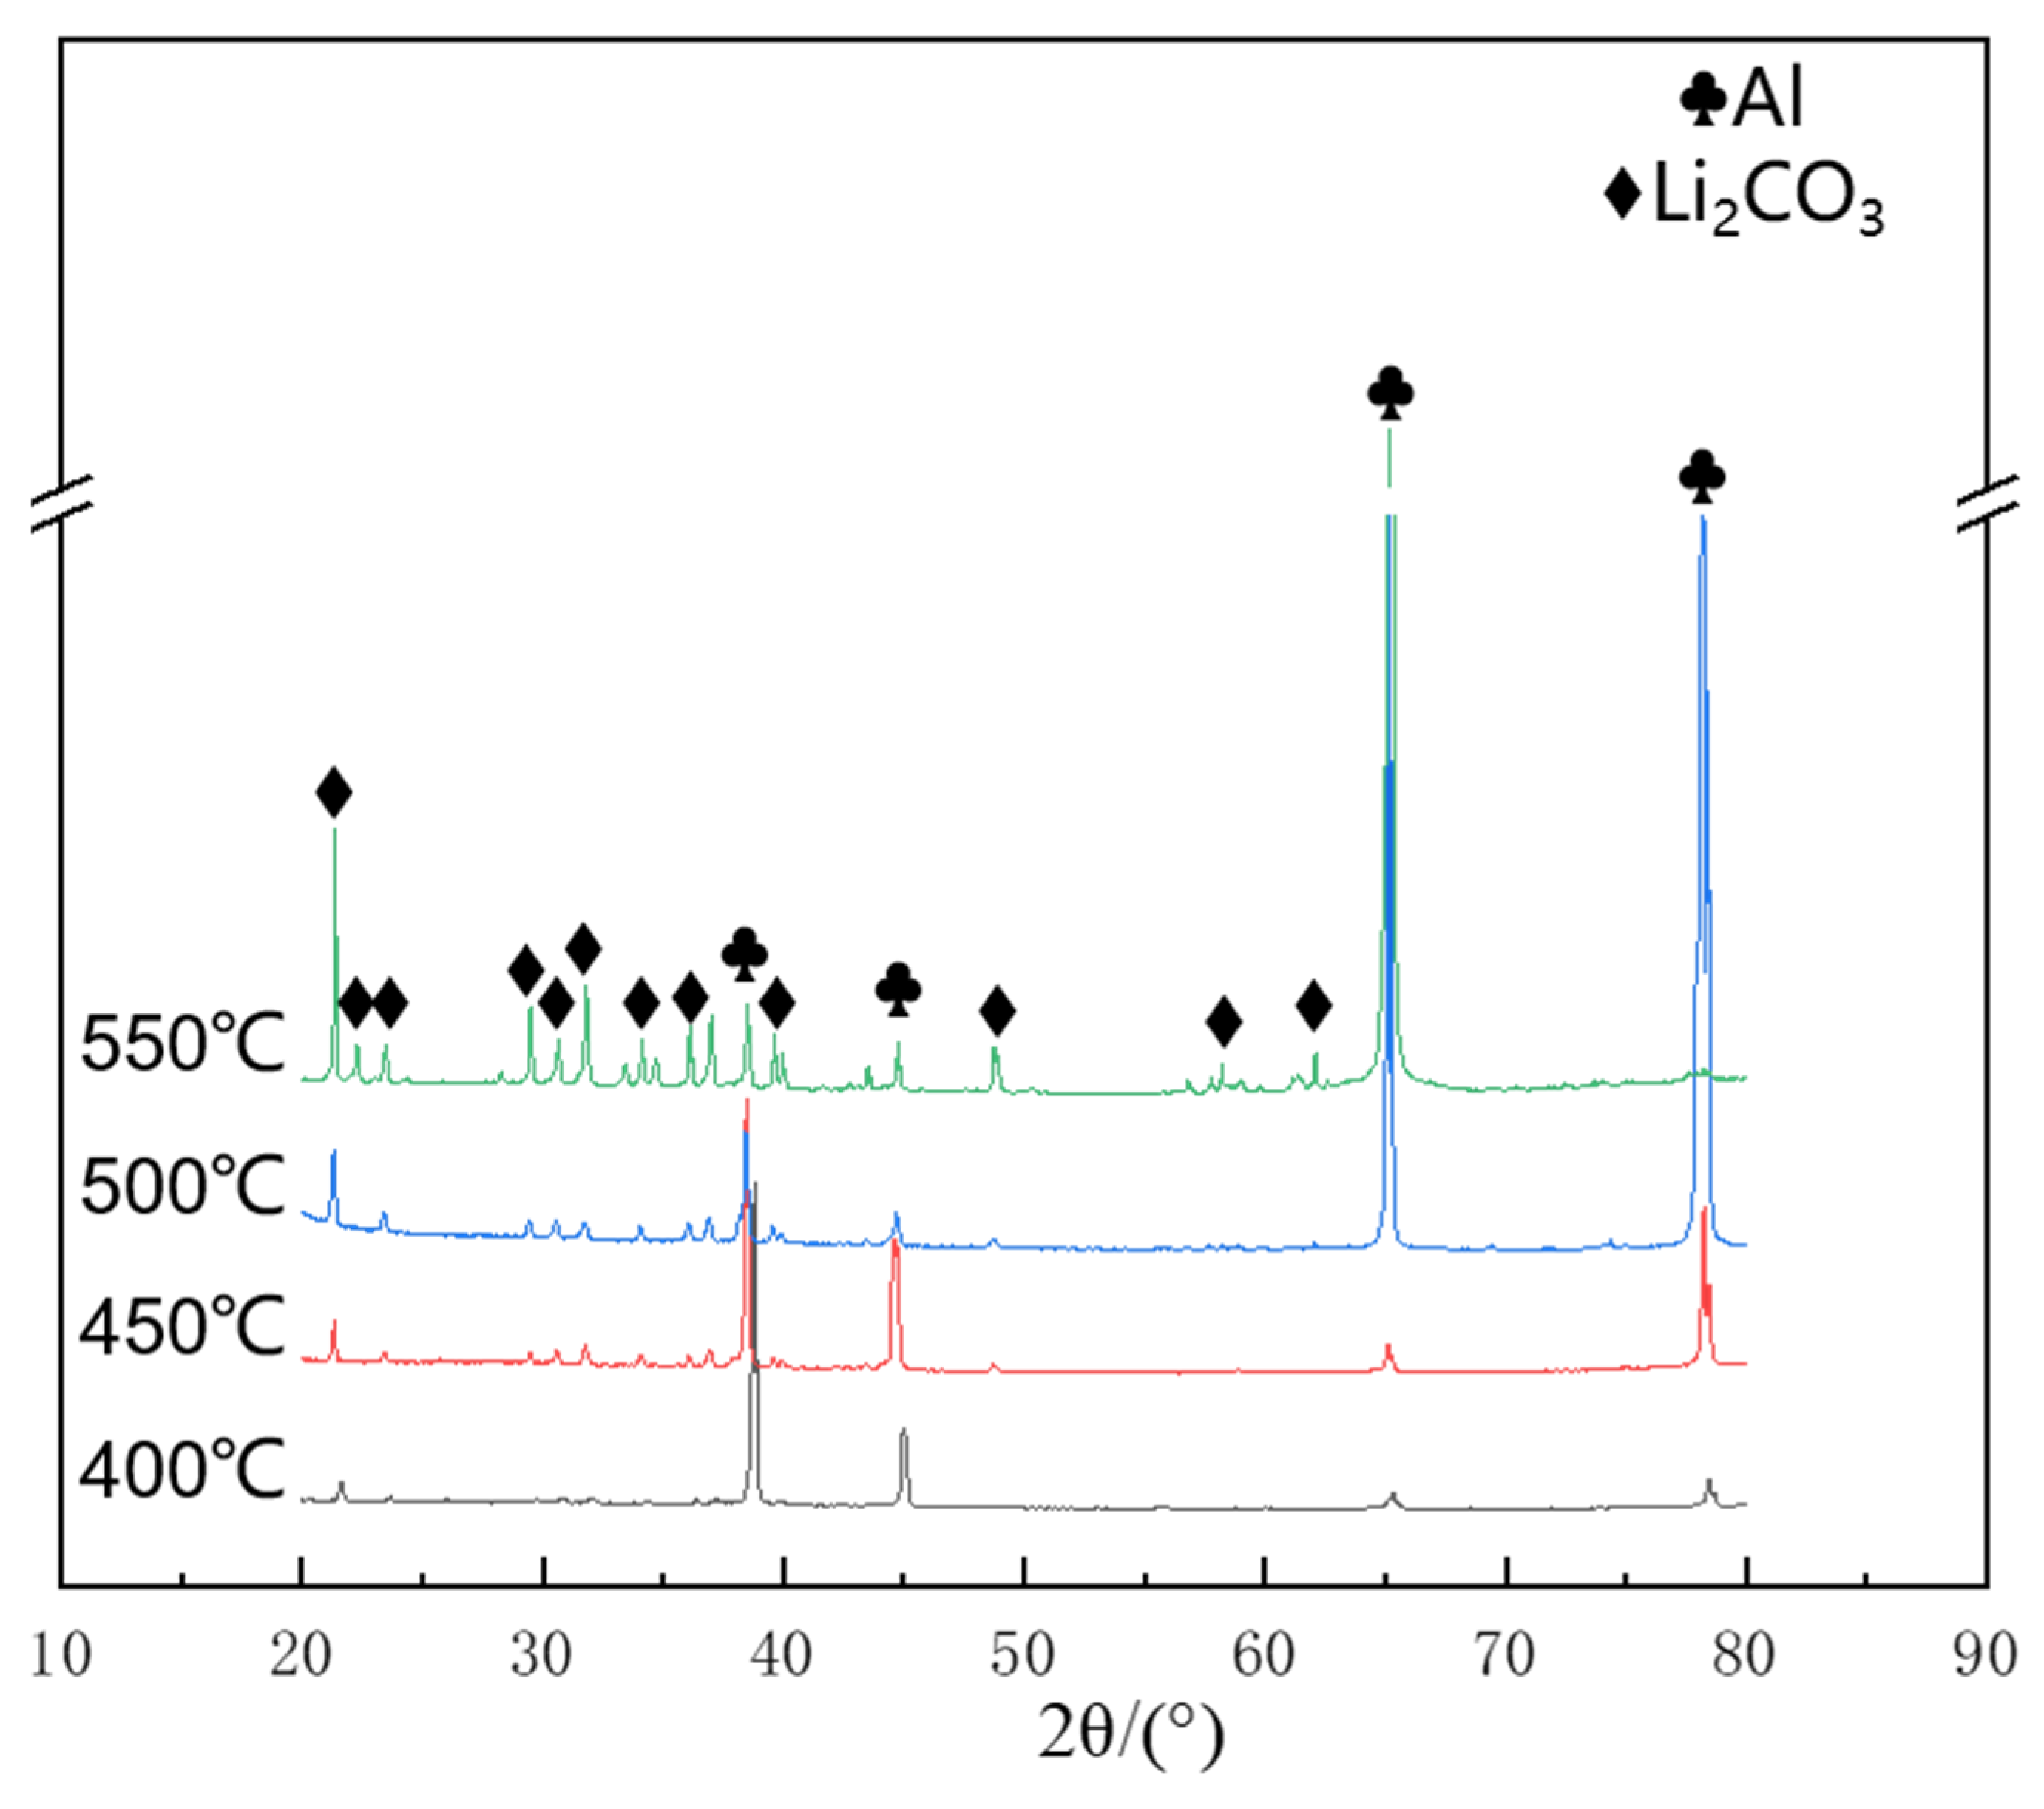
3.5. Phase Analysis of Oxide Film

An XRD phase analysis was carried out on the oxide film. Figure 9 and Figure 10 show the phase analysis of the surface oxide film of Al-Li alloys after oxidation for 5 h at 400 °C, 450 °C, 500 °C, and 550 °C. Al2O3 and Li2O were not detected in the oxide film of the Al-2Li alloy. According to a thermodynamic calculation, Li2O can spontaneously react with CO2 to produce Li2CO3 at room temperature and high temperature. It is speculated that the oxidized Li2O further reacts with the CO2 in the air to produce Li2CO3.
Considering the complexity of gas composition in the environment, it is speculated that CO2 may further react with the formed Li2O to form Li2CO3. The Manual of Thermodynamics of inorganic matter [19] calculation is:
Li 2 O ( s ) + CO 2 ( g ) = Li 2 CO 3 ( s )
Δ G 0 = 192670 ( J / mol ) + 123.80 ( J · mol 1 · K 1 ) T
Among them, 298 K < T < 1868 K. According to the thermodynamic calculation, ΔG is negative under the experimental temperature condition. Theoretically, the generated Li2O can spontaneously react with CO2 to generate Li2CO3, so it can be speculated that the generated Li2CO3 is generated by the reaction of Li2O and CO2.
The XRD phase analysis results of the Al-2Li-0.2Sc alloy with a Sc element show that the Li2CO3 peak formed by oxidation at 400 °C and 450 °C is relatively weak, while the Li2CO3 peak formed by oxidation at 500 °C and 550 °C is gradually enhanced—that is, the Li2CO3 produced increases. However, no Sc-containing phase was detected in the oxide film of the Al-2Li-0.2Sc alloy with a Sc element added, because Li’s activity was higher than that of oxygen, and the resulting oxide film covered the surface of the alloy.

4. Conclusions

(1)
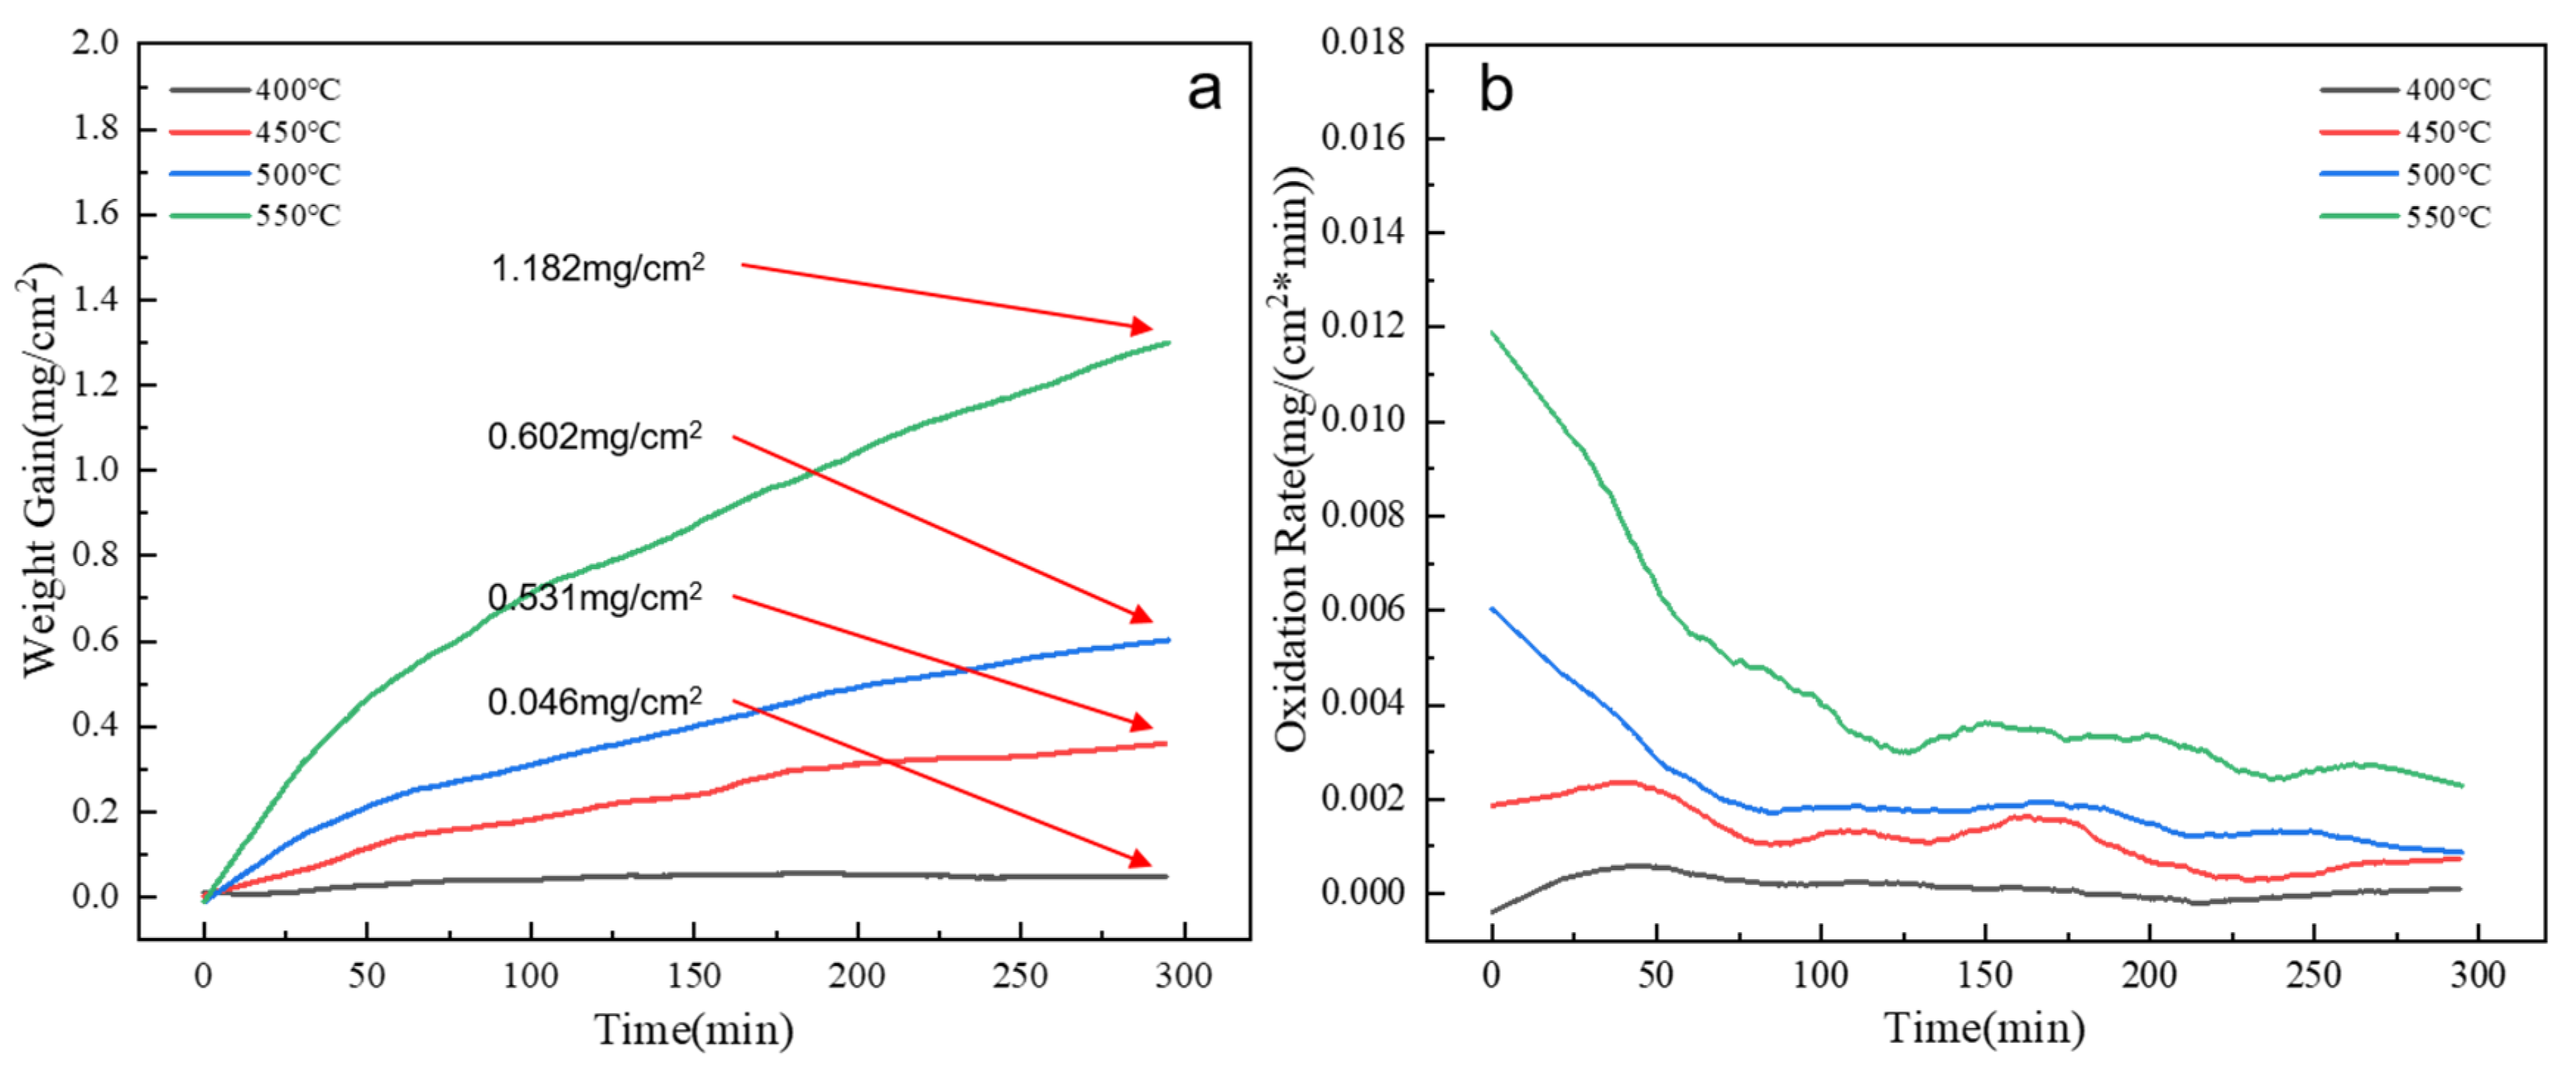
At different temperatures, the oxidation weight gain in the early stage of oxidation was significant, and the oxidation rate gradually decreased and tended to be stable with the extension of the oxidation time. The oxidation weight gain after oxidation of Al-2Li alloys with the addition of the element Sc is reduced to 0.046 mg/cm2, 0.531 mg/cm2, 0.602 mg/cm2, and 1.182 mg/cm2 for 5 h at 400 °C, 450 °C, 500 °C, and 550 °C, and the fitted response indices were reduced to 0.37, 0.66, 0.63 and 0.60, respectively. In addition, the oxidation weight gain rate of the alloy after the addition of Sc slowed down, which improved the high-temperature oxidation resistance of the alloy.
(2)
The test results show that the oxidation product generated by oxidation is Li2CO3 and, with the increase of oxidation temperature, more Li2CO3 is generated. In the aluminum–lithium alloy after Sc alloying, less Li2CO3 is generated in the oxide film after oxidation, and the oxide film is more complete and compact.
(3)
There is no rare earth oxide formation in the rare earth alloyed oxide film, but the high-temperature oxidation resistance of an Al-Li alloy is improved after Sc alloying. The oxidation reaction index is reduced, which is consistent, and it is verified that the addition of rare earth elements can inhibit the movement and diffusion of metal cations in the high-temperature oxidation process to a certain extent.

Author Contributions

Conceptualization, Q.L. and B.Z.; methodology, Q.L. and X.Z.; software, B.Z. and X.Z.; validation, B.Z., X.Z., L.R. and X.H.; formal analysis, B.Z. and D.L.; investigation, B.Z. and D.L.; resources, B.Z. and L.B.; data curation, L.B.; writing—original draft preparation, B.Z. and Q.L.; writing—review and editing, B.Z. and Q.L.; visualization, B.Z. and L.R.; supervision, B.Z. and X.Z.; project administration, B.Z. and Q.L.; funding acquisition, B.Z. and L.R. All authors have read and agreed to the published version of the manuscript.

Funding

This research was financially supported by National Natural Science Foundation of China (Grant No. 52274377), and National Natural Science Foundation of China (Grant No. 51901037), and the 111 Project 2.0 of China, (No. BP0719037).

Data Availability Statement

Data available on request due to restrictions on privacy or ethical.

Conflicts of Interest

The authors declare no conflict of interest.

References

  1. Lei, Z.; Bi, S.; Zhang, X.; Li, B.; Xia, P. Microstructure and Mechanical Properties of Double-Sided Laser Swing Welding of 2195 Al-Li Alloy T-joints. Chin. J. Lasers 2022, 49, 30–39. [Google Scholar]
  2. Abd El-Aty, A.; Xu, Y.; Guo, X.; Zhang, S.H.; Ma, Y.; Chen, D. Strengthening mechanisms, deformation behavior, and anisotropic mechanical properties of Al-Li alloys: A review. J. Adv. Res. 2018, 10, 49–67. [Google Scholar] [CrossRef] [PubMed]
  3. Liu, J.L.; Chen, Z.H.; Huang, H.Y.; Xie, J.X. Microstructure and superelasticity control by rolling and heat treatment in columnar-grained Cu-Al-Mn shape memory alloy. Mater. Sci. Eng. A 2017, 696, 315–322. [Google Scholar] [CrossRef]
  4. Rioja, R.J.; Liu, J. The evolution of Al-Li base products for aerospace and space applications. Metall. Mater. Trans. A 2012, 43, 3325–3337. [Google Scholar] [CrossRef]
  5. Xiao, R.S.; Zhang, X.Y. Problems and issues in laser beam welding of aluminum-lithium alloys. J. Manuf. Process. 2014, 16, 166–175. [Google Scholar] [CrossRef]
  6. Li, J.; Chen, Y.; Ma, Y.; Zhang, X. Basic Research and Application Technology Development of Al-Li Alloy in China. Aerosp. Mater. Technol. 2021, 51, 37–47. [Google Scholar]
  7. Decreus, B.; Deschamps, A.; De Geuser, F.; Donnadieu, P.; Sigli, C.; Weyland, M. The influence of Cu/Li ratio on precipitation in Al-Cu-Li-X alloys. Acta Mater. 2013, 61, 2207–2218. [Google Scholar] [CrossRef]
  8. Dursun, T.; Soutis, C. Recent developments in advanced aircraft aluminum alloys. Mater. Des. 2014, 56, 862–871. [Google Scholar] [CrossRef]
  9. Mizutani, U.; Inukai, M.; Sato, H.; Zijlstra, E.S. Physical Metallurgy 2-Electron Theory of Complex Metallic Alloys; Elsevier: Amsterdam, The Netherlands, 2014. [Google Scholar]
  10. Fazeli, F.; Poole, W.J.; Sinclair, C.W. Modeling the effect of Al3Sc precipitates on the yield stress and work hardening of an Al–Mg–Sc alloy. Acta Mater. 2008, 56, 1909–1918. [Google Scholar] [CrossRef]
  11. Bohlen, J.; Yi, S.; Letzig, D.; Kainer, K.U. Effect of rare earth elements on the microstructure and texture development in magnesium–manganese alloys during extrusion. Mater. Sci. Eng. 2010, A527, 7092–7098. [Google Scholar] [CrossRef]
  12. Røyset, J.; Ryum, N. Scandium in aluminum alloys. Metall. Rev. 2005, 50, 19–44. [Google Scholar] [CrossRef]
  13. Booth-Morrison, C.; Dunand, D.C.; Seidman, D.N. Coarsening resistance at 400 C of precipitation-strengthened Al–Zr–Sc–Er alloys. Acta Mater. 2011, 181, 7029–7042. [Google Scholar] [CrossRef]
  14. Liu, X.; Bai, J.; Zhang, H.; Nan, Y.; He, H. Research Status and Trend of Sc Influence on Microstructure and Properties of Aluminum Alloy. Foundry Technol. 2021, 42, 48–52. [Google Scholar]
  15. Yang, Z.; Lu, J.; Zhao, X.; Yan, J.; Yin, H.; Dang, Y.; Gu, Y. Effect of Rare Earth Elements on High Temperature Oxidation of Metals. J. Chin. Soc. Rare Earths 2014, 32, 641–649. [Google Scholar]
  16. Carl, W. Reaktionstypen bei der Oxydation von Legierungen. Z. Für Elektrochem. 1959, 63, 772–782. [Google Scholar]
  17. Liu, Y.; Zhu, J.; Zhao, X.; Zhou, Y. Oxidation Behaviors of FeCrNiAl High Entropy Alloy and Its Microstructure Evolution. Rare Met. Mater. Eng. 2018, 47, 2743–2748. [Google Scholar]
  18. Hirth, J.P.; Pieraggi, B.; Rapp, R.A. The role of interface dislocations and ledges as sources/sinks for point defects in scaling reactions. Acta Metall. Mater. 1995, 43, 1065. [Google Scholar] [CrossRef]
  19. Knacke, O.; Kubaschewski, O.; Hesselmann, K. Thermochemical Properties of Inorganic Substances, 2nd ed.; Springer: Berlin/Heidelberg, Germany, 1991. [Google Scholar]
Figure 1. Schematic diagram of high-temperature oxidation unit.
Crystals 13 00022 g001
Figure 2. (a) The weight gain curve of Al–2Li alloy exposed for 24 h; (b) The weight gain rate curve of Al–2Li alloy exposed for 24 h.
Crystals 13 00022 g002
Figure 3. (a) The weight gain curve of Al–2Li alloy exposed for 5 h; (b) The weight gain rate curve of Al–2Li alloy exposed for 5 h.
Crystals 13 00022 g003
Figure 4. (a) The weight gain curve of Al–2Li–0.2Sc alloy exposed for 5 h; (b) The weight gain rate curve of Al–2Li–0.2Sc alloy exposed for 5 h.
Crystals 13 00022 g004
Figure 5. The curve fitting of oxidation weight gain after oxidation of alloy (a) Al−2Li, (b) Al−2Li−0.2Sc.
Crystals 13 00022 g005
Figure 6. Macroscopic surface morphology of the alloy after oxidation.
Crystals 13 00022 g006
Figure 7. Surface morphology of Al-2Li alloy after 5 h oxidation: (a) 400 °C, (b) 450 °C, (c) 500 °C, (d) 550 °C.
Crystals 13 00022 g007
Figure 8. Surface morphology of Al-2Li-0.2Sc alloy after 5 h oxidation (a) 400 °C, (b) 450 °C, (c) 500 °C, (d) 550 °C.
Crystals 13 00022 g008
Figure 9. XRD pattern of Al-2Li alloy oxidized at different temperature for 5 h.
Crystals 13 00022 g009
Figure 10. XRD pattern of Al-2Li-0.2Sc alloy oxidized at different temperature for 5 h.
Crystals 13 00022 g010
Table 1. Chemical compositions of the prepared Al alloys (mass fraction).
Li (wt%)Sc (wt%)Al
Al-2Li1.74-Bal
Al-2Li-0.2Sc1.750.20Bal
Table 2. The oxidation reactivity indexes of Al–2Li and Al–2Li–0.2Sc alloys at different exposure temperatures.
400 °C450 °C500 °C550 °C
Al-2Li1.760.850.640.62
Al-2Li-0.2Sc0.370.660.630.60
Disclaimer/Publisher’s Note: The statements, opinions and data contained in all publications are solely those of the individual author(s) and contributor(s) and not of MDPI and/or the editor(s). MDPI and/or the editor(s) disclaim responsibility for any injury to people or property resulting from any ideas, methods, instructions or products referred to in the content.

