

Structural Characterization of Low-Sr-Doped Hydroxyapatite Obtained by Solid-State Synthesis
 ,
,  , , , ,
  and
and
Abstract
:1. Introduction
2. Experimental
3. Results and Discussion
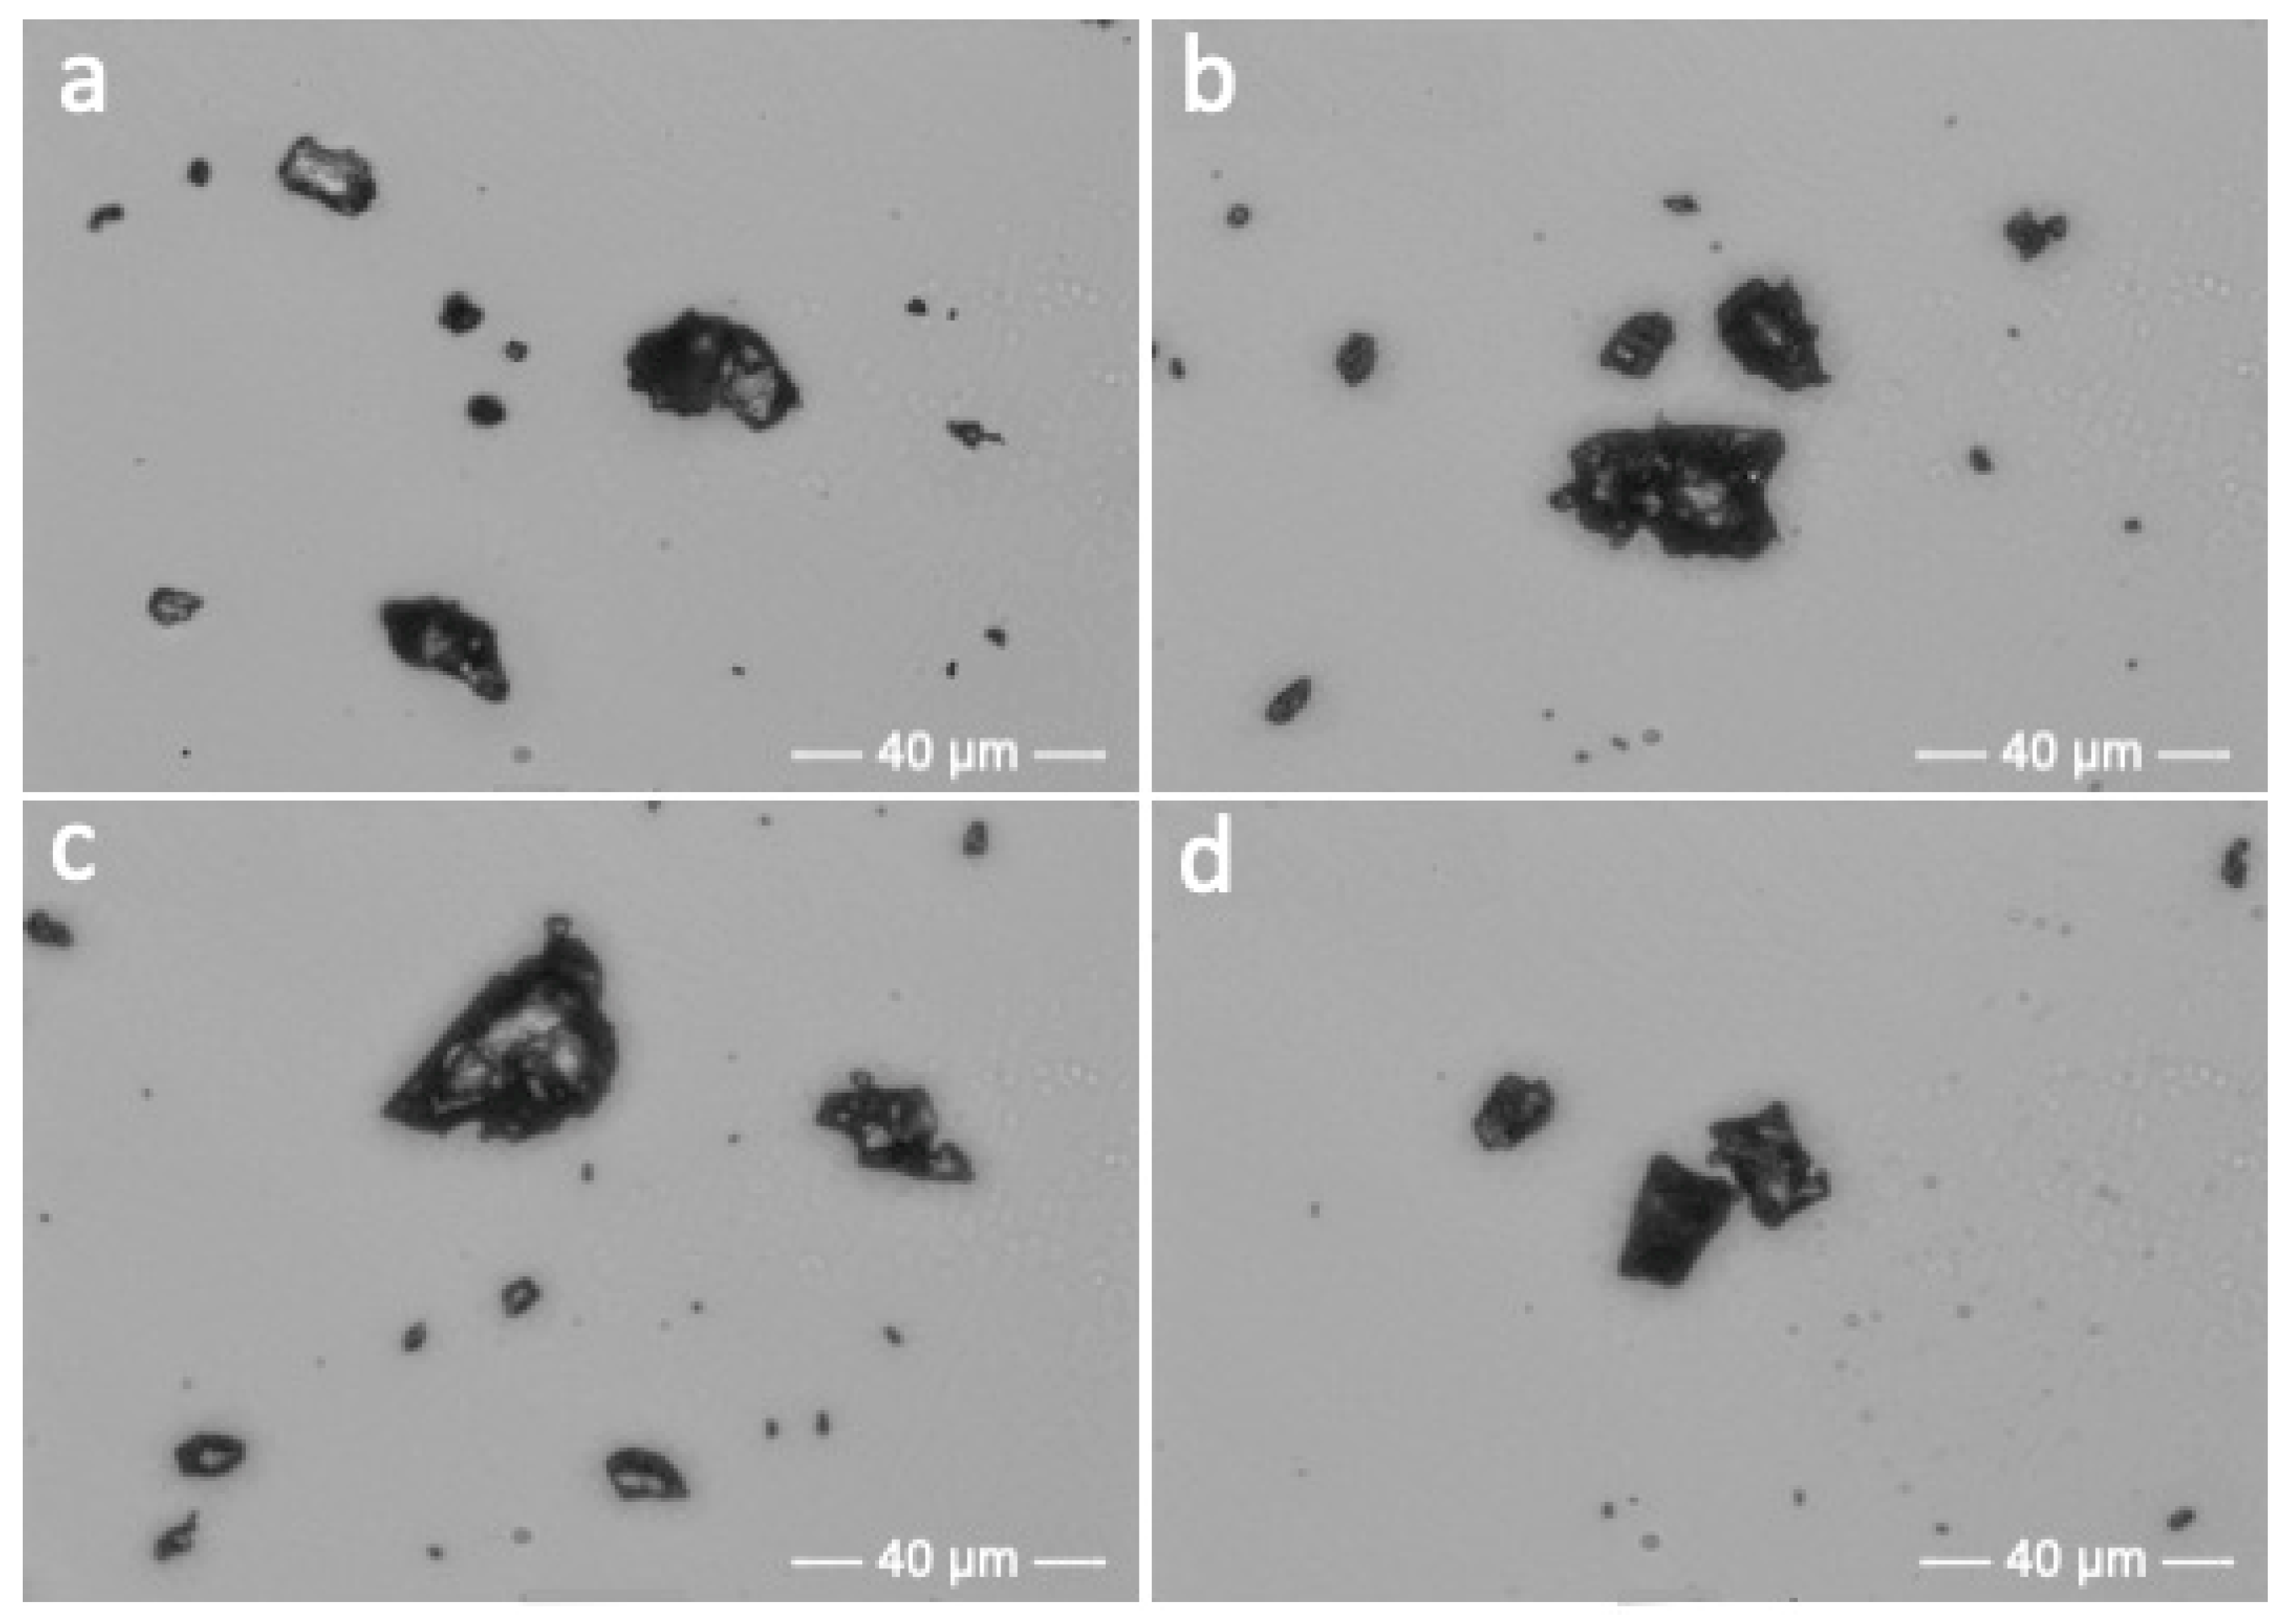
3.1. Morphological Investigation
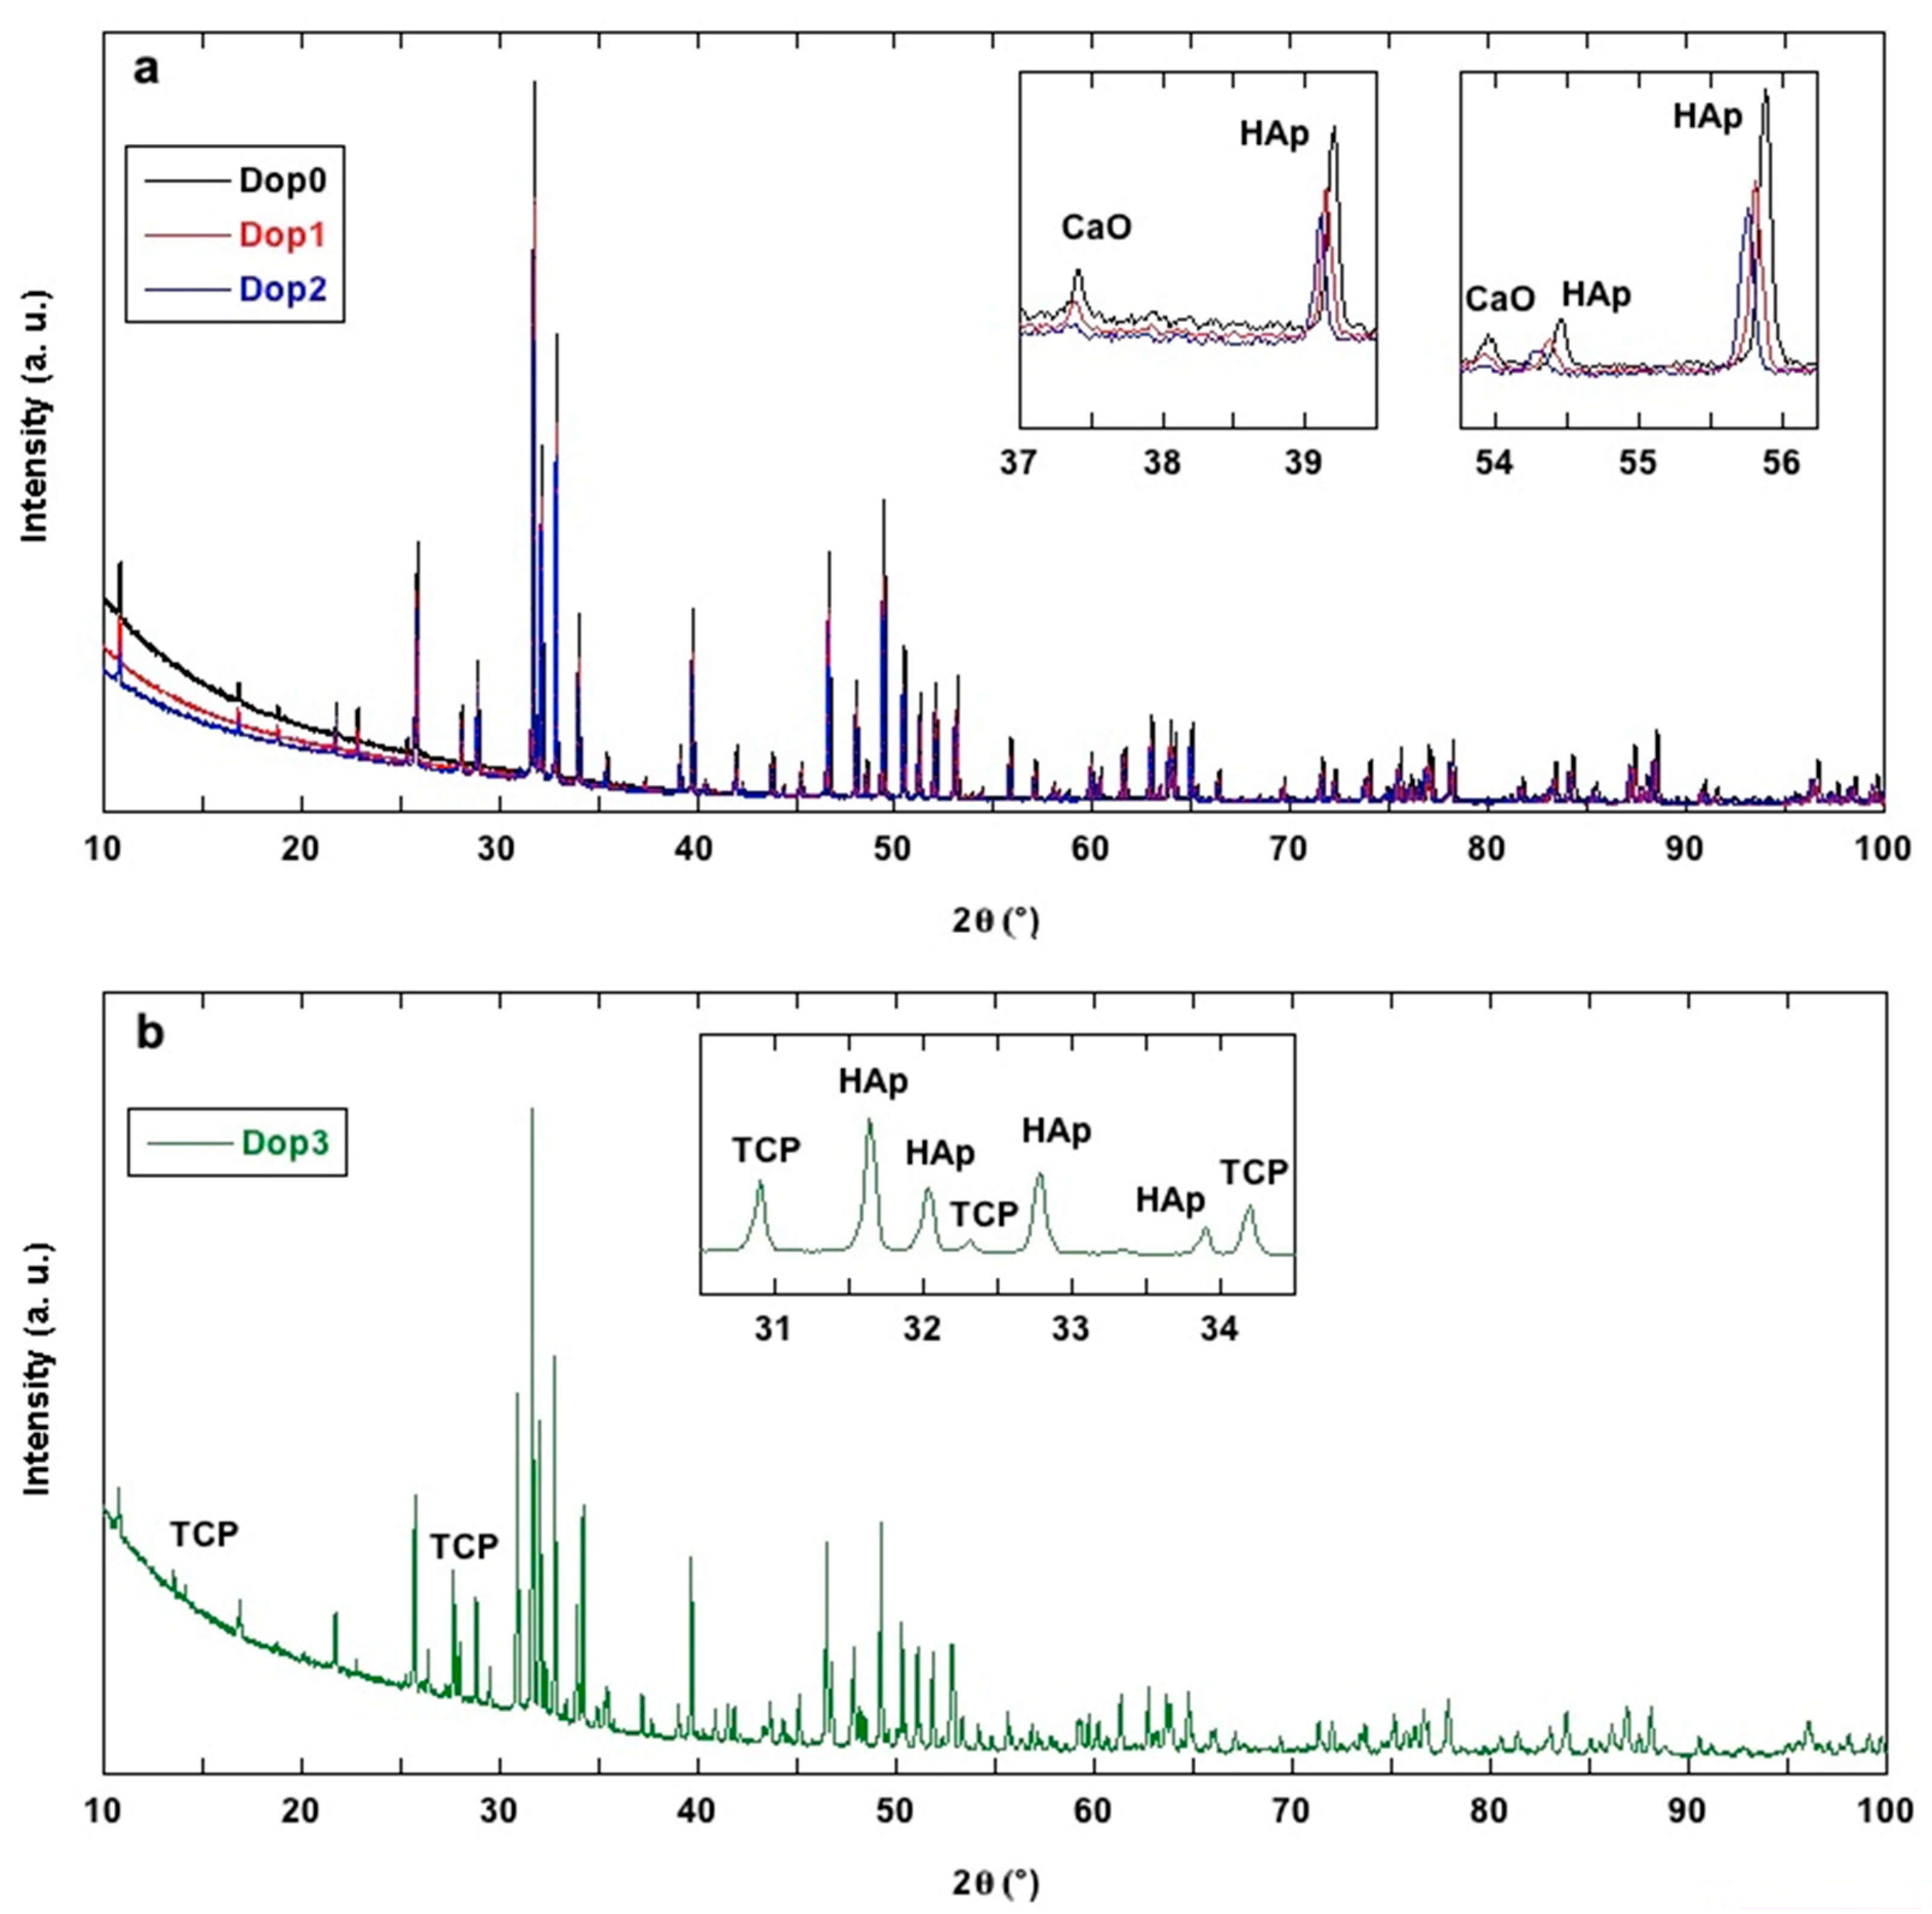
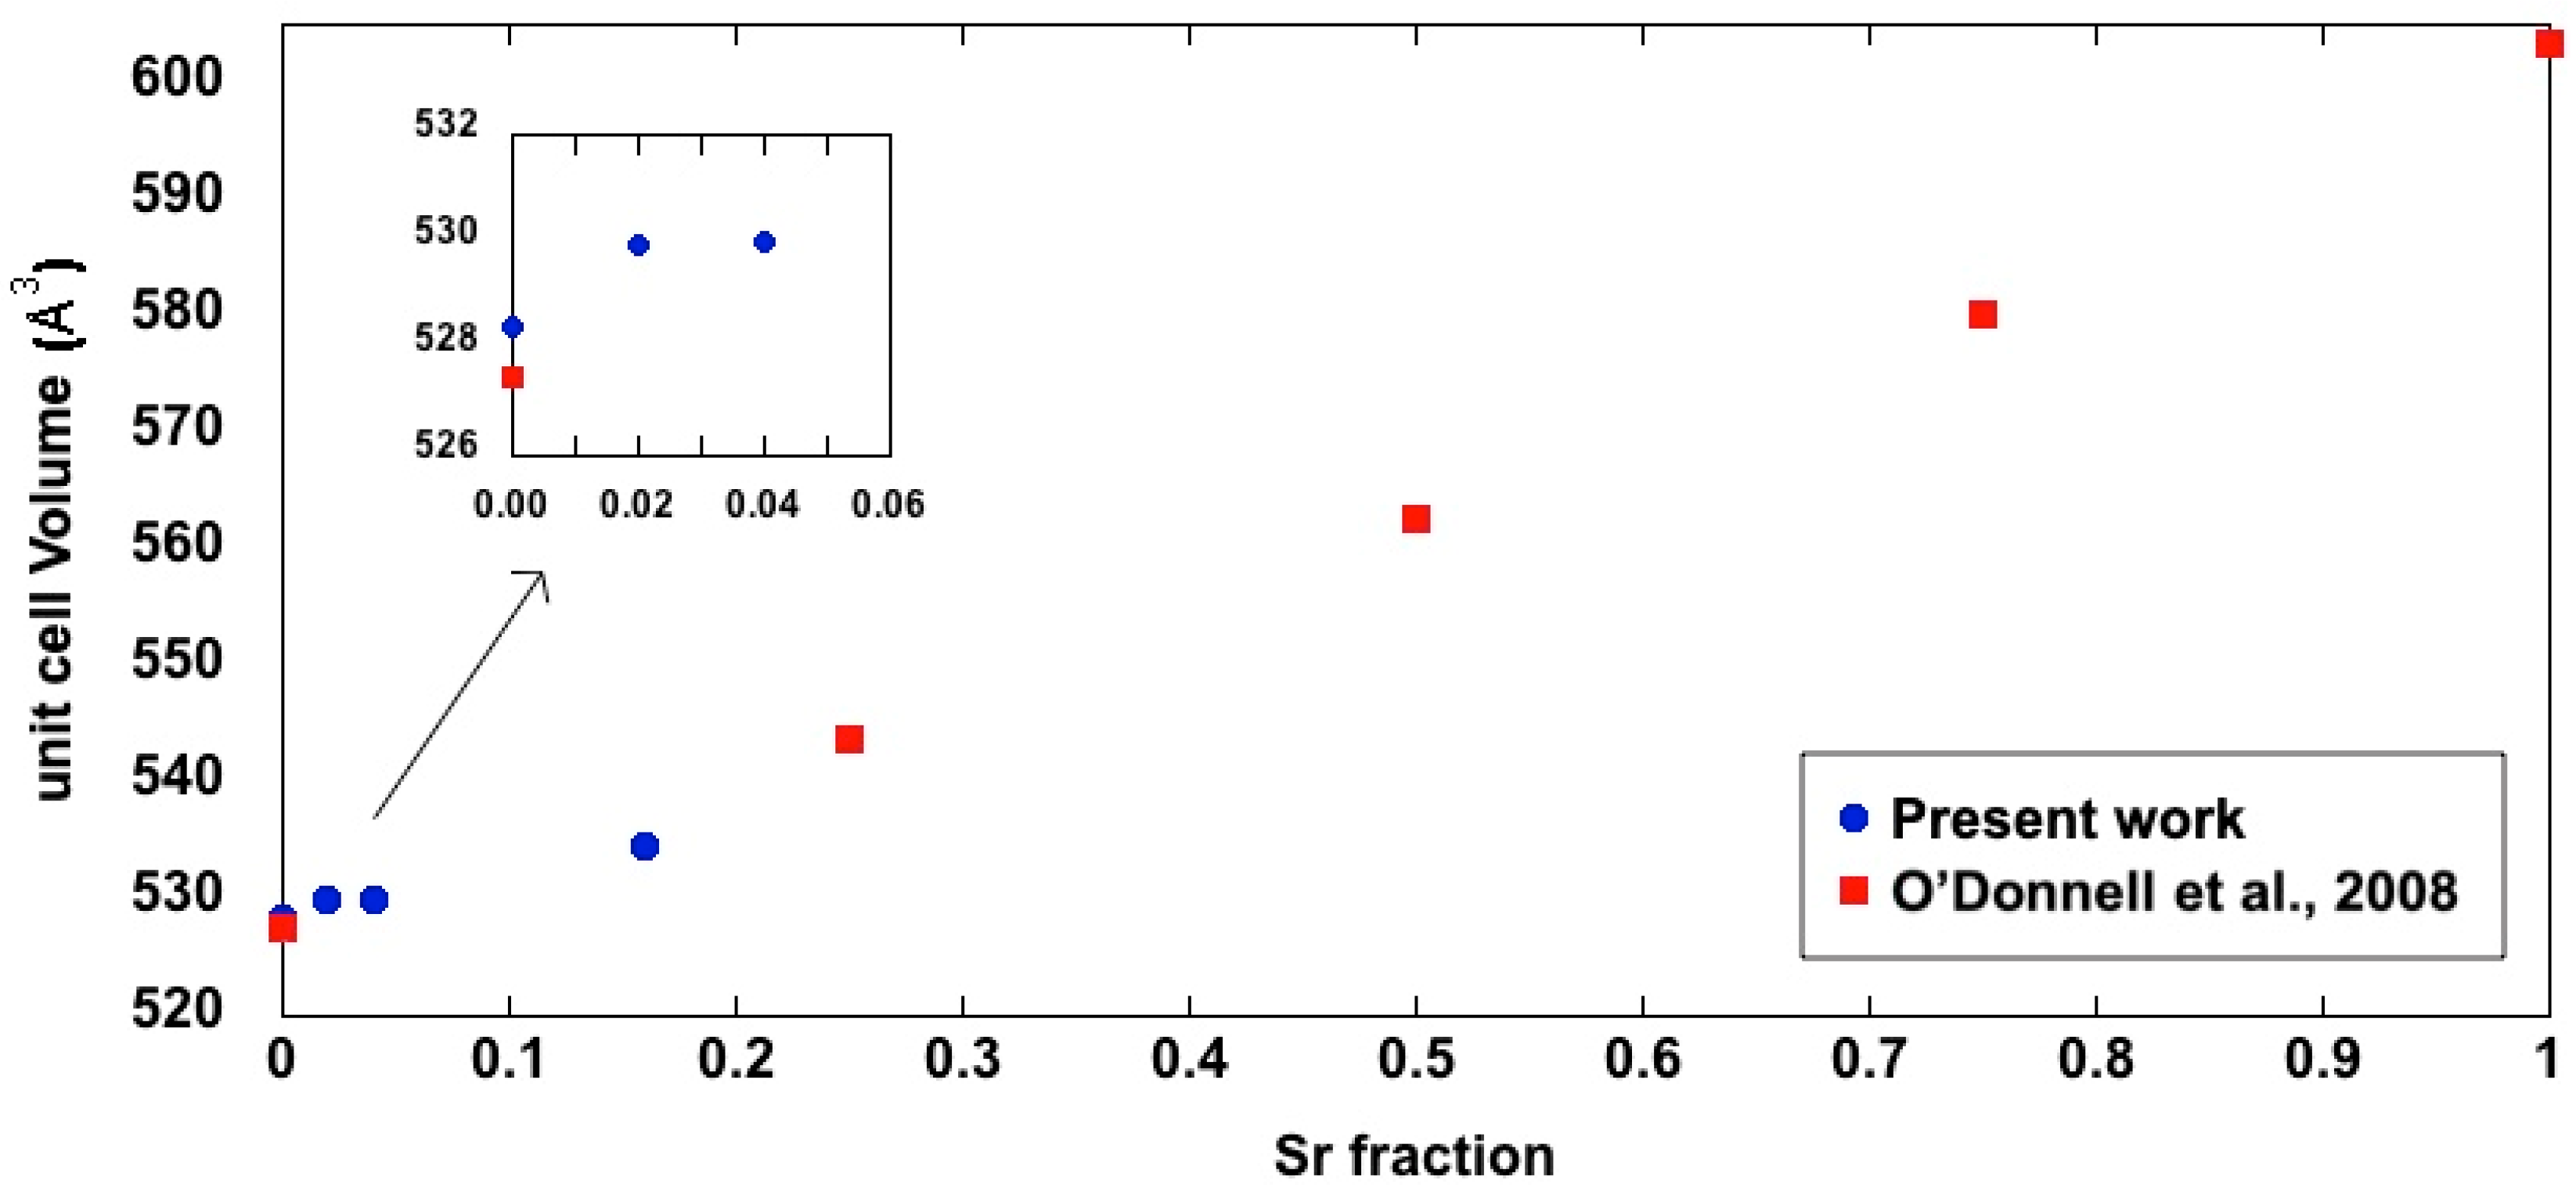
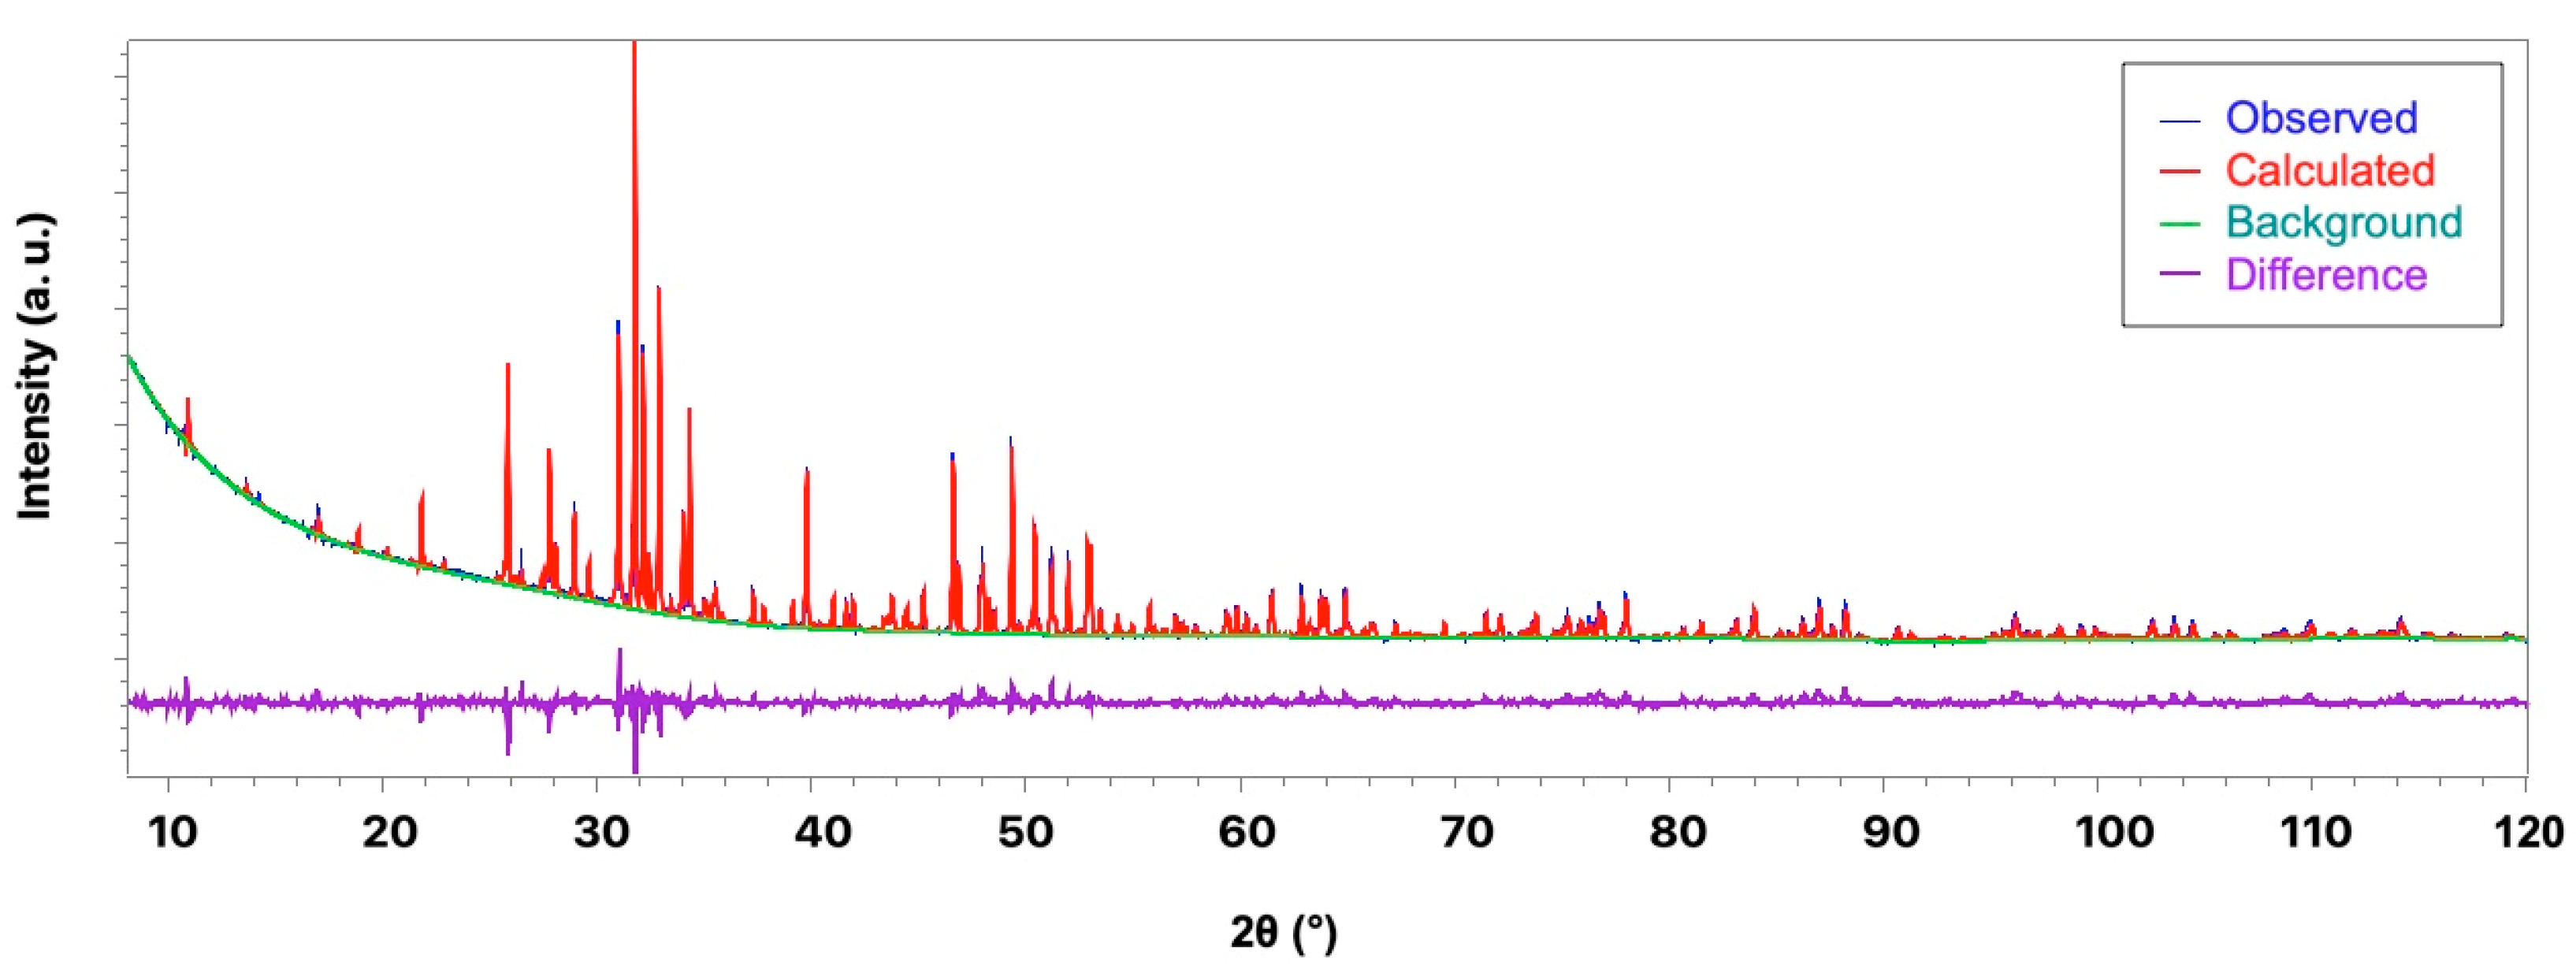
3.2. X-ray Diffraction Study
3.3. FTIR and Raman Spectroscopy
4. Conclusions
Author Contributions
Funding
Acknowledgments
Conflicts of Interest
References
- Dorozhkin, S.V. Calcium Orthophosphate Bioceramics. Ceram. Int. 2015, 41, 13913–13966. [Google Scholar] [CrossRef]
- Hughes, J.M.; Rakovan, J. The Crystal Structure of Apatite, Ca5(PO4)3(F,OH,Cl). Rev. Mineral. Geochem. 2002, 48, 1–12. [Google Scholar] [CrossRef]
- Cacciotti, I. Cationic and Anionic Substitutions in Hydroxyapatite. In Handbook of Bioceramics and Biocomposites; Antoniac, I.V., Ed.; Springer International Publishing: Cham, Switzerland, 2016; pp. 145–211. ISBN 978-3-319-12459-9. [Google Scholar]
- Suchanek, W.; Yoshimura, M. Processing and Properties of Hydroxyapatite-Based Biomaterials for Use as Hard Tissue Replacement Implants. J. Mater. Res. 1998, 13, 94–117. [Google Scholar] [CrossRef]
- Zhang, K.; Zhou, Y.; Xiao, C.; Zhao, W.; Wu, H.; Tang, J.; Li, Z.; Yu, S.; Li, X.; Min, L.; et al. Application of Hydroxyapatite Nanoparticles in Tumor-Associated Bone Segmental Defect. Sci. Adv. 2019, 5, eaax6946. [Google Scholar] [CrossRef] [Green Version]
- Balamurugan, A.; Rebelo, A.H.S.; Lemos, A.F.; Rocha, J.H.G.; Ventura, J.M.G.; Ferreira, J.M.F. Suitability Evaluation of Sol–Gel Derived Si-Substituted Hydroxyapatite for Dental and Maxillofacial Applications through in Vitro Osteoblasts Response. Dent. Mater. 2008, 24, 1374–1380. [Google Scholar] [CrossRef]
- Lara-Ochoa, S.; Ortega-Lara, W.; Guerrero-Beltrán, C.E. Hydroxyapatite Nanoparticles in Drug Delivery: Physicochemistry and Applications. Pharmaceutics 2021, 13, 1642. [Google Scholar] [CrossRef]
- El Khouri, A.; Zegzouti, A.; Elaatmani, M.; Capitelli, F. Bismuth-Substituted Hydroxyapatite Ceramics Synthesis: Morphological, Structural, Vibrational and Dielectric Properties. Inorg. Chem. Commun. 2019, 110, 107568. [Google Scholar] [CrossRef]
- Baldassarre, F.; Altomare, A.; Corriero, N.; Mesto, E.; Lacalamita, M.; Bruno, G.; Sacchetti, A.; Dida, B.; Karaj, D.; Ventura, G.D.; et al. Crystal Chemistry and Luminescence Properties of Eu-Doped Polycrystalline Hydroxyapatite Synthesized by Chemical Precipitation at Room Temperature. Crystals 2020, 10, 250. [Google Scholar] [CrossRef] [Green Version]
- Paterlini, V.; Bettinelli, M.; Rizzi, R.; El Khouri, A.; Rossi, M.; Della Ventura, G.; Capitelli, F. Characterization and Luminescence of Eu3+- and Gd3+-Doped Hydroxyapatite Ca10(PO4)6(OH)2. Crystals 2020, 10, 806. [Google Scholar] [CrossRef]
- Neacsu, I.A.; Stoica, A.E.; Vasile, B.S.; Andronescu, E. Luminescent Hydroxyapatite Doped with Rare Earth Elements for Biomedical Applications. Nanomaterials 2019, 9, 239. [Google Scholar] [CrossRef]
- El Khouri, A.; Elaatmani, M.; Della Ventura, G.; Sodo, A.; Rizzi, R.; Rossi, M.; Capitelli, F. Synthesis, Structure Refinement and Vibrational Spectroscopy of New Rare-Earth Tricalcium Phosphates Ca9RE(PO4)7 (RE = La, Pr, Nd, Eu, Gd, Dy, Tm, Yb). Ceram. Int. 2017, 43, 15645–15653. [Google Scholar] [CrossRef]
- Capitelli, F.; Rossi, M.; ElKhouri, A.; Elaatmani, M.; Corriero, N.; Sodo, A.; Della Ventura, G. Synthesis, Structural Model and Vibrational Spectroscopy of Lutetium Tricalcium Phosphate Ca9Lu(PO4)7. J. Rare Earths 2018, 36, 1162–1168. [Google Scholar] [CrossRef]
- Rizzi, R.; Capitelli, F.; Lazoryak, B.I.; Morozov, V.A.; Piccinelli, F.; Altomare, A. A Comprehensive Study of Ca9Tb(PO4) 7 and Ca9Ho(PO4)7 Doped β-Tricalcium Phosphates: Ab Initio Crystal Structure Solution, Rietveld Analysis, and Dielectric Properties. Cryst. Growth Des. 2021, 21, 2263–2276. [Google Scholar] [CrossRef]
- Kołodziejska, B.; Stępień, N.; Kolmas, J. The Influence of Strontium on Bone Tissue Metabolism and Its Application in Osteoporosis Treatment. Int. J. Mol. Sci. 2021, 22, 6564. [Google Scholar] [CrossRef]
- Frasnelli, M.; Cristofaro, F.; Sglavo, V.M.; Dirè, S.; Callone, E.; Ceccato, R.; Bruni, G.; Cornaglia, A.I.; Visai, L. Synthesis and Characterization of Strontium-Substituted Hydroxyapatite Nanoparticles for Bone Regeneration. Mater. Sci. Eng. C 2017, 71, 653–662. [Google Scholar] [CrossRef]
- Marx, D.; Rahimnejad Yazdi, A.; Papini, M.; Towler, M. A Review of the Latest Insights into the Mechanism of Action of Strontium in Bone. Bone Rep. 2020, 12, 100273. [Google Scholar] [CrossRef]
- Jayasree, R.; Kumar, T.S.S.; Mahalaxmi, S.; Abburi, S.; Rubaiya, Y.; Doble, M. Dentin Remineralizing Ability and Enhanced Antibacterial Activity of Strontium and Hydroxyl Ion Co-Releasing Radiopaque Hydroxyapatite Cement. J. Mater. Sci. Mater. Med. 2017, 28, 95. [Google Scholar] [CrossRef]
- Kolmas, J.; Groszyk, E.; Kwiatkowska-Różycka, D. Substituted Hydroxyapatites with Antibacterial Properties. BioMed Res. Int. 2014, 2014, 1–15. [Google Scholar] [CrossRef] [Green Version]
- Ebrahimi, M.; Botelho, M. Biphasic Calcium Phosphates (BCP) of Hydroxyapatite (HA) and Tricalcium Phosphate (TCP) as Bone Substitutes: Importance of Physicochemical Characterizations in Biomaterials Studies. Data Brief 2017, 10, 93–97. [Google Scholar] [CrossRef] [Green Version]
- Chen, F.; Zhu, Y.-J.; Zhang, K.-H.; Wu, J.; Wang, K.-W.; Tang, Q.-L.; Mo, X.-M. Europium-Doped Amorphous Calcium Phosphate Porous Nanospheres: Preparation and Application as Luminescent Drug Carriers. Nanoscale Res. Lett. 2011, 6, 67. [Google Scholar] [CrossRef]
- Li, Y.; Wang, W.; Han, J.; Li, Z.; Wang, Q.; Lin, X.; Ge, K.; Zhou, G. Synthesis of Silver- and Strontium-Substituted Hydroxyapatite with Combined Osteogenic and Antibacterial Activities. Biol. Trace Elem. Res. 2022, 200, 931–942. [Google Scholar] [CrossRef]
- Gu, X.; Lin, W.; Li, D.; Guo, H.; Li, P.; Fan, Y. Degradation and Biocompatibility of a Series of Strontium Substituted Hydroxyapatite Coatings on Magnesium Alloys. RSC Adv. 2019, 9, 15013–15021. [Google Scholar] [CrossRef] [Green Version]
- Nguyen, T.-D.T.; Jang, Y.-S.; Lee, M.-H.; Bae, T.-S. Effect of Strontium Doping on the Biocompatibility of Calcium Phosphate-Coated Titanium Substrates. J. Appl. Biomater. Funct. Mater. 2019, 17, 228080001982651. [Google Scholar] [CrossRef] [Green Version]
- Ge, M.; Ge, K.; Gao, F.; Yan, W.; Liu, H.; Xue, L.; Jin, Y.; Ma, H.; Zhang, J. Biomimetic Mineralized Strontium-Doped Hydroxyapatite on Porous Poly(L-Lactic Acid) Scaffolds for Bone Defect Repair. Int. J. Nanomed. 2018, 13, 1707–1721. [Google Scholar] [CrossRef] [Green Version]
- Terra, J.; Dourado, E.R.; Eon, J.-G.; Ellis, D.E.; Gonzalez, G.; Rossi, A.M. The Structure of Strontium-Doped Hydroxyapatite: An Experimental and Theoretical Study. Phys. Chem. Chem. Phys. 2009, 11, 568–577. [Google Scholar] [CrossRef]
- Cheng, G.; Zhang, Y.; Yin, H.; Ruan, Y.; Sun, Y.; Lin, K. Effects of Strontium Substitution on the Structural Distortion of Hydroxyapatite by Rietveld Refinement and Raman Spectroscopy. Ceram. Int. 2019, 45, 11073–11078. [Google Scholar] [CrossRef]
- Rietveld, H.M. A Profile Refinement Method for Nuclear and Magnetic Structures. J. Appl. Crystallogr. 1969, 2, 65–71. [Google Scholar] [CrossRef]
- Altomare, A.; Cuocci, C.; Giacovazzo, C.; Moliterni, A.; Rizzi, R.; Corriero, N.; Falcicchio, A. EXPO2013: A Kit of Tools for Phasing Crystal Structures from Powder Data. J. Appl. Crystallogr. 2013, 46, 1231–1235. [Google Scholar] [CrossRef]
- Altomare, A.; Campi, G.; Cuocci, C.; Eriksson, L.; Giacovazzo, C.; Moliterni, A.; Rizzi, R.; Werner, P.-E. Advances in Powder Diffraction Pattern Indexing: N-TREOR09. J. Appl. Crystallogr. 2009, 42, 768–775. [Google Scholar] [CrossRef]
- Altomare, A.; Corriero, N.; Cuocci, C.; Falcicchio, A.; Moliterni, A.; Rizzi, R. QUALX2.0: A Qualitative Phase Analysis Software Using the Freely Available Database POW_COD. J. Appl. Crystallogr. 2015, 48, 598–603. [Google Scholar] [CrossRef]
- PDF-2 ICDD, The Powder Diffraction File; International Center for Diffraction Data: Newton Square, PA, USA, 2003.
- Mardziah, C.M.; Sopyan, I.; Nik Roselina, N.R.; Hyie, K.M. Effect of Calcining Temperatures on the Morphology and Crystallinity of Strontium Doped Hydroxyapatite Nanopowders. Adv. Mater. Res. 2013, 772, 325–330. [Google Scholar] [CrossRef]
- Landi, E.; Tampieri, A.; Celotti, G.; Sprio, S. Densification Behaviour and Mechanisms of Synthetic Hydroxyapatites. J. Eur. Ceram. Soc. 2000, 20, 2377–2387. [Google Scholar] [CrossRef]
- Wilson, R.M.; Elliott, J.C.; Dowker, S.E.P. Rietveld Refinement of the Crystallographic Structure of Human Dental Enamel Apatites. Am. Mineral. 1999, 84, 1406–1414. [Google Scholar] [CrossRef]
- Natta, G.; Passerini, L. Soluzioni solide, isomorfismo e simmorfismo tra gli ossidi dei metalli bivalenti. Sistemi: CaO-CdO. CaO-MnO, CaO-CoO, CaO-NiO, CaO-MgO. Gazz. Chim. Ital. 1929, 59, 129–154. [Google Scholar]
- Dickens, B.; Schroeder, L.W.; Brown, W.E. Crystallographic Studies of the Role of Mg as a Stabilizing Impurity in β-Ca3(PO4)2. The Crystal Structure of Pureβ-Ca3(PO4)2. J. Solid State Chem. 1974, 10, 232–248. [Google Scholar] [CrossRef]
- Yashima, M.; Sakai, A.; Kamiyama, T.; Hoshikawa, A. Crystal Structure Analysis of β-Tricalcium Phosphate Ca3(PO4)2 by Neutron Powder Diffraction. J. Solid State Chem. 2003, 175, 272–277. [Google Scholar] [CrossRef]
- Okazaki, M.; Taira, M.; Takahashi, J. Rietveld Analysis and Fourier Maps of Hydroxyapatite. Biomaterials 1997, 18, 795–799. [Google Scholar] [CrossRef]
- Trombe, J.C.; Montel, G. Some Features of the Incorporation of Oxygen in Different Oxidation States in the Apatitic Lattice—I on the Existence of Calcium and Strontium Oxyapatites. J. Inorg. Nucl. Chem. 1978, 40, 15–21. [Google Scholar] [CrossRef]
- Rey, C.; Combes, C.; Drouet, C.; Grossin, D. Bioactive Ceramics: Physical Chemistry. In Comprehensive Biomaterials; Elsevier: Amsterdam, The Netherlands, 2011; pp. 187–221. ISBN 978-0-08-055294-1. [Google Scholar]
- Obadia, L.; Rouillon, T.; Bujoli, B.; Daculsi, G.; Bouler, J.M. Calcium-Deficient Apatite Synthesized by Ammonia Hydrolysis of Dicalcium Phosphate Dihydrate: Influence of Temperature, Time, and Pressure. J. Biomed. Mater. Res. 2007, 80, 32–42. [Google Scholar] [CrossRef]
- Belik, A.A.; Izumi, F.; Stefanovich, S.Y.; Malakho, A.P.; Lazoryak, B.I.; Leonidov, I.A.; Leonidova, O.N.; Davydov, S.A. Polar and Centrosymmetric Phases in Solid Solutions Ca3-xSrx(PO4)2 (0 ≤ x ≤ 16/7). Chem. Mater. 2002, 14, 3197–3205. [Google Scholar] [CrossRef]
- Zarins, J.; Pilmane, M.; Sidhoma, E.; Salma, I.; Locs, J. The Role of Strontium Enriched Hydroxyapatite and Tricalcium Phosphate Biomaterials in Osteoporotic Bone Regeneration. Symmetry 2019, 11, 229. [Google Scholar] [CrossRef]
- O’Donnell, M.D.; Fredholm, Y.; De Rouffignac, A.; Hill, R.G. Structural Analysis of a Series of Strontium-Substituted Apatites. Acta Biomater. 2008, 4, 1455–1464. [Google Scholar] [CrossRef]
- Verbraeken, M.C.; Suard, E.; Irvine, J.T.S. Structural and Electrical Properties of Calcium and Strontium Hydrides. J. Mater. Chem. 2009, 19, 2766. [Google Scholar] [CrossRef]
- Brown, I.D.; Altermatt, D. Bond-Valence Parameters Obtained from a Systematic Analysis of the Inorganic Crystal Structure Database. Acta Crystallogr. Sect. B Struct. Sci. 1985, 41, 244–247. [Google Scholar] [CrossRef] [Green Version]
- Inorganic Crystal Structure Database (ICSD), Version 2018–2; Fachinformationszentrum: Karlsruhe, Germany, 2018.
- Rossi, M.; Ghiara, M.R.; Chita, G.; Capitelli, F. Crystal-Chemical and Structural Characterization of Fluorapatites in Ejecta from Somma-Vesuvius Volcanic Complex. Am. Mineral. 2011, 96, 1828–1837. [Google Scholar] [CrossRef]
- Chiari, G.; Ferraris, G. The Water Molecule in Crystalline Hydrates Studied by Neutron Diffraction. Acta Crystallogr. Sect. B Struct. Sci. Cryst. Eng. Mater. 1982, 38, 2331–2341. [Google Scholar] [CrossRef]
- Angenault, J.; Couturier, J.C.; Souron, J.P.; Siliqi, D.; Quarton, M. The Martensitic Nature of the Transition Monoclinic ⇌ Rhombohedral of LiSn2(PO4)3. J. Mater. Sci. Lett. 1992, 11, 1705–1707. [Google Scholar] [CrossRef]
- Altomare, A.; Rizzi, R.; Rossi, M.; El Khouri, A.; Elaatmani, M.; Paterlini, V.; Della Ventura, G.; Capitelli, F. New Ca2.90(Me2+)0.10(PO4)2 β-Tricalcium Phosphates with Me2+ = Mn, Ni, Cu: Synthesis, Crystal-Chemistry, and Luminescence Properties. Crystals 2019, 9, 288. [Google Scholar] [CrossRef] [Green Version]
- Capitelli, F.; El Bali, B.; Essehli, R.; Lachkar, M.; da Silva, I. New Hybrid Diphosphates Ln2(NH2(CH2)2NH2)(HP2O 7)2·4 H2O(Ln = Eu, Tb, Er): Synthesis, Single Crystal and Powder X-Ray Crystal Structure. Z. Für Krist. Cryst. Mater. 2006, 221, 788–794. [Google Scholar] [CrossRef]
- Koutsopoulos, S. Synthesis and Characterization of Hydroxyapatite Crystals: A Review Study on the Analytical Methods. J. Biomed. Mater. Res. 2002, 62, 600–612. [Google Scholar] [CrossRef]
- Jastrzębski, W.; Sitarz, M.; Rokita, M.; Bułat, K. Infrared Spectroscopy of Different Phosphates Structures. Spectrochim. Acta Part A Mol. Biomol. Spectrosc. 2011, 79, 722–727. [Google Scholar] [CrossRef]
- Bulina, N.V.; Chaikina, M.V.; Prosanov, I.Y. Mechanochemical Synthesis of Sr-Substituted Hydroxyapatite. Inorg. Mater. 2018, 54, 820–825. [Google Scholar] [CrossRef]
- Markovic, M.; Fowler, B.O.; Tung, M.S. Preparation and Comprehensive Characterization of a Calcium Hydroxyapatite Reference Material. J. Res. Natl. Inst. Stand. Technol. 2004, 109, 553. [Google Scholar] [CrossRef]
- Jillavenkatesa, A.; Condrate, R.A. The Infrared and Raman Spectra of β-and α-Tricalcium Phosphate (Ca3(Po4)2). Spectrosc. Lett. 1998, 31, 1619–1634. [Google Scholar] [CrossRef]


| Sample/Element | Ca | P | Sr | (Ca + Sr)/P |
|---|---|---|---|---|
| wt% | wt% | wt% | molar ratio | |
| Dop0 | 36.18 | 16.87 | 0.00 | 1.66 |
| Dop1 | 36.86 | 18.13 | 2.36 | 1.62 |
| Dop2 | 29.94 | 15.00 | 4.17 | 1.64 |
| Dop3 | 30.10 | 16.50 | 8.26 | 1.59 |
| Dop0 | Dop1 | Dop2 | Dop3 | |
|---|---|---|---|---|
| Ref. formula Formula wt. | Ca10(PO4)6(OH)2 1004.61 | Ca9.98Sr0.02(PO4)6(OH)2 1005.98 | Ca9.96Sr0.04(PO4)6(OH)2 1006.38 | Ca9.84Sr0.16(PO4)6(OH)2 1019.71 |
| Color | Colorless | Colorless | Colorless | Colorless |
| T (K) | 293 | 293 | 293 | 293 |
| λ (Å) | 1.54056 | 1.54056 | 1.54056 | 1.54056 |
| 2θ; step (°) | 10–100, 0.02 | 8–120, 0.02 | 8–120, 0.02 | 8–120, 0.02 |
| Crystal system Space group | Hexagonal P63/m | Hexagonal P63/m | Hexagonal P63/m | Hexagonal P63/m |
| a = b (Å) | 9.41614(14) | 9.42402(6) | 9.42265(2) | 9.44904(14) |
| c (Å) | 6.8816(2) | 6.89026(10) | 6.89277(6) | 6.9150(2) |
| V (Å3) | 528.40(2) | 529.96(1) | 529.99(1) | 534.69(2) |
| Z; ρcalc. (Mg·m−3) | 1; 3.107 | 1; 3.152 | 1; 3.153 | 1; 3.094 |
| Refinement | FMLS | FMLS | FMLS | FMLS |
| Bragg refl. | 213 | 291 | 291 | 291 |
| Rp; Rwp; Rexp (%) | 4.79; 8.04; 4.36 | 3.14; 5.17, 4.91 | 4.12; 6.58; 5.07 | 3.52; 5.28; 4.72 |
| Parameter | Dop0 | Dop1 | Dop2 | Dop3 |
|---|---|---|---|---|
| Crystallite Size (nm) | 136.7 | 128.8 | 127.7 | 96.2 |
| Crystallinity (%) | 92 | 91 | 91 | 86 |
| HAp (%) | 99.4 | - | - | - |
| Sr-HAp (%) | - | 99.7 | 99.9 | 60.7 |
| CaO (%) | 0.6 | 0.3 | 0.1 | - |
| β-TCP (%) | - | - | - | 39.3 |
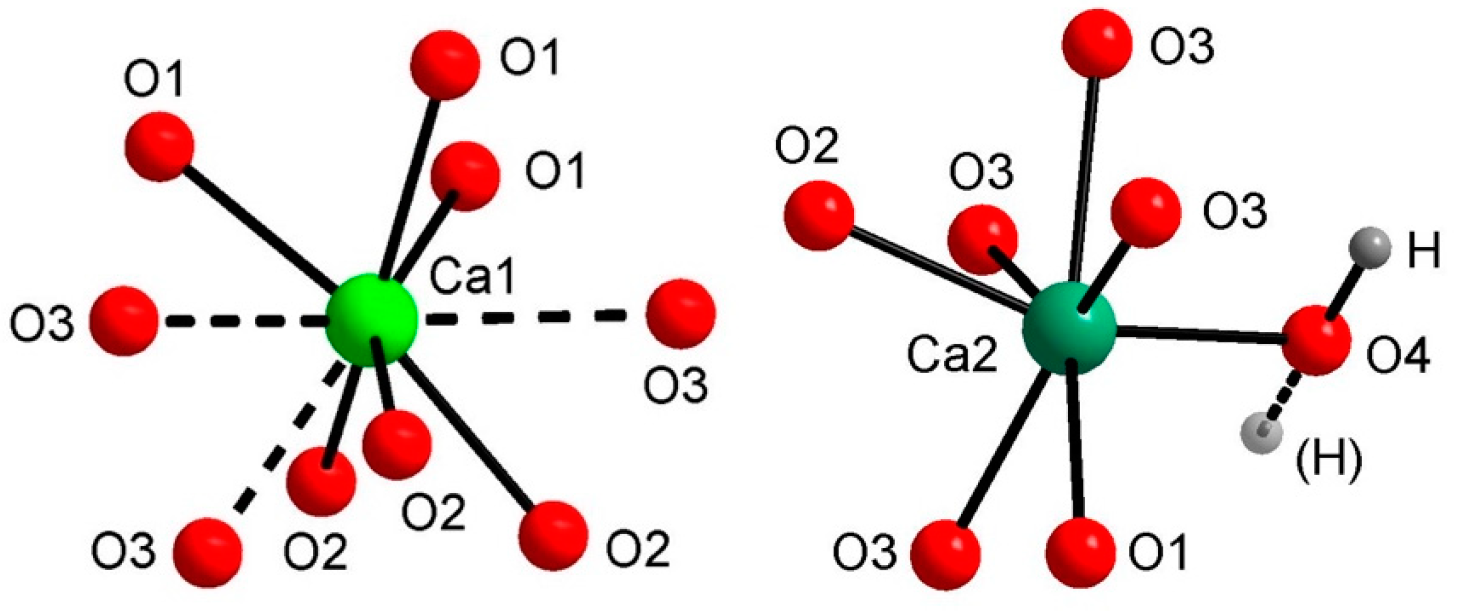
| Distance | Dop0 | bvp | Dop1 | bvp | Dop2 | bvp | Dop3 | bvp |
|---|---|---|---|---|---|---|---|---|
| 3xCa1-O1 | 2.410(6) | 0.30 | 2.414(5) | 0.30 | 2.410(4) | 0.30 | 2.421(6) | 0.29 |
| 3xCa1-O2 | 2.419(7) | 0.30 | 2.431(4) | 0.29 | 2.433(7) | 0.28 | 2.414(7) | 0.30 |
| 3xCa1-O3 | 2.819(6) | 0.10 | 2.821(4) | 0.10 | 2.808(5) | 0.10 | 2.819(6) | 0.10 |
| 2.09 | 2.05 | 2.06 | 2.08 | |||||
| Ca2-O1 | 2.647(12) | 0.16 | 2.667(7) | 0.15 | 2.670(9) | 0.15 | 2.632(11) | 0.17 |
| Ca2-O2 | 2.327(9) | 0.38 | 2.353(5) | 0.35 | 2.354(7) | 0.35 | 2.365(8) | 0.34 |
| 2xCa2 O3 | 2.323(5) | 0.38 | 2.332(3) | 0.37 | 2.332(5) | 0.37 | 2.322(5) | 0.38 |
| 2xCa2 O3 | 2.482(8) | 0.25 | 2.474(5) | 0.25 | 2.490(6) | 0.24 | 2.518(8) | 0.25 |
| Ca2-O4OH | 2.365(2) | 0.34 | 2.386(2) | 0.32 | 2.387(2) | 0.32 | 2.377(2) | 0.33 |
| 2.14 | 2.40 | 2.38 | 2.05 | |||||
| P1-O1 | 1.569(12) | 1.14 | 1.565(7) | 1.15 | 1.573(9) | 1.12 | 1.578(12) | 1.10 |
| P1-O2 | 1.602(9) | 1.04 | 1.562(5) | 1.16 | 1.555(7) | 1.18 | 1.590(6) | 1.08 |
| 2xP1-O3 | 1.566(6) | 1.15 | 1.568(4) | 1.14 | 1.562(4) | 1.16 | 1.580(6) | 1.10 |
| 4.47 | 4.60 | 4.63 | 4.40 |
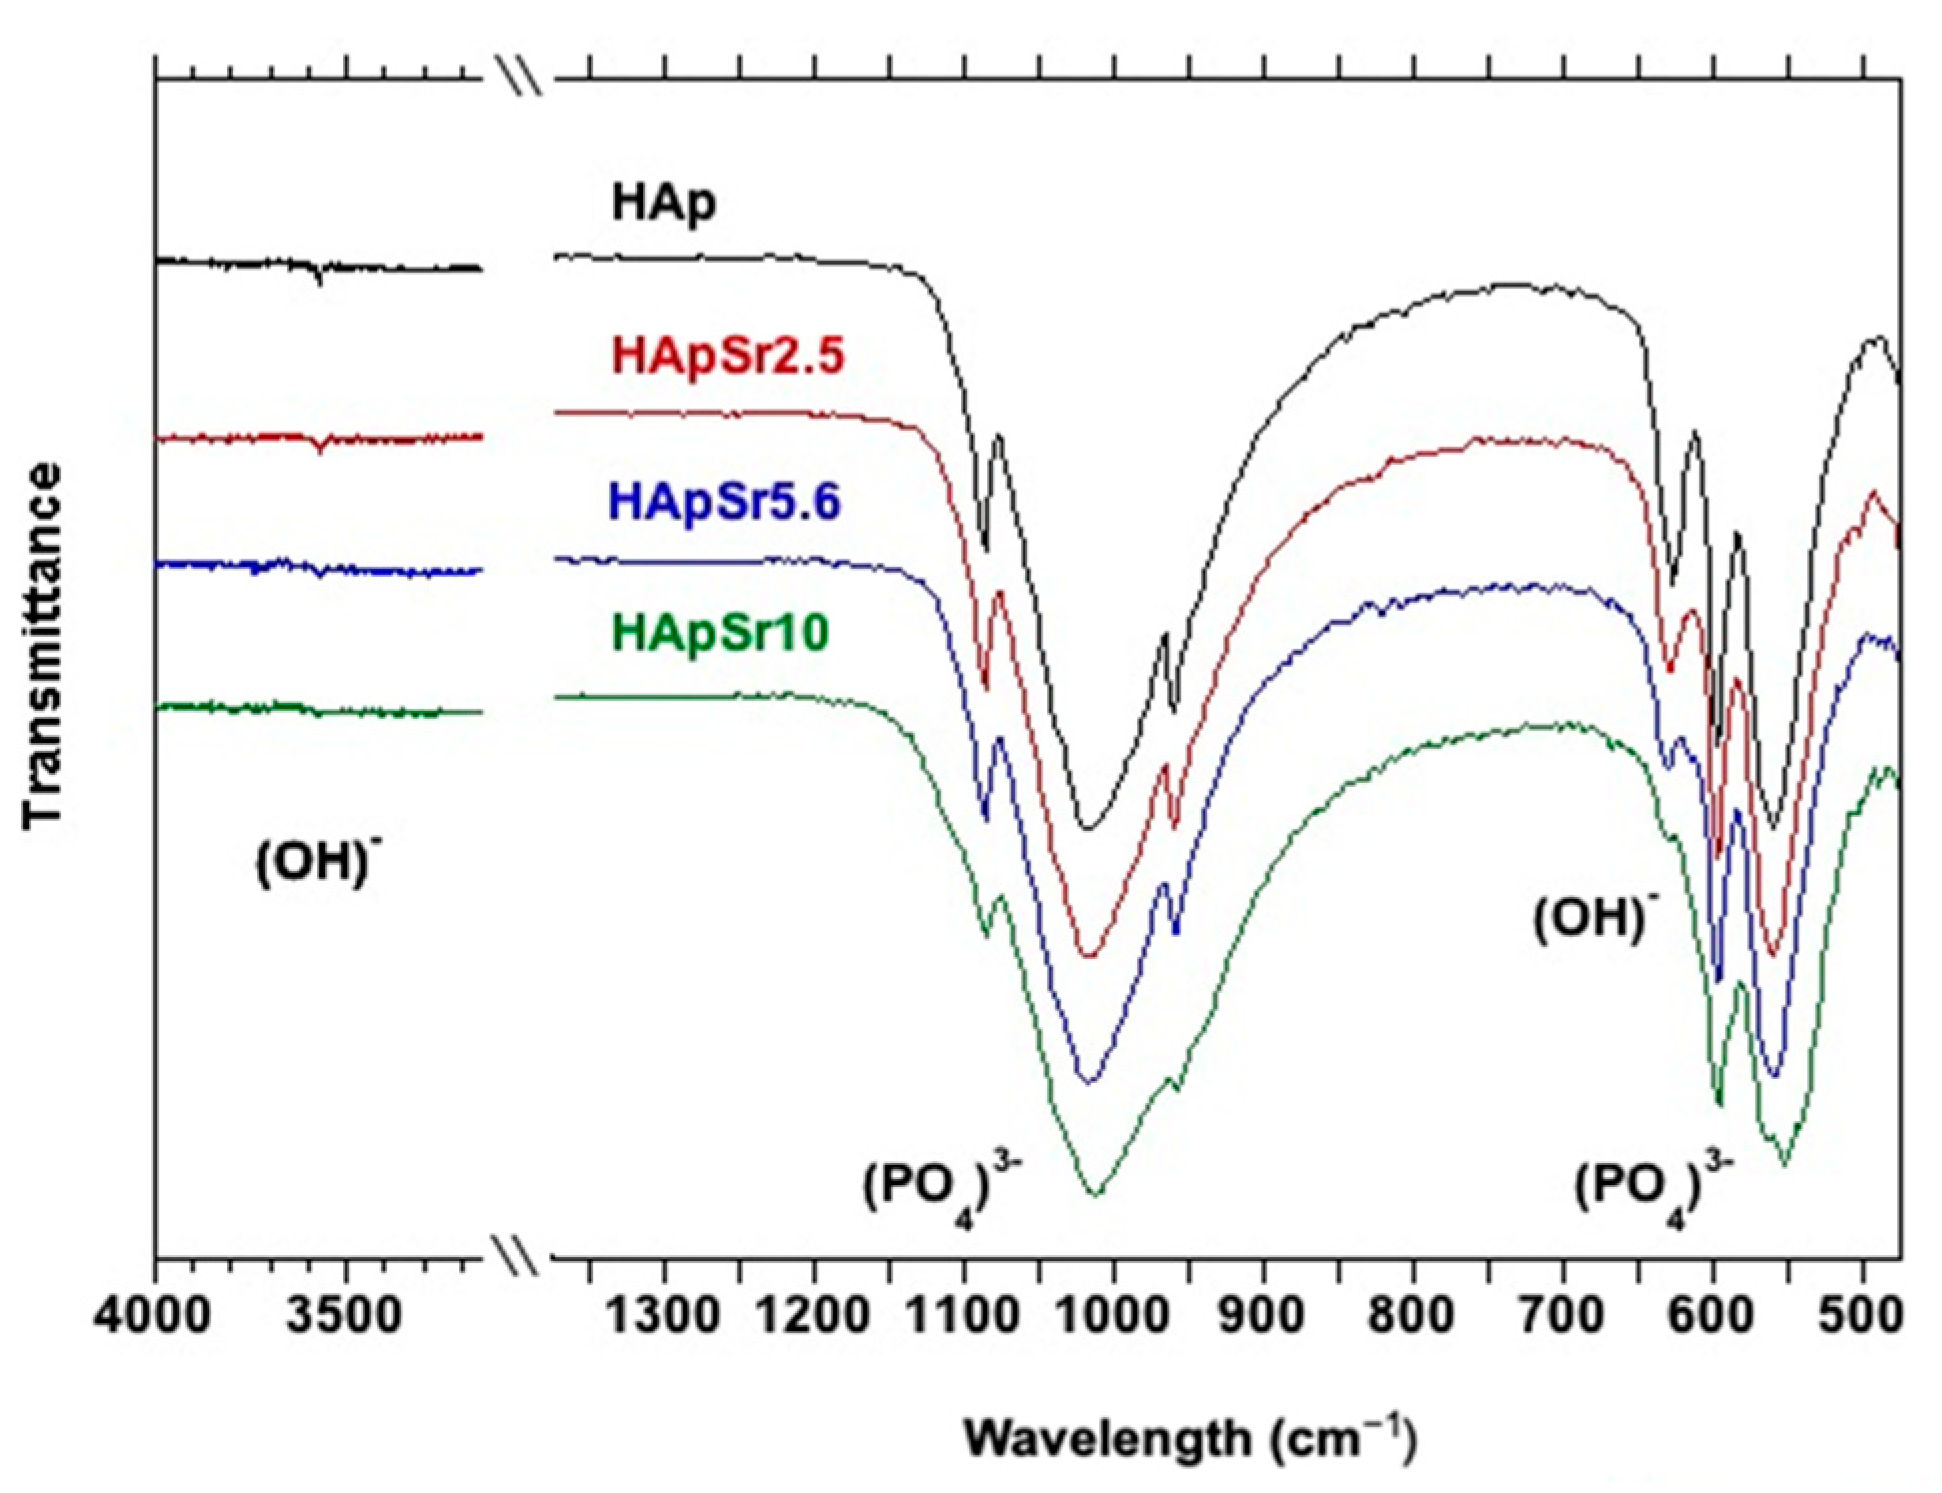
| Dop0 | Dop1 | Dop2 | Dop3 | Assignment |
|---|---|---|---|---|
| 3572 | 3572 | 3570 | 3571 | νs(OH) |
| 1087 1020 | 1086 1017 | 1085 1017 | 1083 1013 | ν3(PO4)3− |
| 959 | 957 | 957 | 955 | ν1(PO4)3− |
| 627 | 629 | 631 | 631 | δ(OH) |
| 597 560 | 597 560 | 597 558 | 596 553 | ν4(PO4)3− |
| 472 | 472 | 471 | 466 | ν2(PO4)3− |
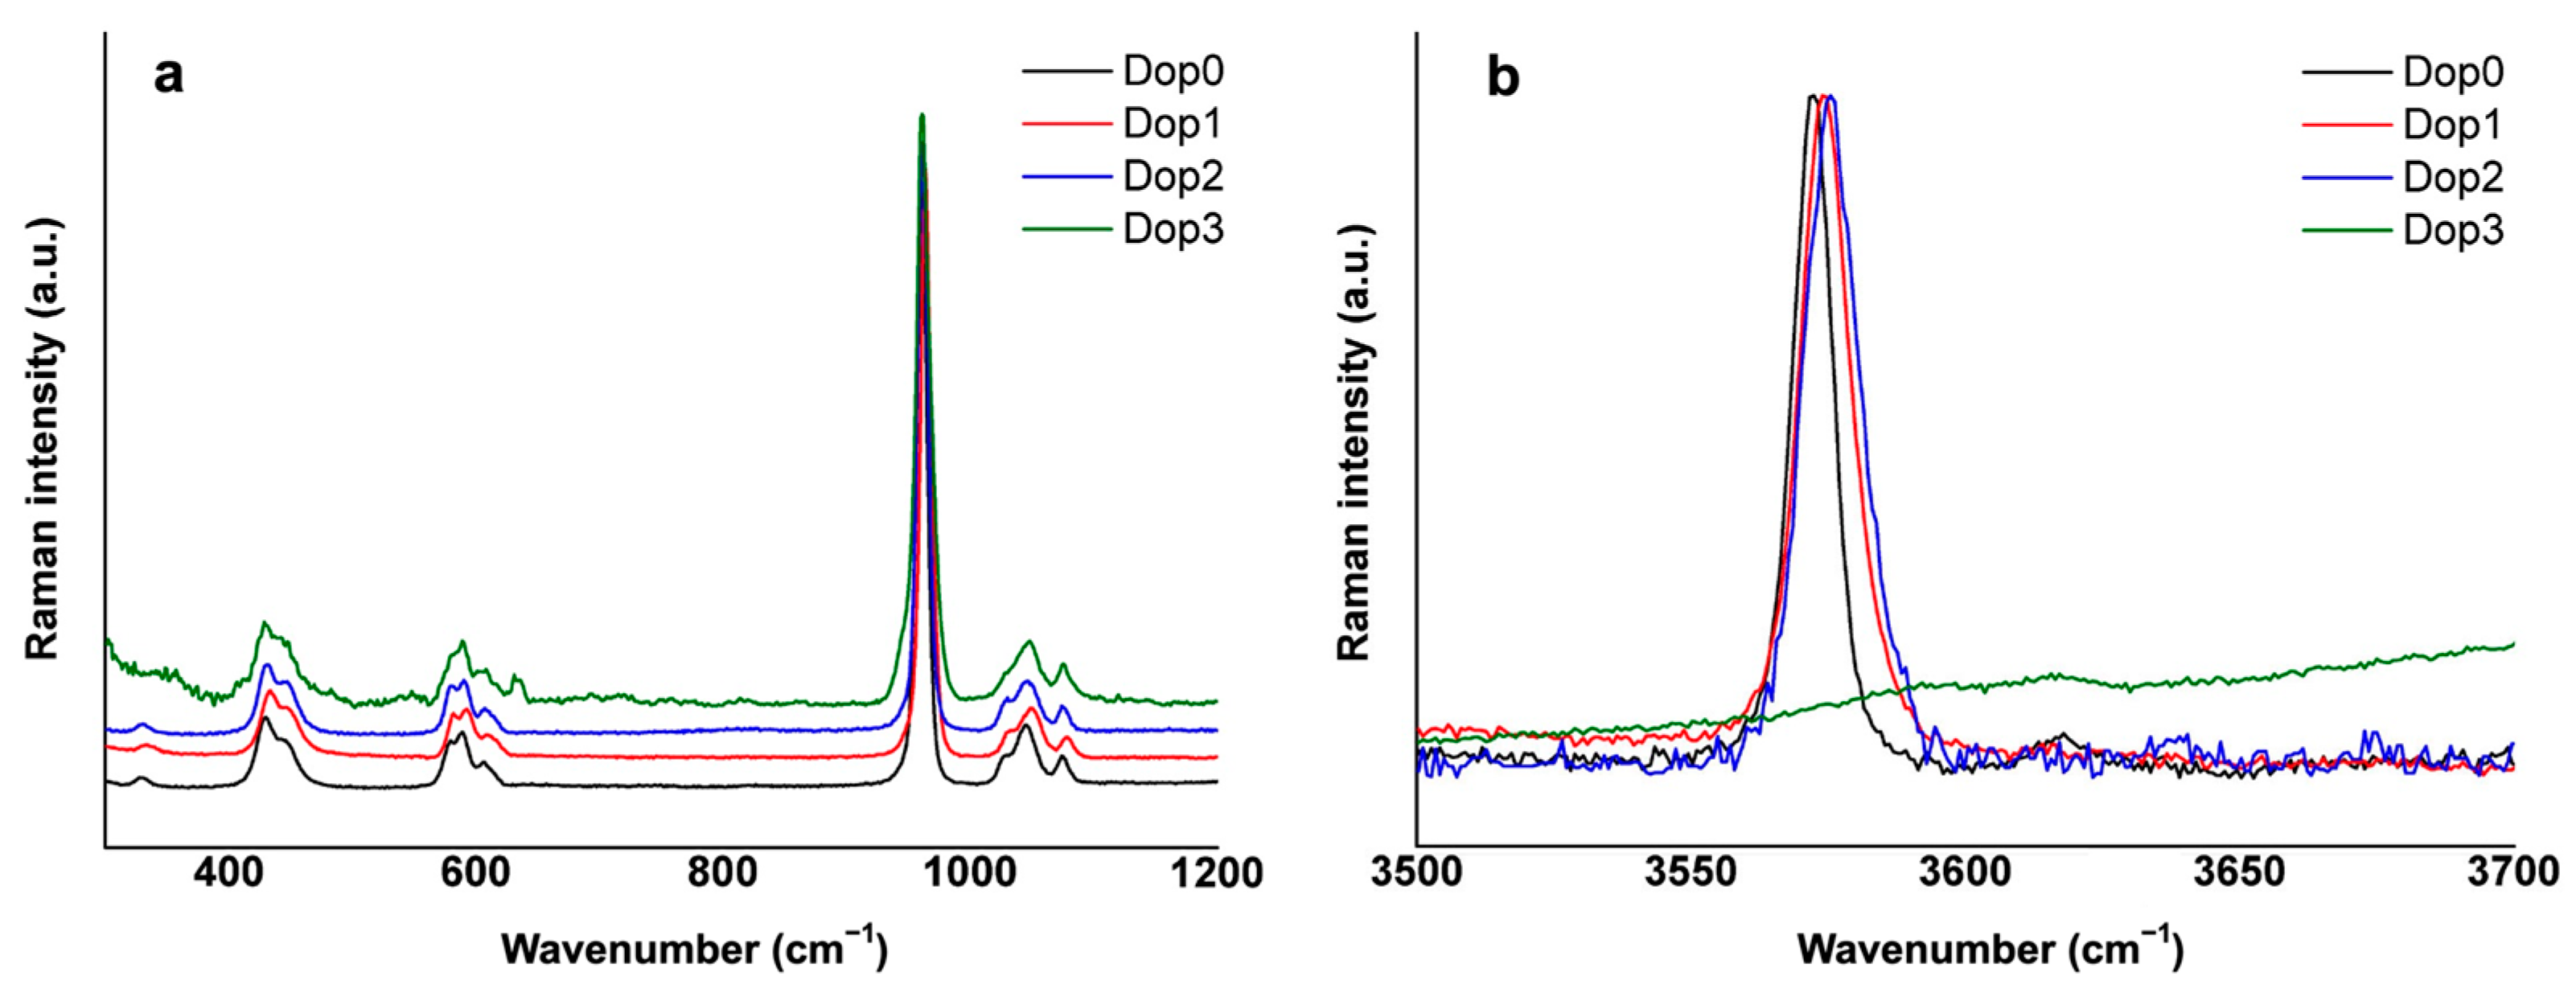
| Dop0 | Dop1 | Dop2 | Dop3 | Assignment |
|---|---|---|---|---|
| 329 | 330 | 330 | ν3(Ca-OH) | |
| 430 445 | 434 446 | 431 447 | 429 445 | ν2(PO4)3− |
| 580 589 606 | 581 593 608 | 581 590 607 | 580 589 608 | ν4(PO4)3− |
| 961 | 963 | 961 | 958 | ν1(PO4)3− |
| 1029 1044 1073 | 1031 1049 1078 | 1030 1046 1073 | 1045 1072 | ν3(PO4)3− |
| 3572 | 3574 | 3576 | ν(OH) |
Disclaimer/Publisher’s Note: The statements, opinions and data contained in all publications are solely those of the individual author(s) and contributor(s) and not of MDPI and/or the editor(s). MDPI and/or the editor(s) disclaim responsibility for any injury to people or property resulting from any ideas, methods, instructions or products referred to in the content. |
© 2023 by the authors. Licensee MDPI, Basel, Switzerland. This article is an open access article distributed under the terms and conditions of the Creative Commons Attribution (CC BY) license (https://creativecommons.org/licenses/by/4.0/).
Share and Cite
Baldassarre, F.; Altomare, A.; Mesto, E.; Lacalamita, M.; Dida, B.; Mele, A.; Bauer, E.M.; Puzone, M.; Tempesta, E.; Capelli, D.; et al. Structural Characterization of Low-Sr-Doped Hydroxyapatite Obtained by Solid-State Synthesis. Crystals 2023, 13, 117. https://doi.org/10.3390/cryst13010117
Baldassarre F, Altomare A, Mesto E, Lacalamita M, Dida B, Mele A, Bauer EM, Puzone M, Tempesta E, Capelli D, et al. Structural Characterization of Low-Sr-Doped Hydroxyapatite Obtained by Solid-State Synthesis. Crystals. 2023; 13(1):117. https://doi.org/10.3390/cryst13010117
Chicago/Turabian StyleBaldassarre, Francesco, Angela Altomare, Ernesto Mesto, Maria Lacalamita, Bujar Dida, Altin Mele, Elvira Maria Bauer, Massimo Puzone, Emanuela Tempesta, Davide Capelli, and et al. 2023. "Structural Characterization of Low-Sr-Doped Hydroxyapatite Obtained by Solid-State Synthesis" Crystals 13, no. 1: 117. https://doi.org/10.3390/cryst13010117