
Synthesis and Magnetic Properties of Carbon Doped and Reduced SrTiO3 Nanoparticles
 , , , ,
Abstract
:1. Introduction
2. Materials and Methods
3. Results and Discussion
4. Conclusions
Author Contributions
Funding
Institutional Review Board Statement
Informed Consent Statement
Data Availability Statement
Acknowledgments
Conflicts of Interest
References
- Ellialtioglu, S.; Wolfram, T.; Heurich, V.E. Surface states on n-type SrTiO3. Solid State Commmu. 1978, 27, 321–324. [Google Scholar] [CrossRef]
- Pemmaraju, C.D.; Sanvito, S. Ferromagnetism Driven by Intrinsic Point Defects in HfO2. Phys. Rev. Lett. 2005, 94, 217205. [Google Scholar] [CrossRef] [PubMed]
- Shein, I.R.; Ivanovskii, A.L. First principle prediction of vacancy-induced magnetism in non-magnetic perovskite SrTiO3. Phys. Lett. A 2007, 371, 155–159. [Google Scholar] [CrossRef]
- Pan, H.; Yi, J.B.; Shen, L.; Wu, R.Q.; Yang, J.H.; Lin, J.Y.; Feng, Y.P.; Ding, J.; Van, L.H.; Yin, J.H. Room-Temperature Ferromagnetism in Carbon-Doped ZnO. Phys. Rev. Lett. 2007, 99, 127201. [Google Scholar] [CrossRef] [PubMed]
- Ivanovskii, A.L. Magnetic effects induced by sp impurities and defects in nonmagnetic sp materials. Phys. Inorg. Chem. 2007, 177, 1083–1105. [Google Scholar]
- Bannikov, V.V.; Shein, I.R.; Kozhevnikov, V.L.; Ivanovskii, A.L. Magnetism without magnetic ions in non-magnetic perovskites SrTiO3, SrZrO3 and SrSnO3. J. Magn. Magn. Mater. 2008, 320, 936–942. [Google Scholar] [CrossRef]
- Máca, F.; Kudrnovský, J.; Drchal, V.; Bouzerar, G. Magnetism without magnetic impurities in ZrO2 oxide. Appl. Phys. Lett. 2008, 92, 212503. [Google Scholar] [CrossRef]
- Ye, X.J.; Zhong, W.; Xu, M.H.; Qi, X.S.; Au, C.T.; Du, Y.W. The magnetic property of carbon-doped TiO2. Phys. Lett. A 2009, 373, 3684–3687. [Google Scholar] [CrossRef]
- Hou, Z.; Terakura, K. Defect states induced by oxygen vacancies in cubic SrTiO3: First-Principles Calculations. J. Phys. Soc. Jpn. 2010, 79, 114704. [Google Scholar] [CrossRef]
- Li, N.; Yao, K.L. The electronic and optical properties of carbon-doped SrTiO3: Density functional characterization. AIP Adv. 2012, 2, 032135. [Google Scholar] [CrossRef]
- Zeng, H.; Wu, M.; Wang, H.-Q.; Zheng, J.-C.; Kang, J. Tuning the magnetic and electronic properties of strontium titanate by carbon doping. Front. Phys. 2021, 16, 43501. [Google Scholar] [CrossRef]
- Guo, Y.Y.; Liu, H.M.; Yu, D.P.; Liu, J.-M. Ferroelectricity and superparamagnetism in Sr/Ti nonstoichiometric SrTiO3. Phys. Rev. B 2012, 85, 104108. [Google Scholar] [CrossRef]
- Bahoosh, S.G.; Wesselinowa, J.M. The origin of magnetism in perovskite ferroelectric ABO3 nanoparticles (A = K, Li; B = Ta, Nb or A = Ba, Sr, Pb; B = Ti). J. Appl. Phys. 2012, 112, 053907. [Google Scholar] [CrossRef]
- Zhang, Y.; Hu, J.; Cao, E.; Sun, L.; Qin, H. Vacancy induced magnetism in SrTiO3. J. Magn. Magn. Mater. 2012, 324, 1770–1775. [Google Scholar] [CrossRef]
- Lin, C.; Demkov, A.A. Electron correlation in oxygen vacancy in SrTiO3. Phys. Rev. Lett. 2013, 111, 217601. [Google Scholar] [CrossRef]
- Zhang, S.; Guo, D.; Wang, M.; Javed, M.S.; Hu, C. Magnetism in SrTiO3 before and after UV irradiation. Appl. Surf. Sci. 2015, 335, 115–120. [Google Scholar] [CrossRef]
- Choi, H.; Song, J.D.; Lee, K.-R.; Kim, S. Correlated Visible-Light Absorption and Intrinsic Magnetism of SrTiO3 Due to oxygen deficiency: Bulk or surface effect. Inorg. Chem. 2015, 54, 3759–3765. [Google Scholar] [CrossRef]
- Liu, Y.; Zhou, W.; Wu, P. Tuning of magnetism of SrTiO3 by site-specific doping. Mater. Chem. Phys. 2015, 160, 80–86. [Google Scholar] [CrossRef]
- Altmeyer, M.; Jeschke, H.O.; Hijano-Cubelos, O.; Martins, C.; Lechermann, F.; Koepernik, K.; Santander-Syro, A.F.; Rozenberg, M.J.; Valentí, R.; Gabay, M. Magnetism, spin texture, and in-gap states: Atomic Specialization at the Surface of Oxygen-Deficient SrTiO3. Phys. Rev. Lett. 2016, 116, 157203. [Google Scholar] [CrossRef]
- Coey, J.M.D.; Venkatesan, M.; Stamenov, P. Surface magnetism of strontium titanate. J. Phys. Condens. Matter 2016, 28, 485001. [Google Scholar] [CrossRef]
- Brovko, O.O.; Tosatti, E. Controlling the magnetism of oxygen surface vacancies in SrTiO3 through charging. Phys. Rev. Mat. 2017, 1, 044405. [Google Scholar] [CrossRef] [Green Version]
- Chakraborty, B.; Nandi, P.K.; Kawazoe, Y.; Ramaniah, L.M. Room-temperature d0 ferromagnetism in carbon-doped Y2O3 for spintronic applications: A density functional theory study. Phys. Rev. B 2018, 97, 18441. [Google Scholar] [CrossRef]
- Choi, M.; Oba, F.; Tanaka, I. Role of Ti antisitelike defects in SrTiO3. Phys. Rev. Lett. 2009, 103, 185502. [Google Scholar] [CrossRef] [PubMed]
- Sundaresan, A.; Bhargavi, R.; Rangarajan, N.; Siddesh, U.; Rao, C.N.R. Ferromagnetism as a universal feature of nanoparticles of the otherwise nonmagnetic oxides. Phys. Rev. B 2006, 74, 161306. [Google Scholar] [CrossRef]
- Sundaresan, A.; Rao, C.N.R. Ferromagnetism as a universal feature of inorganic nanoparticles. Nano Today 2008, 4, 96–106. [Google Scholar] [CrossRef]
- Rice, W.D.; Ambwani, P.; Bombeck, M.; Thompson, J.D.; Haugstad, G.; Leighton, C.; Crooker, S.A. Persistent optically induced magnetism in oxygen-deficient strontium titanate. Nat. Mater. 2014, 13, 481–487. [Google Scholar] [CrossRef]
- Eliseev, E.A.; Morozovska, A.N.; Glinchuk, M.D.; Blinc, R. Anion vacancy-driven magnetism in incipient ferroelectric SrTiO3 and KTaO3 nanoparticles. J. Appl. Phys. 2011, 109, 094105. [Google Scholar] [CrossRef]
- Ishii, M.; Ohta, D.; Uehara, M.; Kimishima, Y. Vacancy-induced ferromagnetism in nano BaTiO3. Procedia Eng. 2012, 36, 578–582. [Google Scholar] [CrossRef]
- Golovina, I.S.; Kolesnik, S.P.; Bryksa, V.P.; Strelchuk, V.V.; Yanchuk, I.B.; Geifman, I.N.; Khainakov, S.A.; Svechnikov, S.V.; Morozovska, A.N. Defect driven ferroelectricity and magnetism in nanocrystalline KTaO3. Phys. B Condens. Matter 2012, 407, 614–623. [Google Scholar] [CrossRef]
- Wang, Y.F.; Shao, Y.C.; Hsieh, S.H.; Chang, Y.K.; Yeh, P.H.; Hsueh, H.C.; Chiou, J.W.; Wang, H.T.; Ray, S.C.; Tsai, H.M.; et al. Origin of magnetic properties in carbon implanted ZnO nanowires. Sci. Rep. 2018, 8, 7758. [Google Scholar] [CrossRef]
- Typek, J.; Guskos, N.; Zlnierkiewicz, G.; Pilarska, M.; Guskos, A.; Kusiak-Nejman, E.; Morawski, A.W. Magnetic properties of TiO2/graphitic carbon nanocomposites. Rev. Adv. Mater. Sci. 2019, 58, 107–122. [Google Scholar] [CrossRef] [Green Version]
- Zhang, Y.; Wang, J.; Sahoo, M.; Shimada, T.; Kitamura, T. Mechanical control of magnetism in oxygen deficient perovskite SrTiO3. Phys. Chem. Chem. Phys. 2015, 17, 27136–27144. [Google Scholar] [CrossRef] [PubMed]
- Mangalam, R.V.K.; Ray, N.; Waghmare, U.V.; Sundaresan, A.; Rao, C.N.R. Multiferroic properties of nanocrystalline BaTiO3. Solid State Commun. 2009, 149, 1–5. [Google Scholar] [CrossRef]
- Chang, C.-W.; Hu, C. Graphene oxide-derived carbon-doped SrTiO3 for highly efficient photocatalytic degradation of organic pollutants under visible light irradiation. Chem. Eng. J. 2020, 383, 123116. [Google Scholar] [CrossRef]
- Wang, J.; Li, H.; Li, H.; Yin, S.; Sato, T. Preparation and photocatalytic activity of visible light-active sulfur and nitrogen co-doped SrTiO3. Solid State Sci. 2009, 11, 182–188. [Google Scholar] [CrossRef]
- Sarkar, D.; Chu, M.; Cho, S.-J.; Kim, Y.I.; Basu, B. Synthesis and Morphological Analysis of Titanium Carbide Nanopowder. J. Am. Ceram. Soc. 2009, 92, 2877–2882. [Google Scholar] [CrossRef]
- Dewan, M.A.R.; Zhang, G.; Ostrovski, O. Carbothermal reduction of titania in different gas atmospheres. Metall. Mater. Trans. B 2009, 40, 62–69. [Google Scholar] [CrossRef]
- Chen, Y.; Deng, Y.; Zhang, H.; Wang, L.; Ma, J. A Novel and Simple Route to Synthesis Nanocrystalline Titanium Carbide via the Reaction of Titanium Dioxide and Different Carbon Source. Mater. Sci. Appl. 2011, 2, 1622–1626. [Google Scholar] [CrossRef]
- Strizhkov, B.V.; Lapitzkii, A.V.; Vlasov, L.G.; Tsvetkov, A.I. Produktion of titanium oxalates of divalent metals and a physical-chemical study of their thermal decomposition. Dokl. Akad. Nauk SSSR 1960, 133, 1347–1349. [Google Scholar]
- Hashishin, T.; Yamamoto, T.; Ohyanagi, M.; Munir, Z.A. Simultaneous synthesis and densification of titanium oxycarbide, Ti(C,O), through gas–solid combustion. J. Am. Ceram. Soc. 2003, 86, 2067–2073. [Google Scholar] [CrossRef]
- Miller, D.N.; Azad, A.K.; Delpouve, H.; Quazuguel, L.; Zhou, J.; Sinha, A.; Wormald, P.; Irvine, J.T.S. Studies on the crystal structure, magnetic and conductivity properties of titanium oxycarbide solid solution (TiO1−xCx). J. Mater. Chem. A 2016, 4, 5730–5736. [Google Scholar] [CrossRef]
- Habibi, S.; Jamshidi, M. Sol–gel synthesis of carbon-doped TiO2 nanoparticles based on microcrystalline cellulose for efficient photocatalytic degradation of methylene blue under visible light. Environ. Technol. 2020, 41, 3233–3247. [Google Scholar] [CrossRef] [PubMed]
- Makarova, M.; Dejneka, A.; Franc, J.; Drahokoupil, J.; Jastrabik, L.; Trepakov, V. Soft chemistry preparation methods and properties of strontium titanate nanoparticles. Opt. Mater. 2010, 32, 803–806. [Google Scholar] [CrossRef]
- Makarova, M.; Drahokoupil, J.; Bykov, P.; Dejneka, A.; Dlabacek, Z.; Jastrabik, L.; Trepakov, V.; Sazama, P.; Franc, J.; Okawa, Y.; et al. Size effect on the structure and optical properties in nanocrystalline SrTiO3. e-J. Surf. Sci. Nanotechnol. 2012, 10, 406–410. [Google Scholar] [CrossRef]
- Lee, J.S.; Khim, Z.G.; Park, Y.D.; Norton, D.P.; Theodoropoulou, N.A.; Hebard, A.F.; Budai, J.D.; Boatner, L.A.; Pearton, S.J.; Wilson, R.G. Magnetic properties of Co- and Mn-implanted BaTiO3, SrTiO3 and KTaO3. Solid-State Elect. 2003, 47, 2225–2230. [Google Scholar] [CrossRef]
- Berciu, M.; Bhatt, R.N. Effects of Disorder on Ferromagnetism in Diluted Magnetic Semiconductors. Phys. Rev. Lett. 2001, 87, 107203. [Google Scholar] [CrossRef] [PubMed]
- Goodenough, J.B.; Zhou, J.-S. Localized to itinerant electronic transition in transition-metal oxides with the perovskite structure. Chem. Mater. 1998, 10, 2980–2993. [Google Scholar] [CrossRef]
- Goodenough, J.B. Electronic and ionic transport properties and other physical aspects of perovskites. Rep. Prog. Phys. 2004, 67, 1915–1993. [Google Scholar] [CrossRef]
- Reyes-Garcia, E.A.; Sun, Y.; Reyes-Gil, K.R.; Raftery, D. Solid-state NMR and EPR analysis of carbon-doped titanium dioxide photocatalysts (TiO(2−)(x)C(x)). Solid State Nucl. Magn. Reson. 2009, 35, 74–81. [Google Scholar]
- Gurlo, A.; Ivanovskaya, M.; Pfau, A.; Weimar, U.; Gospel, W. Sol-gel prepared In2O3 thin films. Thin Solid Films 1997, 307, 288–293. [Google Scholar] [CrossRef]
- Minnekhanov, A.A.; Deygen, D.M.; Konstantinova, E.A.; Vorontsov, A.S.; Kashkarov, P.K. Paramagnetic properties of carbon-doped titanium dioxide. Nanoscale Res. Lett. 2012, 7, 333. [Google Scholar] [CrossRef] [PubMed]
- Konstantinova, E.A.; Kokorin, A.I.; Sakthivel, S.; Kisch, H.; Lips, K. Carbon-doped titanium dioxide: Visible light photocatalysis and EPR investigation. Chimia 2007, 61, 810–814. [Google Scholar] [CrossRef]
- Carrasco, J.; Illas, F.; Lopez, N.; Kotomin, E.A.; Zhukovskii, Y.F.; Piskunov, S.; Maier, J.; Hermansson, K. First principal simulations of F centers in cubic SrTiO3. Phys. Status Solidi (C) 2005, 2, 153–158. [Google Scholar] [CrossRef]
- Carrasco, J.; Illas, F.; Lopez, N.; Kotomin, E.A.; Zhukovskii, Y.F.; Evarestov, R.A.; Mastrikov, Y.A.; Piskunov, S.; Maier, J. First-principles calculations of the atomic and electronic structure of F centers in the bulk and on the (001) surface of SrTiO3. Phys. Rev. B 2006, 73, 064196. [Google Scholar] [CrossRef]
- Alexandrov, V.E.; Kotomin, E.A.; Maier, J.; Evarestov, R.A. First-principles study of bulk and surface oxygen vacancies in SrTiO3 crystal. Eur. Phys. J. B 2009, 72, 53–57. [Google Scholar] [CrossRef]
- Eglitis, R.I.; Kotomin, E.A.; Popov, A.I.; Kruchinin, S.P.; Jia, R. Comparative ab initio calculations of SrTiO3, BaTiO3, PbTiO3, and SrZrO3 (001) and (111) surfaces as well as oxygen vacancies. Low Temp. Phys. 2022, 48, 87–96. [Google Scholar] [CrossRef]
- Makarova, T.L. Magnetic properties of carbon structures. Semiconductors 2004, 38, 615–638. [Google Scholar] [CrossRef]
- Zitkova, J.; Zdansky, K.; Sroubek, Z. The electronic paramagnetic resonance in reduced BaTiO3 crystals. Czechoslov. J. Phys. B 1967, 17, 636–641. [Google Scholar] [CrossRef]
- Engelen, P.P.J.V.; Hennig, J.C.M. Electronic structure of Ti3+ centre in SrTiO3. Phys. Lett. A 1967, 25, 733–735. [Google Scholar] [CrossRef]
- Muller, K.A. Resonance paramagnetique du Cr3+ dans des monocristaux de SrTiO3. Arch. Sci. 1958, 11, 150–152. [Google Scholar]
- Mueller, K.A. Paramagnetic resonance and optical absorption of transition element ions in SrTiO3 and LaAlO2. In Proceedings of the First International Conference on Paramagnetic Resonance, Jerusalem, Israel, 16–20 July 1962; Low, W., Ed.; Academic Press: New York, NY, USA, 1963; pp. 17–43. [Google Scholar]
- Glinchuk, M.D.; Bykov, I.P.; Slipenyuk, A.M.; Laguta, V.V.; Jastrabik, L. ESR study of impurities in strontium titanate films. Phys. Solid State 2001, 43, 841–844. [Google Scholar] [CrossRef]
- Dashdorj, J.; Zvanut, M.E.; Stanley, L.J. Iron-related defect levels in SrTiO3 measured by photoelectron paramagnetic resonance spectroscopy. J. Appl. Phys. 2010, 107, 083513. [Google Scholar] [CrossRef]
- Trepakov, V.A.; Kapphan, S.A.; Bednorz, G.; Gregora, I.; Jastrabik, L. Dielectric-related R- zero-phonon emission line shift of Cr3+ in SrTiO3:Ca. Ferroelectrics 2004, 304, 83–86. [Google Scholar] [CrossRef]
- Brandão, F.D.; Pinheiro, M.V.B.; Ribeiro, G.M.; Medeiros-Ribeiro, G.; Krambrock, K. Identification of two light-induced charge states of the oxygen vacancy in single-crystalline rutile TiO2. Phys. Rev. B 2009, 80, 235204. [Google Scholar] [CrossRef]
- Brant, A.T.; Golden, E.M.; Giles, N.C.; Yang, S.; Sarker, M.A.R.; Watauchi, S.; Nagao, M.; Tanaka, I.; Tryk, D.A.; Manivannan, A.; et al. Triplet ground state of the neutral oxygen-vacancy donor in rutile TiO2. Phys. Rev. B 2014, 89, 115206. [Google Scholar] [CrossRef]


| Powder Descriptions | Designation |
|---|---|
| SrTiO3 initial SrTiO(C2O4)2 precursor annealed at 700 °C in air | If |
| SrTiO3 fine reduced, If annealed at 700 °C in H2/Ar flow, | Rf |
| SrTiO3 coarse reduced If annealed at 1000 °C in H2/Ar flow | Rc |
| SrTiO3 fine C-doped SrTiO(C2O4)2 precursor annealed at 700 °C in H2/Ar flow | Cf |
| SrTiO3 white Cf oxidized at 700 °C in air | OCf |
| SrTiO3 coarse C-doped SrTiO(C2O4)2 precursor annealed at 1000 °C in H2/Ar flow | Cc |
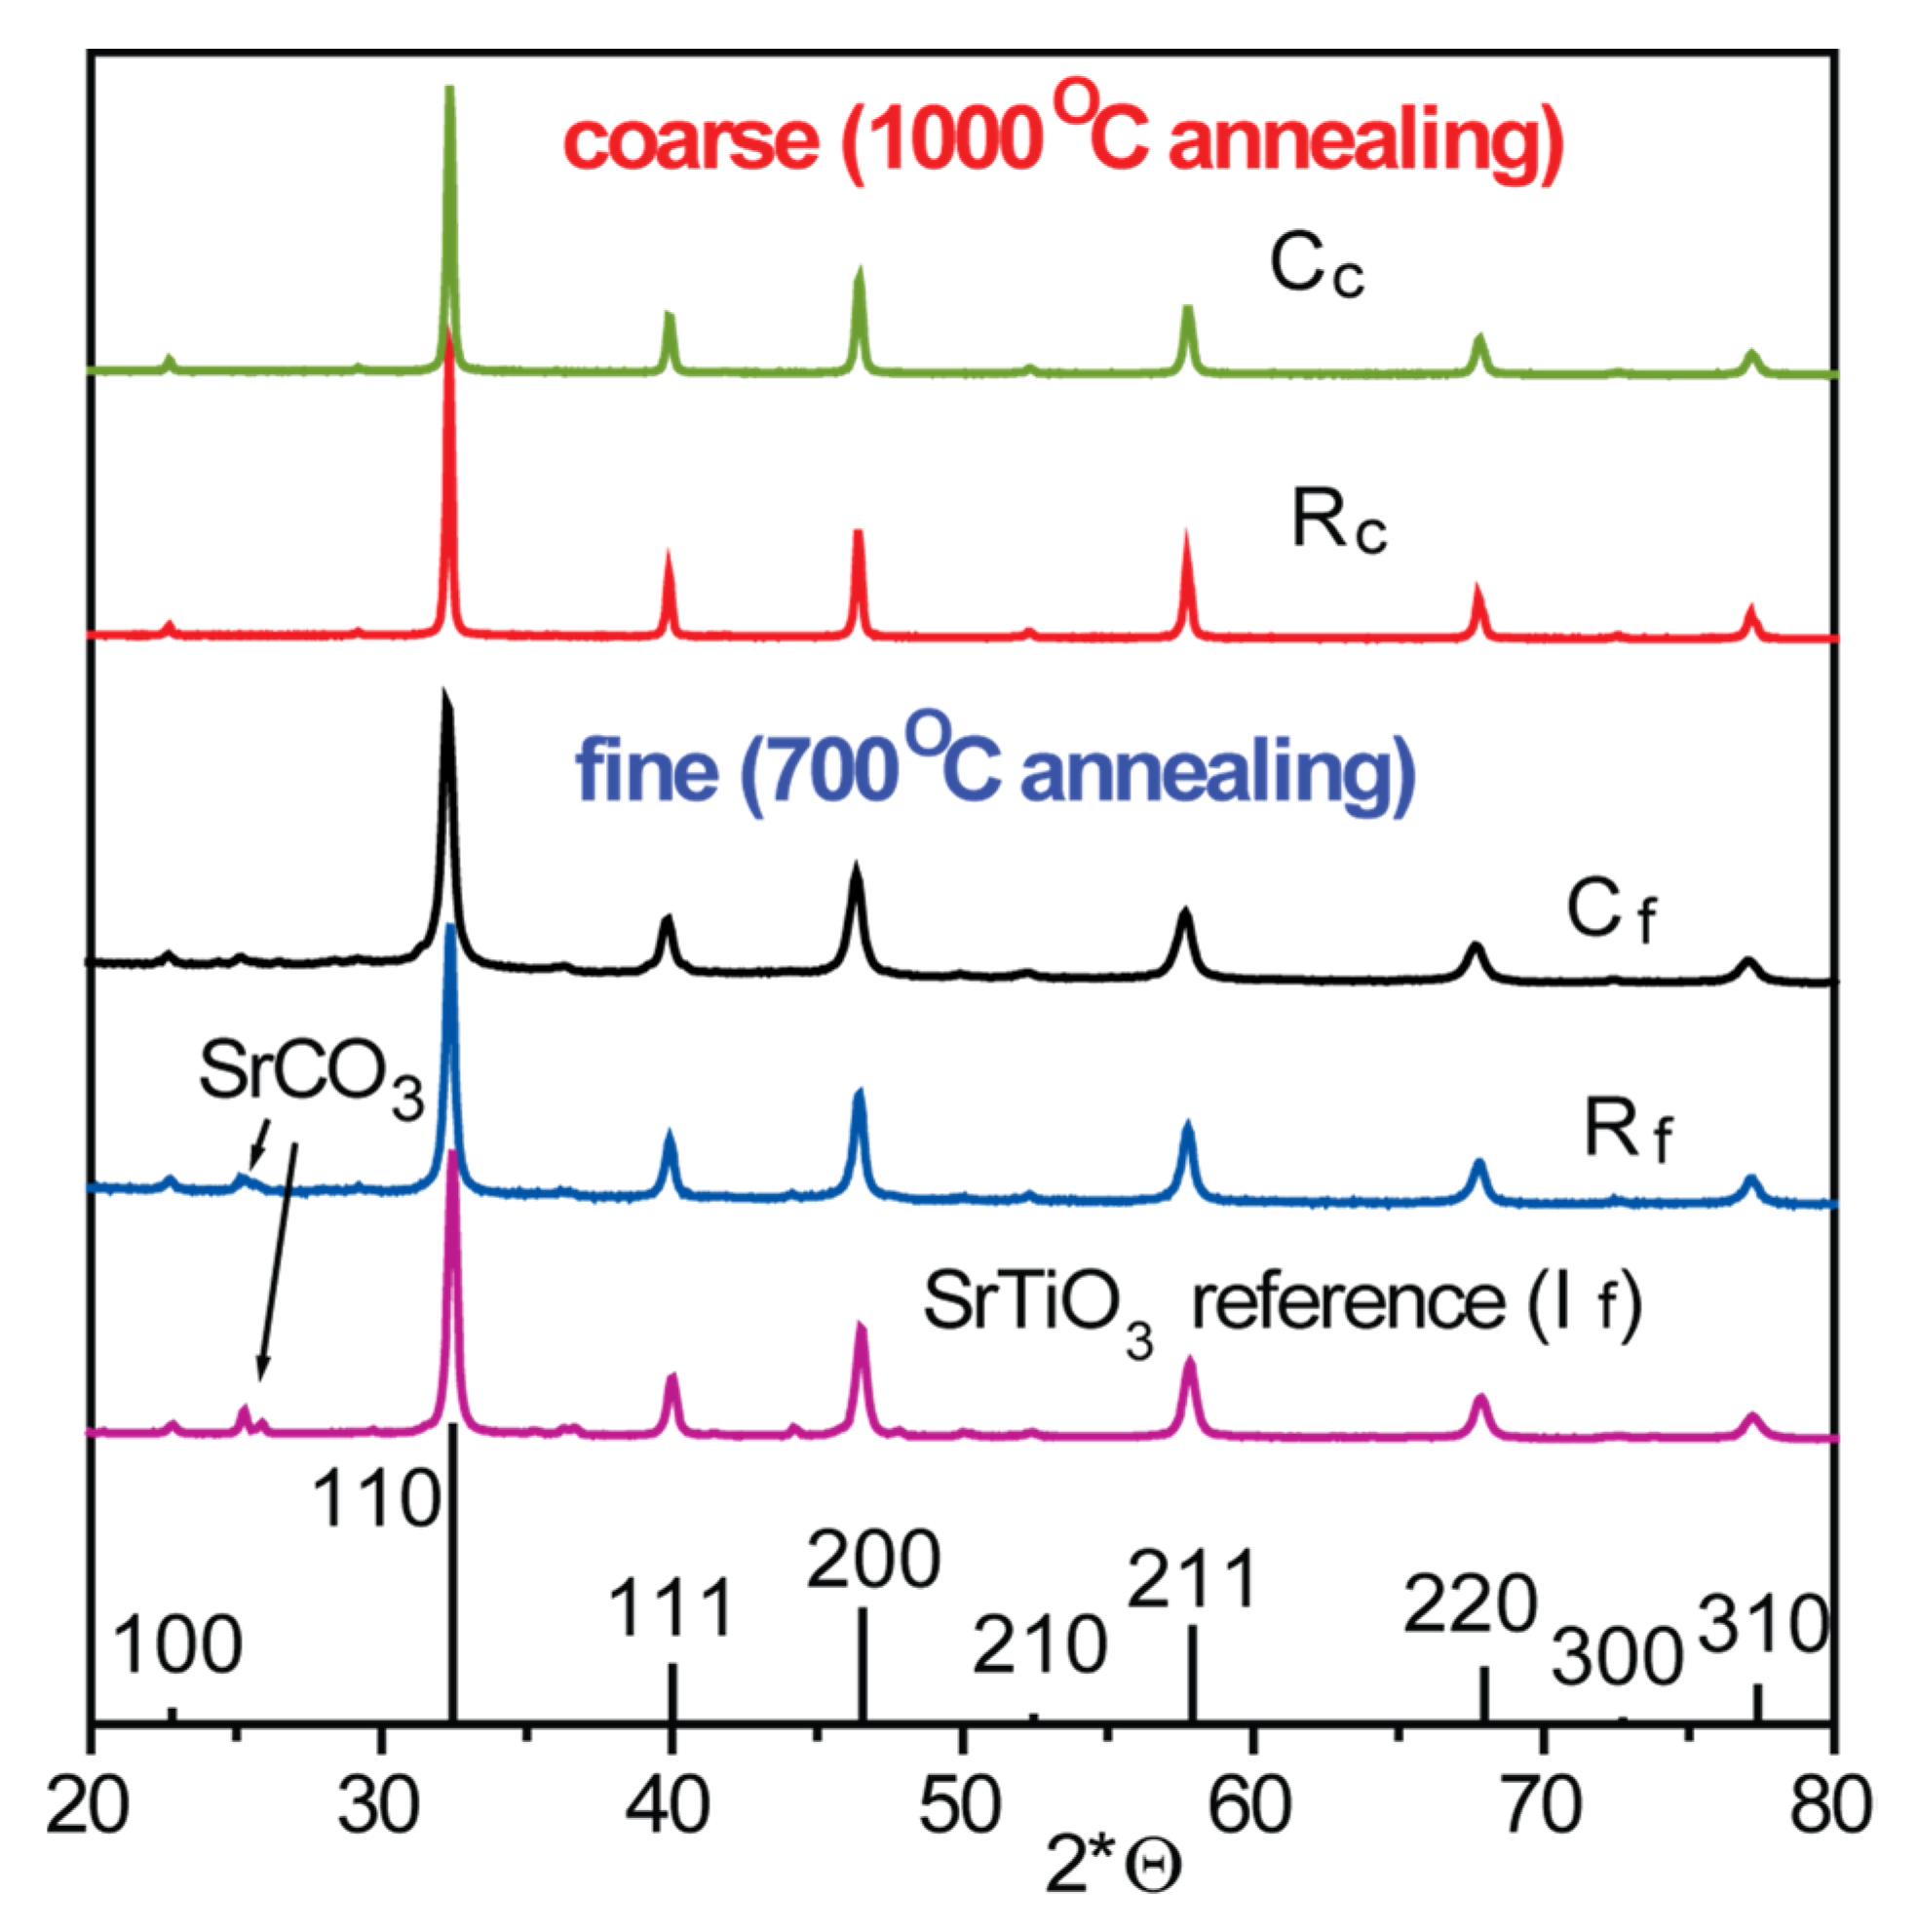
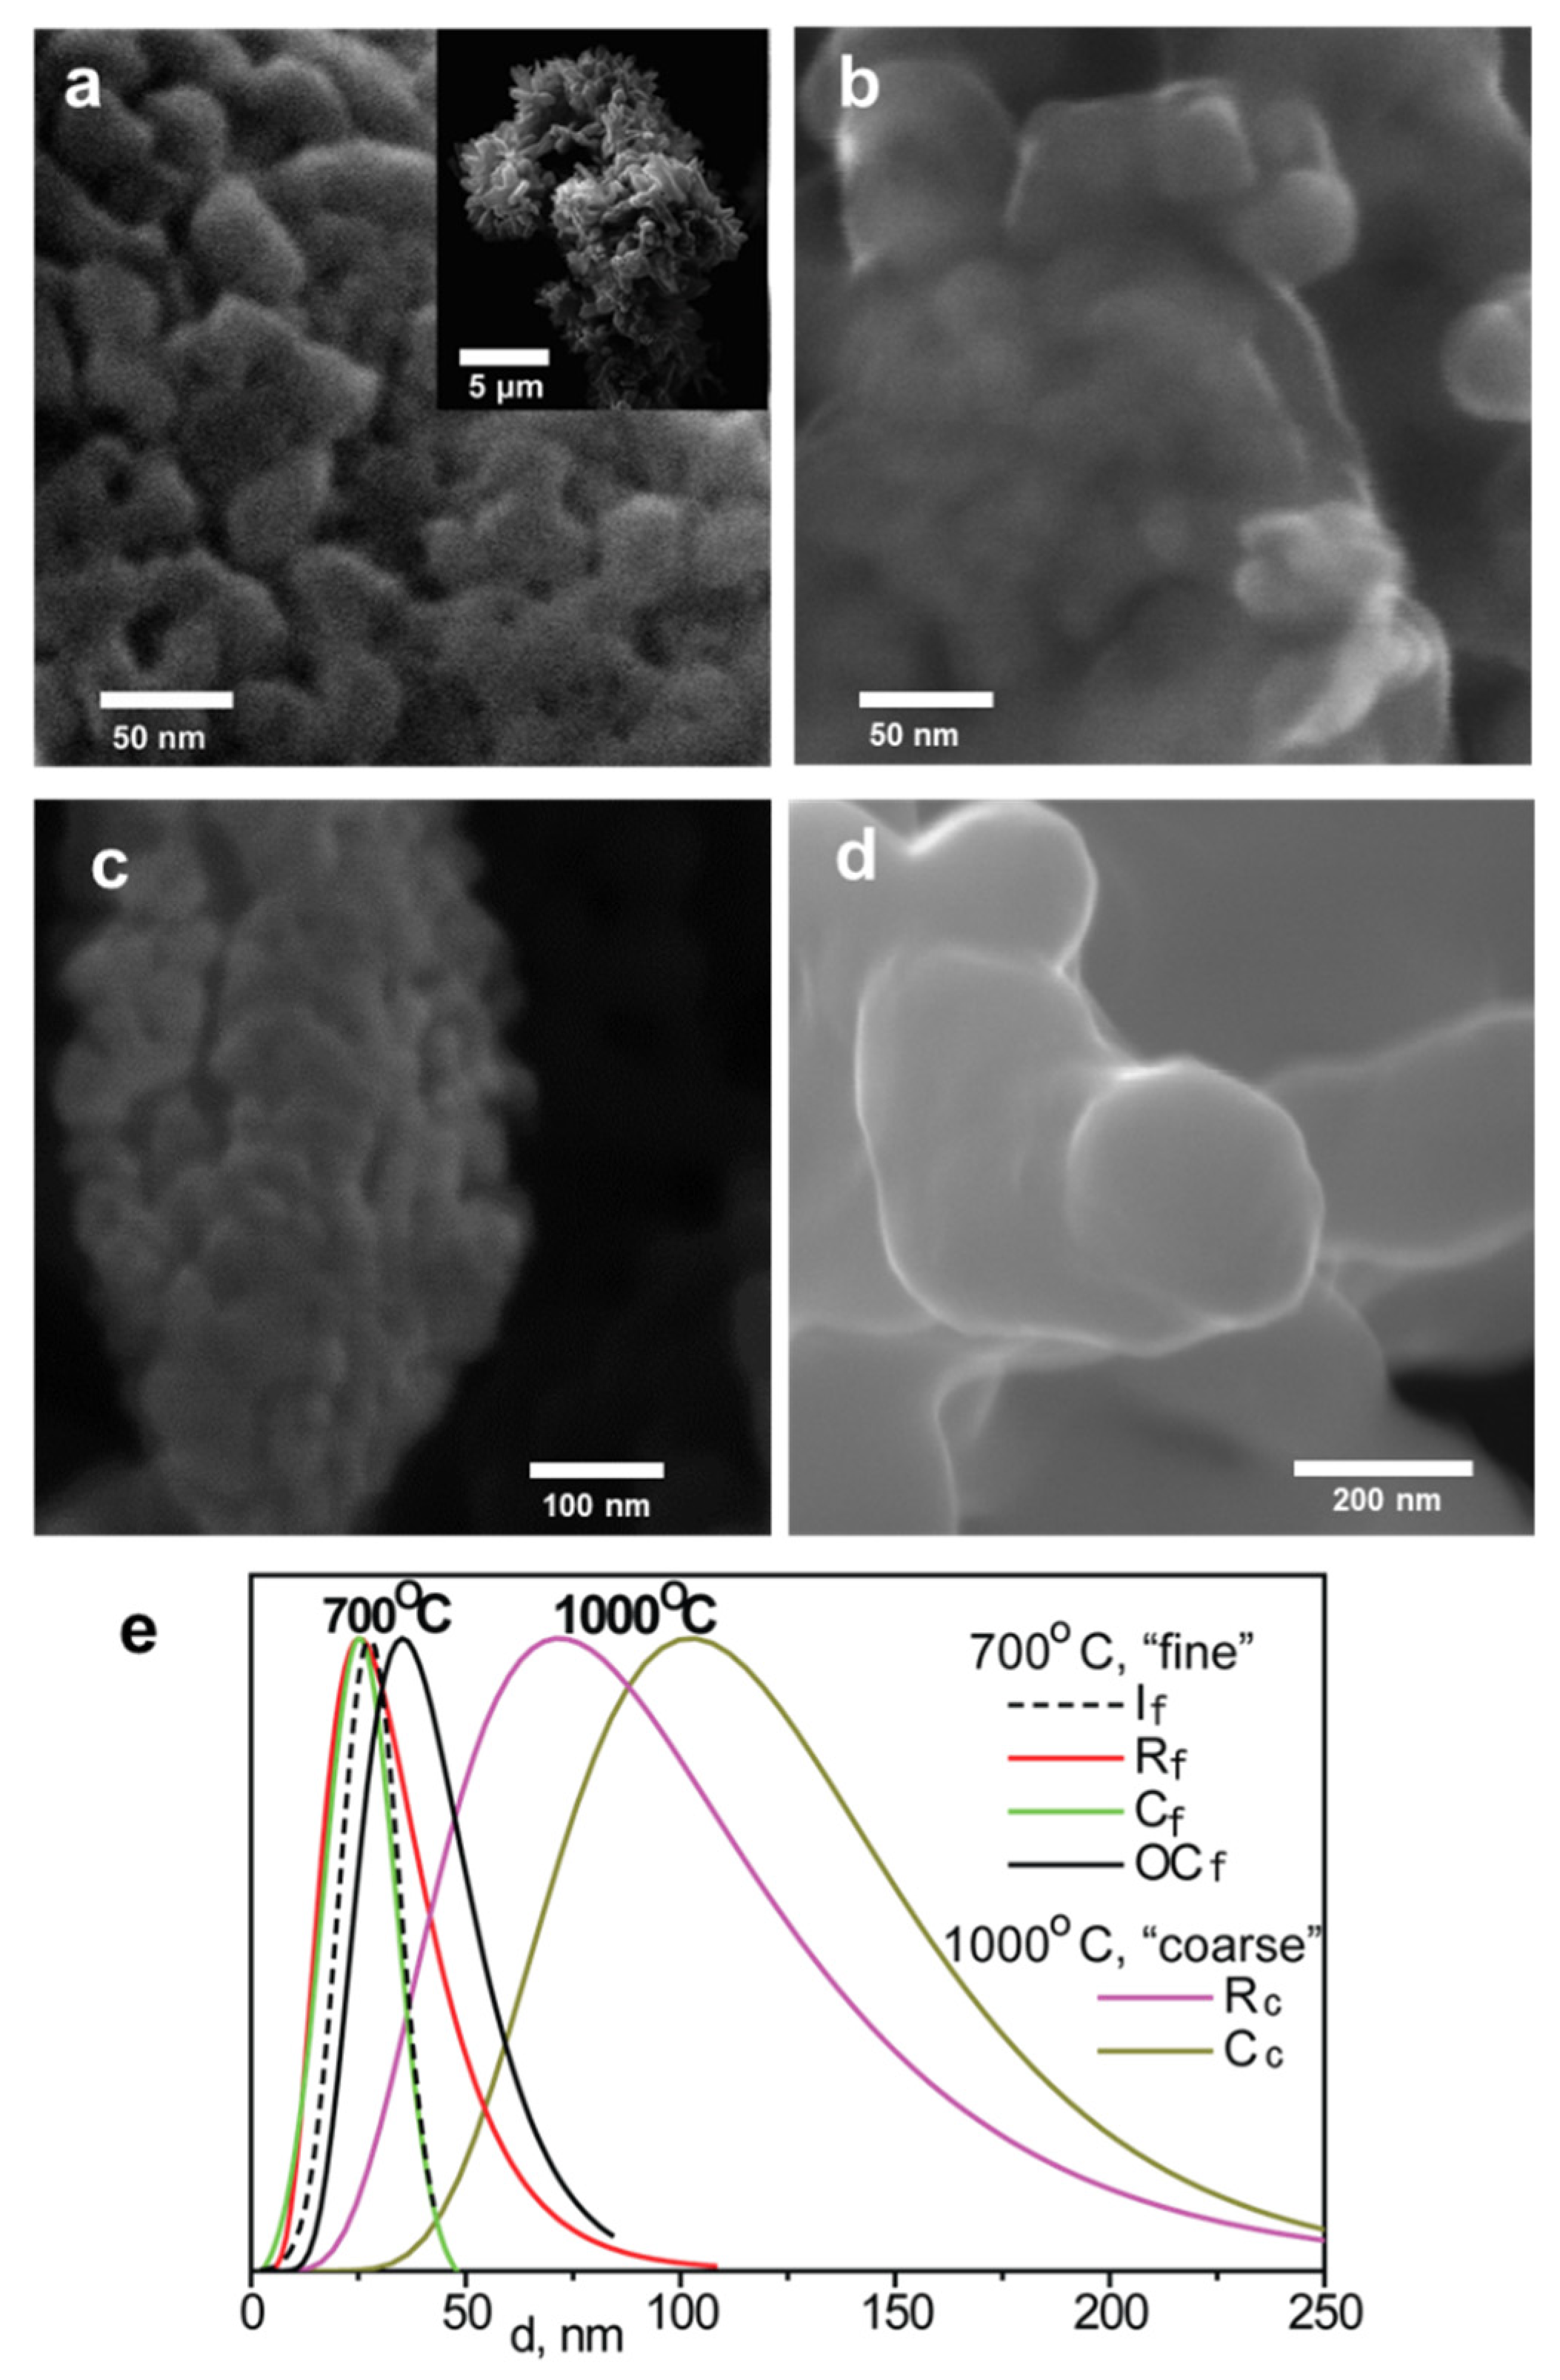
| Designation | a, Å | Particle Size, nm |
|---|---|---|
| If | 3.909 | 28 |
| Rf | 3.910 | 25 |
| Cf | 3.913 | 25 |
| OCf | 3.913 | 40 |
| Cc | 3.907 | 100 |
| Rc | 3.907 | 70 |
Publisher’s Note: MDPI stays neutral with regard to jurisdictional claims in published maps and institutional affiliations. |
© 2022 by the authors. Licensee MDPI, Basel, Switzerland. This article is an open access article distributed under the terms and conditions of the Creative Commons Attribution (CC BY) license (https://creativecommons.org/licenses/by/4.0/).
Share and Cite
Makarova, M.V.; Prokhorov, A.; Stupakov, A.; Kopeček, J.; Drahokoupil, J.; Trepakov, V.; Dejneka, A. Synthesis and Magnetic Properties of Carbon Doped and Reduced SrTiO3 Nanoparticles. Crystals 2022, 12, 1275. https://doi.org/10.3390/cryst12091275
Makarova MV, Prokhorov A, Stupakov A, Kopeček J, Drahokoupil J, Trepakov V, Dejneka A. Synthesis and Magnetic Properties of Carbon Doped and Reduced SrTiO3 Nanoparticles. Crystals. 2022; 12(9):1275. https://doi.org/10.3390/cryst12091275
Chicago/Turabian StyleMakarova, Marina V., Andrey Prokhorov, Alexander Stupakov, Jaromir Kopeček, Jan Drahokoupil, Vladimir Trepakov, and Alexander Dejneka. 2022. "Synthesis and Magnetic Properties of Carbon Doped and Reduced SrTiO3 Nanoparticles" Crystals 12, no. 9: 1275. https://doi.org/10.3390/cryst12091275