
Synthesis, Characterization, Hirshfeld Surface Analysis, Crystal Structure and Molecular Modeling Studies of 1-(4-(Methoxy(phenyl)methyl)-2-methylphenoxy)butan-2-one Derivative as a Novel α-Glucosidase Inhibitor

 , , ,
, , ,
Abstract
:1. Introduction
2. Materials and Methods
2.1. Chemicals and Instrumentation
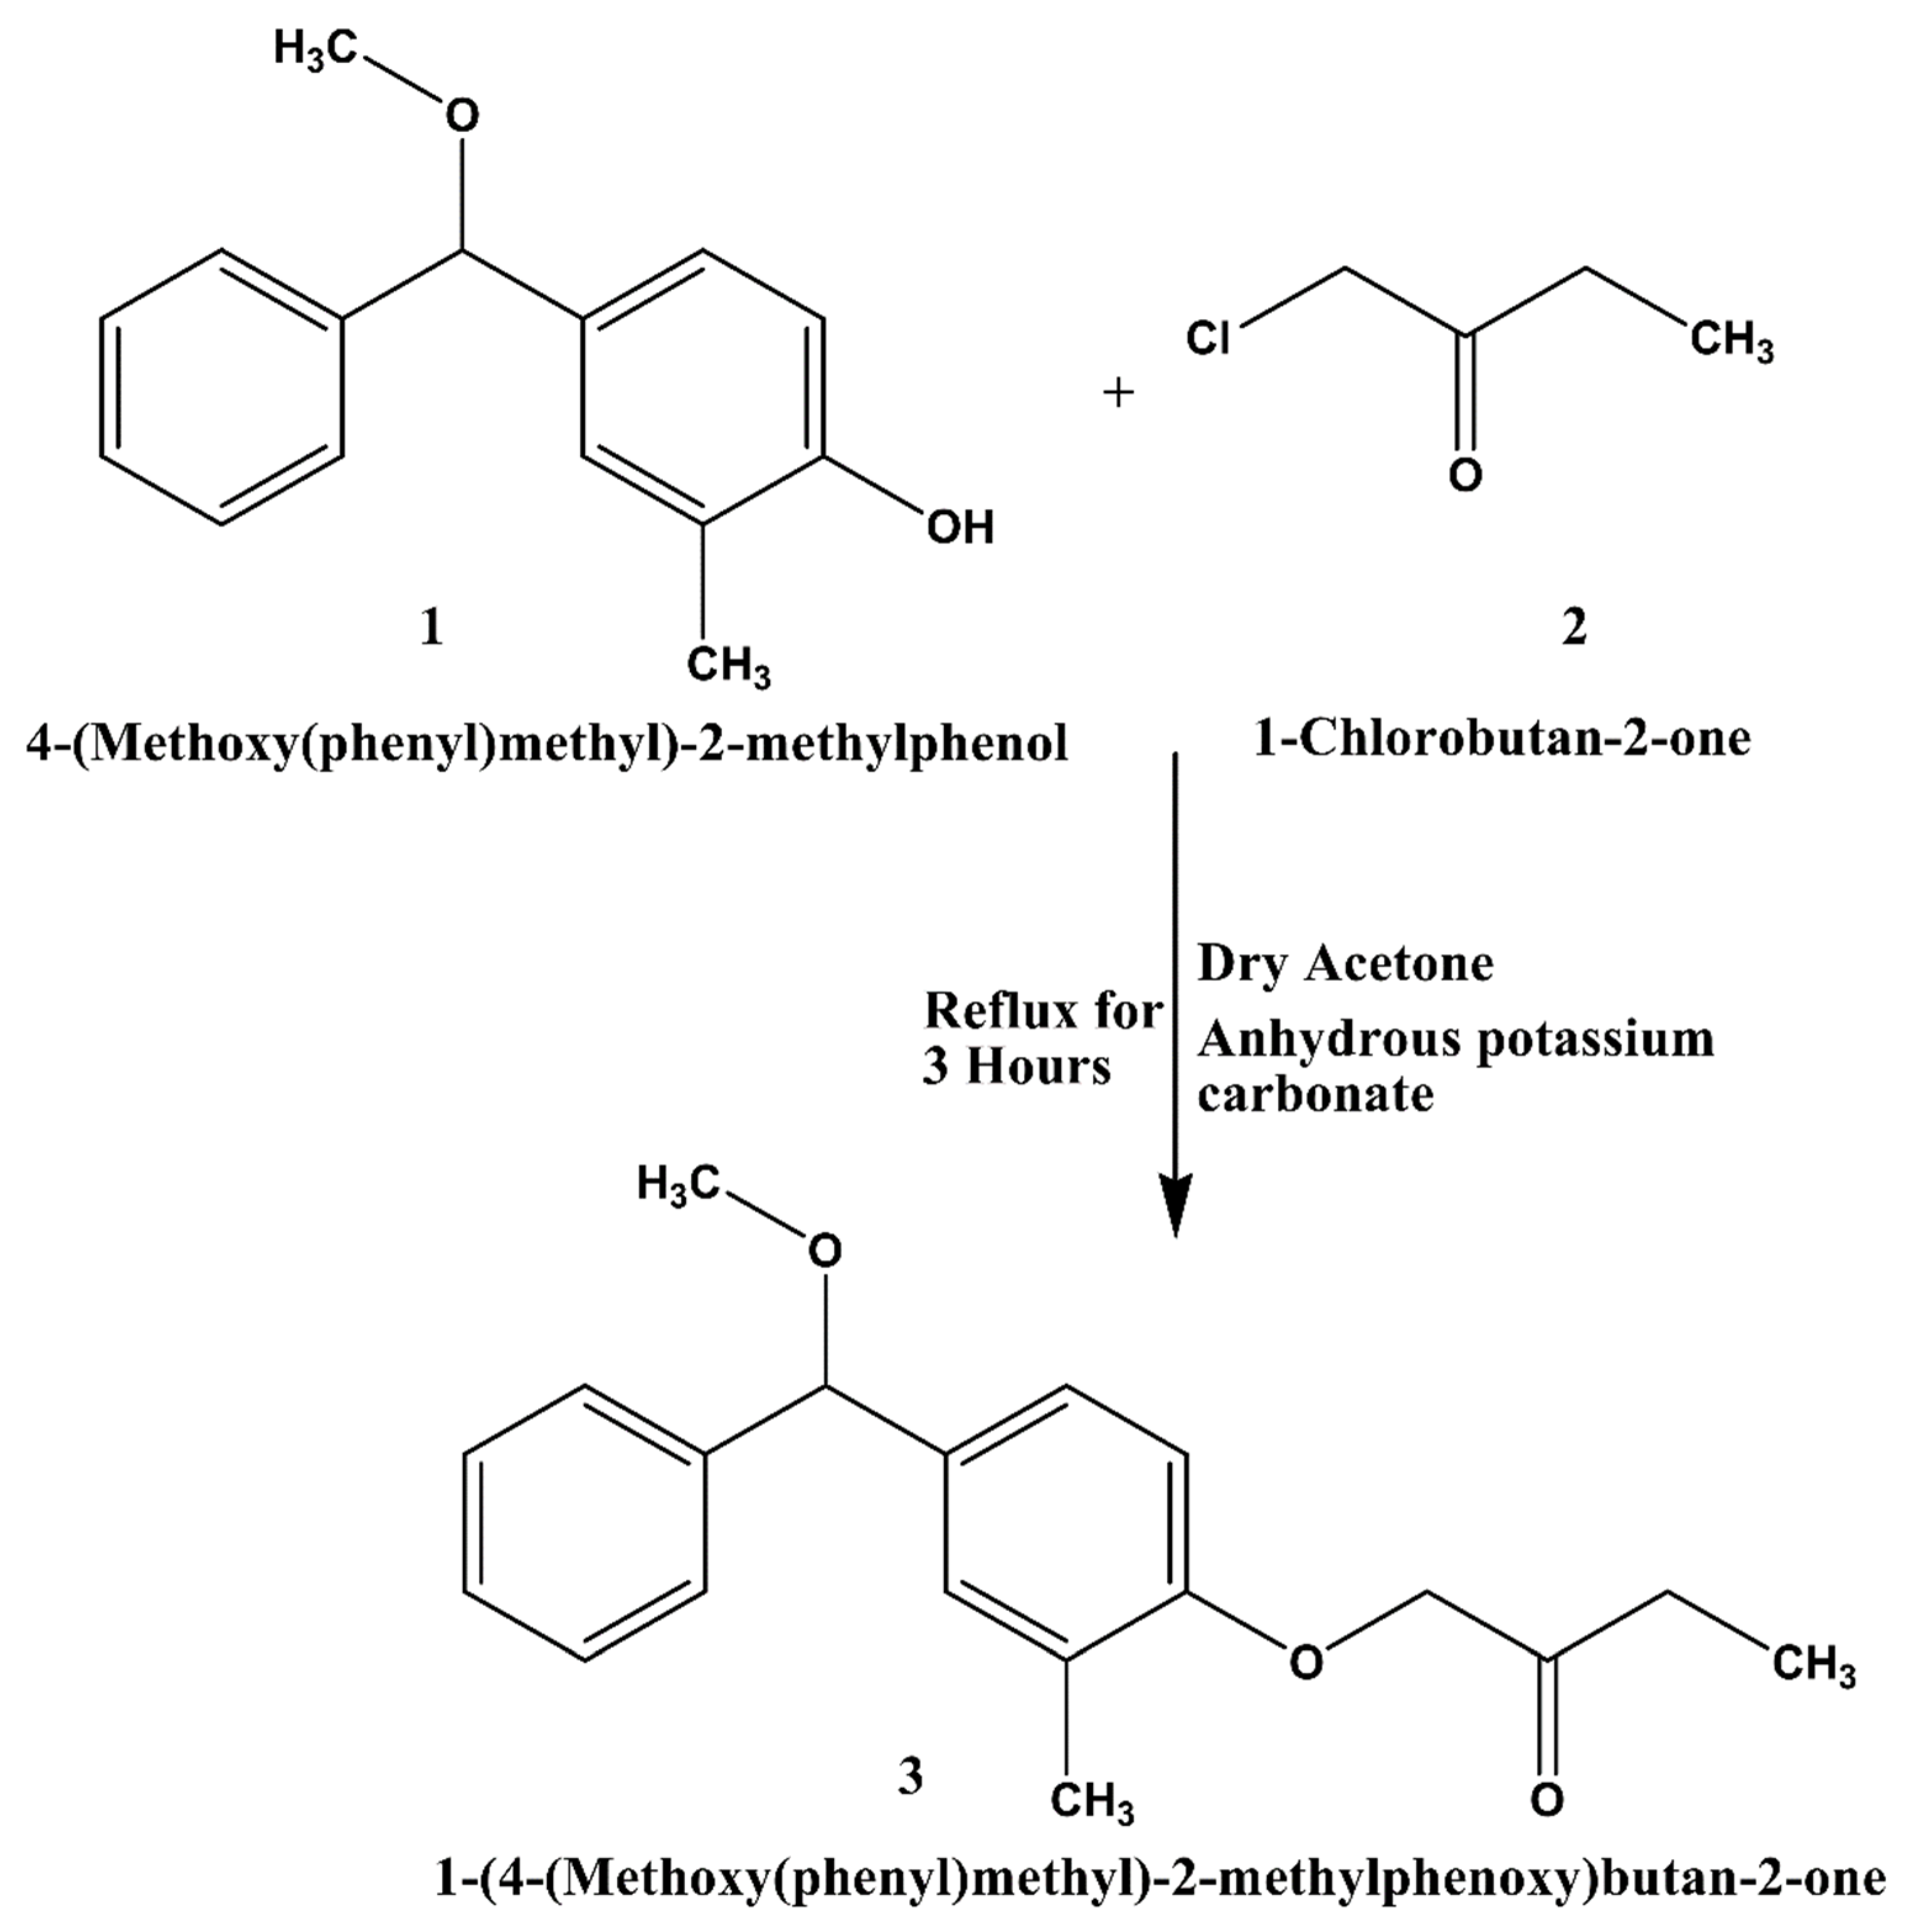
2.2. Synthesis of 1-(4-(Methoxy(phenyl)methyl)-2-methylphenoxy)butan-2-one (3)
2.3. X-ray Crystallographic Analysis
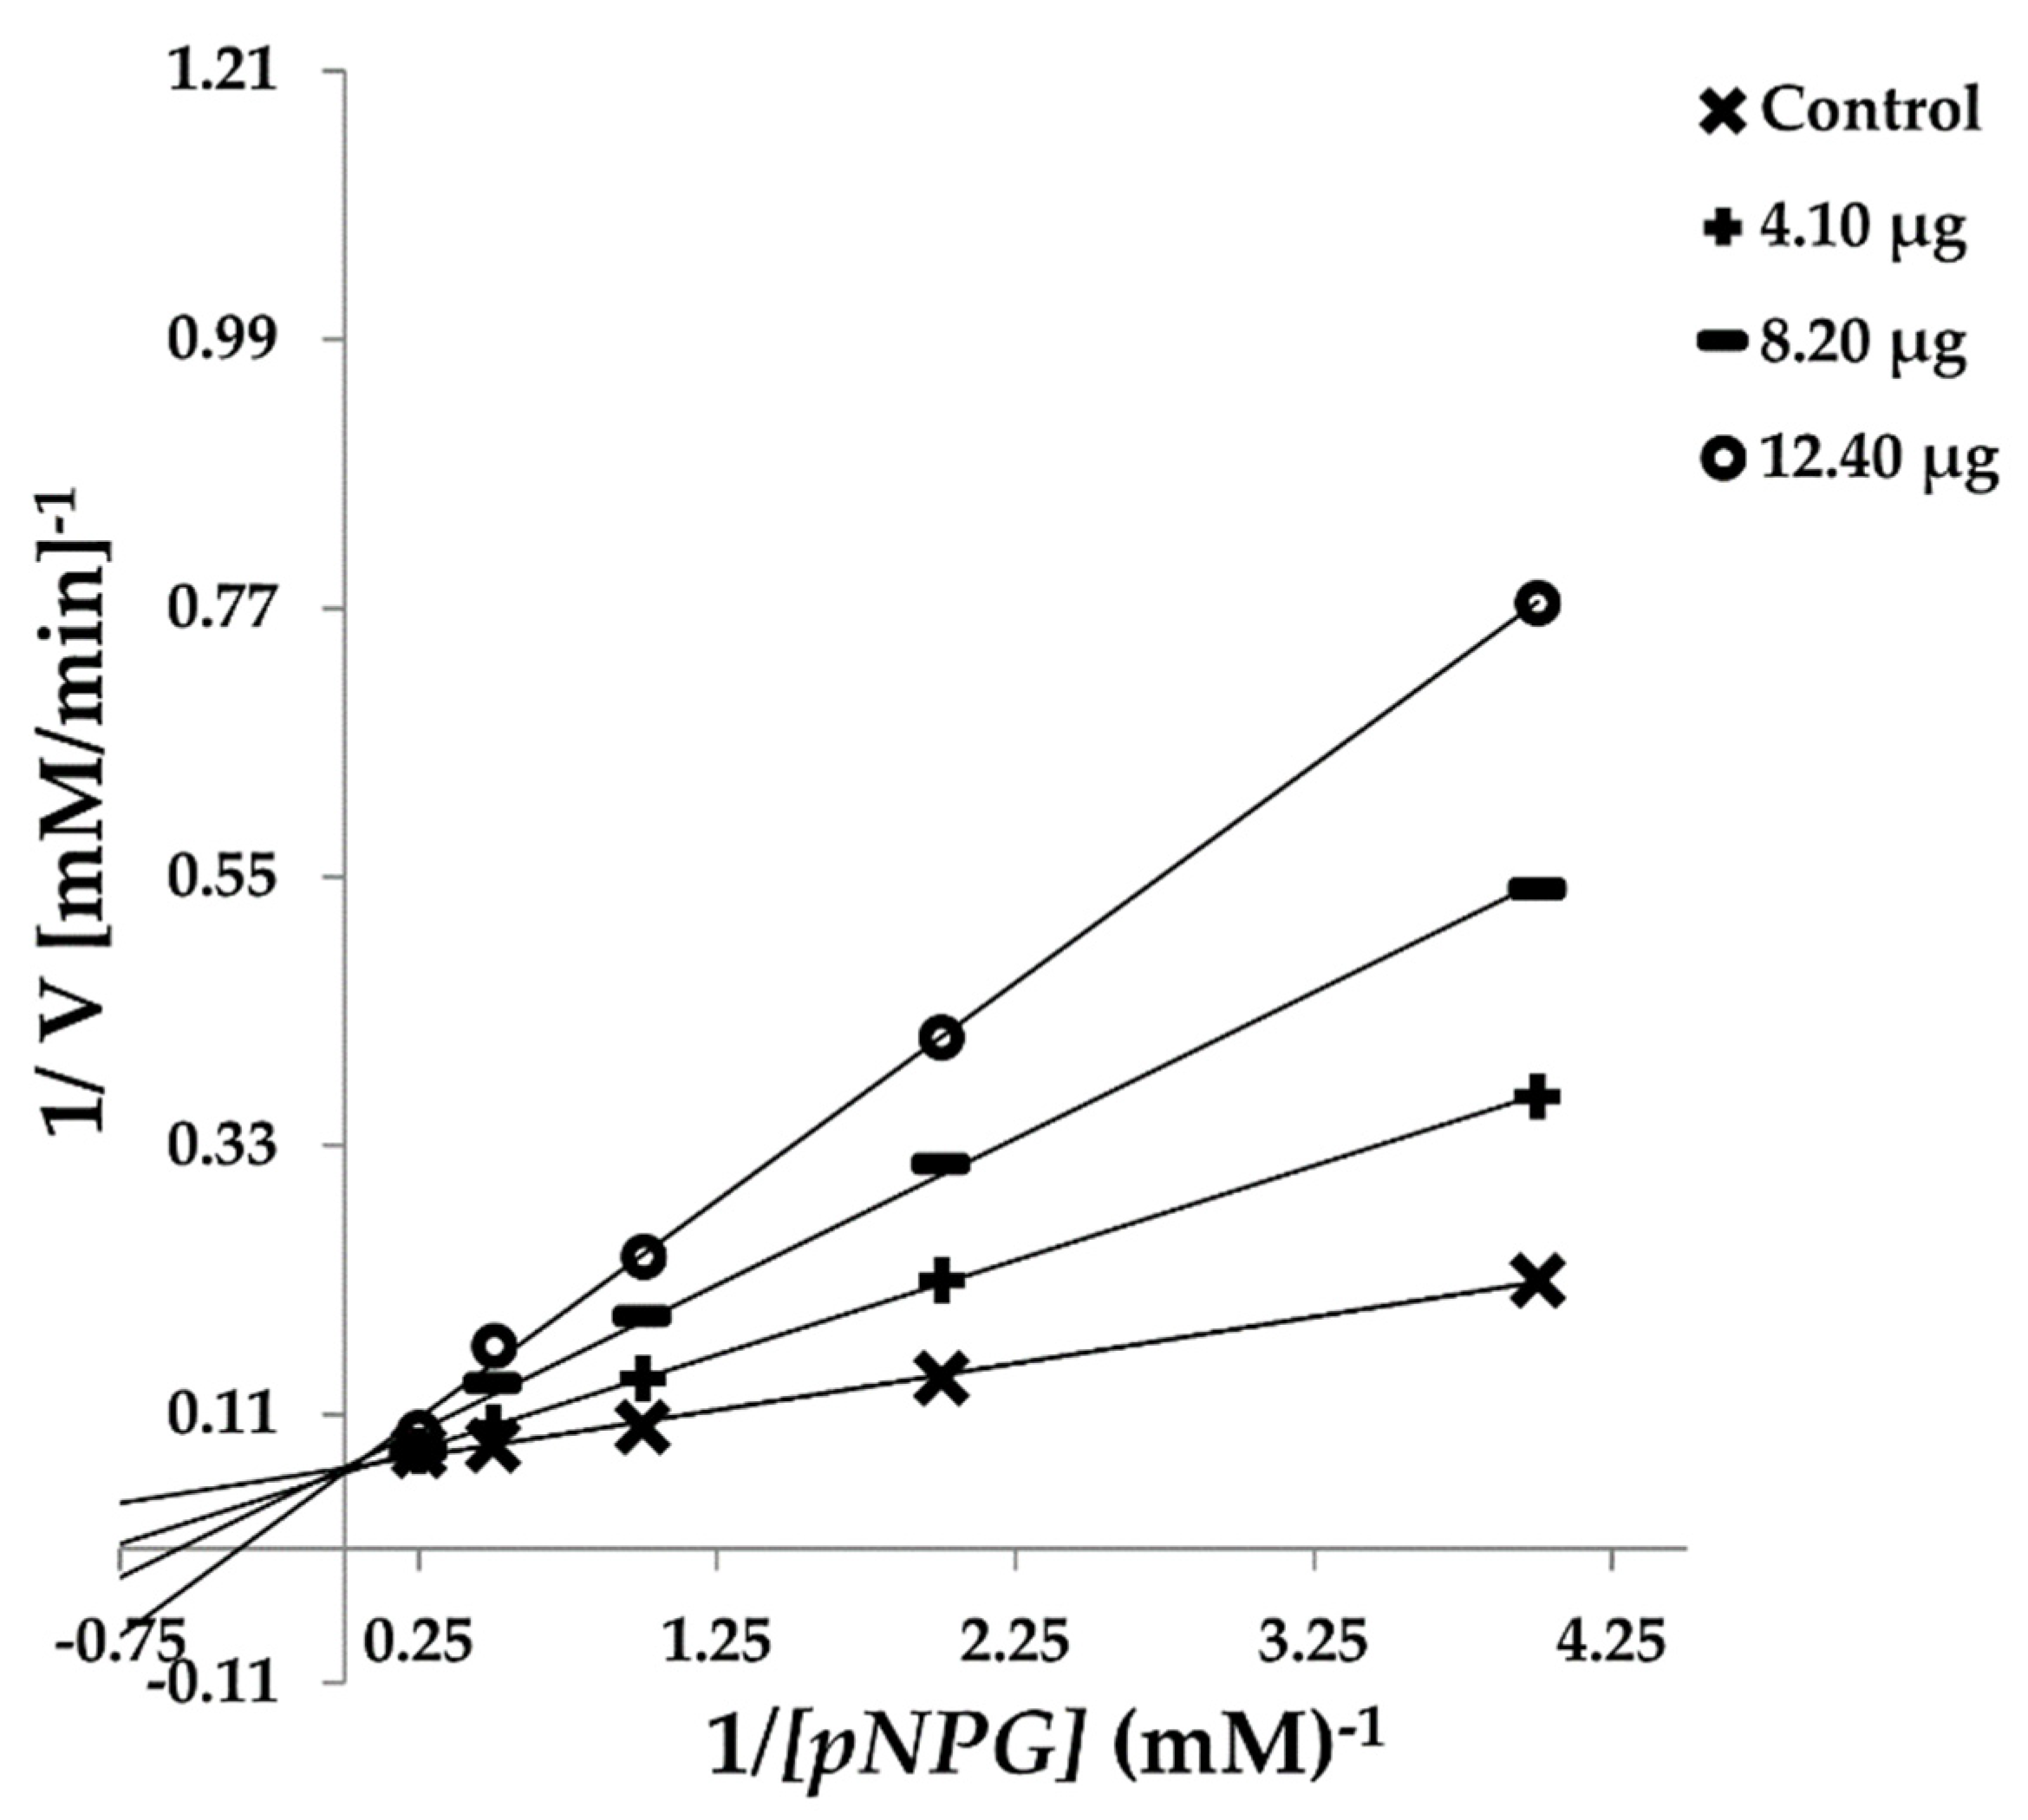
2.4. α-Glucosidase Inhibition Assay and Kinetics
2.5. Molecular Docking Simulation
2.6. Molecular Dynamics Simulation
2.7. Binding Free Energy Calculations
3. Results and Discussion
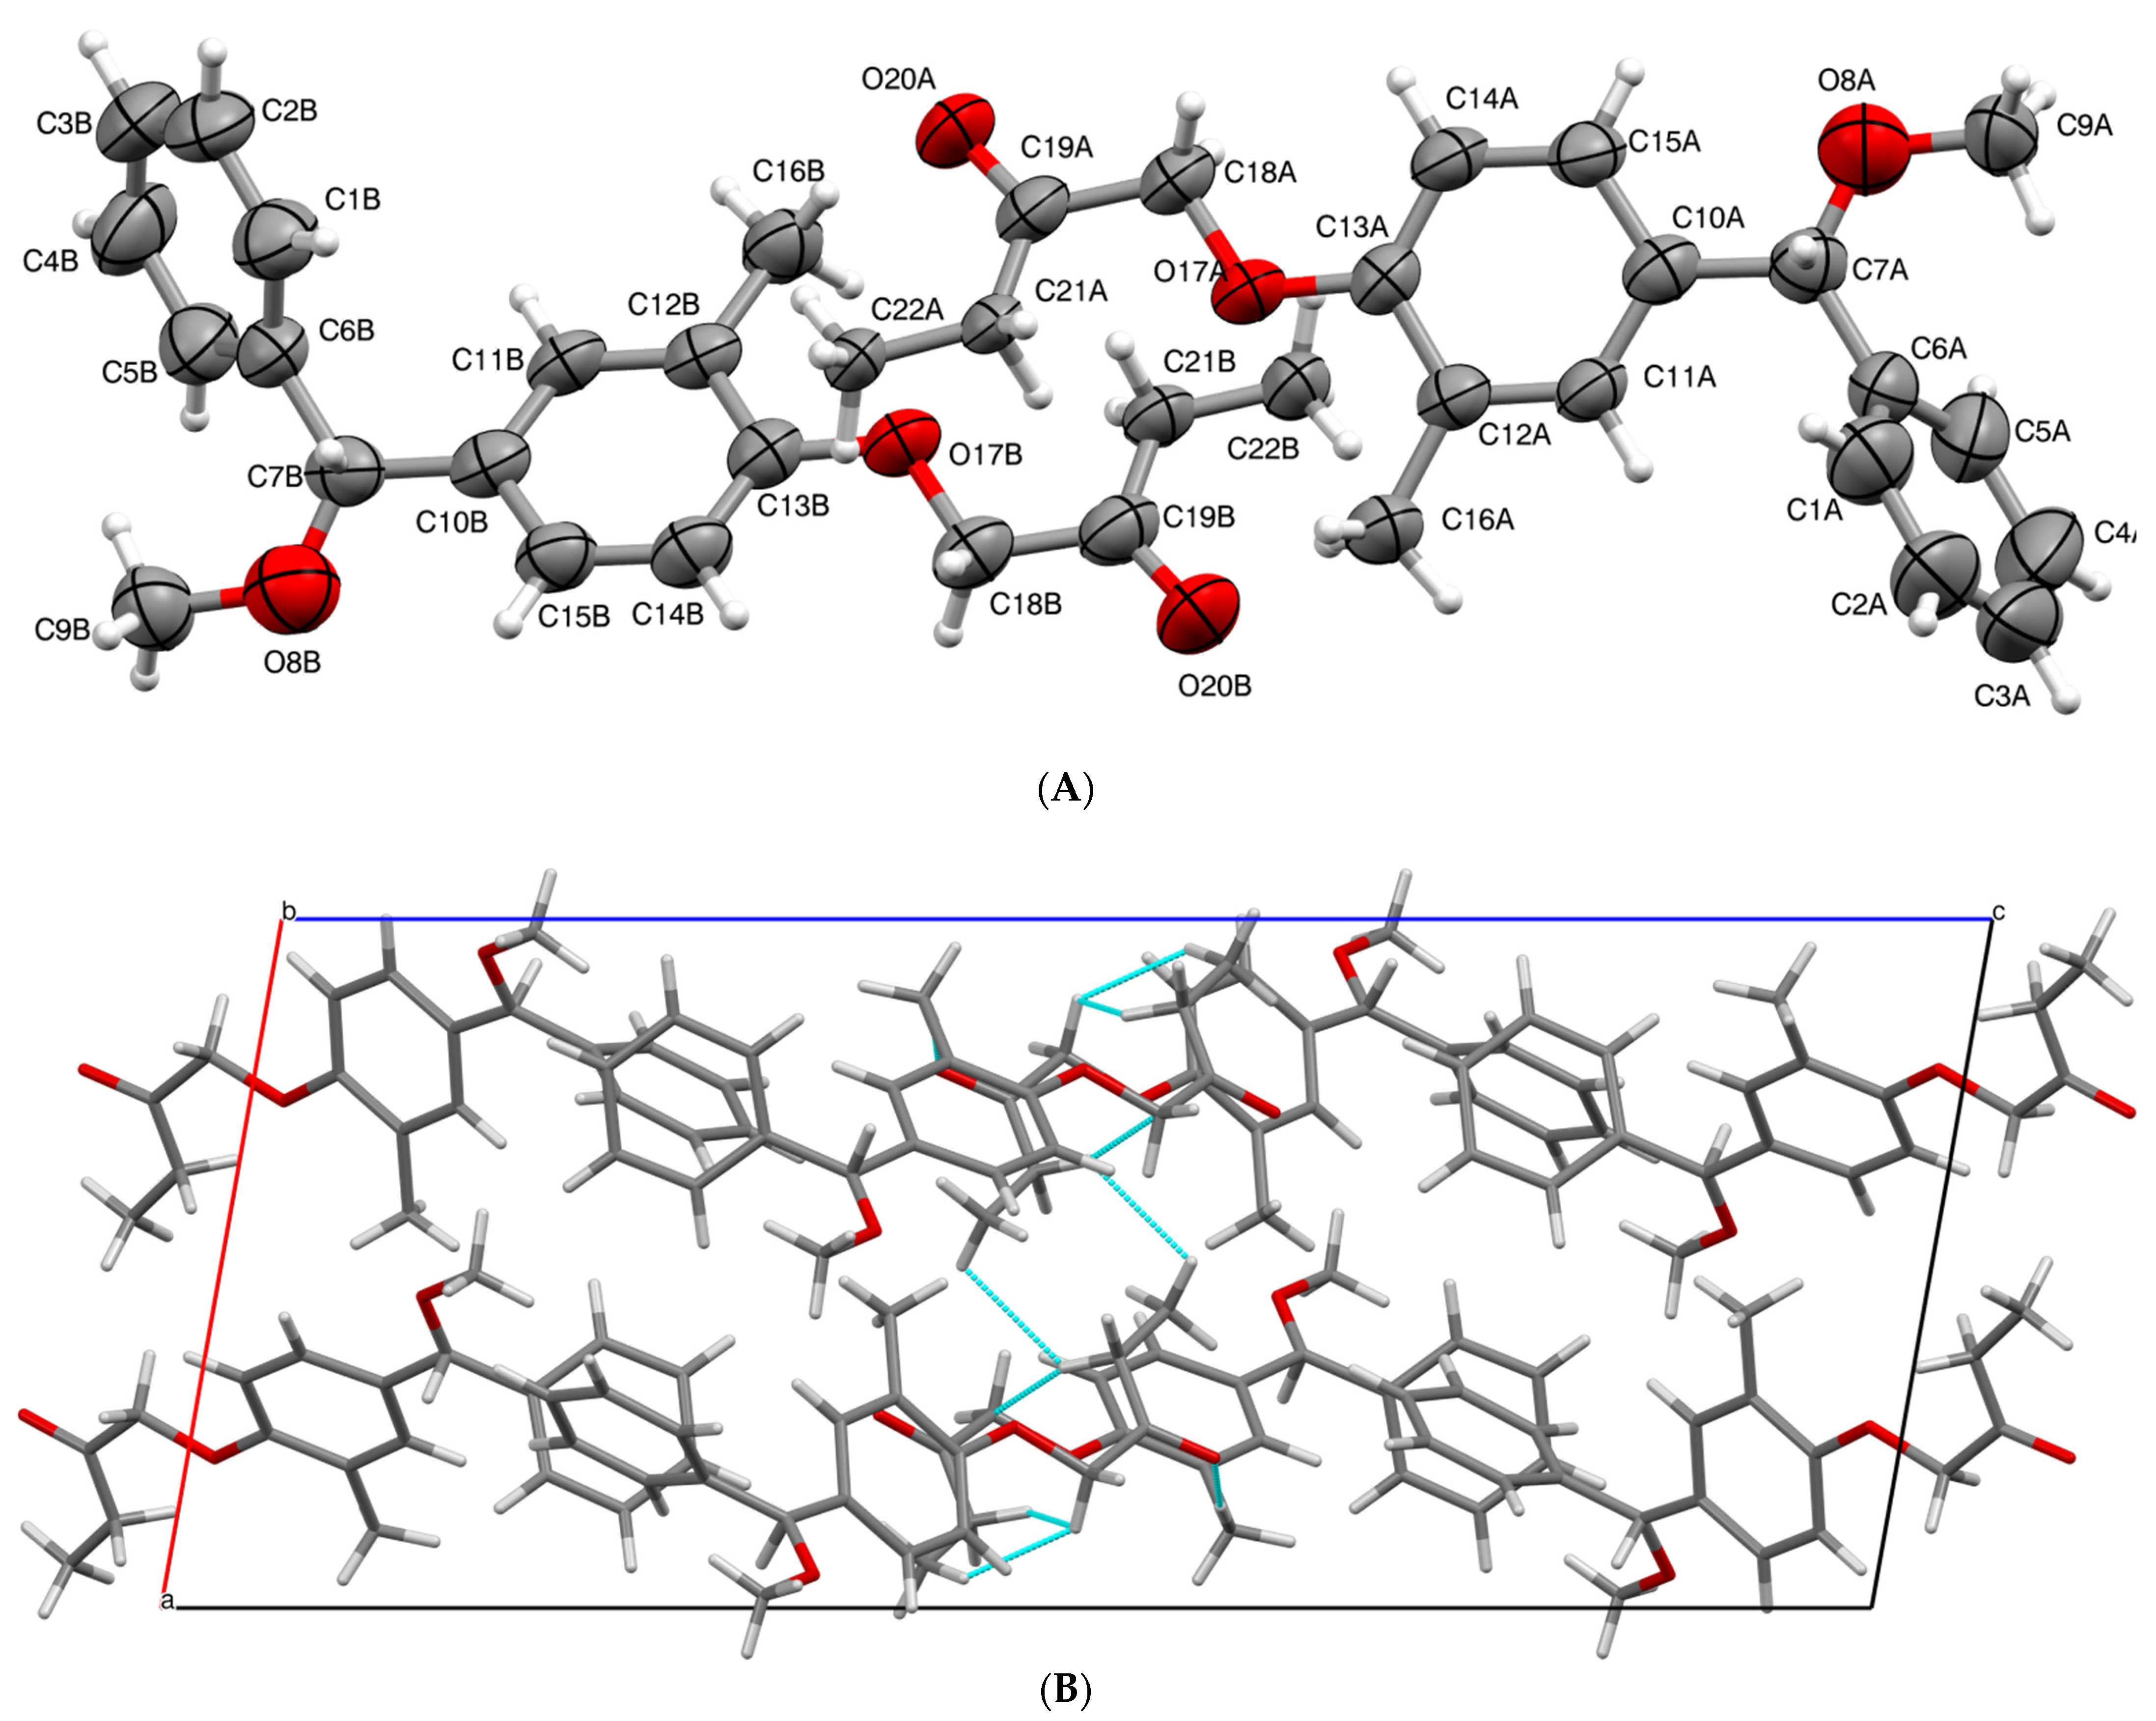
3.1. X-ray Crystallographic Details
3.2. Effect of Crystal Compound on α-Glucosidase Diabetic Enzyme Inhibition and Kinetics
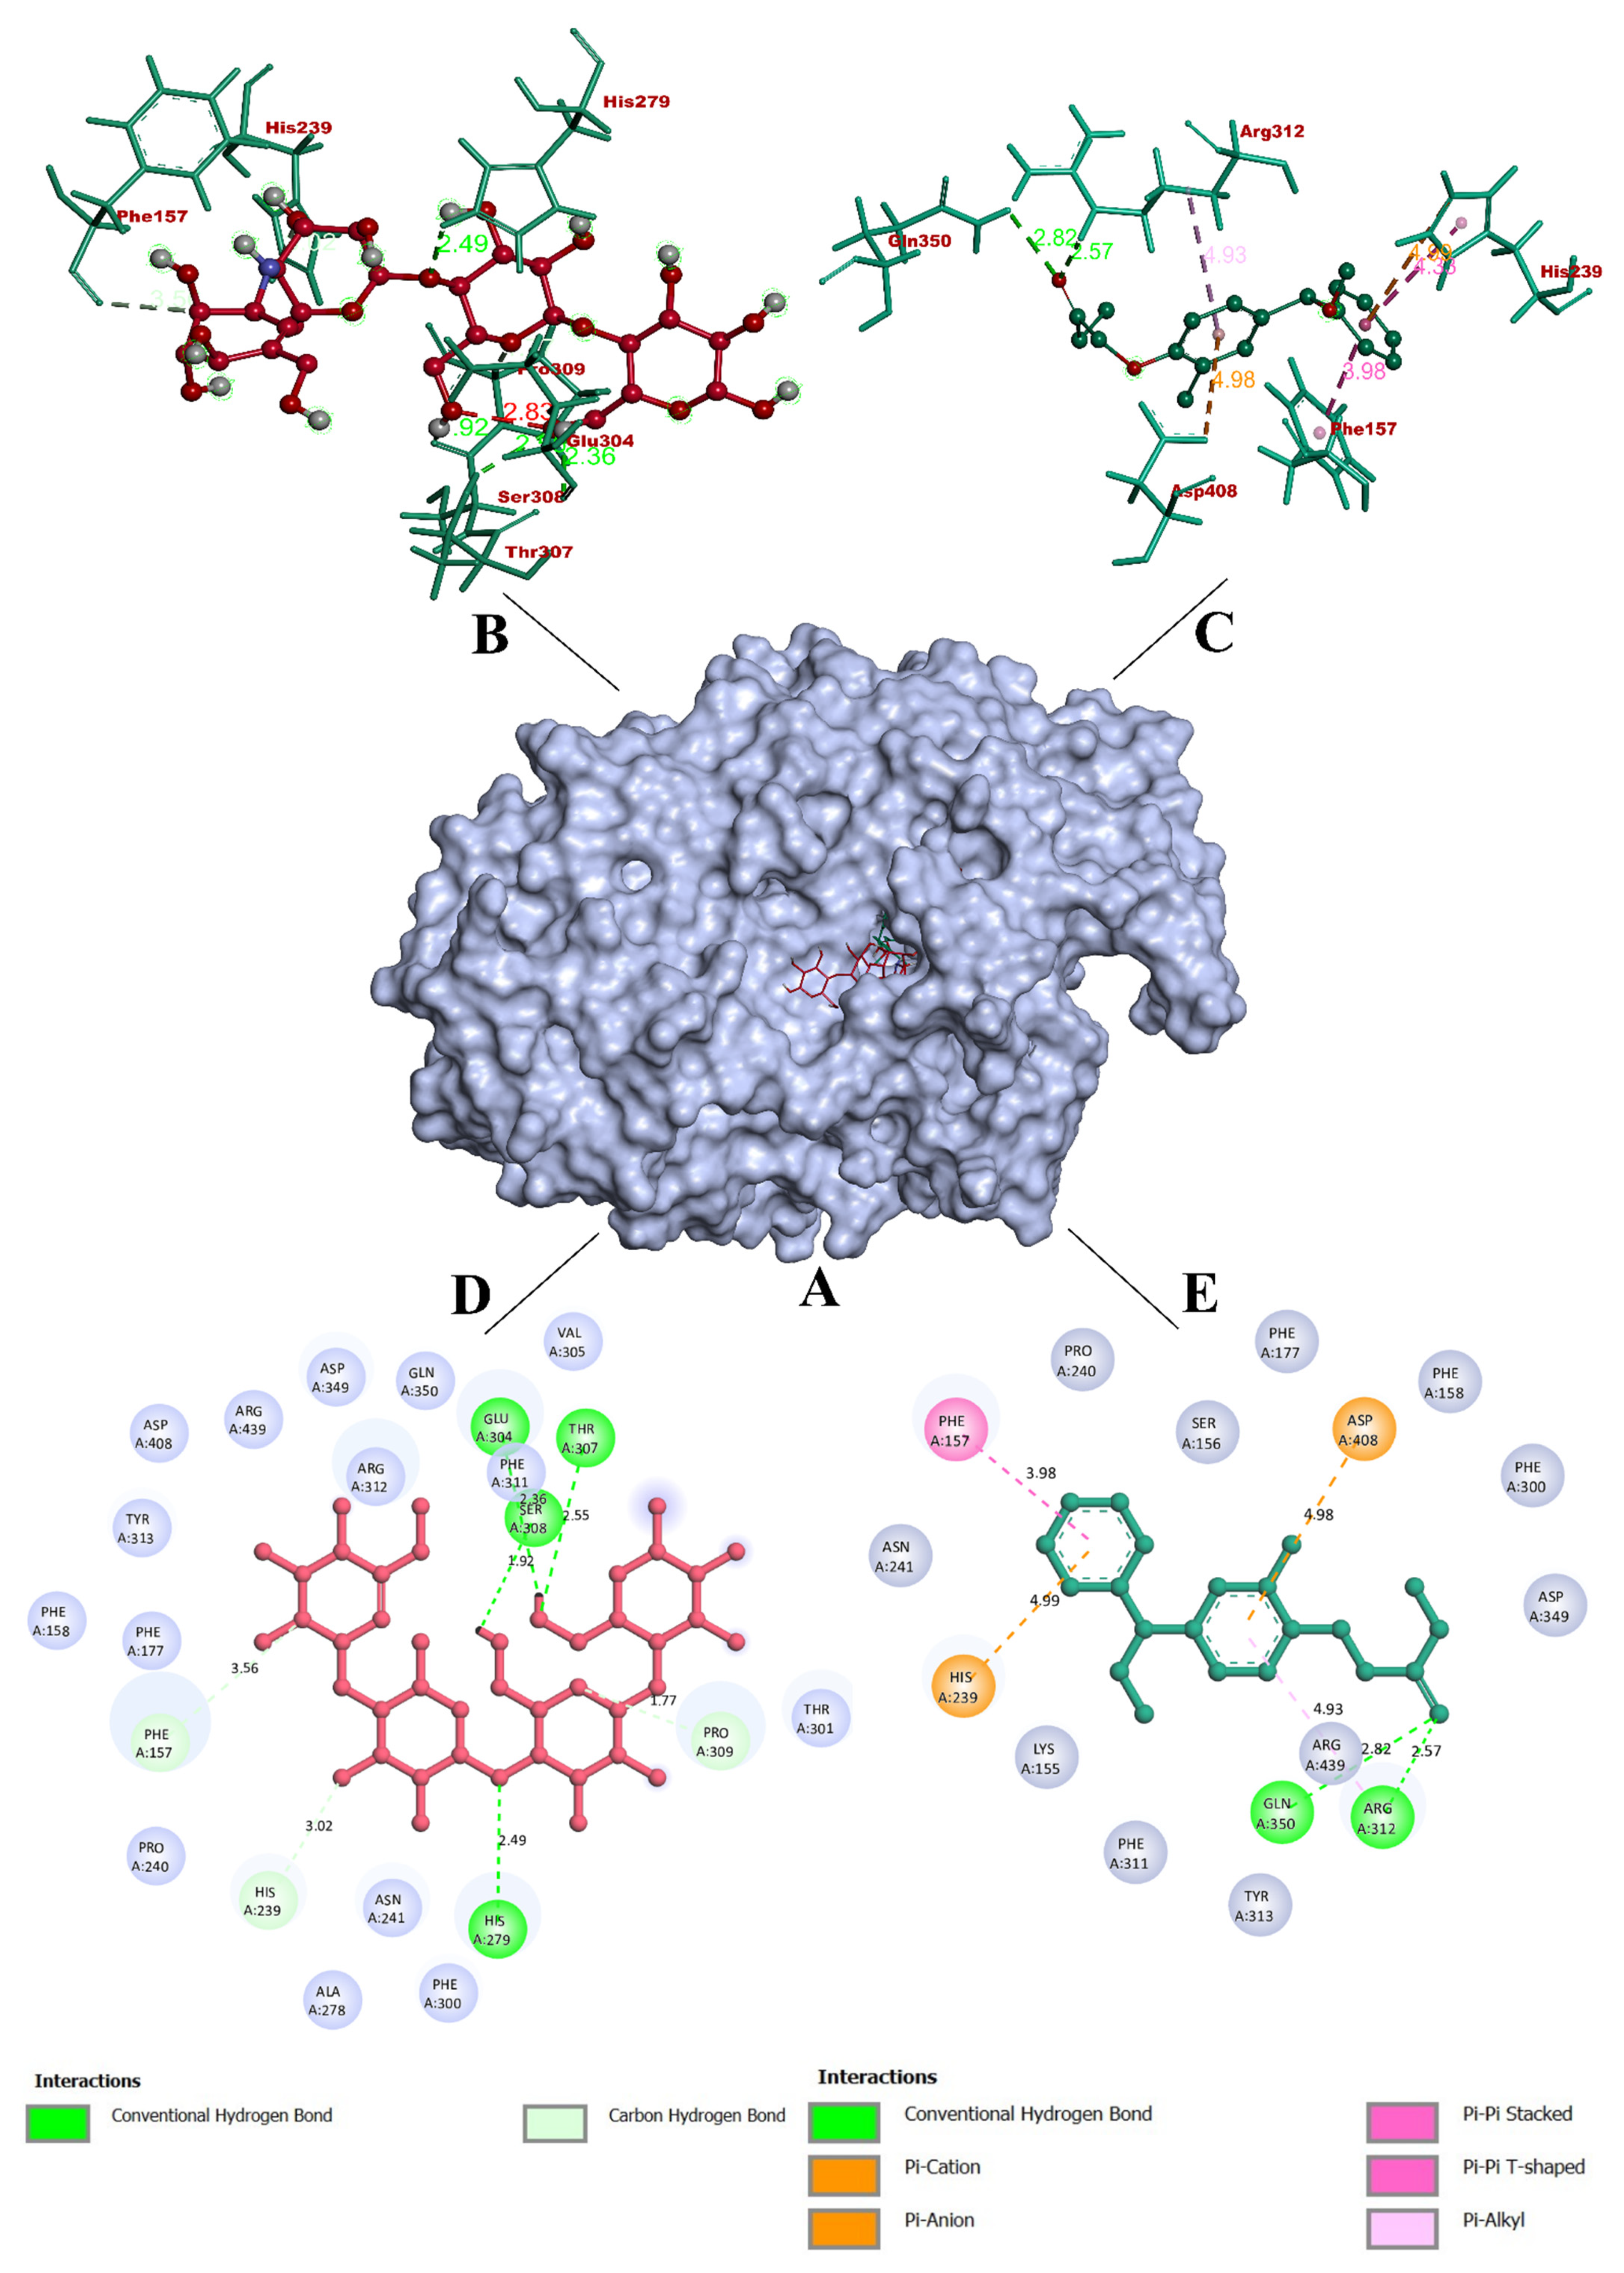
3.3. Molecular Docking Simulation
3.4. Molecular Dynamics Simulation
3.5. Binding Free Energy Calculations
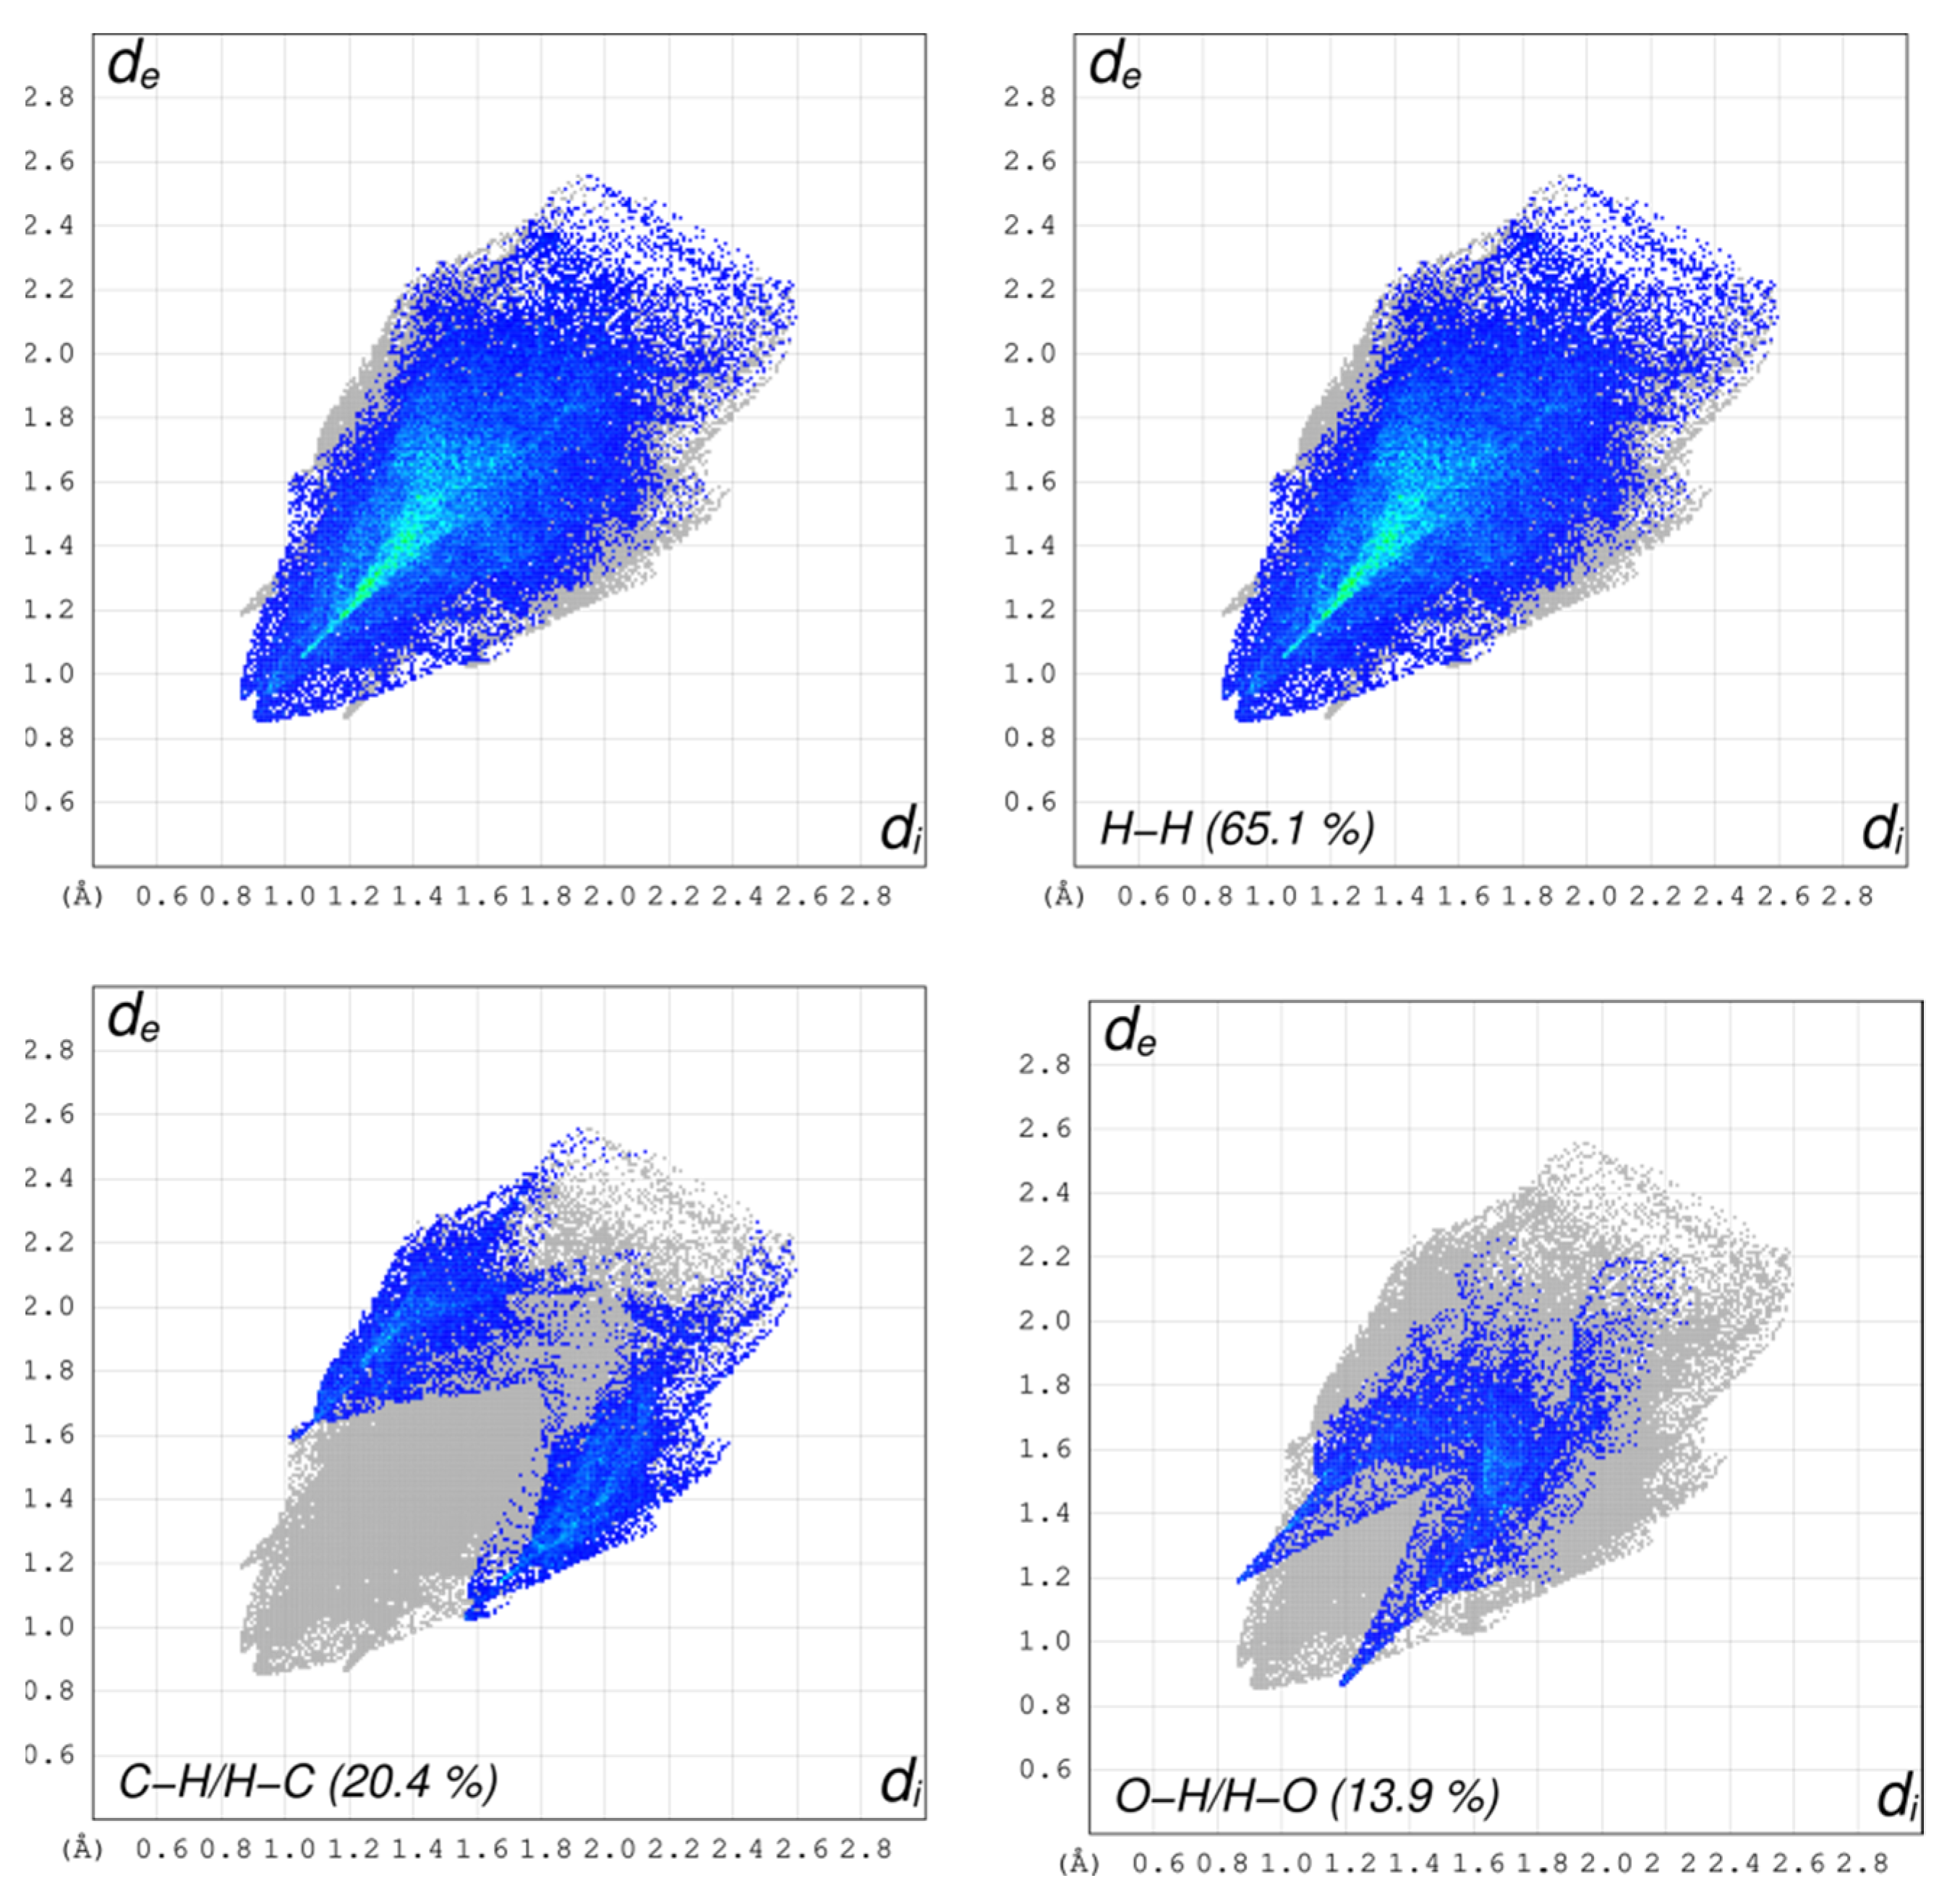
3.6. Hirshfeld Surface Analysis
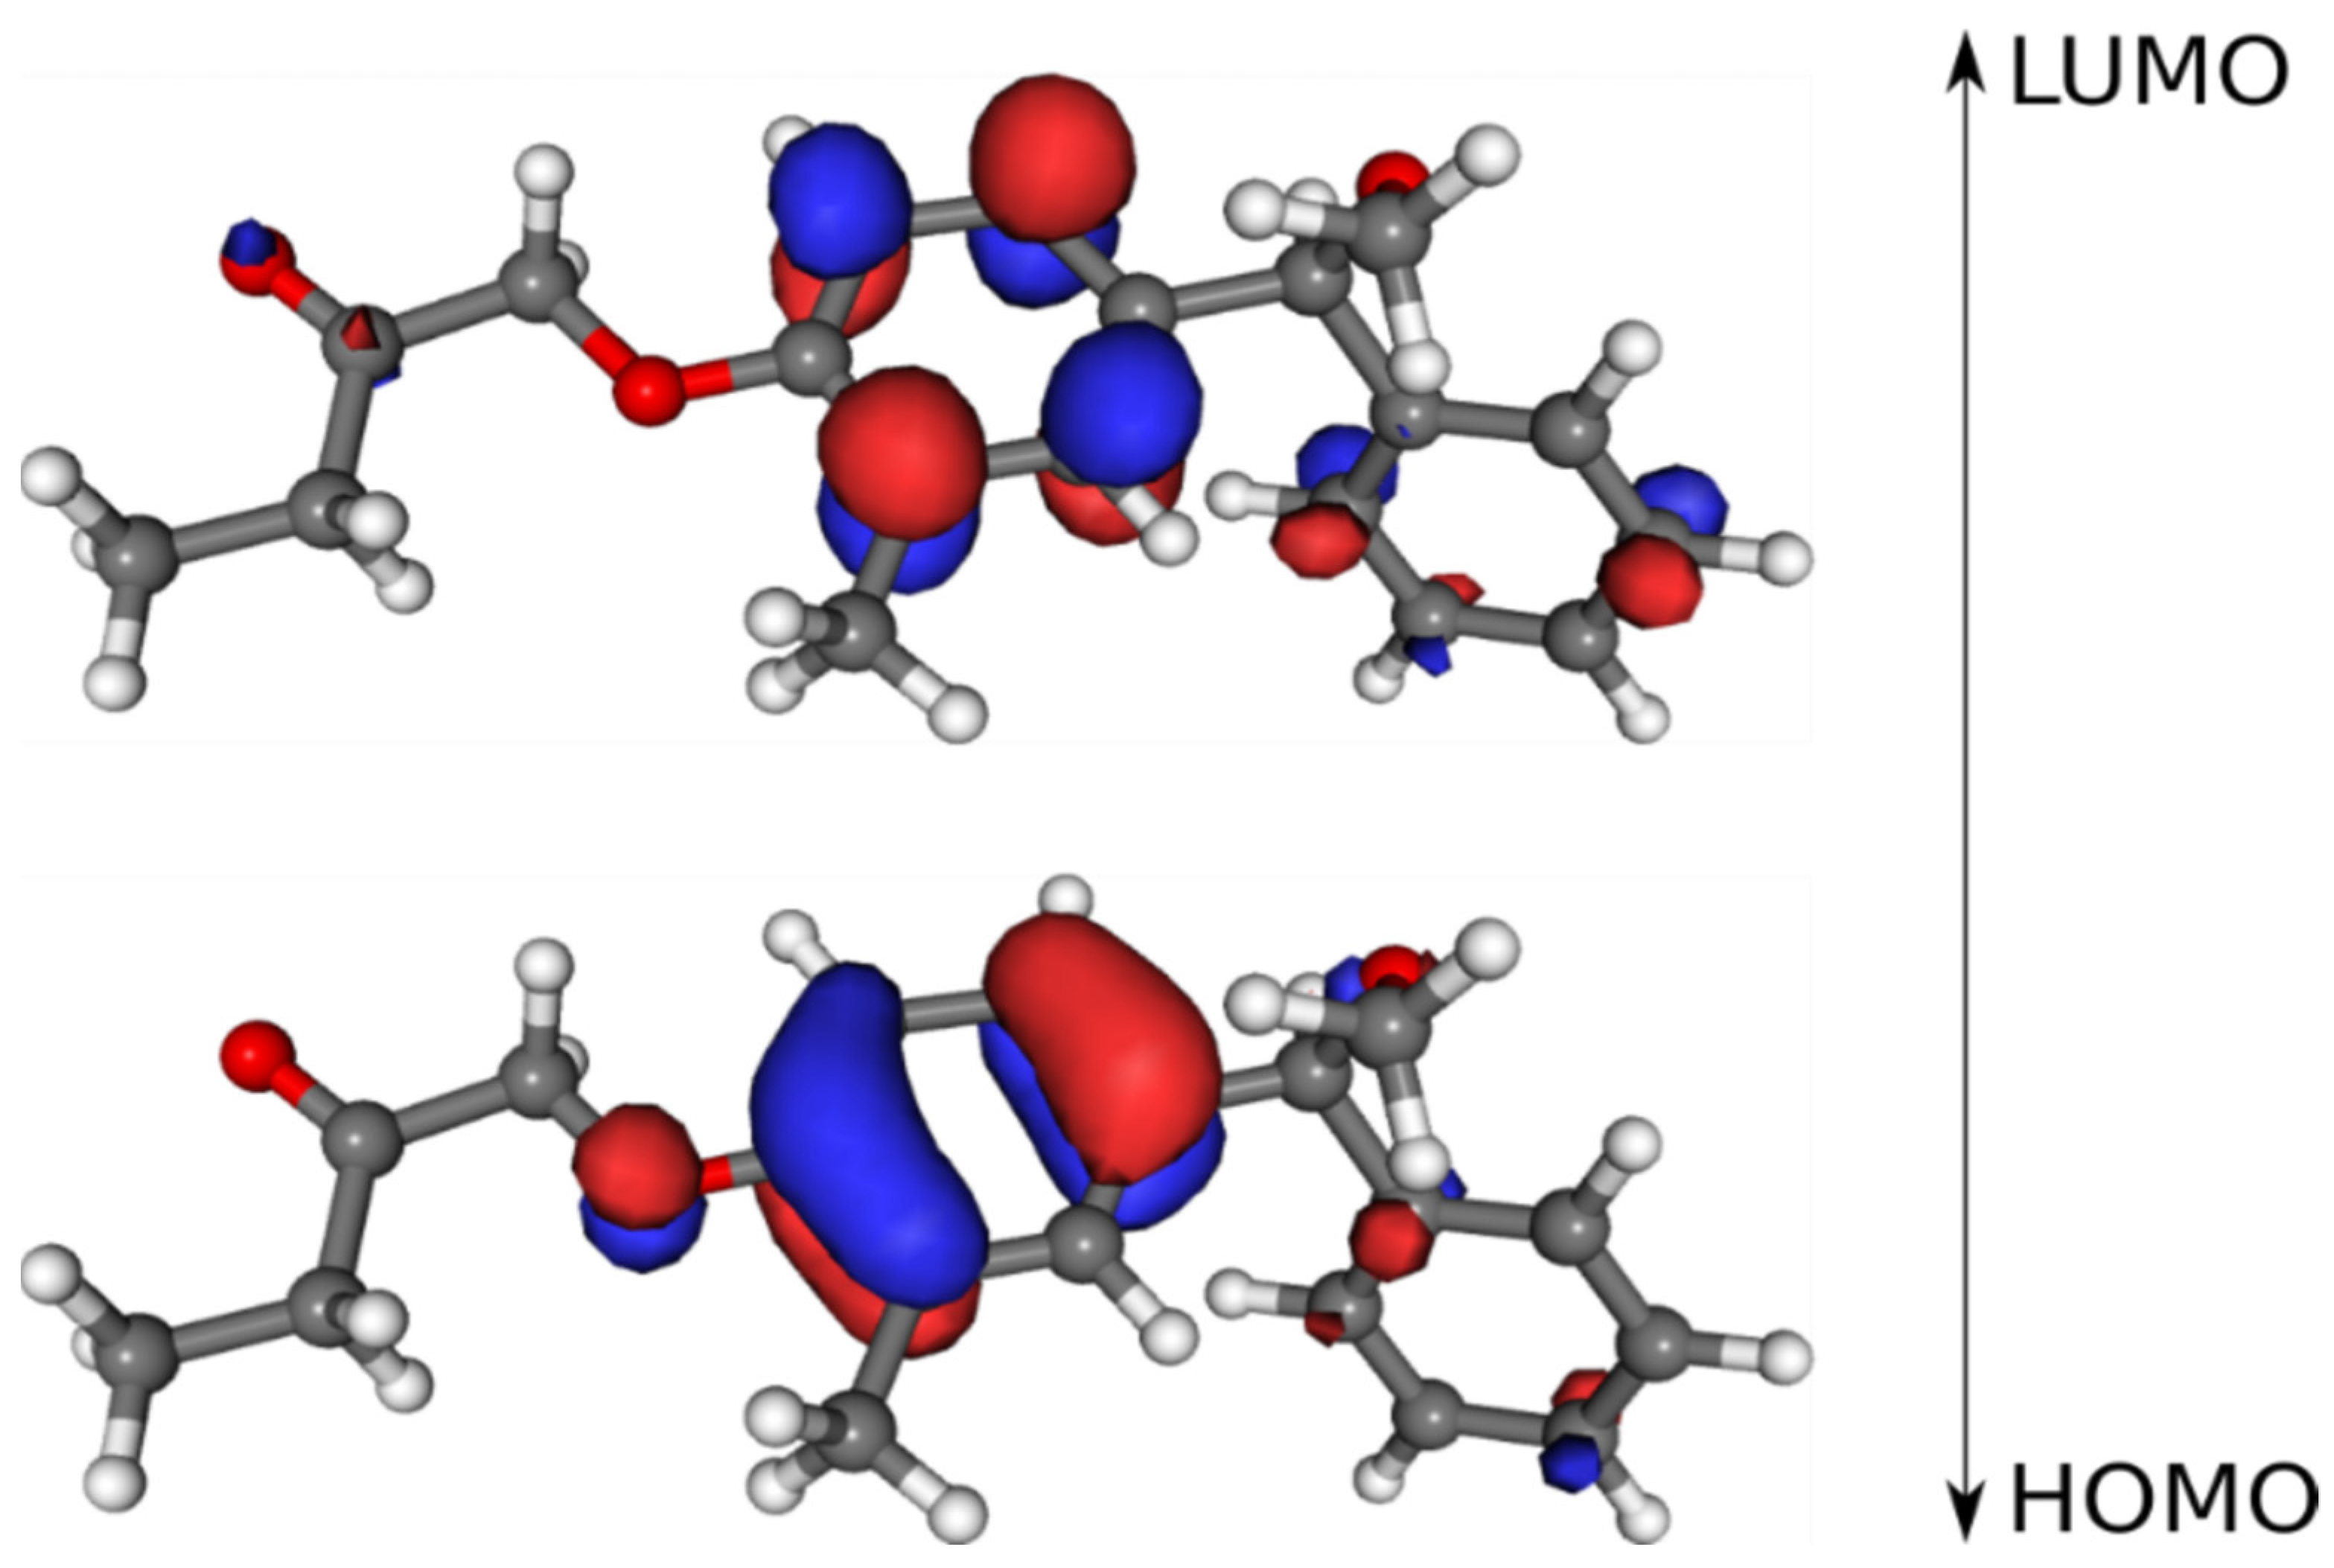
3.7. Frontier Molecular Orbitals
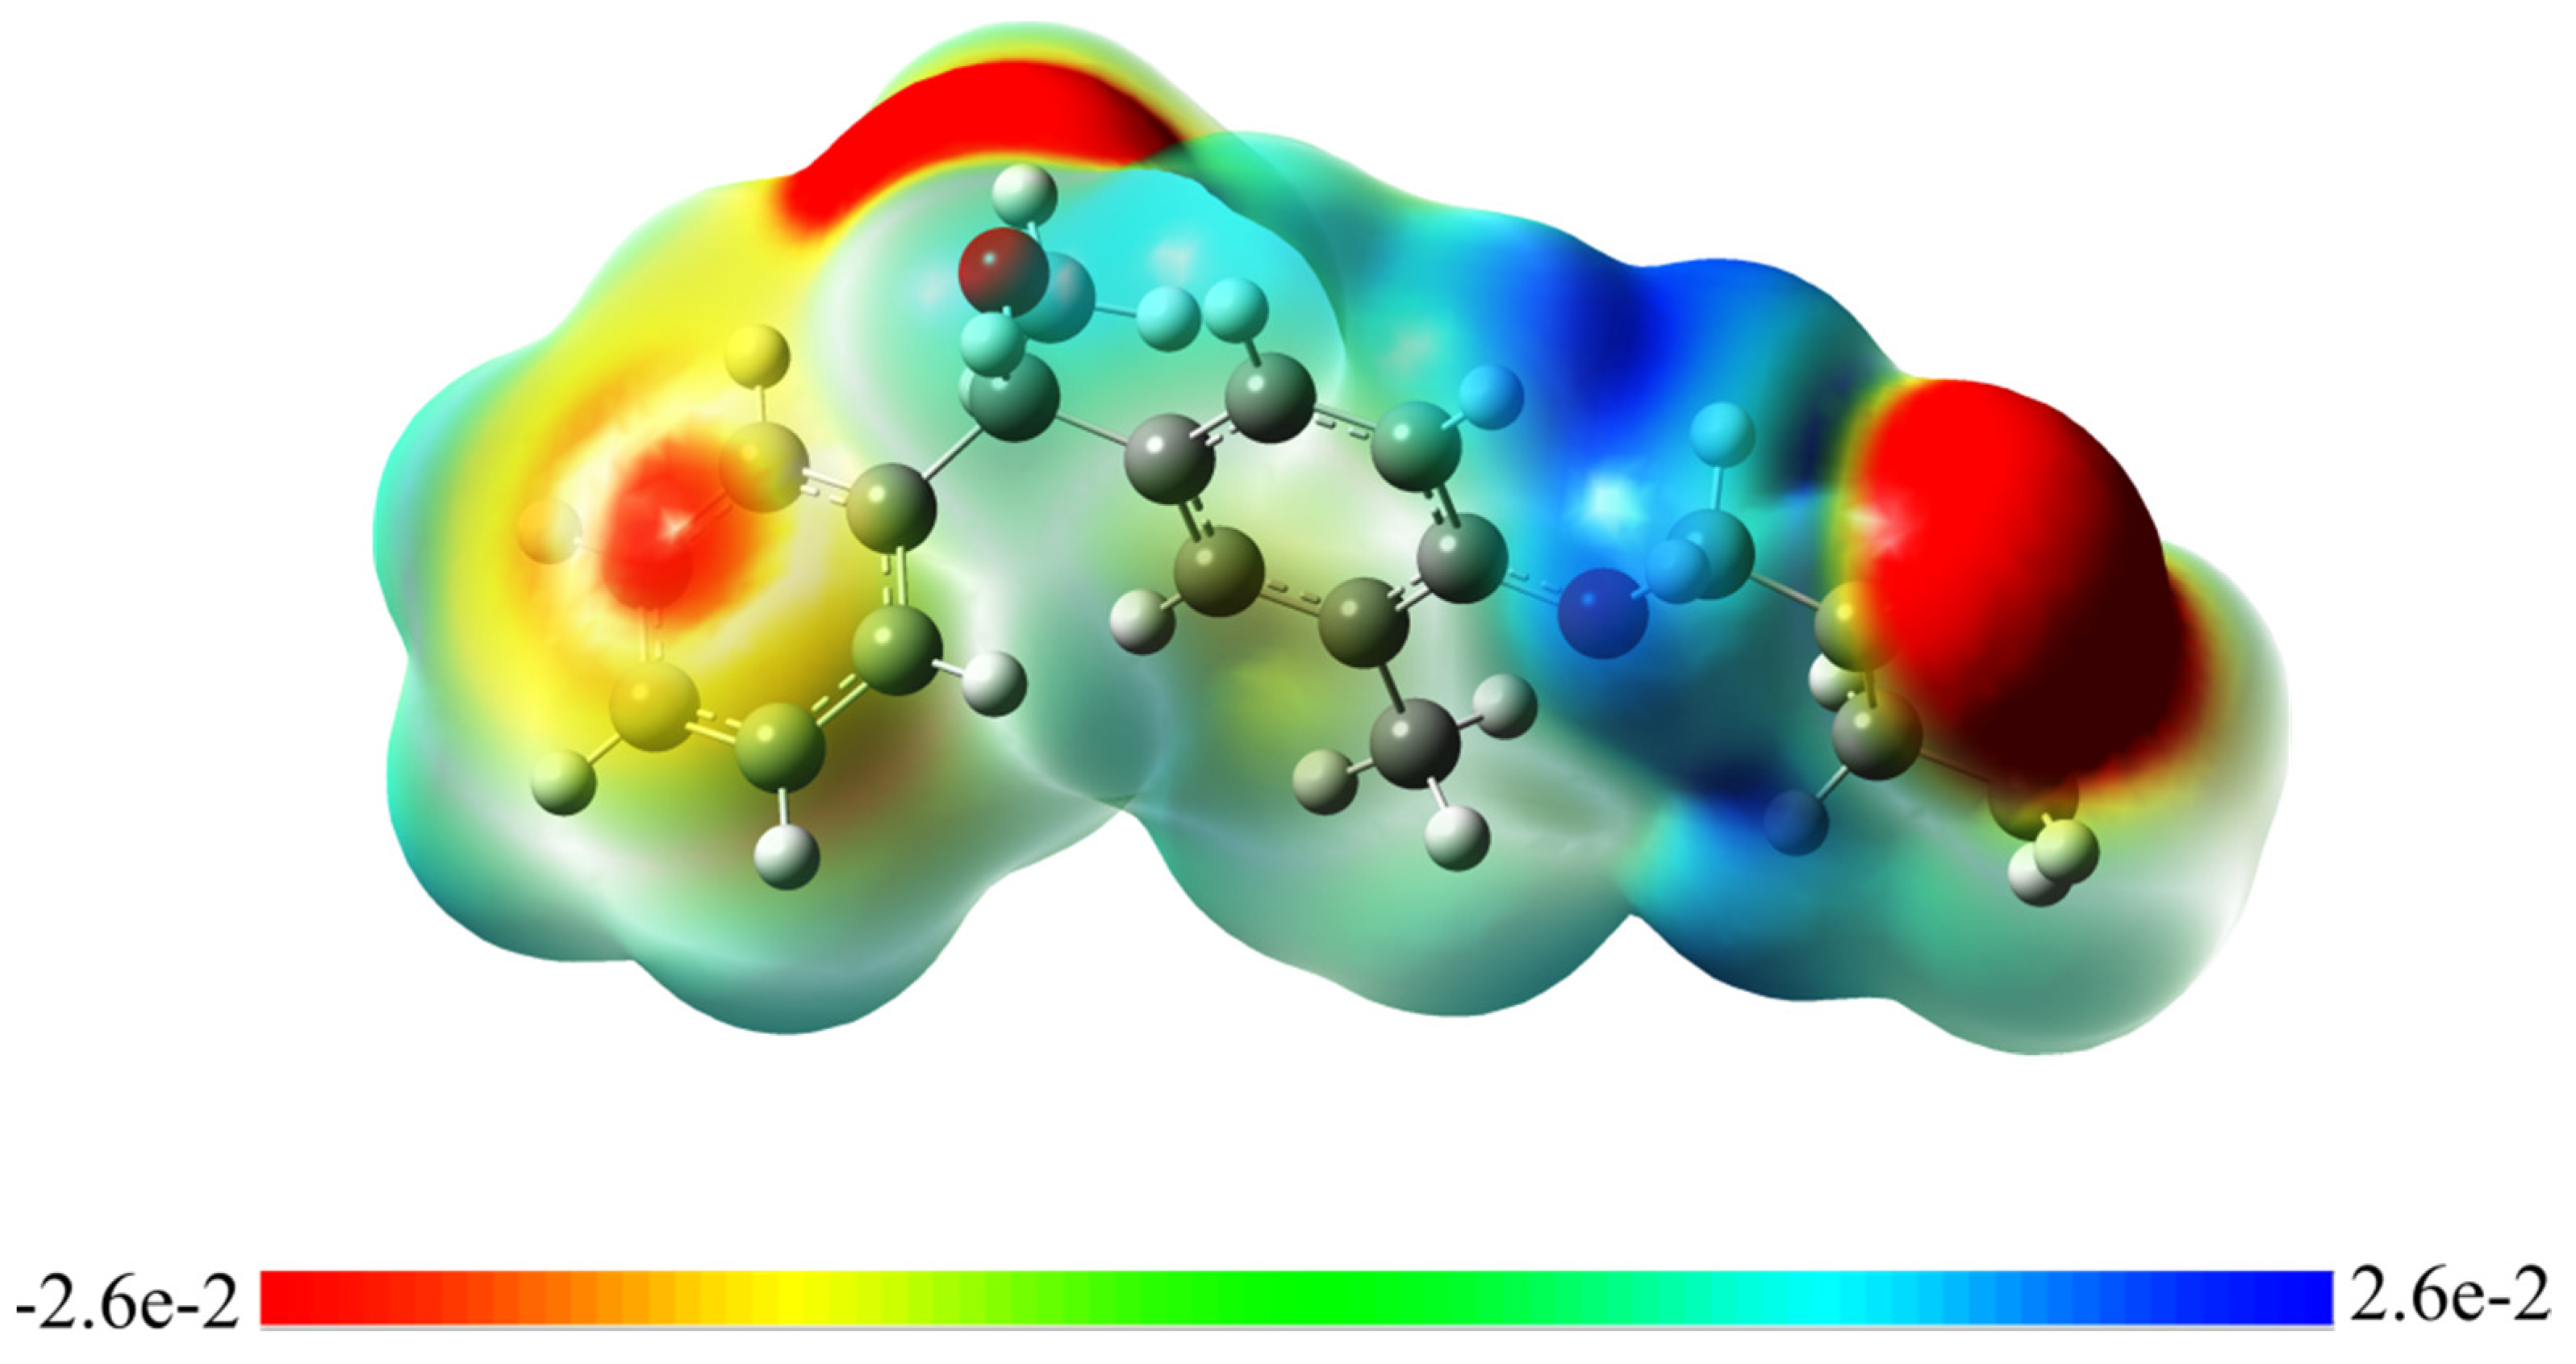
3.8. Molecular Electrostatic Potential (MEP)
4. Conclusions
Author Contributions
Funding
Institutional Review Board Statement
Informed Consent Statement
Data Availability Statement
Acknowledgments
Conflicts of Interest
References
- Patil, S.M.; Shirahatti, P.S.; Ramu, R. Azadirachta indica A. Juss (neem) against diabetes mellitus: A critical review on its phytochemistry, pharmacology, and toxicology. J. Pharm. Pharmacol. 2022, 74, 681–710. [Google Scholar] [CrossRef] [PubMed]
- Ramu, R.; Patil, S.M. A perspective on the effective conduction of functional-based coaching program on diabetic Indonesian communities. Oman Med. J. 2021, 36, e281. [Google Scholar] [CrossRef] [PubMed]
- Ramu, R.; Shirahatti, P.S.; Deepika, T.H.; Bajpe, S.N.; Sreepathi, N.; Patil, S.M.; Prasad, N. Investigating Musa paradisiaca (Var. Nanjangud rasa bale) pseudostem in preventing hyperglycemia along with improvement of diabetic complications. J. Appl. Biol. Biotechnol. 2022, 10, 56–65. [Google Scholar] [CrossRef]
- Shaw, J.E.; Sicree, R.A.; Zimmet, P.Z. Global estimates of the prevalence of diabetes for 2010 and 2030. Diabetes Res. Clin. Pract. 2010, 87, 4–14. [Google Scholar] [CrossRef]
- Storr, S.J.; Royle, L.; Chapman, C.J.; Hamid, U.M.; Robertson, J.F.; Murray, A.; Dwek, R.A.; Rudd, P.M. The O-linked glycosylation of secretory/shed MUC1 from an advanced breast cancer patient’s serum. Glycobiology 2008, 18, 456–462. [Google Scholar] [CrossRef] [Green Version]
- Bingol, Z.; Kızıltaş, H.; Gören, A.C.; Kose, L.P.; Topal, M.; Durmaz, L.; Alwasel, S.H.; Gulcin, İ. Antidiabetic, anticholinergic and antioxidant activities of aerial parts of shaggy bindweed (Convulvulus betonicifolia Miller subsp.)–profiling of phenolic compounds by LC-HRMS. Heliyon 2021, 7, e06986. [Google Scholar] [CrossRef]
- Simsek, E.; Lu, X.; Ouzounov, S.; Block, T.M.; Mehta, A.S. α-Glucosidase inhibitors have a prolonged antiviral effect against hepatitis B virus through the sustained inhibition of the large and middle envelope glycoproteins. Antivir. Chem. Chemother. 2006, 17, 259–267. [Google Scholar] [CrossRef]
- Al-Ghorbani, M.; Vigneshwaran, V.; Ranganatha, V.L.; Prabhakar, B.T.; Khanum, S.A. Synthesis of oxadiazole–morpholine derivatives and manifestation of the repressed CD31 Microvessel Density (MVD) as tumoral angiogenic parameters in Dalton’s Lymphoma. Bioorg. Chem. 2015, 60, 136–146. [Google Scholar] [CrossRef]
- Khanum, S.A.; Shashikanth, S.; Deepak, A.V. Synthesis, and anti-inflammatory activity of benzophenone analogues. Bioorg. Chem. 2004, 32, 211–222. [Google Scholar] [CrossRef]
- Mohammed, Y.H.; Naveen, S.; Issa, H.H.; Manjunath, H.R.; Lokanath, N.K.; Khanum, S.A. Synthesis, Characterization, Hirshfeld Analysis, Crystal and, Molecular Structure Studies of 2,6-difluoro phenoxy Acetic Acid. Der. Pharma. Chem. 2016, 8, 286–291. [Google Scholar]
- Srivastav, A.; Saxena, S.R.; Mishra, S.; Singh, Y. Molecular structure, experimental and theoretical spectroscopic studies and quantum chemical calculation of phenoxyacetic acid and its p-chloro derivative. Orient J. Chem. 2012, 28, 1517–1529. [Google Scholar] [CrossRef] [Green Version]
- Timchalk, C. Comparative inter-species pharmacokinetics of phenoxyacetic acid herbicides and related organic acids. evidence that the dog is not a relevant species for evaluation of human health risk. Toxicology 2004, 200, 1–19. [Google Scholar] [CrossRef]
- Tahir, M.N.; Anwar-Ul-Haq, M.; Choudhary, M.A. Crystal structure of 4-[€-(2-carbamo-thio-ylhydrazinyl-idene)meth-yl]benzoic acid. Acta. Crystallogr. E. Crystallogr. Commun. 2015, 71, 771–772. [Google Scholar] [CrossRef] [Green Version]
- Sheldrick, G.M. A Program for Crystal Structure Determination; SHELX 18; University of Cambridge: Cambridge, UK, 2018. [Google Scholar]
- Spek, A.L. PLATON SQUEEZE: A tool for the calculation of the disordered solvent contribution to the calculated structure factors. Acta Crystallogr. C Struct. Chem. 2015, 71, 9–18. [Google Scholar] [CrossRef] [Green Version]
- Macrae, C.F.; Bruno, I.J.; Chisholm, J.A.; Edgington, P.R.; McCabe, P.; Pidcock, E.; Rodriguez-Monge, L.; Taylor, R.; van de Streek, J.; Wood, P.A. Mercury CSD 2.0—New Features for the Visualization and Investigation of Crystal Structures. J. Appl. Cryst. 2008, 41, 466–470. [Google Scholar] [CrossRef]
- Maradesha, T.; Patil, S.M.; Al-Mutairi, K.A.; Ramu, R.; Madhunapantula, S.V.; Alqadi, T. Inhibitory effect of polyphenols from the whole green jackfruit flour against α-glucosidase, α-amylase, aldose reductase and glycation at multiple stages and their interaction: Inhibition kinetics and molecular simulations. Molecules 2022, 27, 1888. [Google Scholar] [CrossRef]
- Patil, S.M.; Martiz, R.M.; Ramu, R.; Shirahatti, P.S.; Prakash, A.; Kumar, B.P.; Kumar, N. Evaluation of flavonoids from banana pseudostem and flower (quercetin and catechin) as potent inhibitors of α-glucosidase: An in silico perspective. J. Biomol. Struct. Dyn. 2021, 7, 1–5. [Google Scholar] [CrossRef]
- Kumar, V.; Ramu, R.; Shirahatti, P.S.; Kumari, V.C.; Sushma, P.; Mandal, S.P.; Patil, S.M. α-Glucosidase; α-Amylase Inhibition; Kinetics and Docking Studies of Novel (2-Chloro-6-(trifluoromethyl) benzyloxy) arylidene) Based Rhodanine and Rhodanine Acetic Acid Derivatives. Chem. Select. 2021, 6, 9637–9644. [Google Scholar] [CrossRef]
- Patil, S.M.; Martiz, R.M.; Ramu, R.; Shirahatti, P.S.; Prakash, A.; Chandra, J.S.; Ranganatha, L.V. In silico identification of novel benzophenone-coumarin derivatives as SARS-CoV-2 RNAdependent RNA polymerase (RdRp) inhibitors. J. Biomol. Struct. Dyn. 2021, 11, 1–17. [Google Scholar]
- Martiz, R.M.; Patil, S.M.; Ramu, R.; Jayanthi, M.K.; Ashwini, P.; Ranganatha, L.V.; Khanum, S.A.; Silina, E.; Stupin, V.; Achar, R.R. Discovery of novel benzophenone integrated derivatives as anti-Alzheimer’s agents targeting presenilin-1 and presenilin-2 inhibition: A computational approach. PLoS ONE 2022, 17, e0265022. [Google Scholar] [CrossRef] [PubMed]
- Martiz, R.M.; Patil, S.M.; Abdulaziz, M.; Babalghith, A.; Al-Areefi, M.; Al-Ghorbani, M.; Kumar, J.M.; Prasad, A.; Mysore Nagalingaswamy, N.P.; Ramu, R.; et al. Defining the Role of Isoeugenol from Ocimum tenuiflorum against Diabetes Mellitus-Linked Alzheimer’s Disease through Network Pharmacology and Computational Methods. Molecules 2022, 27, 2398. [Google Scholar] [CrossRef]
- Gurupadaswamy, H.D.; Ranganatha, V.L.; Ramu, R.; Patil, S.M.; Khanum, S.A. Competent synthesis of biaryl analogs via asymmetric Suzuki–Miyaura cross-coupling for the development of anti-inflammatory and analgesic agents. J. Iran. Chem. Soc. 2022, 1, 2421–2436. [Google Scholar] [CrossRef]
- Patil, S.M.; Maruthi, K.R.; Bajpe, N.S.; Vyshali, V.M.; Sushmitha, S.; Chagalamari, A.; Ramith, R. Comparative molecular docking and simulation analysis of molnupiravir and remdesivir with SARS-CoV-2 RNA dependent RNA polymerase (RdRp). Bioinformation 2021, 7, 932–939. [Google Scholar]
- Ganavi, D.; Ramu, R.; Kumar, V.; Patil, S.M.; Martiz, R.M.; Shirahatti, P.S.; Sathyanarayana, R.; Poojary, B.; Holla, B.S.; Poojary, V.; et al. In vitro and in silico studies of fluorinated 2,3-disubstituted thiazolidinone-pyrazoles as potential α-amylase inhibitors and antioxidant agents. Arch. Pharm. 2021, 12, e2100342. [Google Scholar] [CrossRef]
- Poojary, B.; Kumar, V.; Arunodaya, H.S.; Chandra, S.; Ramu, R.; Patil, S.M.; Baliga, A.; Rai, V.M.; Vishwanatha, U.; Vishwanatha, P.; et al. Potential fluorinated anti-MRSA thiazolidinone derivatives with antibacterial, antitubercular activity and molecular docking studies. Chem. Biodivers. 2021, 19, e202100532. [Google Scholar]
- Nipun, T.S.; Khatib, A.; Ibrahim, Z.; Ahmed, Q.U.; Redzwan, I.E.; Saiman, M.Z.; Supandi, F.; Primaharinastiti, R.; El-Seedi, H.R. Characterization of α-glucosidase inhibitors from Psychotria malayana jack leaves extract using LC-MS-based multivariate data analysis and in-silico molecular docking. Molecules 2020, 25, 5885. [Google Scholar] [CrossRef]
- Murugesu, S.; Ibrahim, Z.; Ahmed, Q.U.; Uzir, B.F.; Yusoff, N.I.; Perumal, V.; Abas, F.; Shaari, K.; Khatib, A. Identification of α-glucosidase inhibitors from Clinacanthus nutans leaf extract using liquid chromatography-mass spectrometry-based metabolomics and protein-ligand interaction with molecular docking. J. Pharm. Anal. 2019, 9, 91–99. [Google Scholar] [CrossRef]
- Hökelek, T.; Yavuz, V.; Dal, H.; Necefoğlu, H. Crystal structure and Hirshfeld surface analysis of aqua-bis-(nicotinamide-κN)bis-(4-sulfamoylbenzoato-κO1)copper(II). Acta. Crystallogr. E. Crystallogr. Commun. 2018, 74, 45–50. [Google Scholar] [CrossRef] [Green Version]
- Spackman, M.A.; McKinnon, J.J.; Jayatilaka, D. Electrostatic potentials mapped on Hirshfeld surfaces provide direct insight into intermolecular interactions in crystals. Cryst. Eng. Comm. 2008, 10, 377–388. [Google Scholar] [CrossRef]
- Schmidt, M.W.; Baldridge, K.K.; Boatz, J.A.; Elbert, S.T.; Gordon, M.S.; Jensen, J.H.; Koseki, S.; Matsunaga, N.; Nguyen, K.A.; Su, S.; et al. General atomic and molecular electronic structure system. Comput. Chem. 1993, 14, 1347–1363. [Google Scholar] [CrossRef]
- Aihara, J.I. Weighted HOMO-LUMO energy separation as an index of kinetic stability for fullerenes. Theor. Chem. Acc. 1999, 102, 134–138. [Google Scholar] [CrossRef]
- Frisch, M.J.; Trucks, G.W.; Schlegel, H.B.; Scuseria, G.E.; Robb, M.A.; Cheeseman, J.R.; Scalmani, G.; Barone, V.; Mennucci, B.; Petersson, G.A. Gaussian 09; Gaussian, Inc.: Wallingford, CT, USA, 2009. [Google Scholar]


| Parameter | Data |
|---|---|
| Identification code | 3 |
| Empirical formula | C19H22O3 |
| Formula weight | 298.36 |
| Temperature | 296 K |
| Wavelength | 1.54178 Å |
| Crystal system, space group | Monoclinic, P21/c |
| Unit cell dimensions | a = 11.1757(2) Å, b = 10.2148 Å |
| c = 27.0700(9) Å, β = 99.853° | |
| Volume | 3044.66(17) Å3 |
| Z, Calculated density | 8, 1.302 Mg/m3 |
| F000 | 1280 |
| Crystal size | 0.21 × 0.21 × 0.21 mm |
| Theta range for data collection | 3.31 to 64.60° |
| Limiting indices | −12 ≤ h ≤ 13, −11 ≤ k ≤ 8, −31 ≤ l ≤ 24 |
| Reflections collected/unique | 12,552/4959 |
| Refinement method | Full-matrix least-squares on F2 |
| Data/restraints/parameters | 4959/27/404 |
| Goodness-of-fit on F2 | 1.716 |
| Final R indices [I > 2sigma(I)] | R1 = 0.1196, wR2 = 0.2847 |
| Largest diff. peak and hole | 0.720 and −0.760 e.Å−3 |
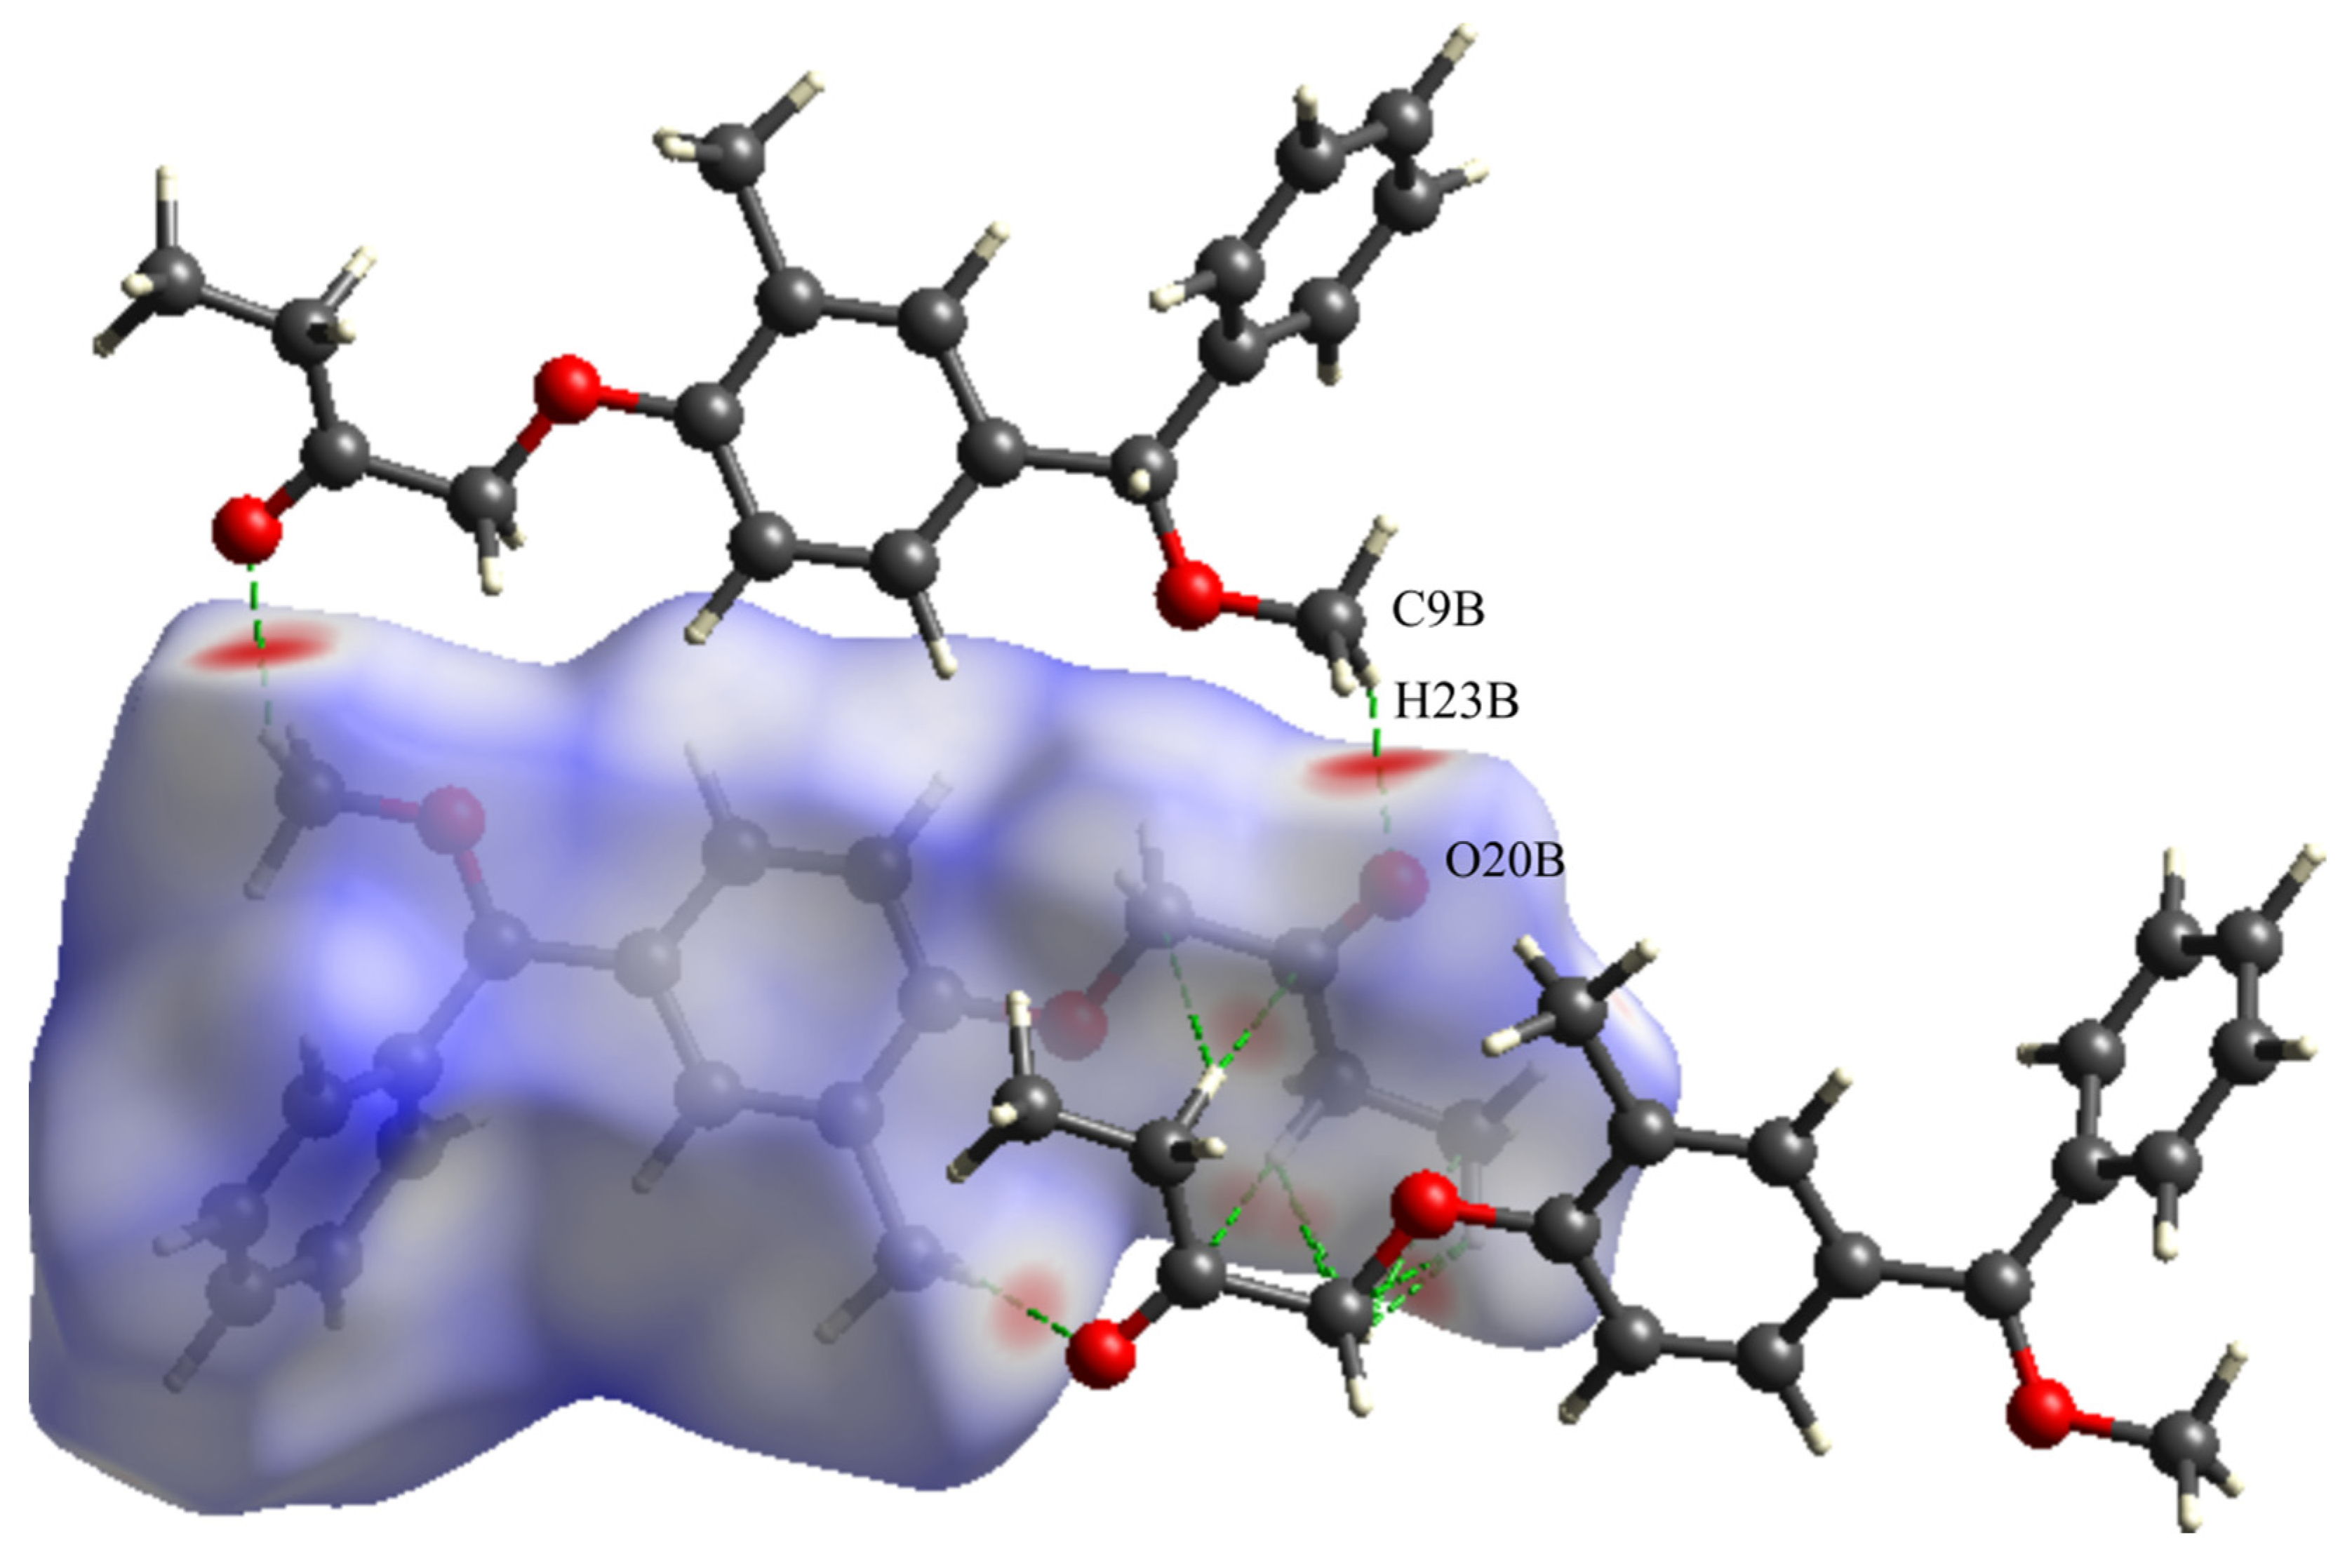
| D-H-A | D-H | H-A | D-A | D-H-A (°) | Symmetric Code |
|---|---|---|---|---|---|
| C22A-H22C-O20A | 0.96 | 2.33 | 2.736(5) | 104 | Intramolecular interaction |
| C22B-H22D-O20B | 0.96 | 2.33 | 2.721(6) | 103 | Intramolecular interaction |
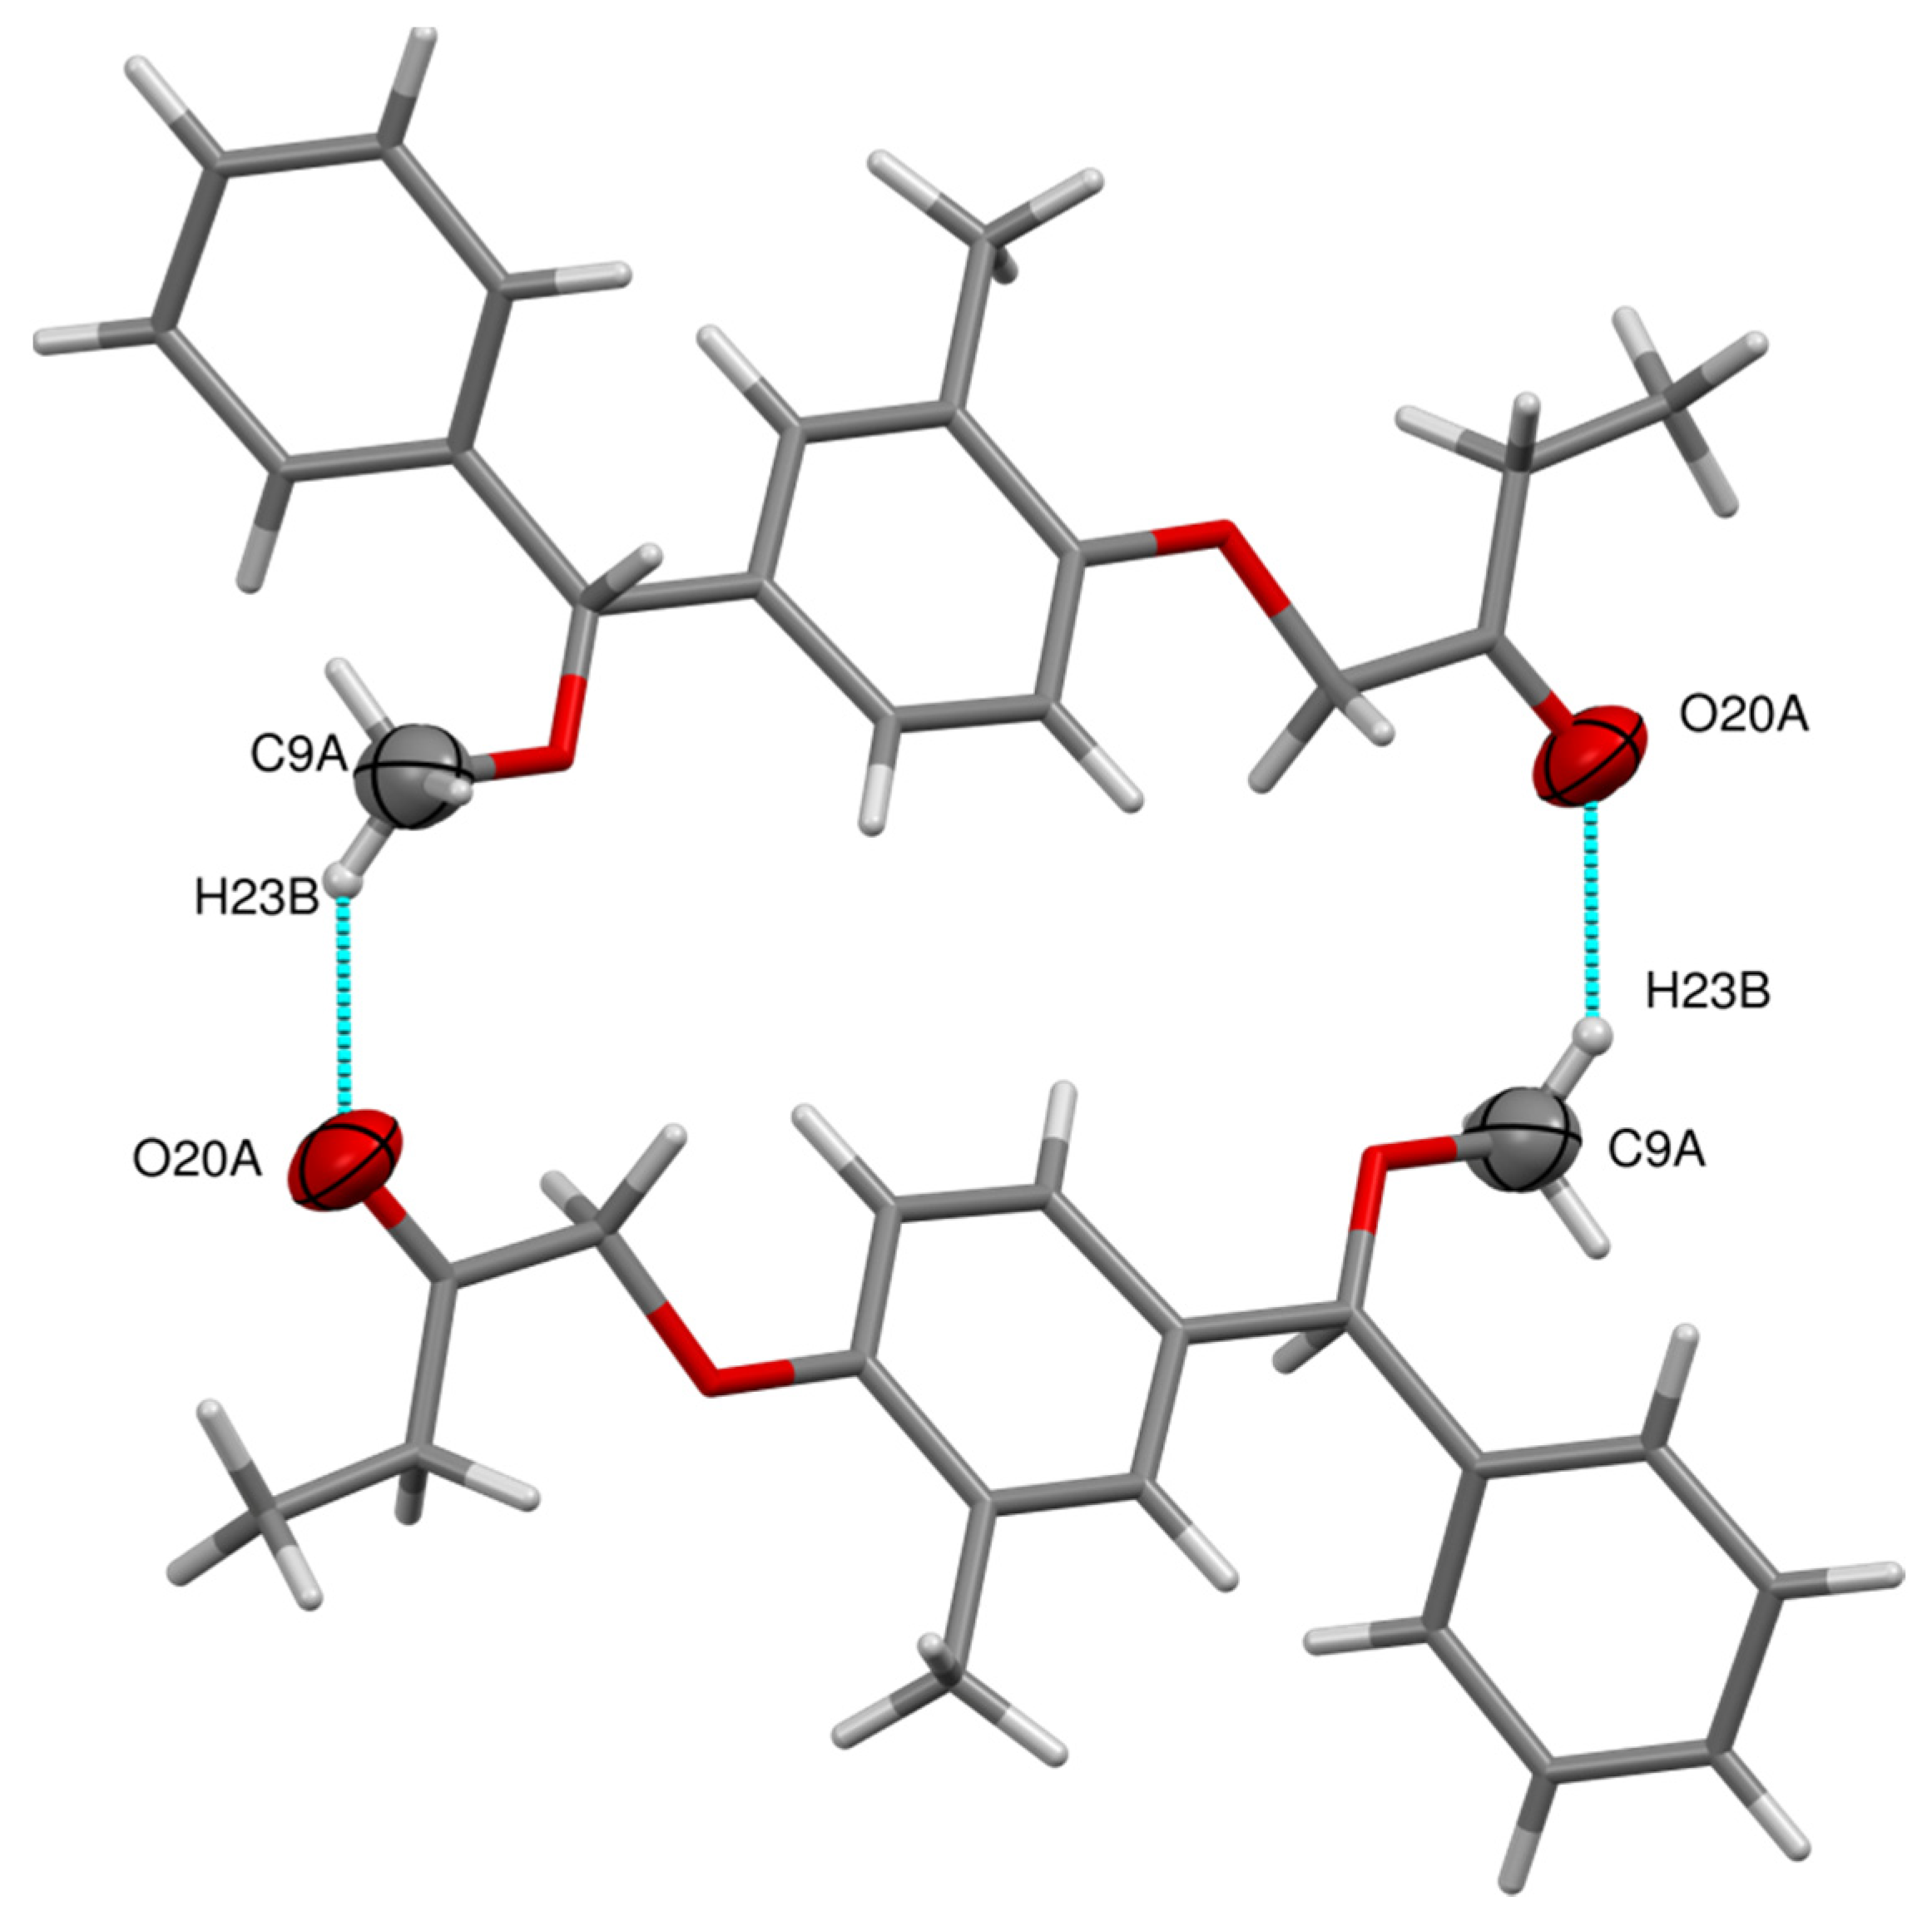
| C9A-H23B-O20A | 0.96 | 2.17 | 2.911(6) | 133 | 1-x, −y, 1-z |
| C9B-H23D-O20B | 0.96 | 2.28 | 2.924(6) | 124 | −x, 2-y, 1-z |
| Types of Binding Free Energies | Values and Standard Deviations | Van Der Waal’s Energy | Electrostatic Energy | Polar Solvation Energy | SASA Energy | Binding Energy |
|---|---|---|---|---|---|---|
| α-glucosidase-crystal compound complex | Values (kJ/mol) | −108.593 | −31.892 | 65.071 | −9.127 | −71.615 |
| Standard deviation (kJ/mol) | ±12.178 | ±8.561 | ±9.298 | ±3.726 | ±10.028 | |
| α-glucosidase-acarbose | Values (kJ/mol) | −99.716 | −27.716 | 49.918 | −7.561 | −61.239 |
| Standard deviation (kJ/mol) | ±9.257 | ±7.145 | ±8.769 | ±2.539 | ±8.751 |
| Molecular Descriptor | Value |
|---|---|
| HOMO | −8.489 eV |
| LUMO | 3.537 eV |
| Energy gap (ΔE) | 4.952 eV |
| Ionization potential (I) | 8.489 eV |
| Electron affinity (E) | −3.537 eV |
| Chemical potential (μ) | −6.013 eV |
| Electronegativity (χ) | 6.013 eV |
| Global hardness (σ) | 2.476 eV |
| Global softness (η) | 0.2019 eV−1 |
| Electrophilicity (ω) | 7.301 eV |
Publisher’s Note: MDPI stays neutral with regard to jurisdictional claims in published maps and institutional affiliations. |
© 2022 by the authors. Licensee MDPI, Basel, Switzerland. This article is an open access article distributed under the terms and conditions of the Creative Commons Attribution (CC BY) license (https://creativecommons.org/licenses/by/4.0/).
Share and Cite
Shivanna, C.; Patil, S.M.; Mallikarjunaswamy, C.; Ramu, R.; Akhileshwari, P.; Nagaraju, L.R.; Sridhar, M.A.; Khanum, S.A.; Ranganatha, V.L.; Silina, E.; et al. Synthesis, Characterization, Hirshfeld Surface Analysis, Crystal Structure and Molecular Modeling Studies of 1-(4-(Methoxy(phenyl)methyl)-2-methylphenoxy)butan-2-one Derivative as a Novel α-Glucosidase Inhibitor. Crystals 2022, 12, 960. https://doi.org/10.3390/cryst12070960
Shivanna C, Patil SM, Mallikarjunaswamy C, Ramu R, Akhileshwari P, Nagaraju LR, Sridhar MA, Khanum SA, Ranganatha VL, Silina E, et al. Synthesis, Characterization, Hirshfeld Surface Analysis, Crystal Structure and Molecular Modeling Studies of 1-(4-(Methoxy(phenyl)methyl)-2-methylphenoxy)butan-2-one Derivative as a Novel α-Glucosidase Inhibitor. Crystals. 2022; 12(7):960. https://doi.org/10.3390/cryst12070960
Chicago/Turabian StyleShivanna, Chandra, Shashank M. Patil, C. Mallikarjunaswamy, Ramith Ramu, Prabhuswamy Akhileshwari, Latha Rani Nagaraju, Mandayam A. Sridhar, Shaukath Ara Khanum, V. Lakshmi Ranganatha, Ekaterina Silina, and et al. 2022. "Synthesis, Characterization, Hirshfeld Surface Analysis, Crystal Structure and Molecular Modeling Studies of 1-(4-(Methoxy(phenyl)methyl)-2-methylphenoxy)butan-2-one Derivative as a Novel α-Glucosidase Inhibitor" Crystals 12, no. 7: 960. https://doi.org/10.3390/cryst12070960