
The Effect of Dimple Overlap on Wettability and Corrosion Resistance of Laser-Textured Stainless Steel


Abstract
:1. Introduction
2. Materials and Methods
3. Results
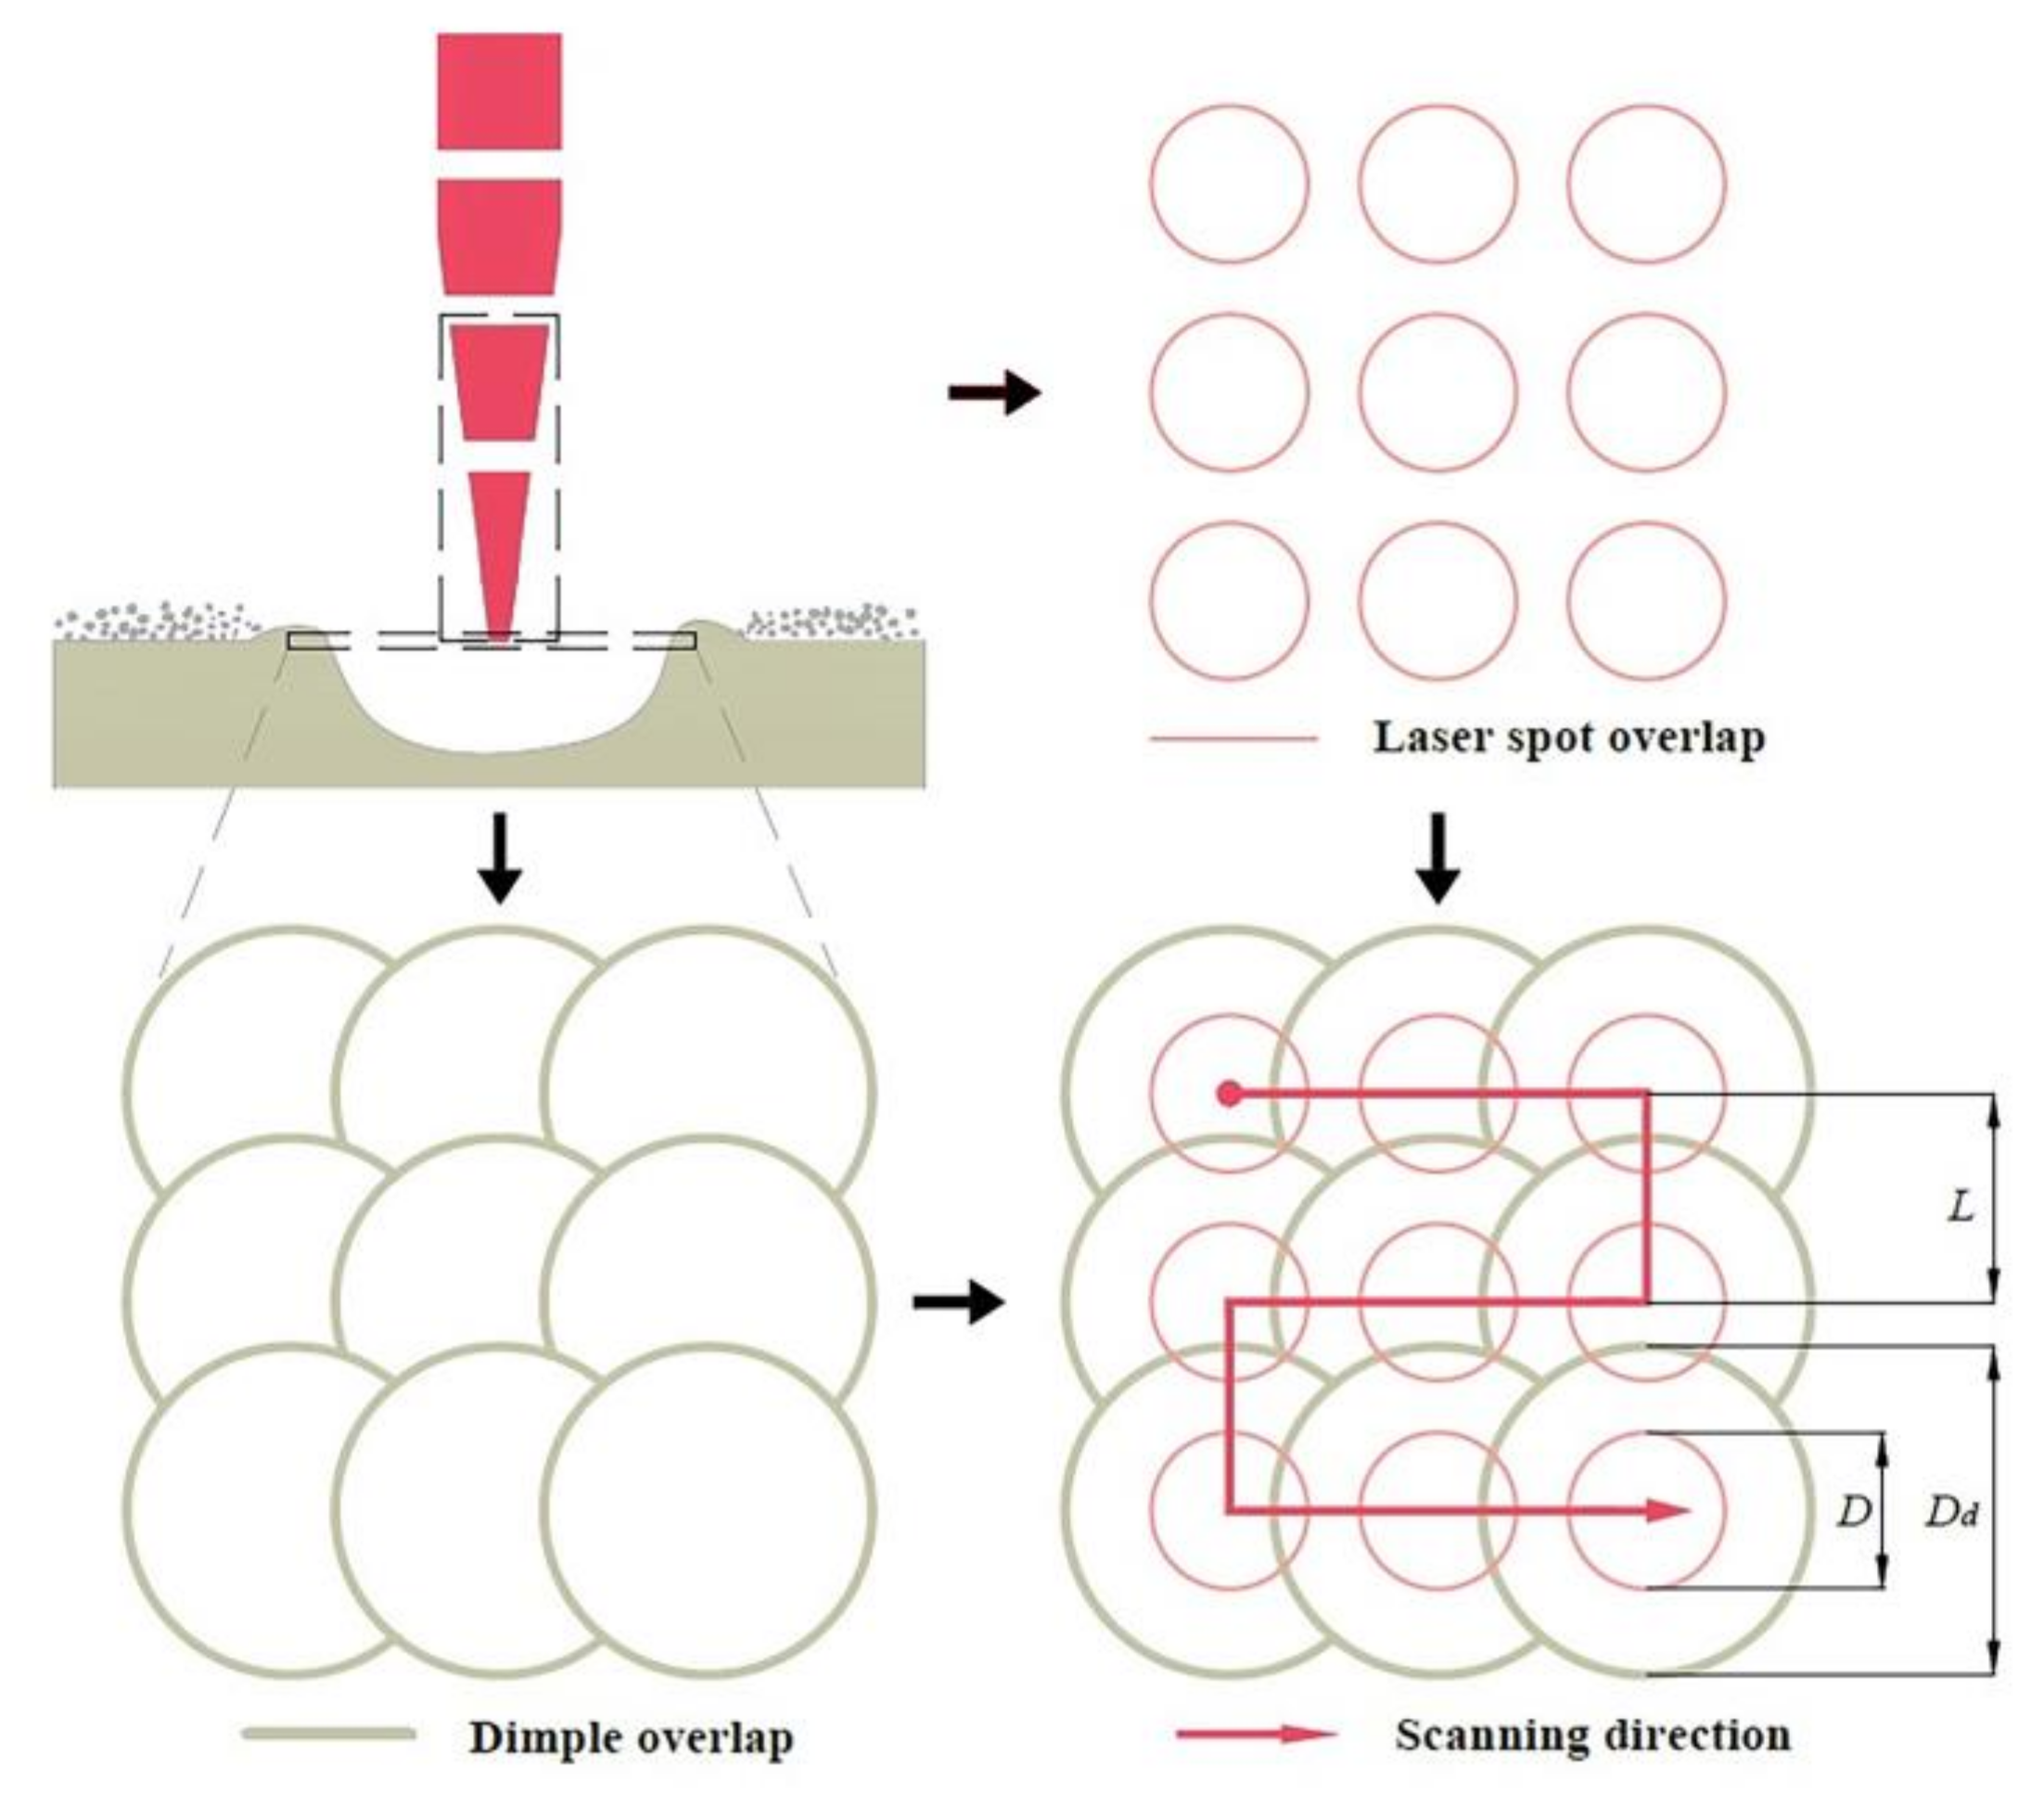
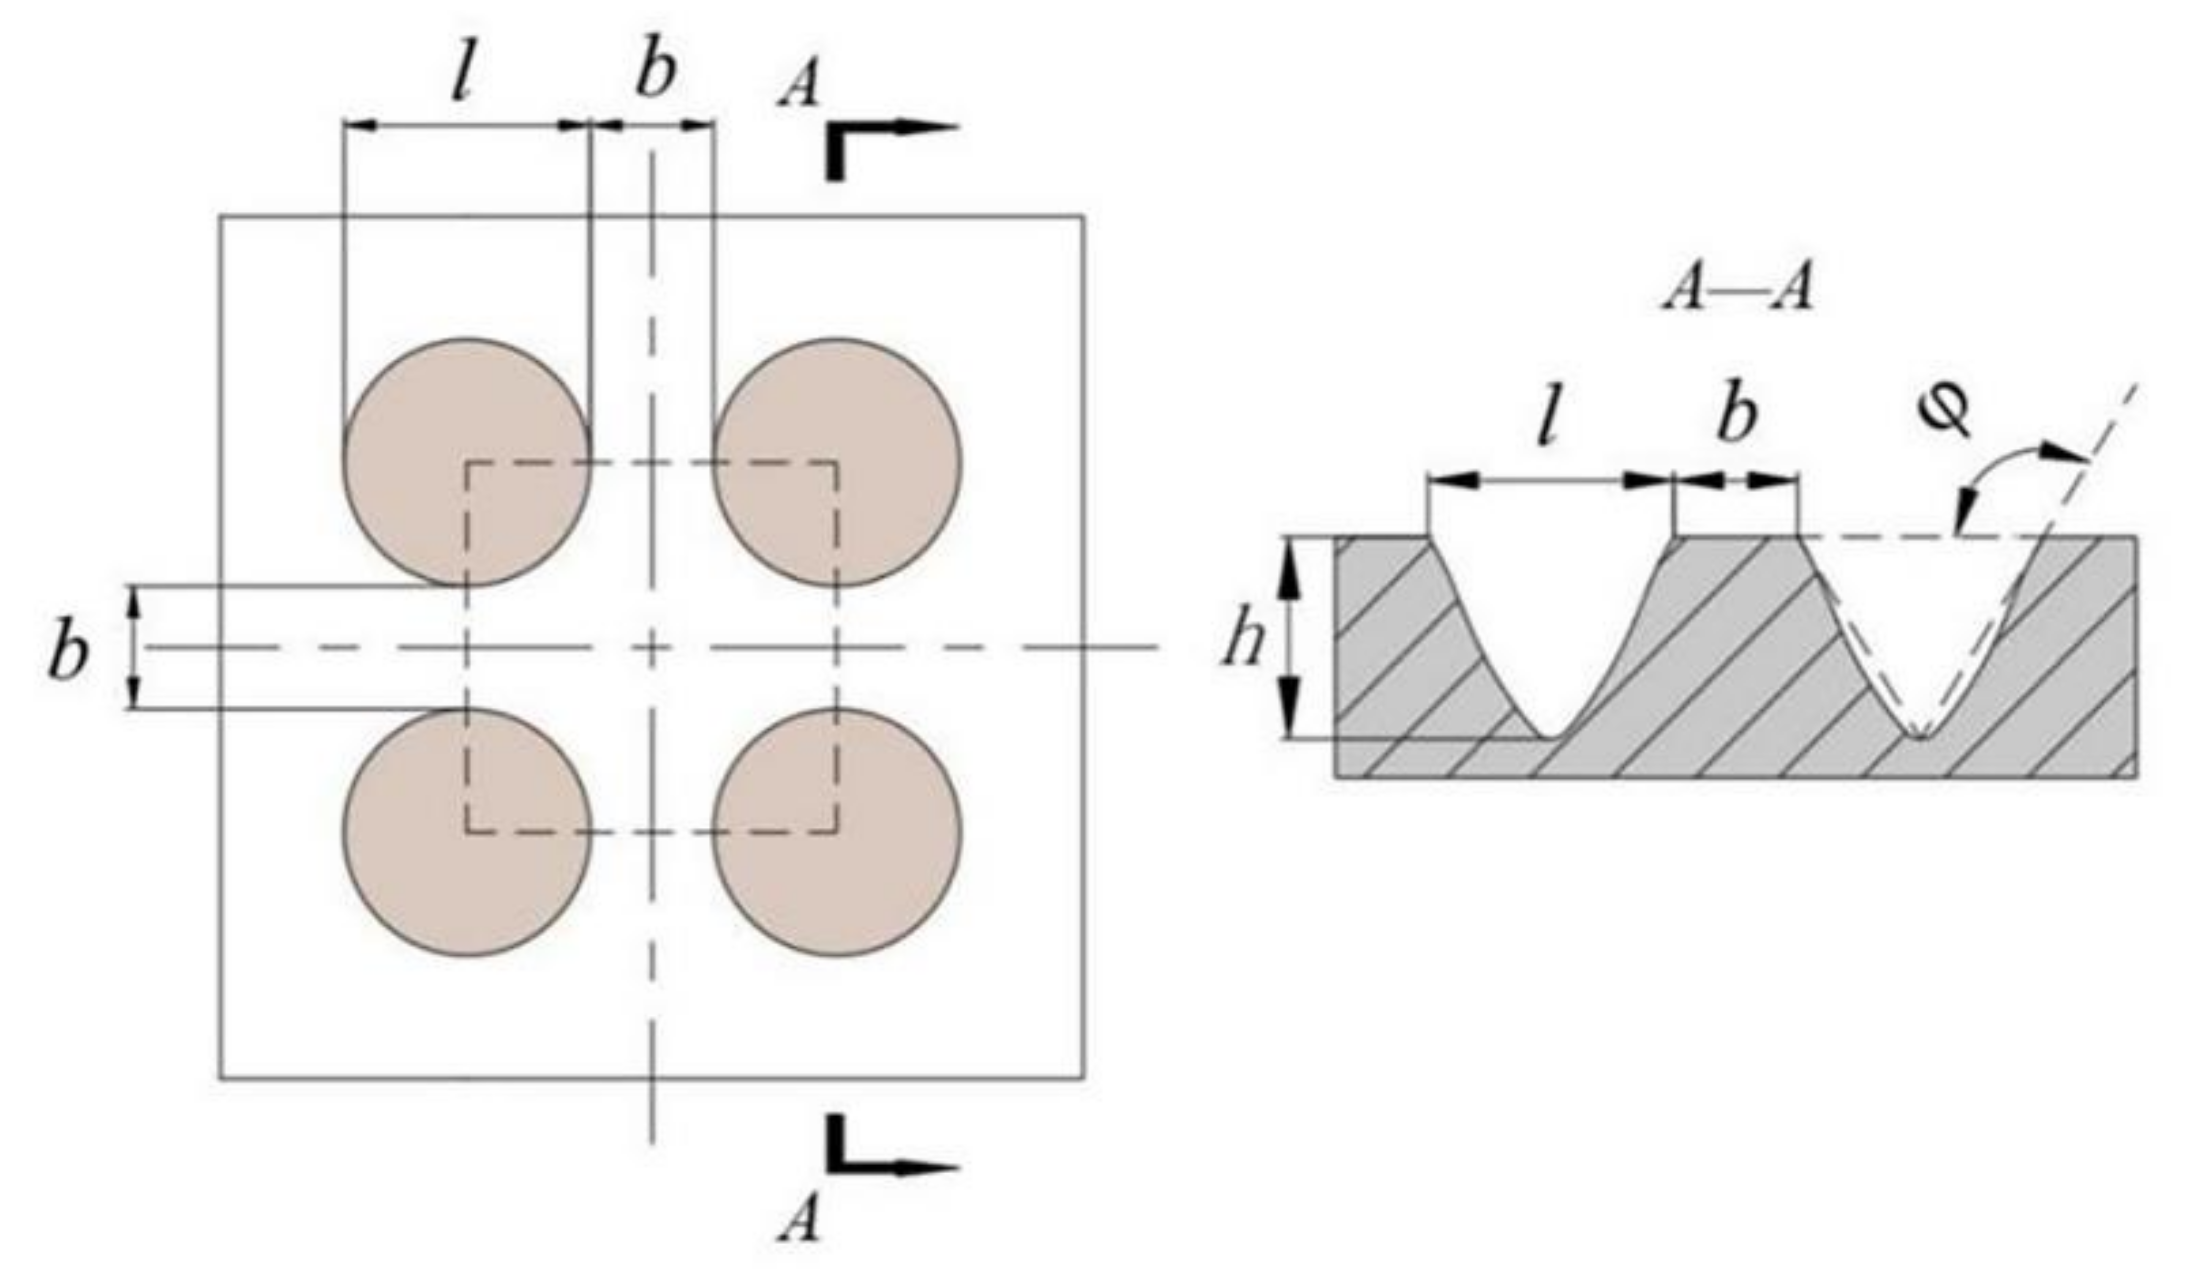
3.1. The Effect of LSO on the Dimple Sizes
- -
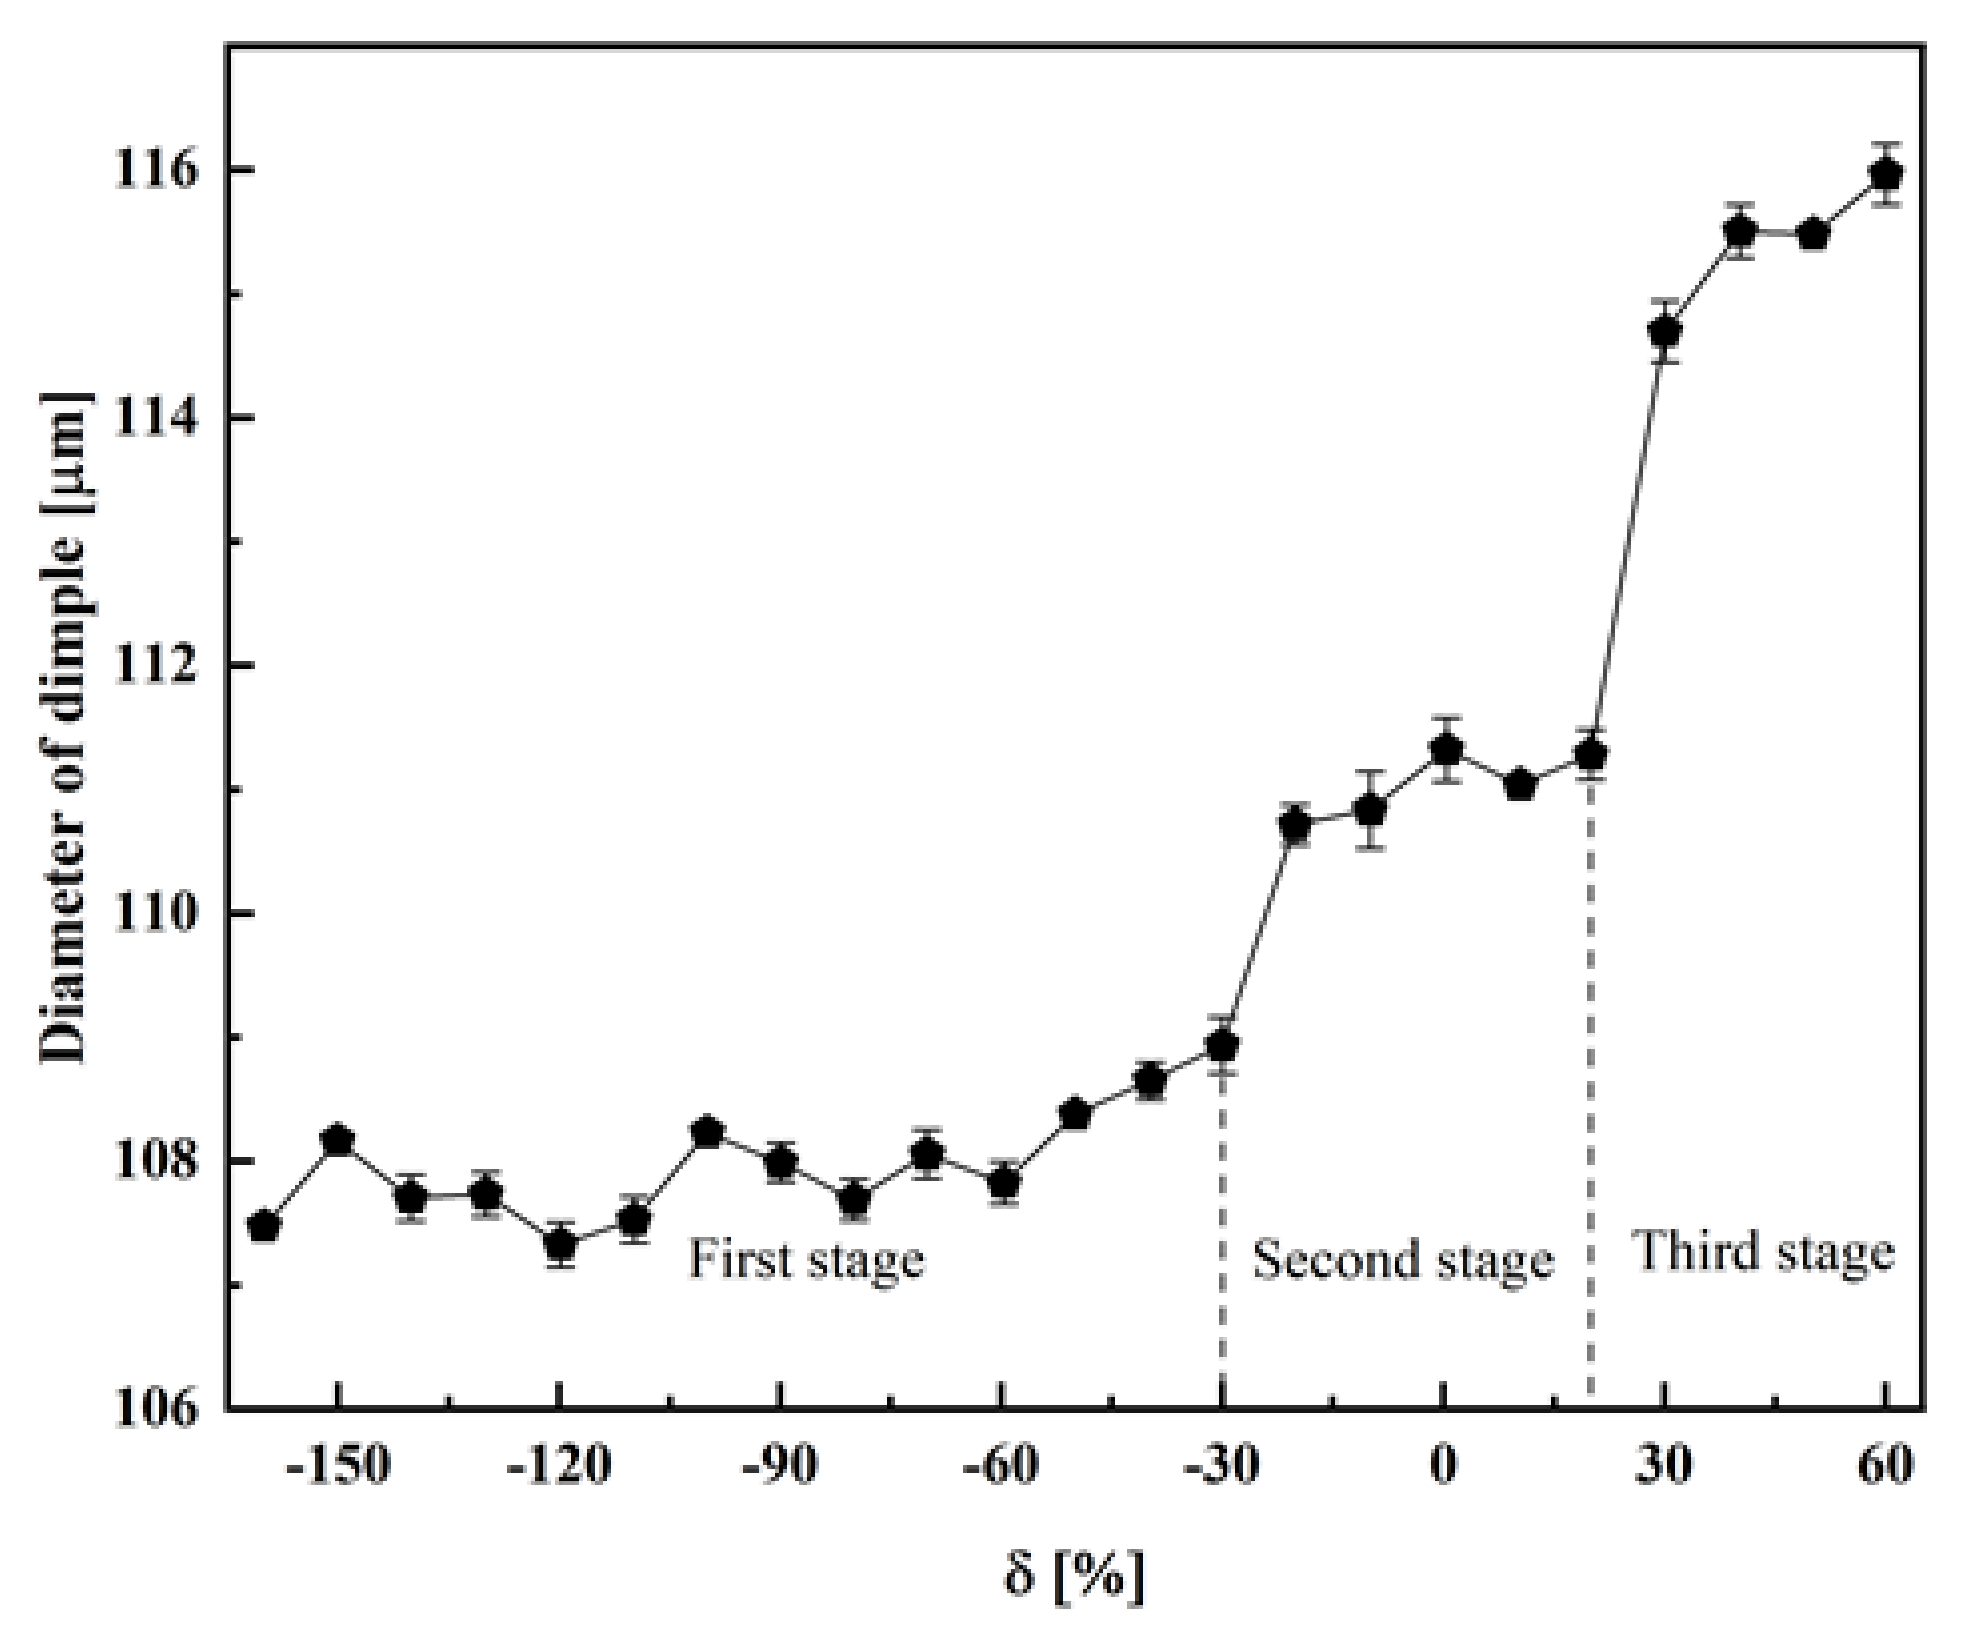
- In the first stage (δ ranging from −160% to −40%), the diameter of a micro dimple (using the inner arc as a measurement) is maintained at approximately 108 μm;
- -
- In the second stage (δ ranging from −30% to 20%), the micro dimple diameter increased approximately 110.6 μm. With the increase in the LSO, the irradiation distance of the pulse spot was shortened, and the heat deposited per unit area increased. As heat accumulated on the surface, the thermal stress would exceed the yield strength, resulting in plastic deformation and larger dimples [20];
- -
- In the third stage (δ ranging from 30% to 60%), micro dimple size increased to approximately 115.3 μm. The higher overlap rate increased the energy of laser interaction per unit area, sharply increasing the surface temperature. When the surface temperature reached the stainless-steel boiling point, the steel will vaporize and cause a sharp increase in the dimple size.
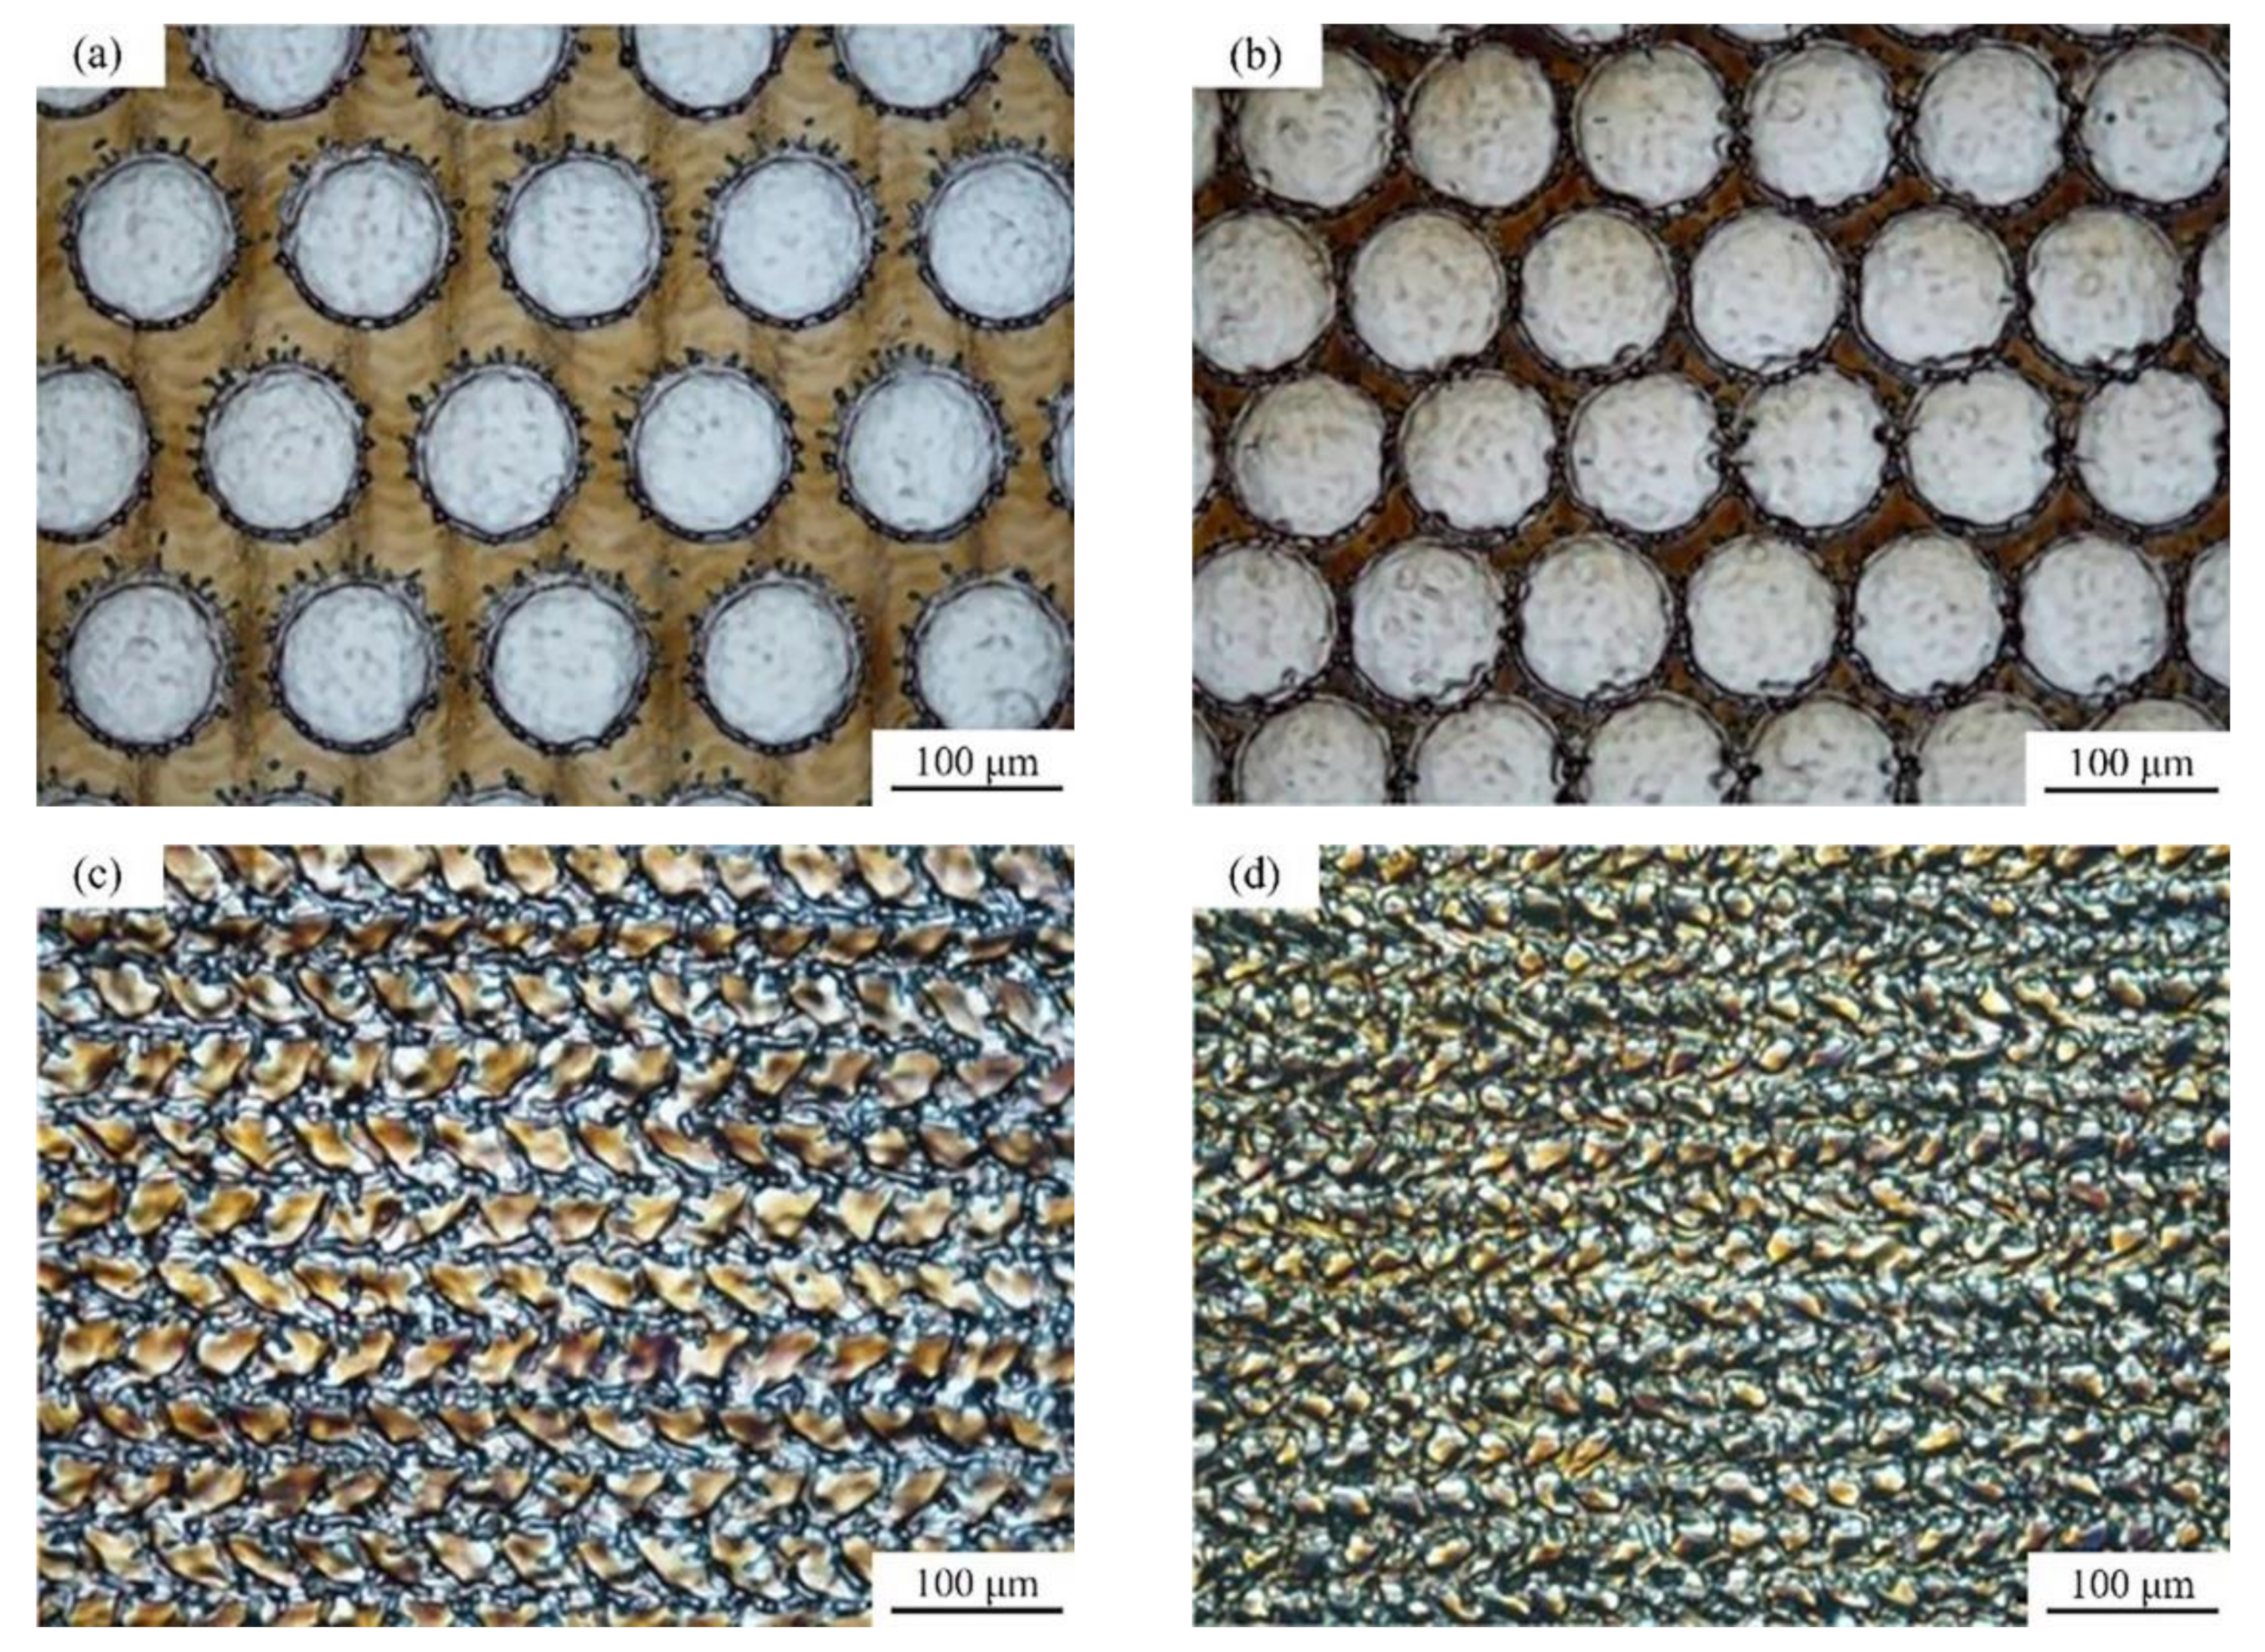
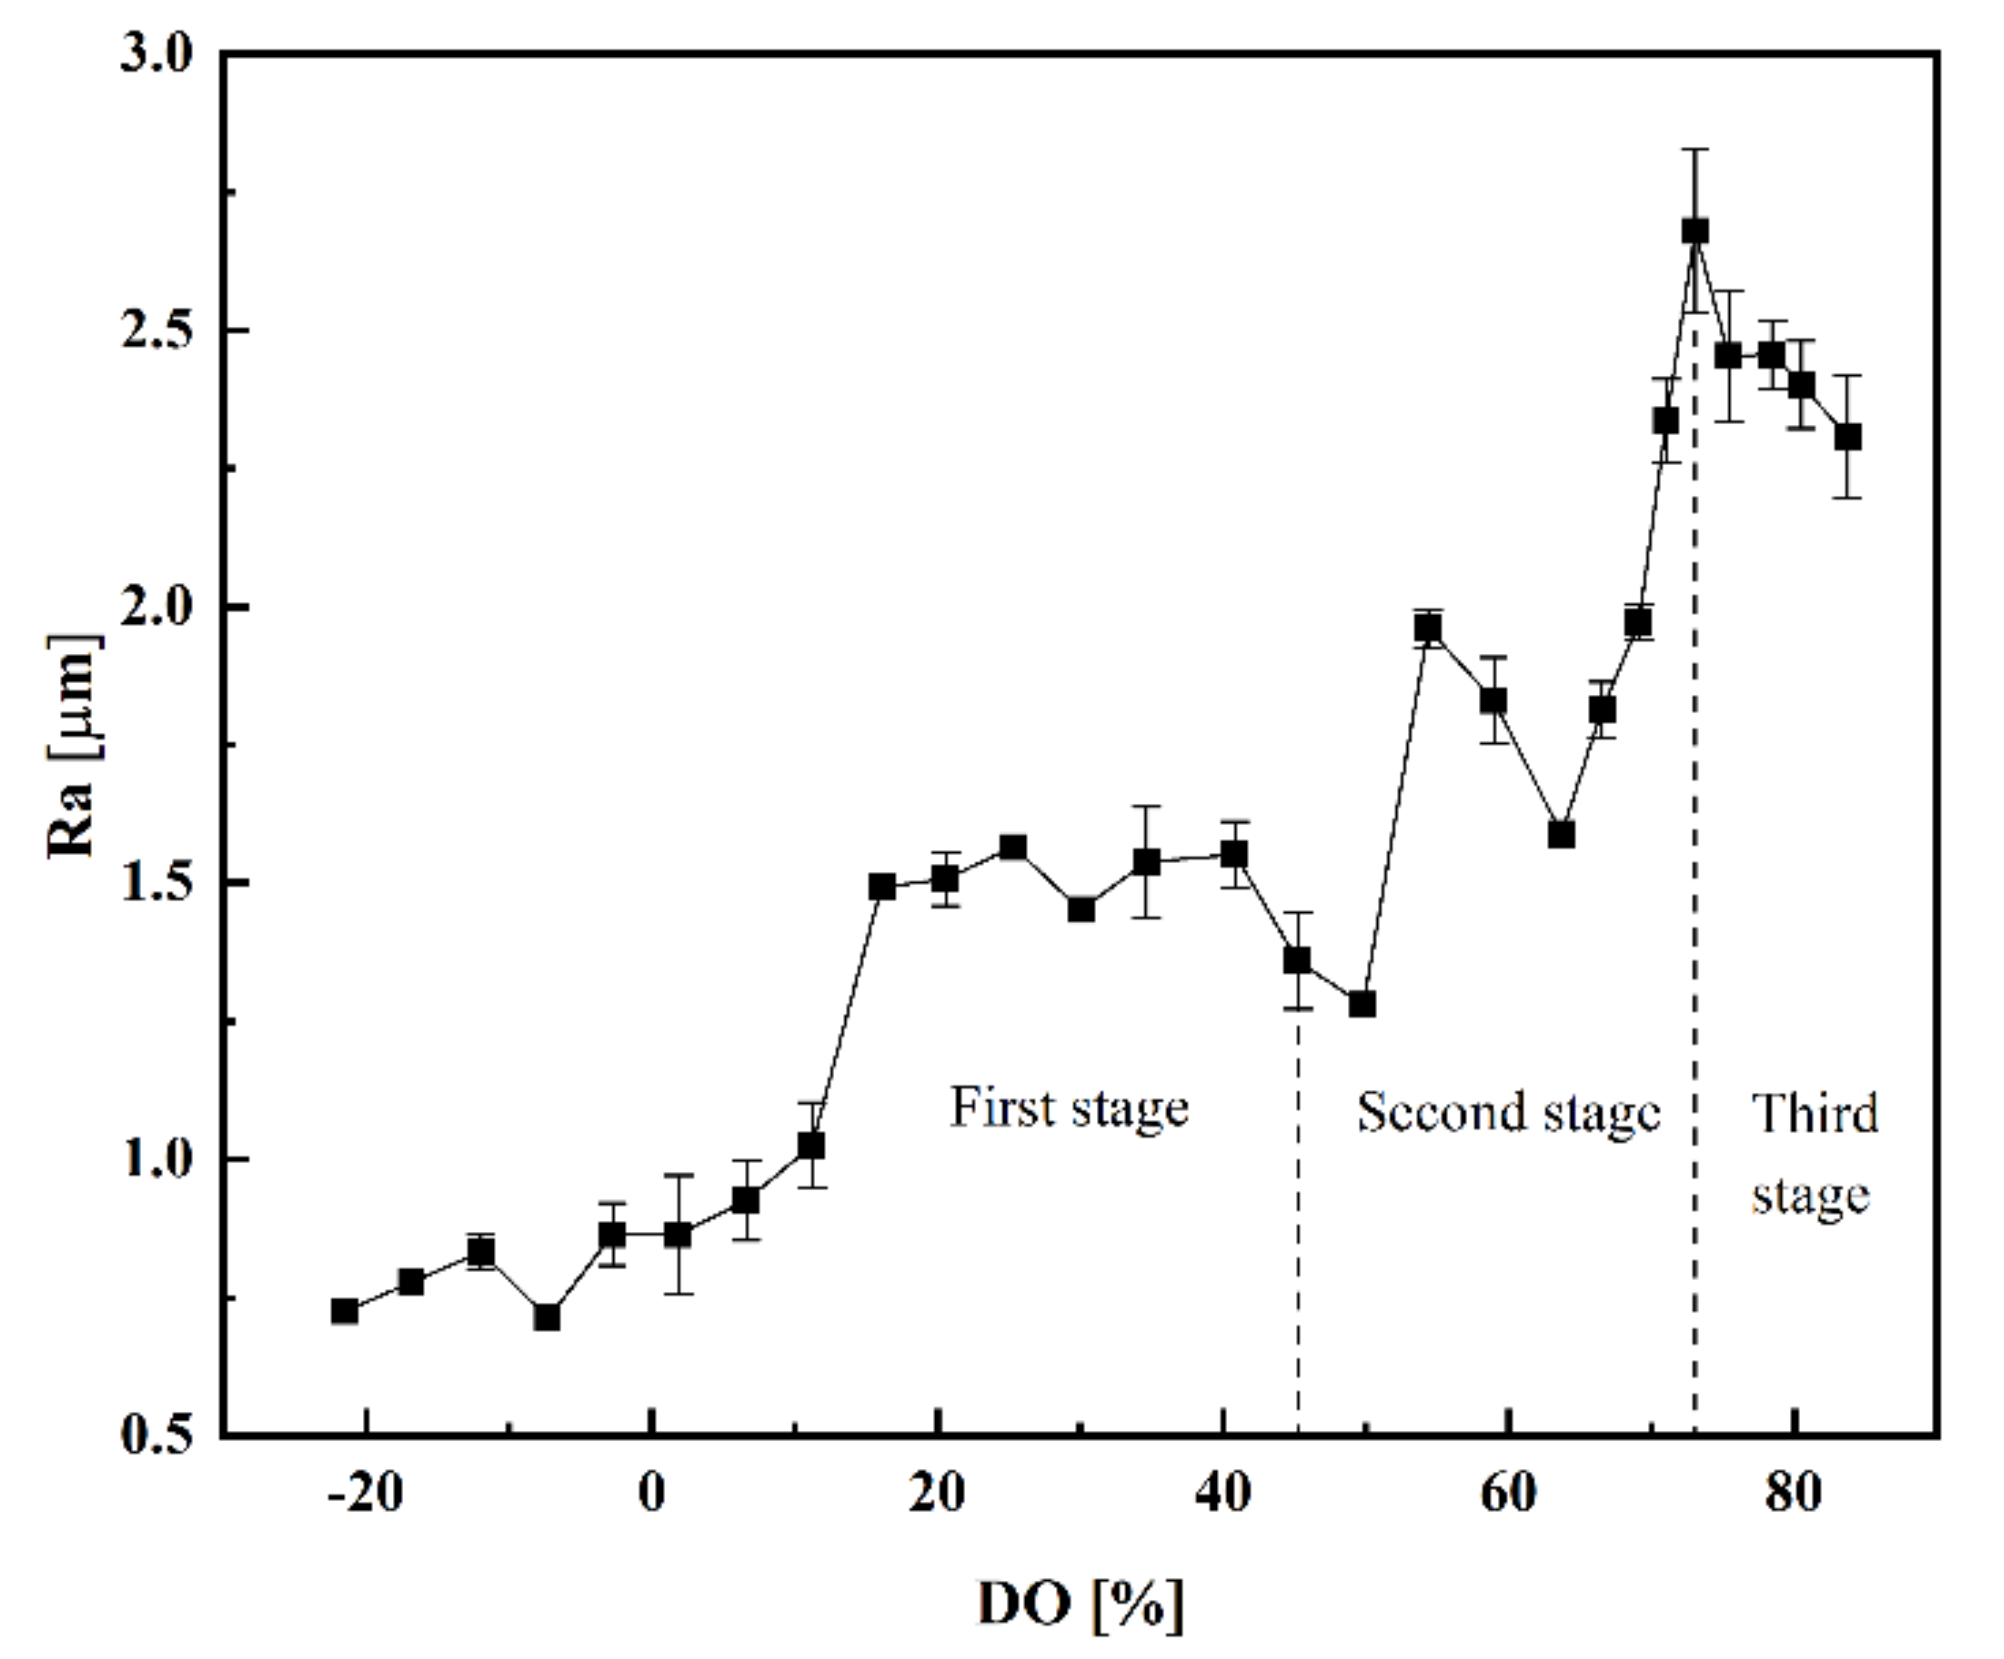
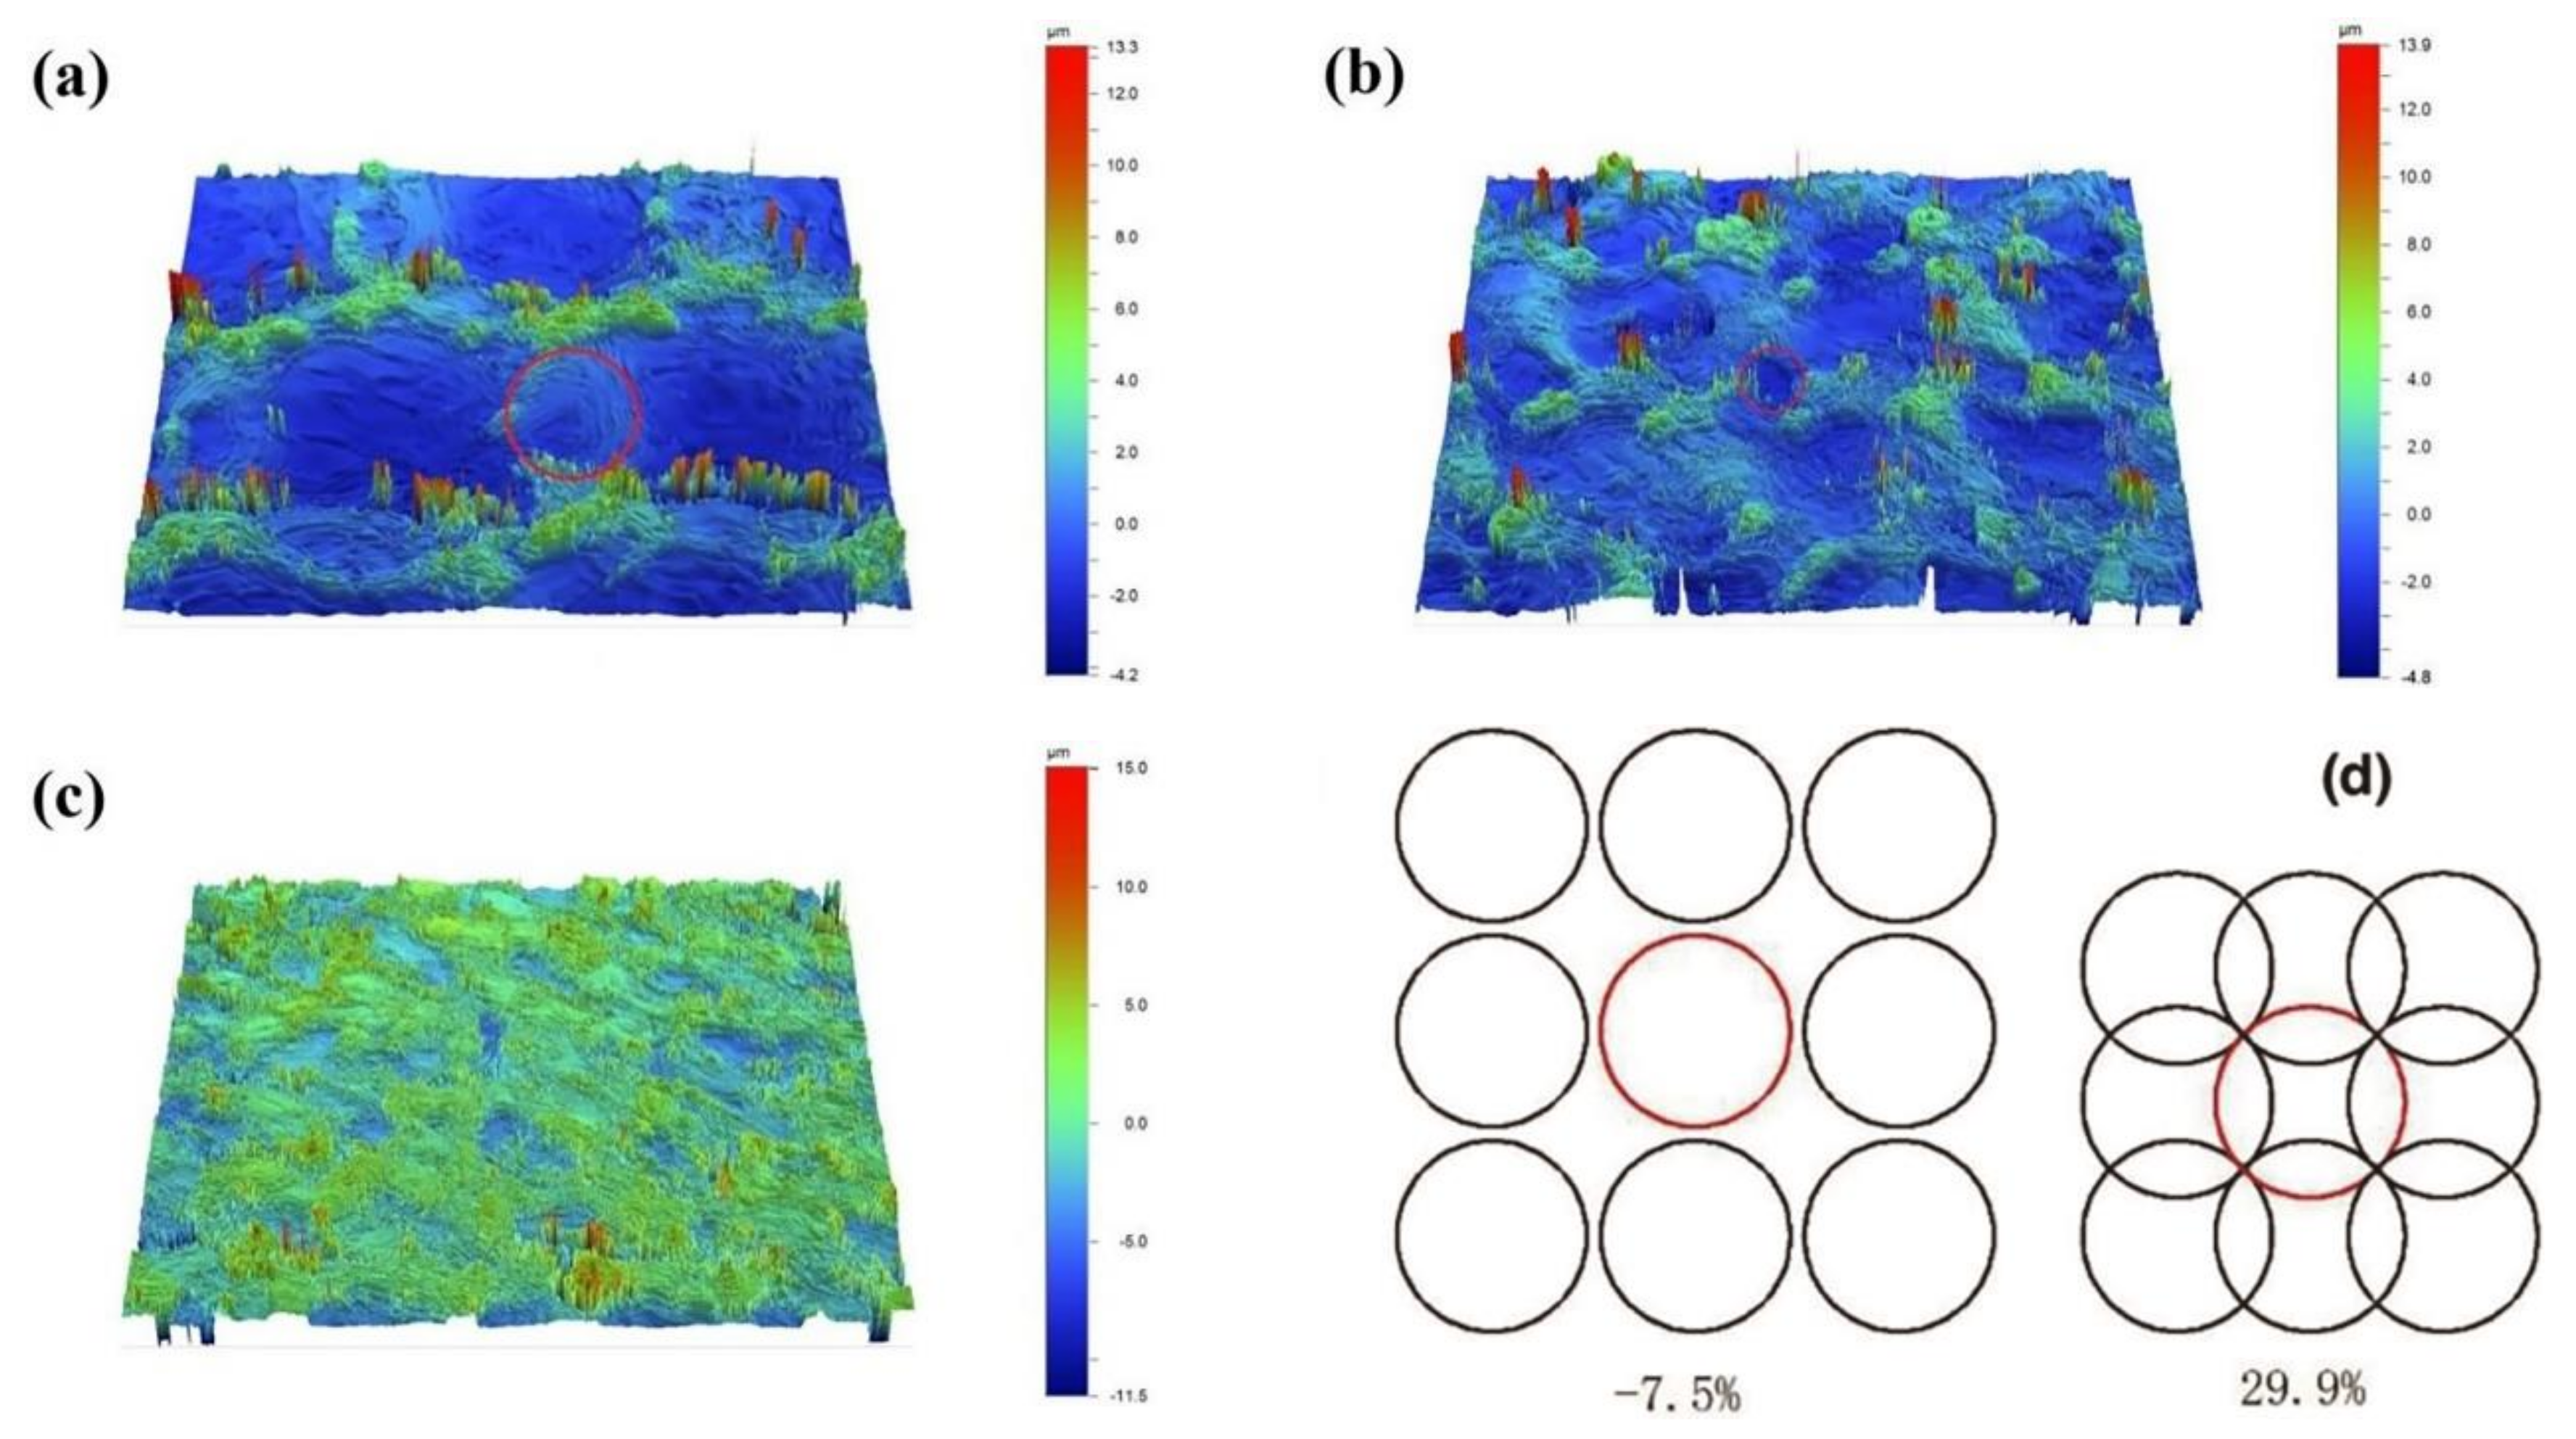
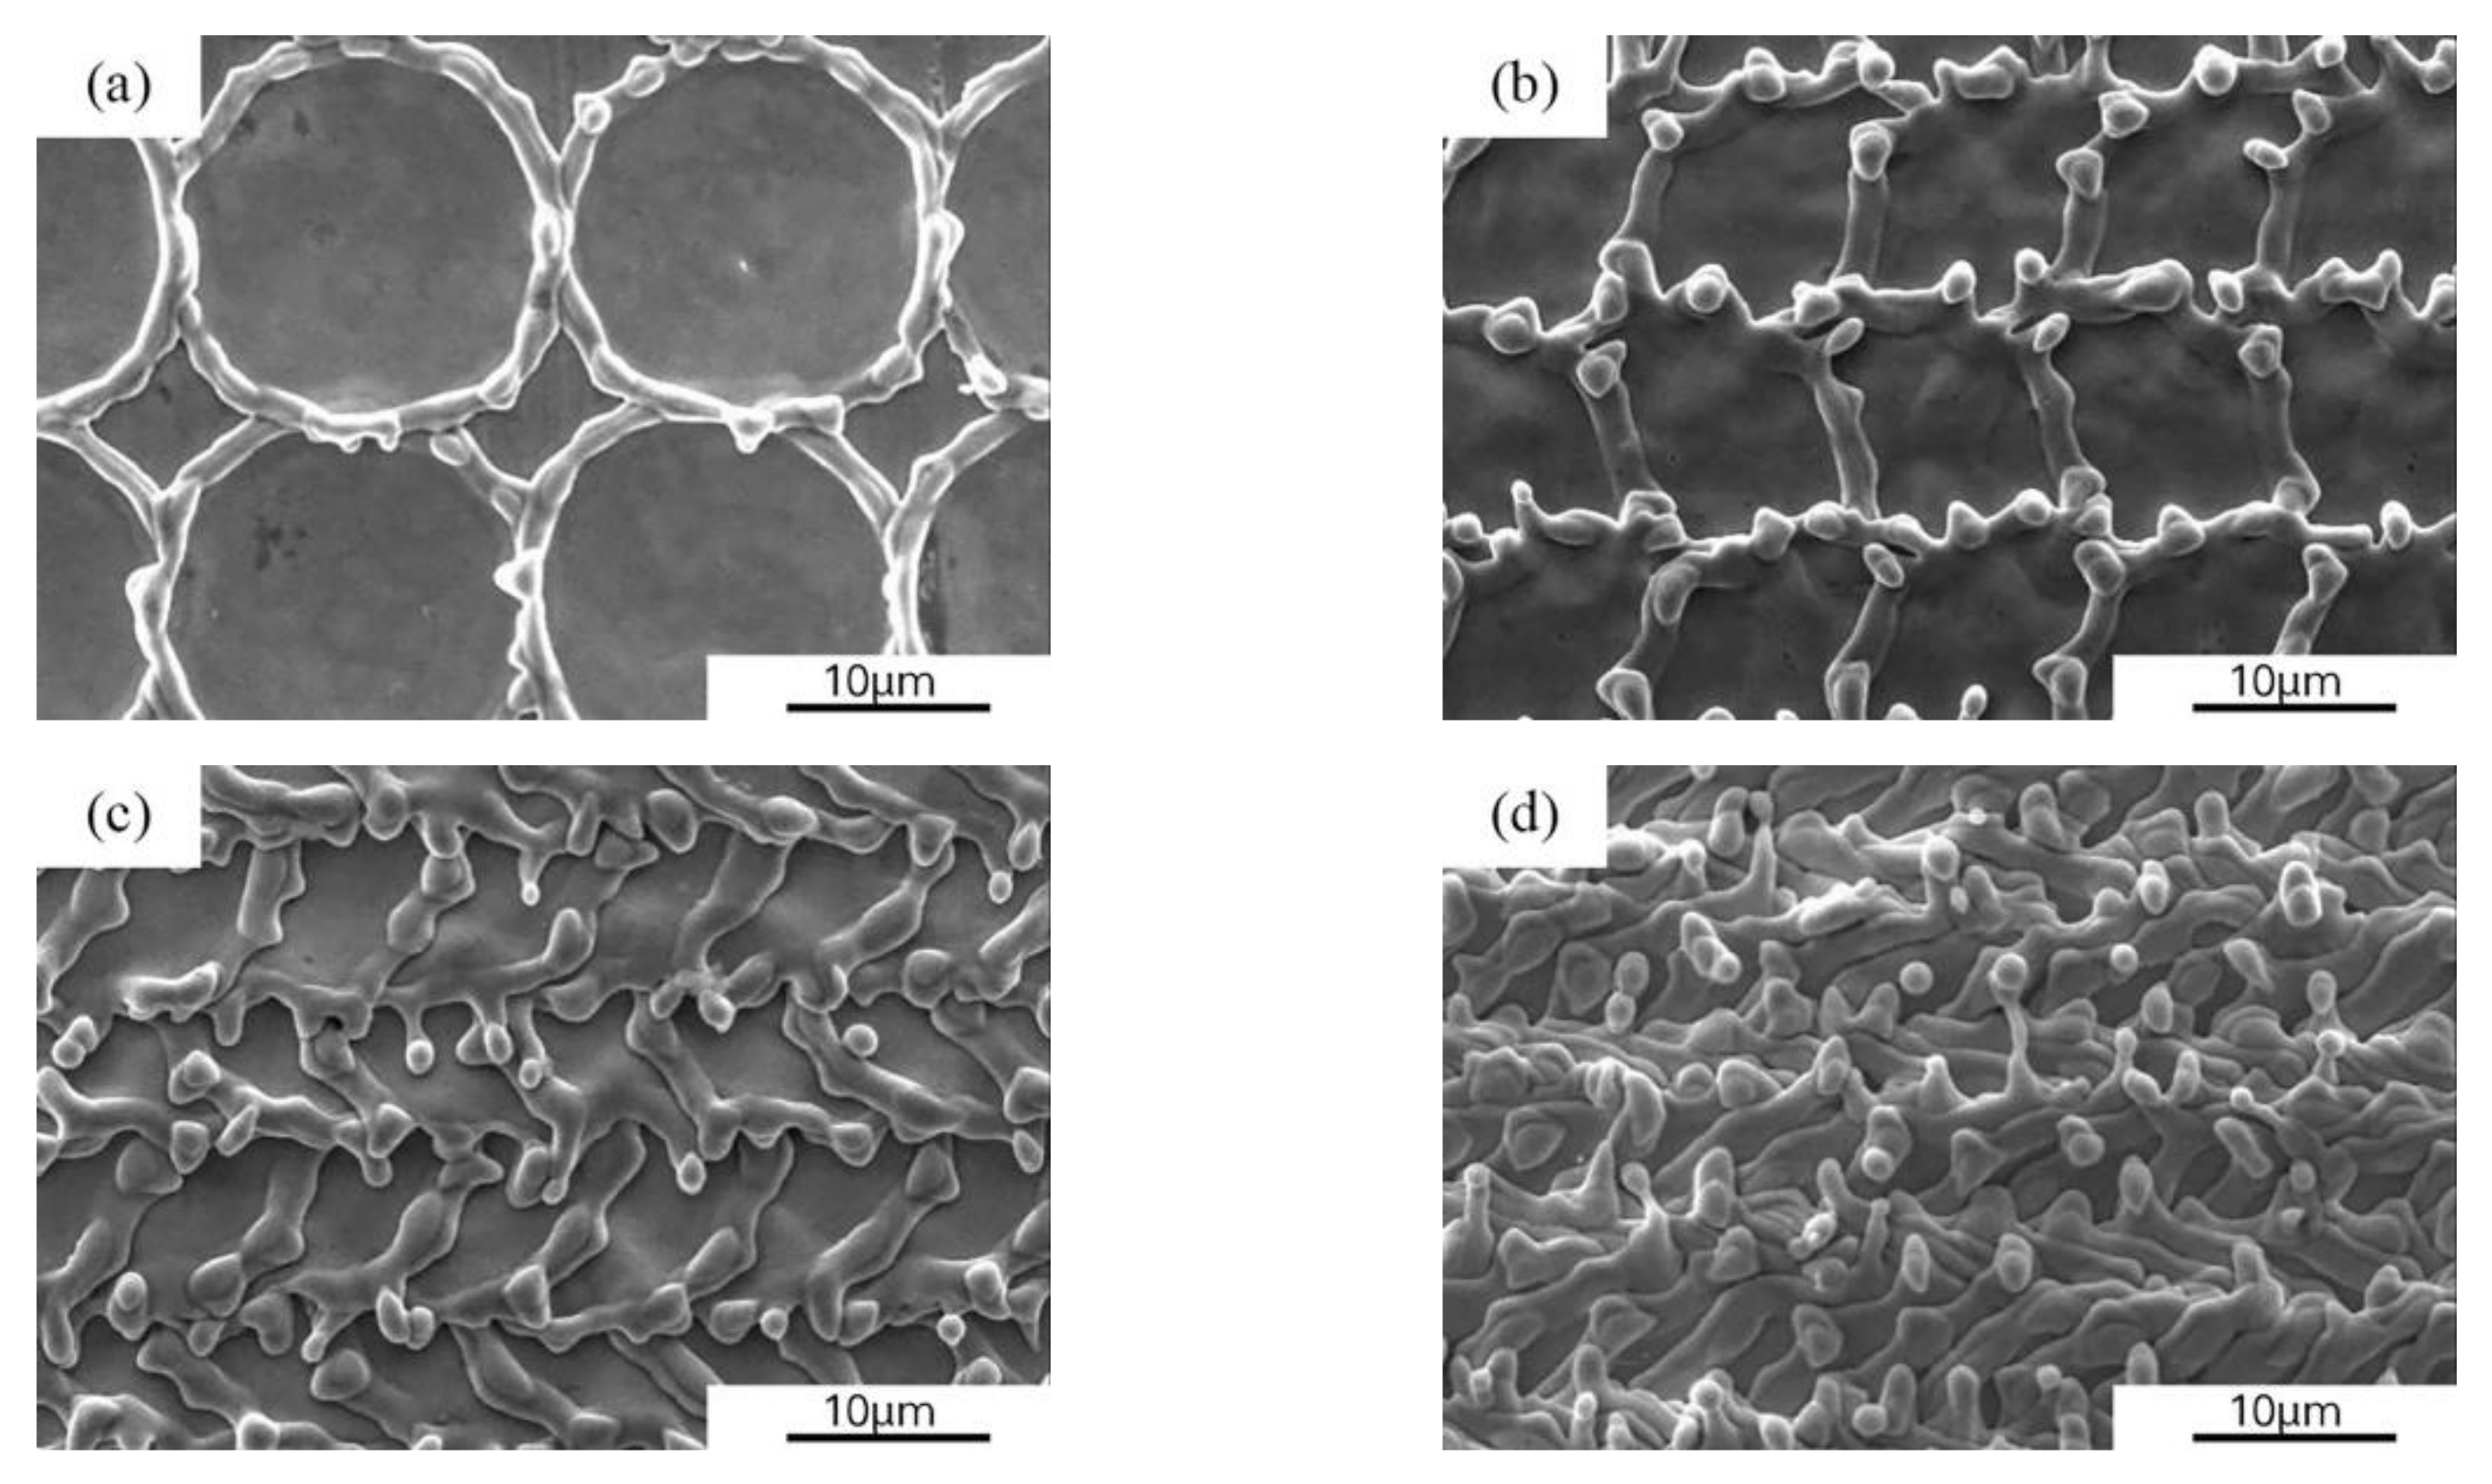
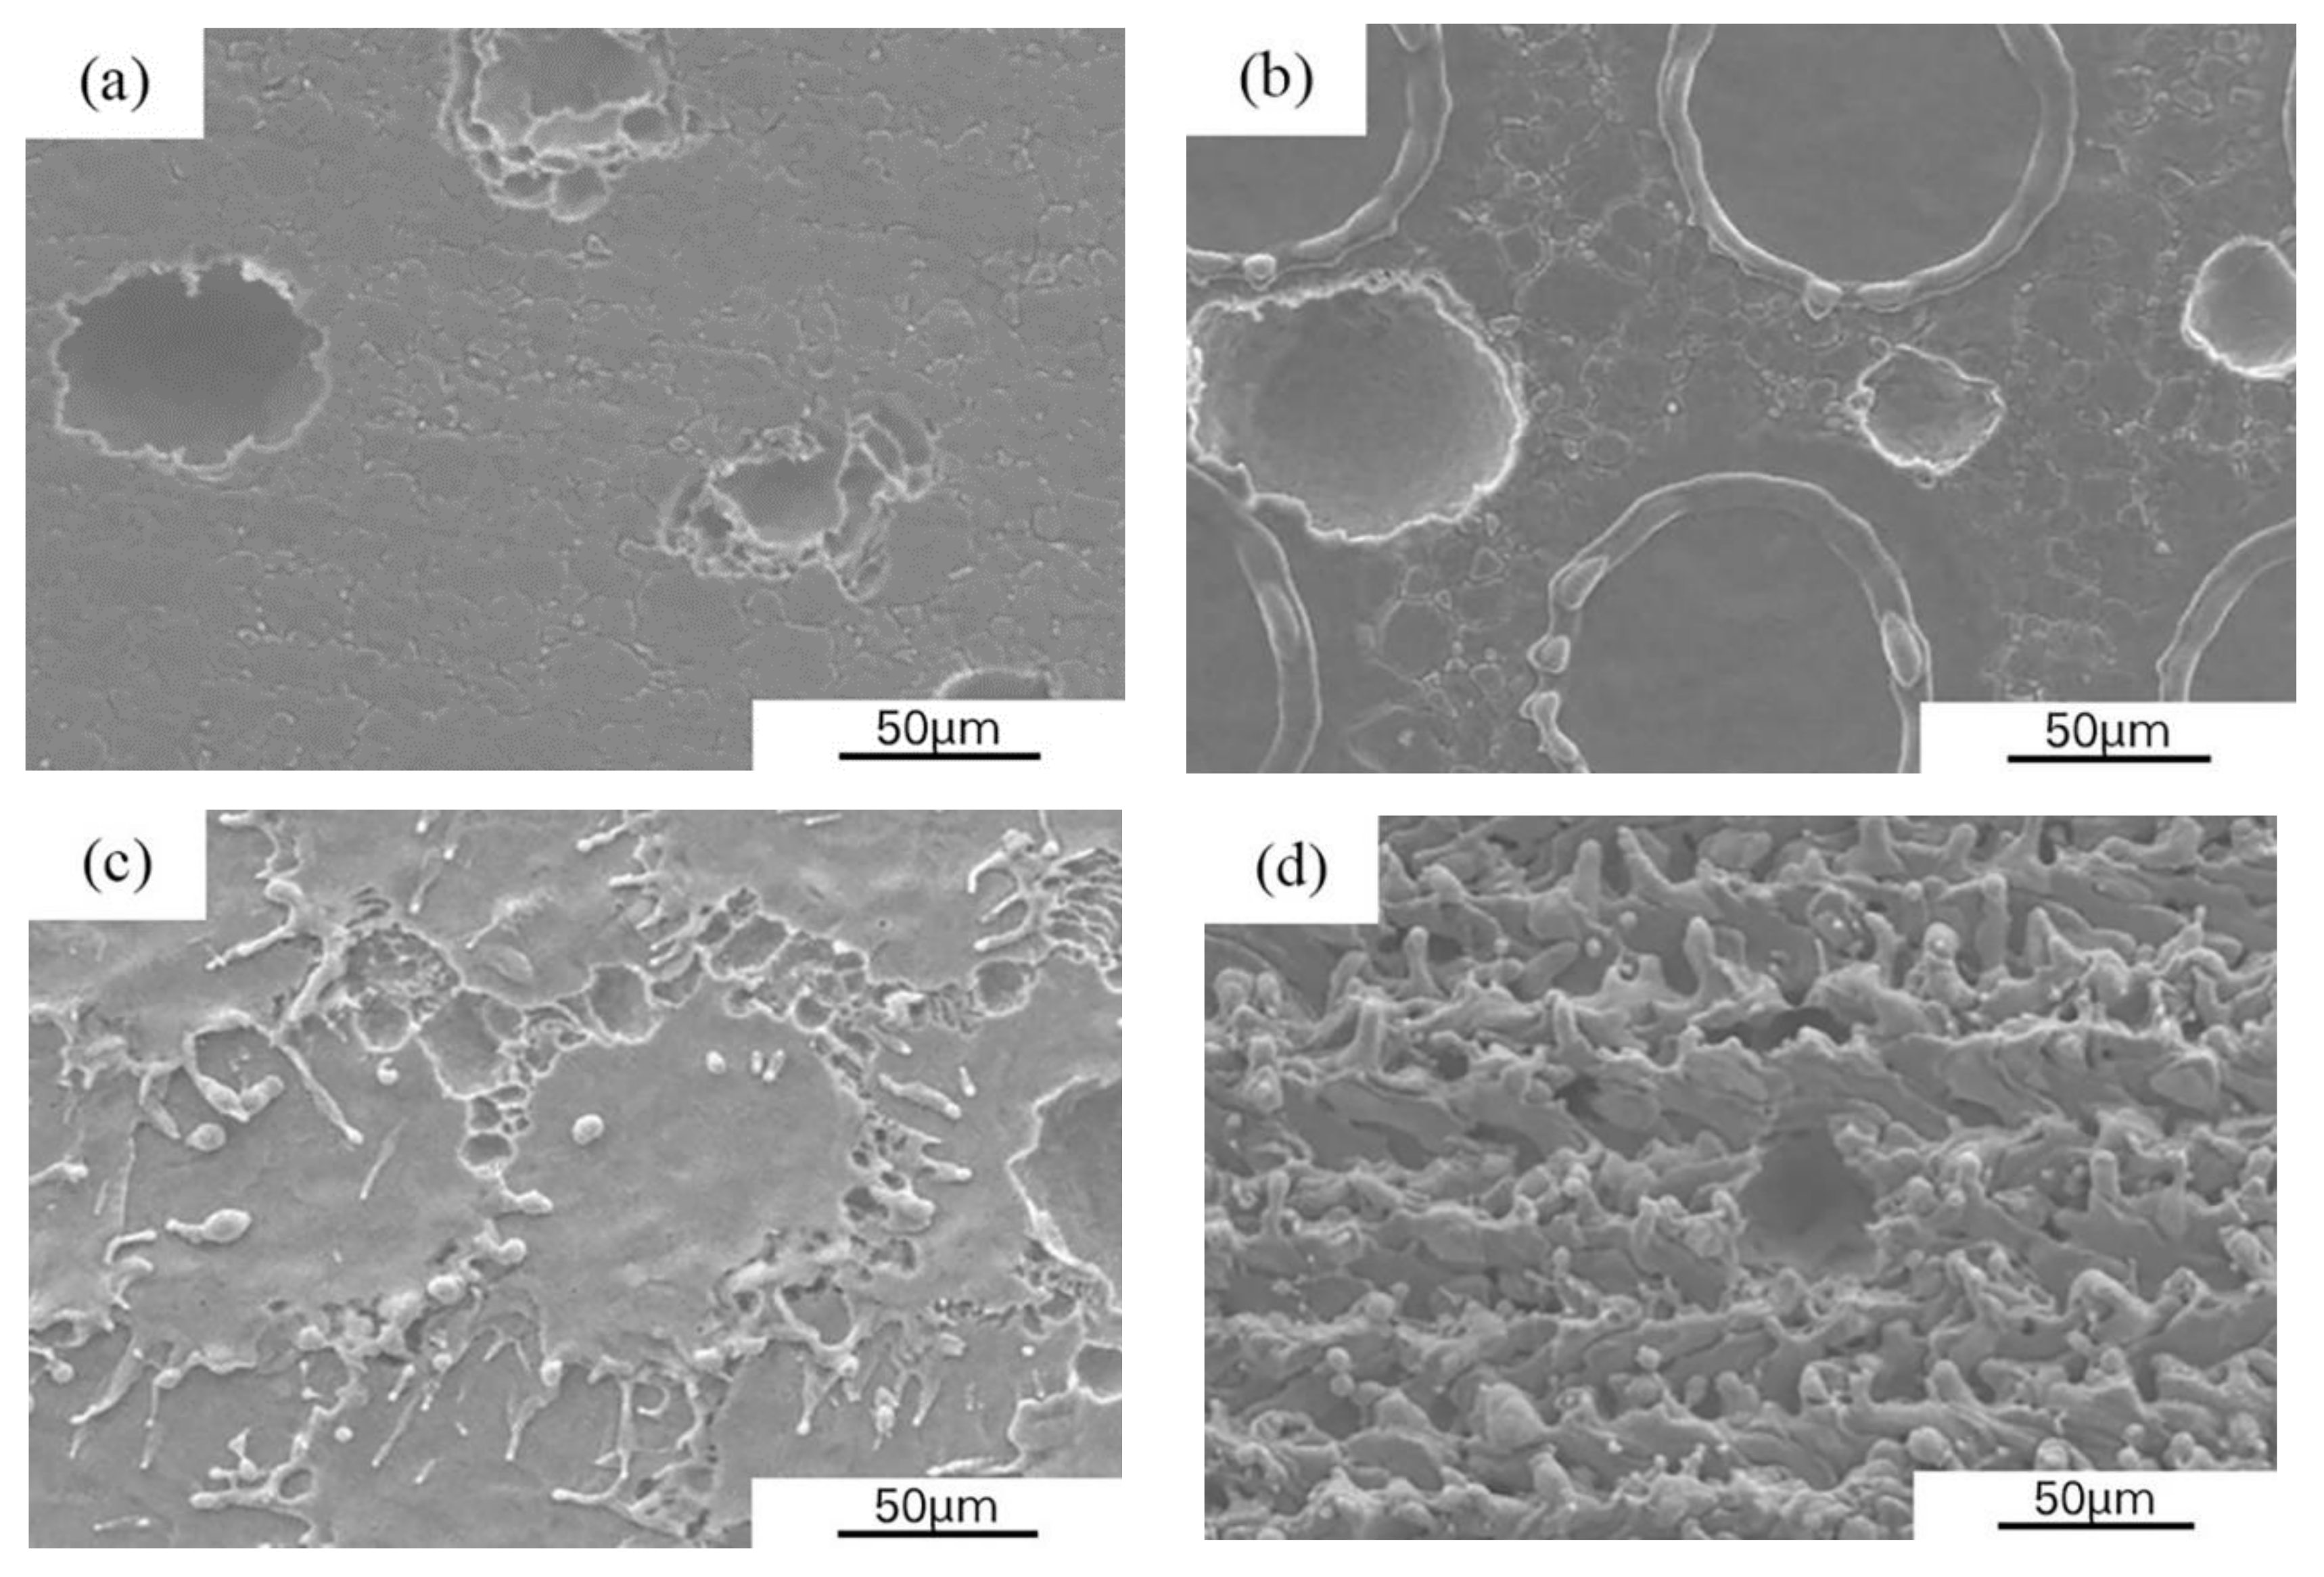
3.2. The Effect of DO on the Microstructure and Roughness of Laser Textured Surface
3.2.1. First Stage—A Discrete Condition of Dimples Is Dominant
3.2.2. Second Stage—The Minimum Area Proportion Is Dominant
3.2.3. Third Stage—The Melting and Vaporization/Plasmablast of Dimples Is Dominant
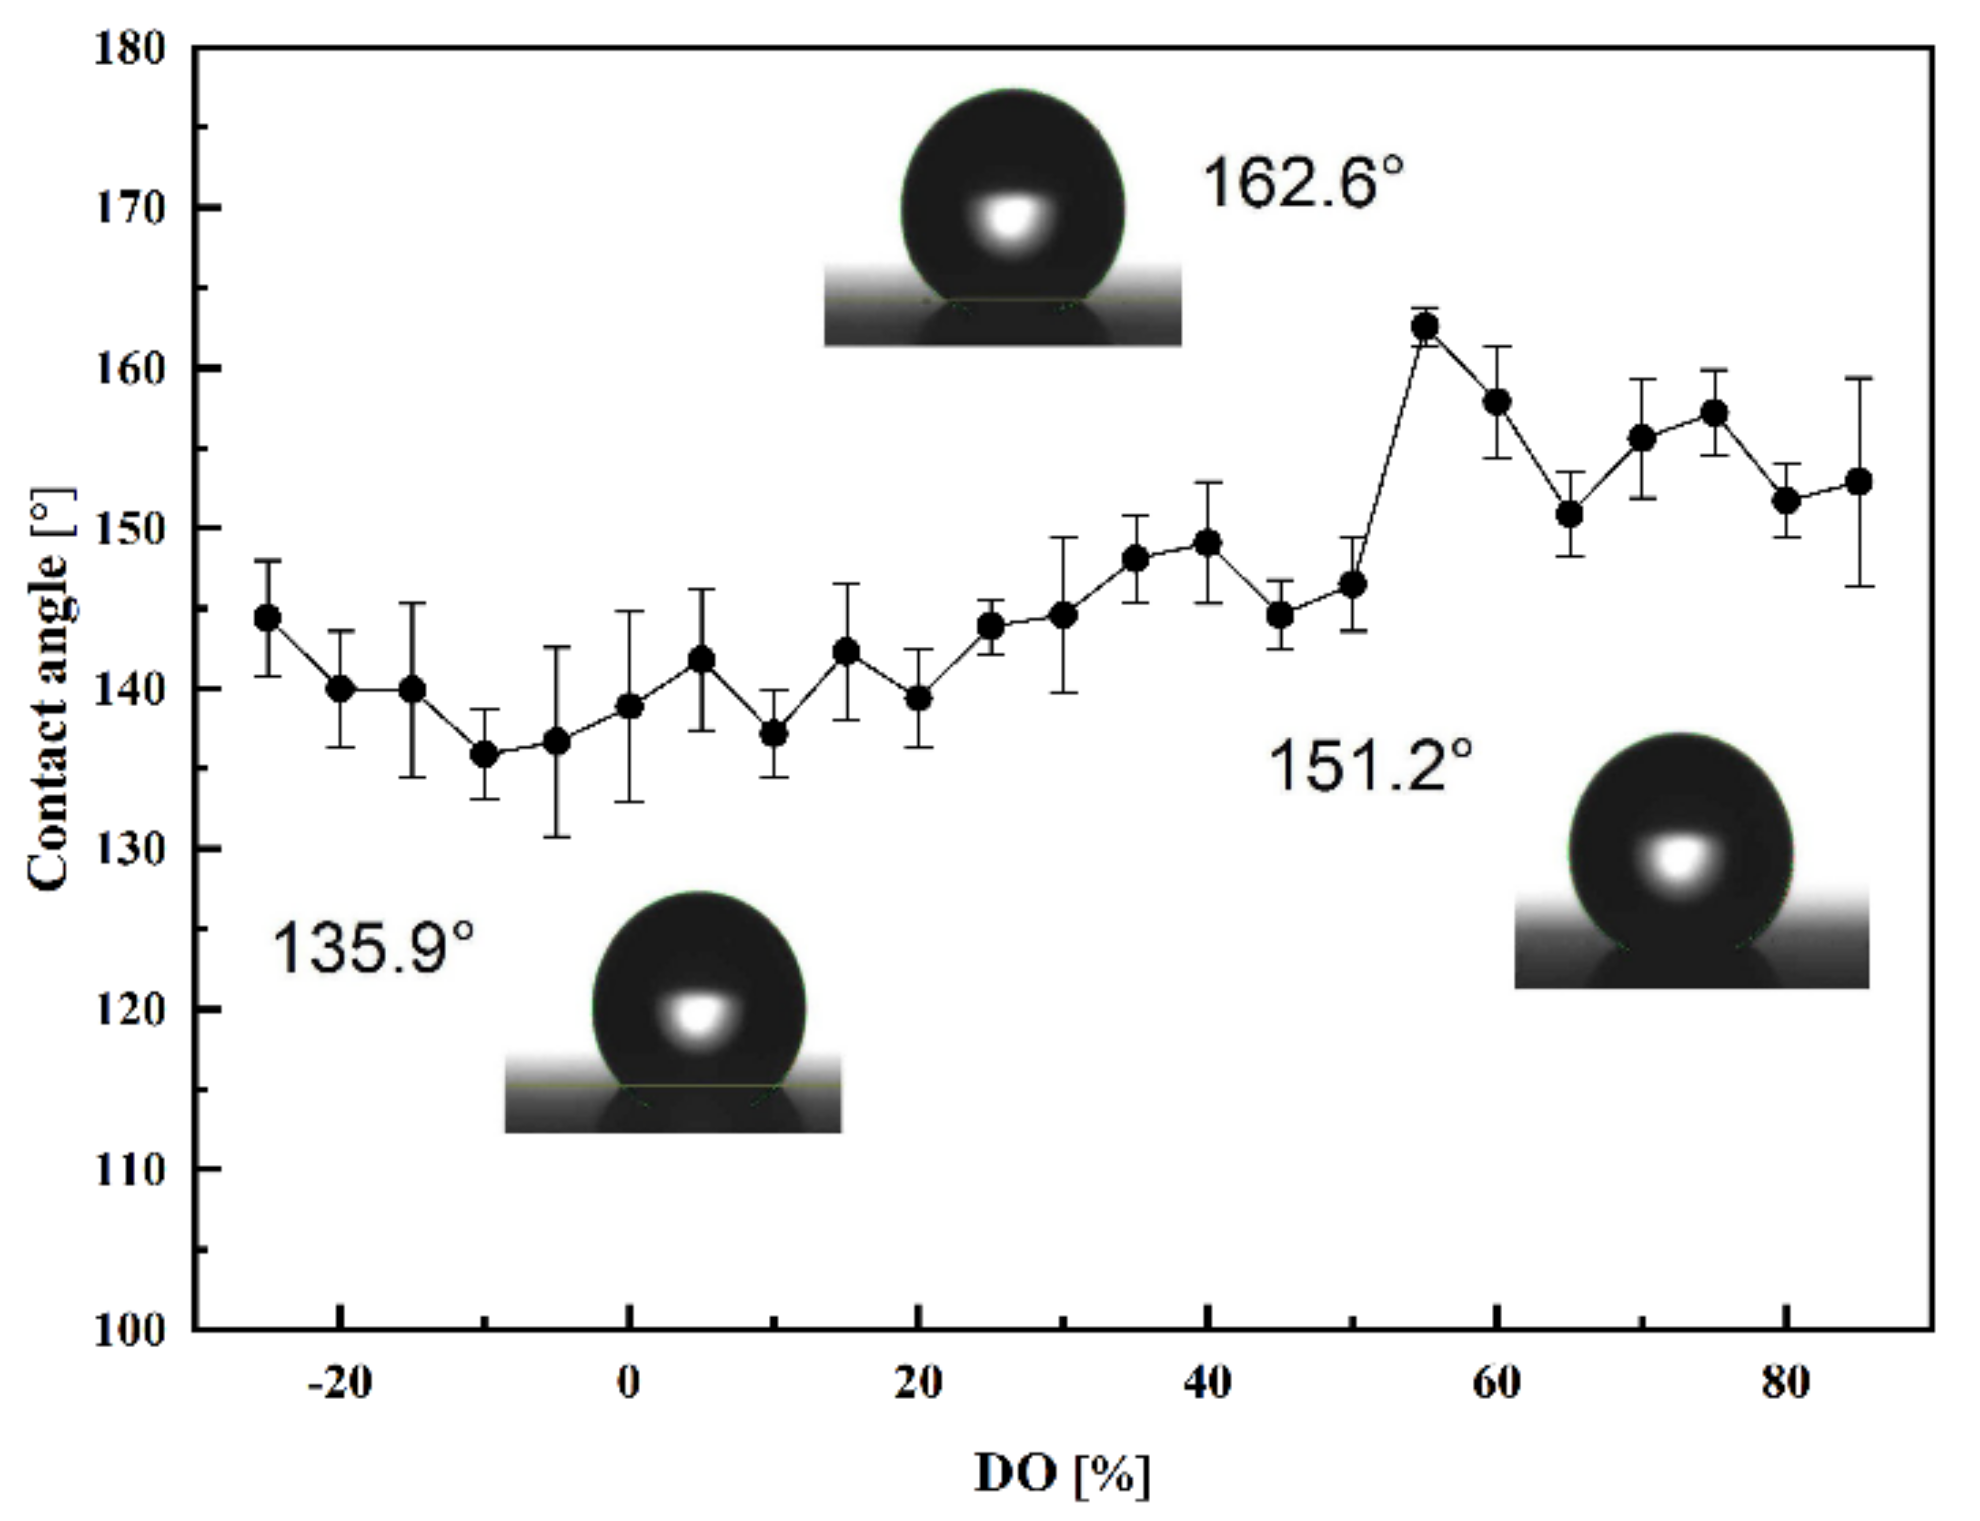
3.3. The Effect of DO on the Wettability of Textured Stainless Steel Surfaces
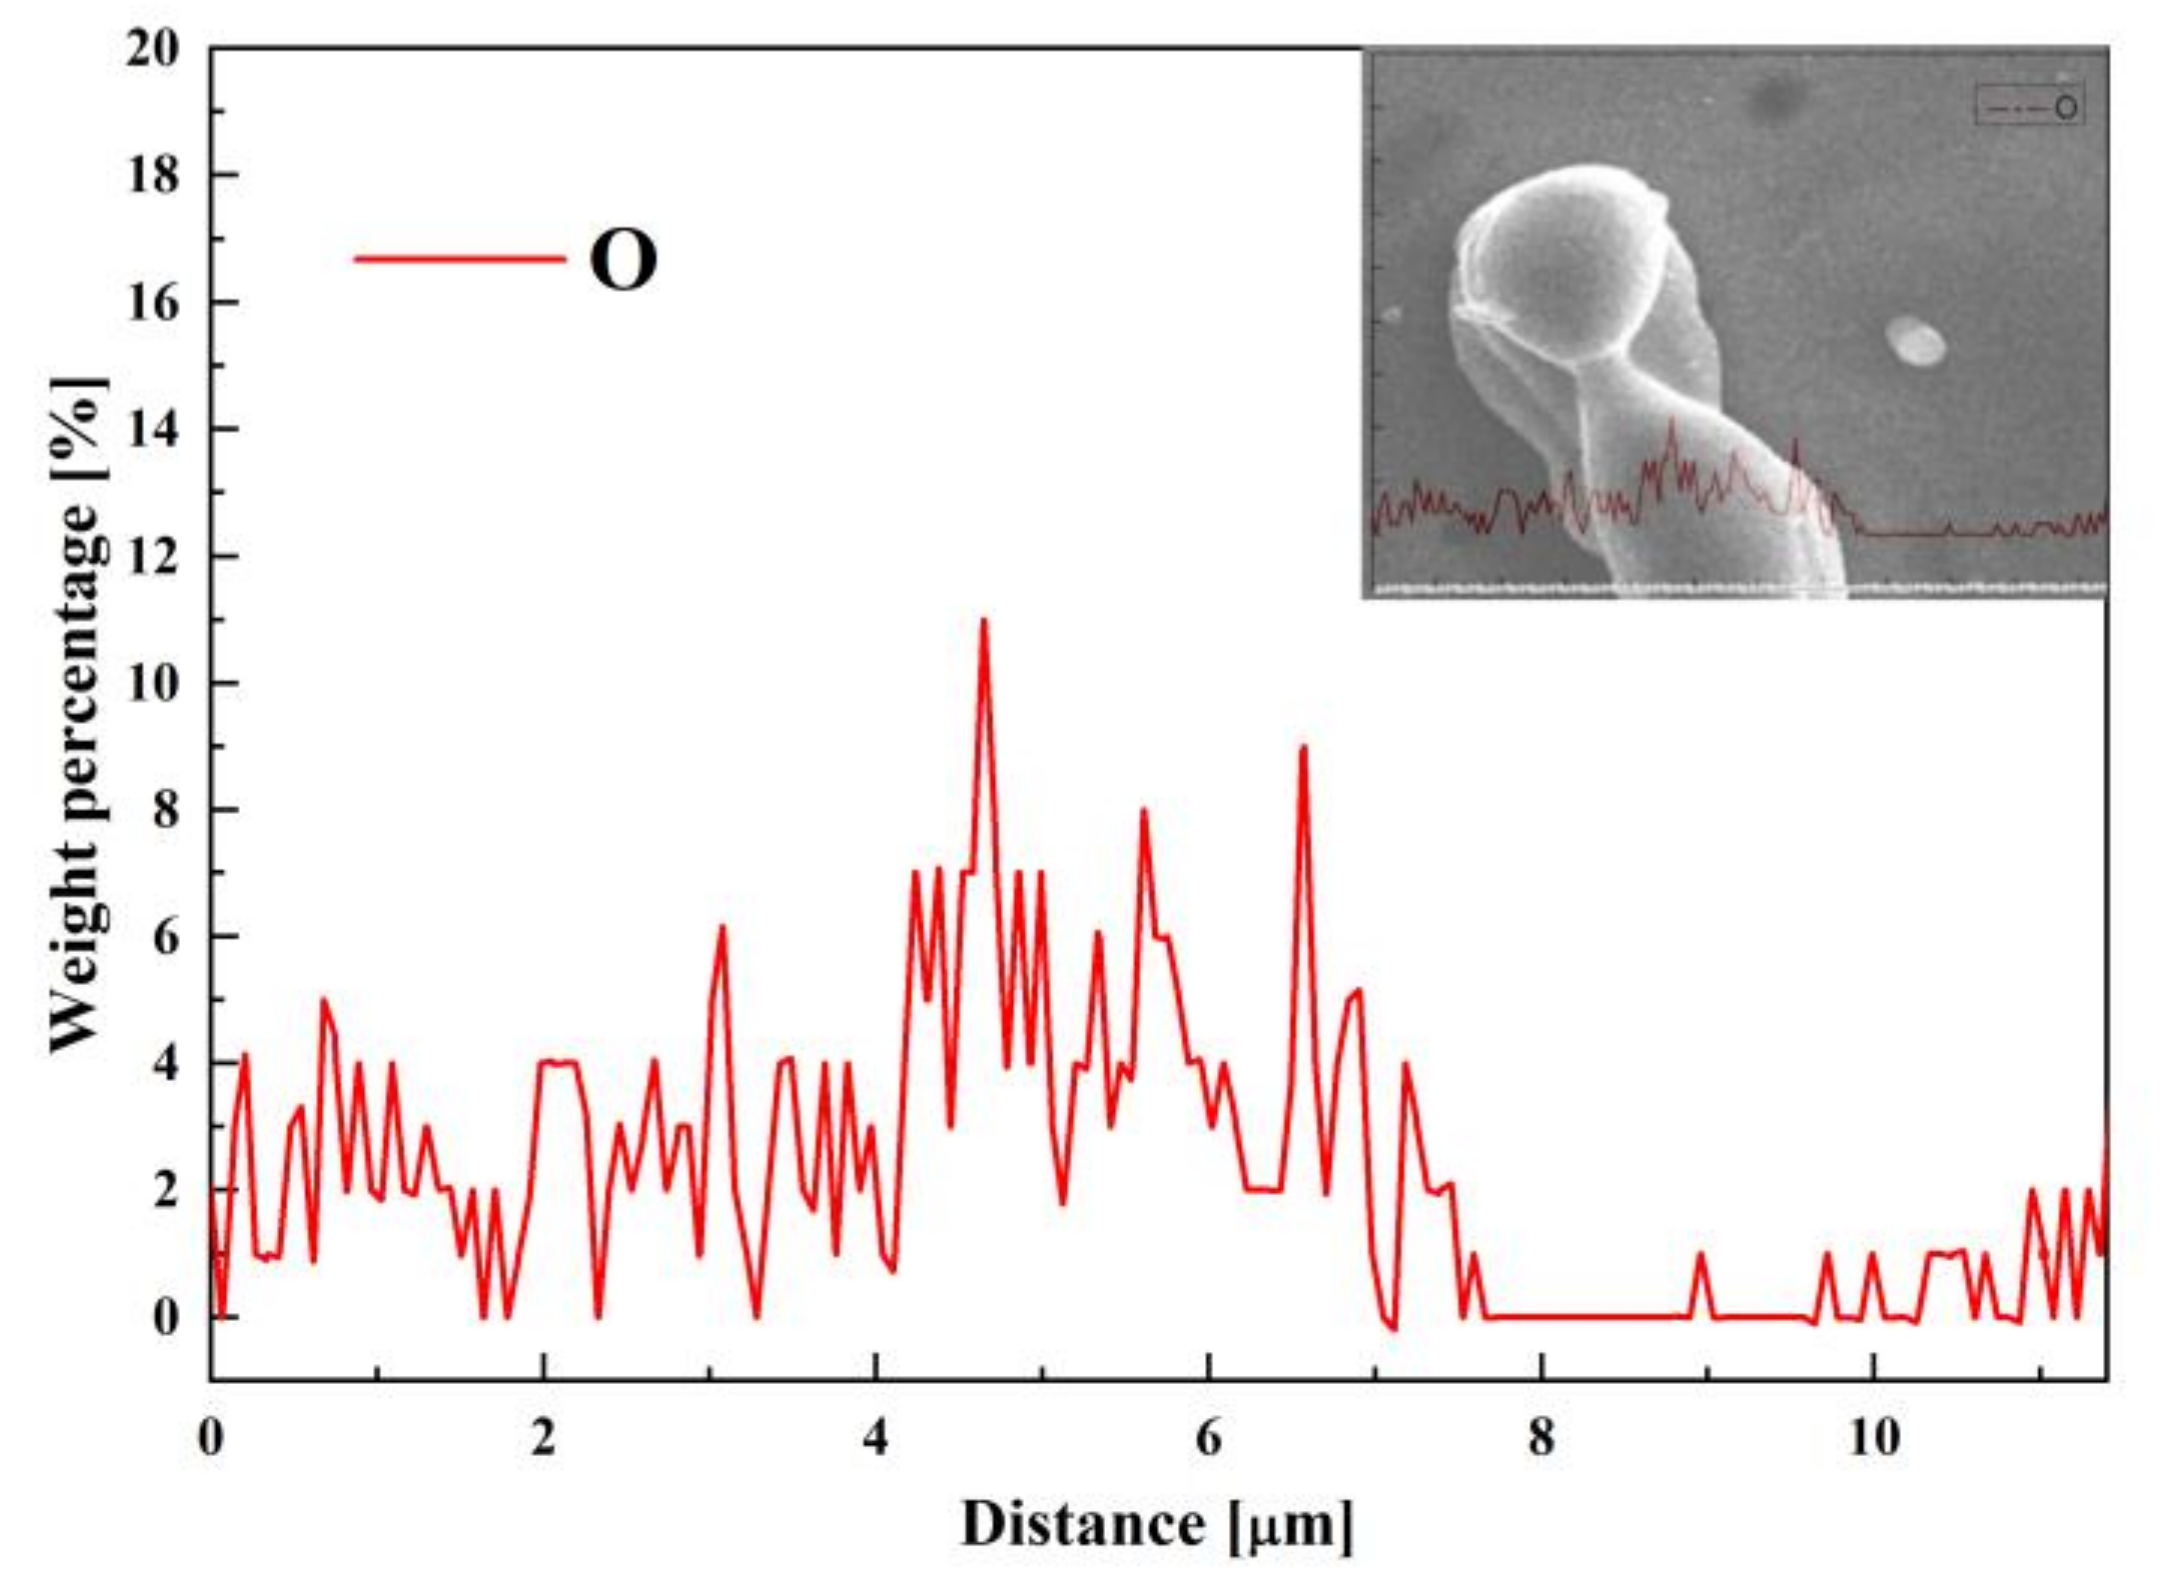
3.4. The Effect of DO on Corrosion Resistance
4. Conclusions
- (1)
- The size, shape, and microstructure of laser textured steel surface dimples cannot be linearly controlled via the LSO rate. When the LSO rate ranged from −160% to 60%, the dimple diameter was determined not only by the LSO thermal effect but also by the beam power density;
- (2)
- The DO affecting the surface roughness can be divided into three stages, each having different dominant factors. When DO was between −21.5% and 34.6%, Ra firstly increased, which was followed by a flat period. The dominant factor was the degree of dimple dispersion. As DO changed to 40.7~63.5%, Ra has shown an upward oscillation trend. The bottom-to-surface rate (S0) was the dominant factor, and the maximum Ra value was approximately 2.7 μm. Finally, the cumulative effect of heat was significant when DO grew from 67.7% to 82.7%, causing vaporization and a reduction in surface roughness;
- (3)
- The apparent contact angle and roughness changes were basically consistent with those of the DO. The laser texturing and heat treatment promoted the adsorption of non-polar organic compounds, reducing the free surface energy. When the DO was greater than 55%, the surface reached the superhydrophobic state and the maximum apparent contact angle was 162.6°. However, challenges remain in the durability and stability of hydrophobic surfaces prepared by spontaneous adsorption;
- (4)
- The stainless-steel corrosion resistance can be improved by the LST. The corrosion resistance firstly decreases, which is followed by the increase as the DO grows. When the dimples were not lapped (or slightly overlapped), the sample oxidized in the interior and the spot edge, and the passivation layer will be formed when the corrosion occurs. As the dimples continued to overlap, the effect of laser remelting deposition was intensified. Oxides located on the cluster and the oxygen-poor zone on both sides formed a micro-galvanic structure, accelerating pit corrosion and worsening the corrosion resistance. As the DO rate grew, the oxidation layers were compacted by remelting and sputtering, creating a dense passivation layer; therefore, the surface corrosion resistance grew again, and the corrosion current density was 2.8 × 10⁻⁸ A·cm−2, which was 4% of the original value.
Author Contributions
Funding
Data Availability Statement
Conflicts of Interest
References
- Min, J.Y.; Wan, H.L.; Carlson, B.E.; Lin, J.P.; Sun, C.C. Application of laser ablation in adhesive bonding of metallic materials: A review. Opt. Laser Technol. 2020, 128, 106188. [Google Scholar] [CrossRef]
- Amiriafshar, M.; Rafieazad, M.; Duan, X.L.; Nasiri, A. Fabrication and coating adhesion study of superhydrophobic stainless steel surfaces: The effect of substrate surface roughness. Surf. Interfaces 2020, 20, 11. [Google Scholar] [CrossRef]
- Ahmed, Y.S.; DePaiva, J.M.; Amorim, F.L.; Torres, R.D.; de Rossi, W.; Veldhuis, S.C. Laser surface texturing and characterization of austenitic stainless steel for the improvement of its surface properties. Int. J. Adv. Manuf. Technol. 2021, 115, 1795–1808. [Google Scholar] [CrossRef]
- Sun, K.; Yang, H.; Xue, W.; He, A.; Zhu, D.H.; Liu, W.W.; Adeyemi, K.; Cao, Y. Anti-biofouling superhydrophobic surface fabricated by picosecond laser texturing of stainless steel. Appl. Surf. Sci. 2018, 436, 263–267. [Google Scholar] [CrossRef]
- Yang, Z.; Liu, X.P.; Tian, Y.L. Insights into the wettability transition of nanosecond laser ablated surface under ambient air exposure. J. Colloid Interface Sci. 2019, 533, 268–277. [Google Scholar] [CrossRef] [Green Version]
- Boinovich, L.B.; Emelyanenko, A.M. The behaviour of fluoro- and hydrocarbon surfactants used for fabrication of superhydrophobic coatings at solid/water interface. Colloids Surf. A-Physicochem. Eng. Asp. 2015, 481, 167–175. [Google Scholar] [CrossRef]
- Boinovich, L.B.; Emelyanenko, A.M.; Emelyanenko, K.A.; Domantovsky, A.G.; Shiryaev, A.A. Comment on “Nanosecond laser textured superhydrophobic metallic surfaces and their chemical sensing applications” by Duong V. Ta, Andrew Dunn, Thomas J. Wasley, Robert W. Kay, Jonathan Stringer, Patrick J. Smith, Colm Connaughton, Jonathan D. Shephard (Appl. Surf. Sci. 357 (2015) 248–254). Appl. Surf. Sci. 2016, 379, 111–113. [Google Scholar] [CrossRef]
- Lou, D.Y.; Wang, B.; Liang, E.K.; Lu, G.X.; Cheng, J.; Liao, J.J.; Yang, Q.B.; Liu, D. Effect of Heat Treatment on Wettability and Condensation Heat Transfer of Laser-Textured Stainless Steel Surfaces. Phys. Status Solidi A-Appl. Mater. Sci. 2022, 219, 2100458. [Google Scholar] [CrossRef]
- Zhao, Z.H.; Wan, Y.; Yu, M.Z.; Wang, H.W.; Cai, Y.K.; Liu, C.; Zhang, D. Biocompability evaluation of micro textures coated with zinc oxide on Ti-6Al-4V treated by nanosecond laser. Surf. Coat. Technol. 2021, 422, 127453. [Google Scholar] [CrossRef]
- Tomanik, M.; Kobielarz, M.; Filipiak, J.; Szymonowicz, M.; Rusak, A.; Mroczkowska, K.; Antonczak, A.; Pezowicz, C. Laser Texturing as a Way of Influencing the Micromechanical and Biological Properties of the Poly(L-Lactide) Surface. Materials 2020, 13, 3786. [Google Scholar] [CrossRef]
- De Mendivil, J.M.; del Hoyo, J.; Solis, J.; Lifante, G. Ridge waveguide laser in Nd:LiNbO3 by Zn-diffusion and femtosecond-laser structuring. OptMa 2016, 62, 353–356. [Google Scholar] [CrossRef] [Green Version]
- Tang, S.T.; Wang, C.; Hua, C.; Yang, L.; Wu, Y.R.; Sun, X.; Song, P.; Huang, B.X. Surface texture of substrates prepared by femtosecond laser for improving the thermal cycle life of TBCs. Ceram. Int. 2022, 48, 5775–5786. [Google Scholar] [CrossRef]
- Chi, G.F.; Yi, D.Q.; Liu, H.Q. Effect of roughness on electrochemical and pitting corrosion of Ti-6Al-4V alloy in 12 wt.% HCl solution at 35 °C. J. Mater. Res. Technol. 2020, 9, 1162–1174. [Google Scholar] [CrossRef]
- Chen, X.; Wang, F.; Di, C.X.; Zhang, C.S.; Bao, Y.L.; Tian, M.; Luo, K. Surface Morphology and Roughness Characterization of Laser Textured TC4 Titanium Alloy. Lasers Eng. 2021, 48, 349–367. [Google Scholar]
- Wu, Z.; Deng, J.X.; Zhang, H.; Lian, Y.S.; Zhao, J. Tribological behavior of textured cemented carbide filled with solid lubricants in dry sliding with titanium alloys. Wear 2012, 292, 135–143. [Google Scholar] [CrossRef]
- Rodriguez-Vidal, E.; Matthews, D.T.A.; de Viteri, V.S.; Korver, F.; Wentink, D.J.; Quintana, I. Surface design and texturing of strip steel using nanosecond pulsed lasers for simulated roughness transfer and paint appearance. J. Mater. Process. Technol. 2020, 275, 116365. [Google Scholar] [CrossRef]
- Kumar, V.; Verma, R.; Kango, S.; Sharma, V.S. Recent progresses and applications in laser-based surface texturing systems. Mater. Today Commun. 2021, 26, 101736. [Google Scholar] [CrossRef]
- Zupancic, M.; Moze, M.; Gregorcic, P.; Golobic, I. Nanosecond laser texturing of uniformly and non-uniformly wettable micro structured metal surfaces for enhanced boiling heat transfer. Appl. Surf. Sci. 2017, 399, 480–490. [Google Scholar] [CrossRef] [Green Version]
- Wang, Y.T.; Ke, C.J.; Wu, T.H.; Zhao, X.R.; Wang, R. Nanosecond laser texturing with hexagonal honeycomb micro-structure on Titanium for improved wettability and optical properties. Optik 2019, 192, 162953. [Google Scholar] [CrossRef]
- Dai, G.; Chen, Y.; Lu, J.; Shen, Z.; Ni, X. Analysis of laser induced thermal mechanical relationship of HfO2/SiO2 high reflective optical thin film at 1064 nm. Chin. Opt. Lett. 2009, 7, 601–604. [Google Scholar]
- Saravanan, K.G.; Thanigaivelan, R. Optimization of Laser Parameters and Dimple Geometry Using PCA-Coupled GRG. Stroj. Vestn.-J. Mech. Eng. 2021, 67, 525–533. [Google Scholar] [CrossRef]
- Tianyu, Y.; Fengze, D.; Yongkang, Z.; Zhongwei, A.; Qingwei, W. Simulation and Experimental Study on Residual Stress Field of 2024 Aluminum Alloy Induced by Flat-Top Laser Beam. Chin. J. Lasers 2012, 39, 1003001. [Google Scholar] [CrossRef]
- Hajnys, J.; Pagac, M.; Mesicek, J.; Petru, J.; Krol, M. Influence of Scanning Strategy Parameters on Residual Stress in the SLM Process According to the Bridge Curvature Method for AISI 316L Stainless Steel. Materials 2020, 13, 1659. [Google Scholar] [CrossRef] [Green Version]
- Wang, Q.H.; Wang, H.X.; Zhu, Z.X.; Xiang, N.; Wang, Z.D.; Sun, G.F. Switchable wettability control of titanium via facile nanosecond laser-based surface texturing. Surf. Interfaces 2021, 24, 101122. [Google Scholar] [CrossRef]
- Sirohia, G.K.; Dai, X.M. Designing air-independent slippery rough surfaces for condensation. Int. J. Heat Mass Transf. 2019, 140, 777–785. [Google Scholar] [CrossRef]
- Li, H.; Feng, X.; Zhang, K. Study of the Classical Cassie Theory and Wenzel Theory Used in Nanoscale. J. Bionic Eng. 2021, 18, 398–408. [Google Scholar] [CrossRef]
- Boinovich, L.B.; Emelyanenko, A.M.; Pashinin, A.S.; Lee, C.H.; Drelich, J.; Yap, Y.K. Origins of Thermodynamically Stable Superhydrophobicity of Boron Nitride Nanotubes Coatings. Langmuir 2012, 28, 1206–1216. [Google Scholar] [CrossRef]


| Wavelength (nm) | Pulse Width (ns) | Repeat Frequency (Hz) | Single Pulse Energy (J) | Scanning Speed (mm/s) |
|---|---|---|---|---|
| 1064 | 240 | 70 × 103 | 874.3 × 10⁻⁶ | 1400~9100 |
| No. | 0# | 1# | 2# | 3# |
|---|---|---|---|---|
| δd (%) | 316L Stainless Steel | −14.35 | 34.02 | 83.52 |
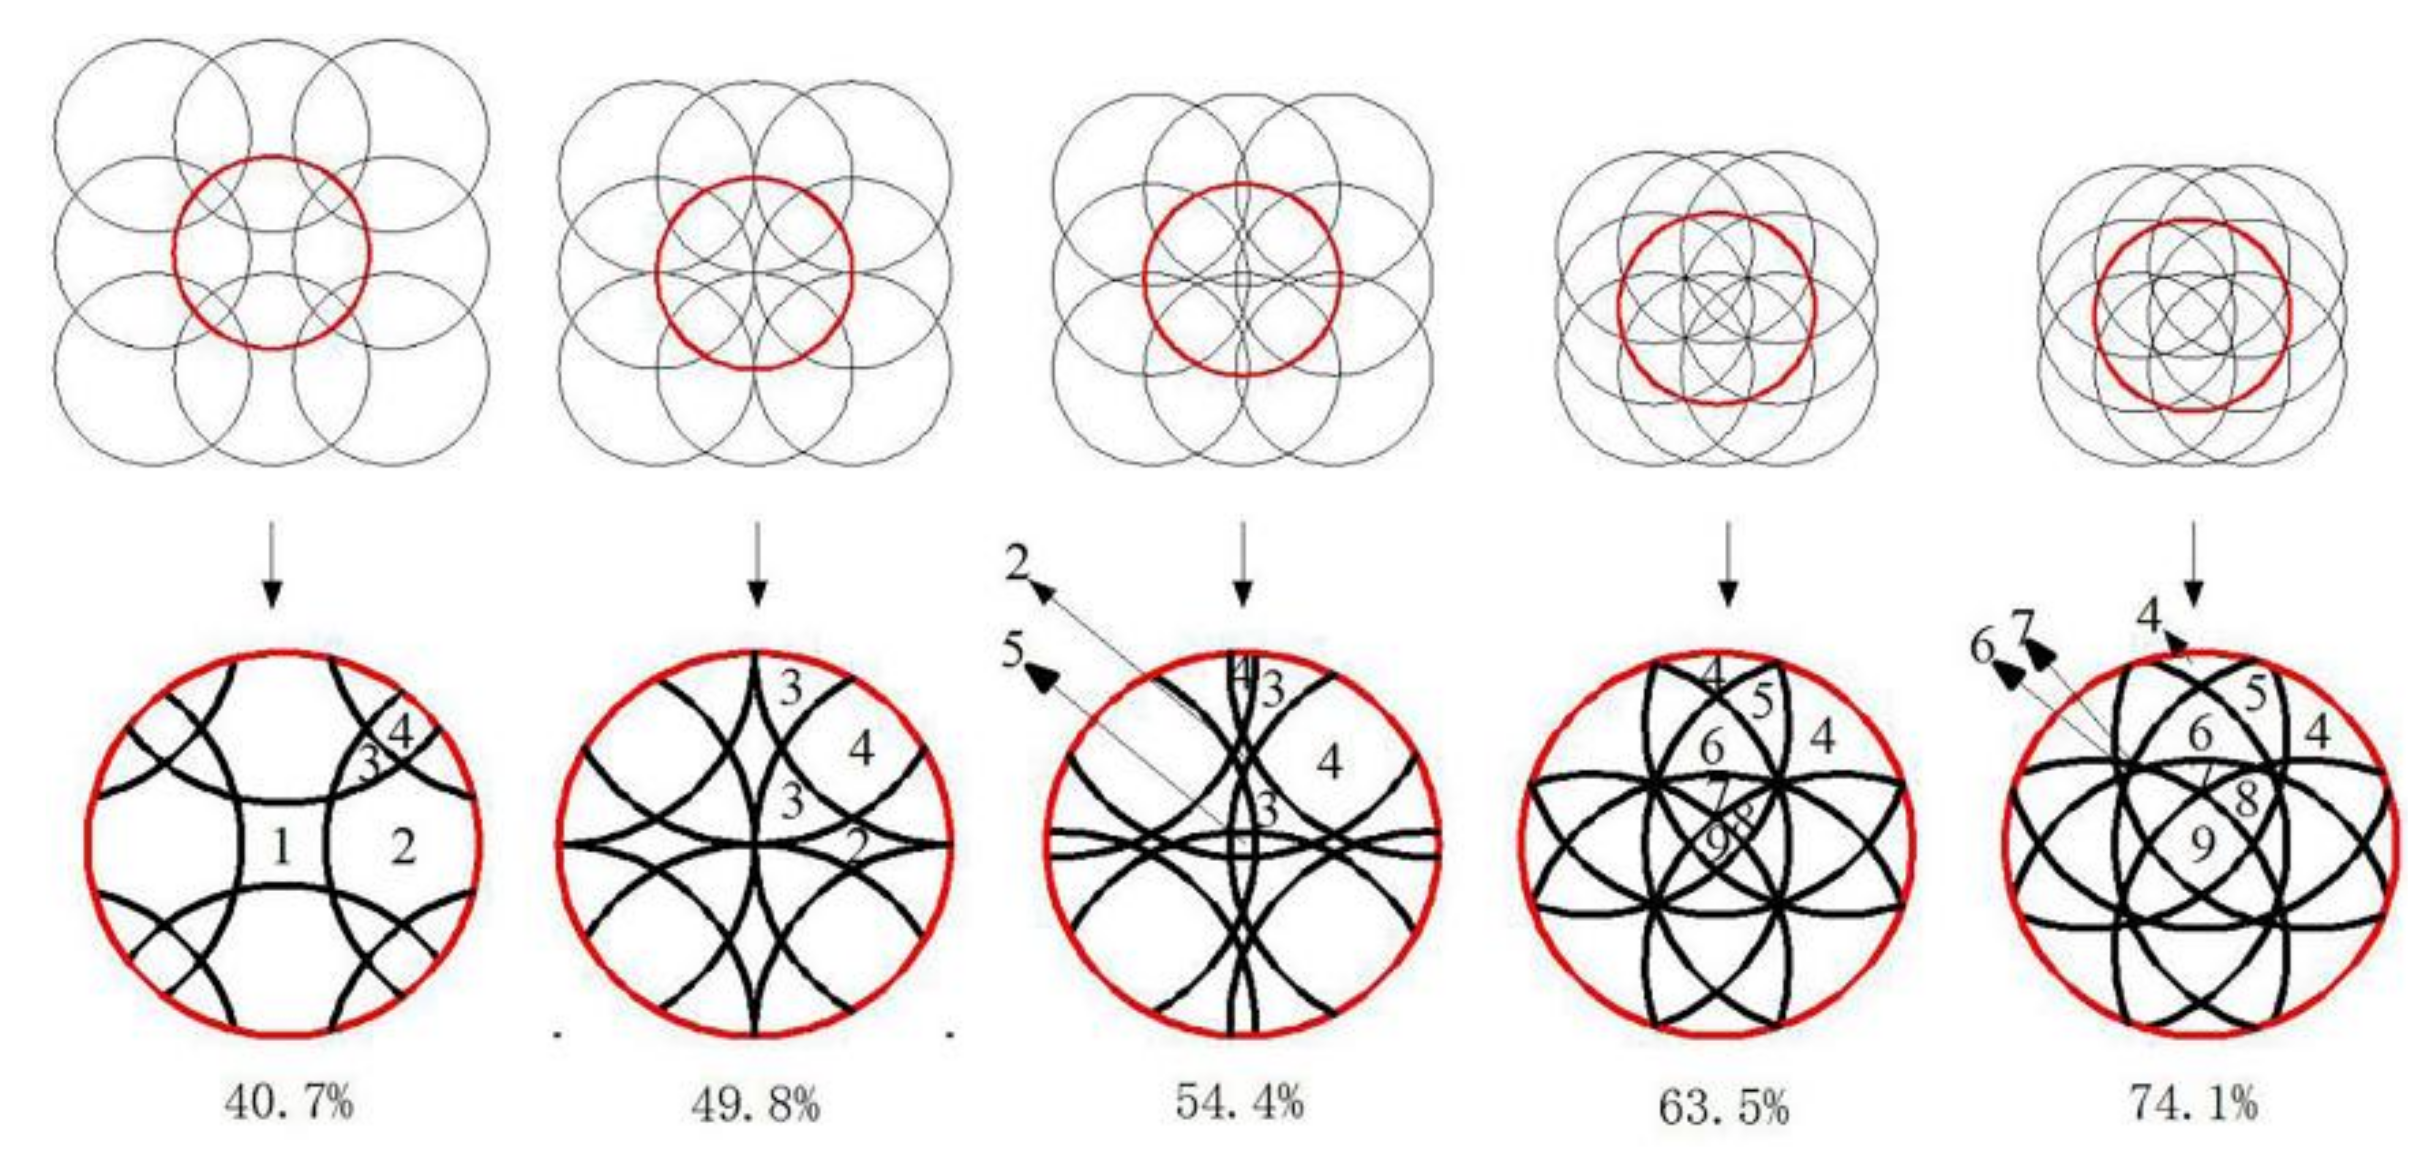
| DO Rate δd (%) | Numbers of Laser Spot Ni/Occupancy Area Rate Si (%) | ||||||||
|---|---|---|---|---|---|---|---|---|---|
| 1 | 2 | 3 | 4 | 5 | 6 | 7 | 8 | 9 | |
| 40.7 | 7.81 | 62.83 | 20.31 | 9.05 | / | / | / | / | / |
| 49.8 | / | 17.93 | 45.54 | 36.53 | / | / | / | / | / |
| 54.4 | / | 1.48 | 46.35 | 51.6 | 0.52 | / | / | / | / |
| 63.5 | / | / | / | 33.35 | 28.67 | 20.78 | 8.19 | 5.45% | 2.56 |
| 74.1 | / | / | / | 21.81 | 34.79 | 21.66 | 5.54 | 11.32 | 4.88 |
| δd (%) | 39.25 | 50 | 53.27 | 68.4 | 71.96 |
| Ra (μm) | 1.286 h | 1.186 h | 1.512 h | 1.2944 h | 1.644 h |
| Sample No. | DO Rate/(%) | Corrosion Potential Ecorr (mV) | Corrosion Current Density Icorr (A·cm−2) | Pitting Corrosion Electric Potential Epit (V) |
|---|---|---|---|---|
| 0# | / | −472.5 | 7 × 10⁻⁷ | −0.02 |
| 1# | −14.4 | −277.5 | 2.8 × 10⁻⁶ | 0.21 |
| 2# | 34.0 | −271.5 | 1.1 × 10⁻⁵ | 0.66 |
| 3# | 83.5 | 282.62 | 2.8 × 10⁻⁸ | 1.80 |
Publisher’s Note: MDPI stays neutral with regard to jurisdictional claims in published maps and institutional affiliations. |
© 2022 by the authors. Licensee MDPI, Basel, Switzerland. This article is an open access article distributed under the terms and conditions of the Creative Commons Attribution (CC BY) license (https://creativecommons.org/licenses/by/4.0/).
Share and Cite
Lou, D.; Liang, E.; Chen, P.; Jiang, G.; Wang, L.; Guan, L.; Wang, Y.; Liu, D. The Effect of Dimple Overlap on Wettability and Corrosion Resistance of Laser-Textured Stainless Steel. Crystals 2022, 12, 695. https://doi.org/10.3390/cryst12050695
Lou D, Liang E, Chen P, Jiang G, Wang L, Guan L, Wang Y, Liu D. The Effect of Dimple Overlap on Wettability and Corrosion Resistance of Laser-Textured Stainless Steel. Crystals. 2022; 12(5):695. https://doi.org/10.3390/cryst12050695
Chicago/Turabian StyleLou, Deyuan, Enkang Liang, Pengjian Chen, Guodong Jiang, Lishi Wang, Laiqing Guan, Yutao Wang, and Dun Liu. 2022. "The Effect of Dimple Overlap on Wettability and Corrosion Resistance of Laser-Textured Stainless Steel" Crystals 12, no. 5: 695. https://doi.org/10.3390/cryst12050695