Article

Revealing Microstructural Evolution and Deformation Mechanism of Pure Titanium through a Quasi In Situ Compression Method at High Strain Rate

1
GRIMAT Engineering Institute Co., Ltd., Beijing 101407, China
2
Research Institute of Aero-Engine, Beihang University, Beijing 100191, China
*
Authors to whom correspondence should be addressed.
Crystals 2022, 12(5), 677; https://doi.org/10.3390/cryst12050677
Submission received: 17 April 2022 / Revised: 3 May 2022 / Accepted: 7 May 2022 / Published: 9 May 2022

Abstract

:
In this paper, a quasi in situ method is established to study the microstructural evolution and deformation mechanism transition behavior of pure Ti under a high strain rate of 4000 s−1. The main deformation mechanism is found to be influenced by deformation strain level. In the strain range from 0 to 0.05, { 10 1 ¯ 2 } and { 11 2 ¯ 2 } twinning is proved to be the main mechanism, while the grains without any deformation twin (about 32% of the whole grains) are deformed by dislocation slip. When the strain increases from 0.05 to 0.10, the growth of twins, secondary twinning, and dislocation movement are proved to be the main deformation mechanism. In the strain range from 0.10 to 0.15, dislocation movement becomes the dominant deformation mechanism. Compared with the traditional observation method, the new quasi in situ method effectively permits observing the microstructure evolution and recording the deformation behavior progressively step by step, which is more suitable to reveal the deformation mechanism of materials at high strain rates.

Graphical Abstract

1. Introduction

The deformation behavior of material not only contains information on the mechanical properties and deformation mechanism but also contains information on the evolution of microstructure. A detailed study of deformation behavior is significantly helpful to predict the reliability of materials in service. Meanwhile, the evolution of microstructure (including the nucleation and growth of twins, the movement of dislocations, and the reaction of twins and dislocations) under quasi-static deformation conditions can be clearly described [1,2,3,4,5]. By using tensile or compression loading devices in a scanning or transmission electron microscope (SEM or TEM), which is called the in situ method, the researchers can easily record the whole evolution process of microstructures in a small area during the deformation process. So far, in situ observation of the microstructure is suitable for the deformation temperatures ranging from room temperature to 1300 °C under quasi-static deformation conditions with a strain rate less than 1 s−1 [6,7].
However, since the duration of the dynamic deformation process of materials is extremely short (usually less than 100 μs), it is difficult for electronic microscope equipment to capture the microstructural features during the deformation process. Although high-speed photography can capture the macro shape changes under dynamic deformation and reveal the strain distribution together with other information throughout the material deformation process, the resolution and field depth of a high-speed camera limit the capture of microstructure evolution [8,9,10,11,12]. Nowadays, dynamic deformation research is carried out by studying deformed microstructures without analyzing the evolution process [13,14]. Therefore, the deformation process of materials at high strain rates is still not clear. Furthermore, since the strain rate shows a great influence on the deformation and failure mechanisms, researchers cannot predict the dynamic behavior of the material according to its performance under quasi-static conditions [15,16]. In order to investigate the dynamic deformation behavior of materials, an in situ investigation method which is suitable for observing the microstructure evolution under dynamic deformation conditions should be established.
Titanium and its alloys are important engineering materials with high strength and low density [17,18] and have drawn great attention in the dynamic behavior research field [13,14]. The deformation mechanism and microstructural evolution of titanium in quasi-static deformation have been revealed using in situ methods [19,20,21]. The twinning/detwinning process, crack initiation position, stress–strain state at the mean time of crack initiation, and the relationship between crack propagation path and lamellar are carefully described. However, under high strain rates, research still uses traditional ex situ methods to investigate the deformation mechanism of Ti alloys [22,23,24]. The studies show that the twinning becomes prevalent at high strain rates in crystalline solids, and four types of deformation twins have been observed in the dynamic deformed Ti sample, including { 10 1 ¯ 2 }, { 11 2 ¯ 1 }, { 11 2 ¯ 2 }, and { 11 2 ¯ 4 }. Moreover, N. P. Gurao [22] studied the change of microstructure and texture of commercially pure Ti during room temperature compression under quasi-static and dynamic loading conditions and found that there was a significant difference in the strength of pure Ti when deformed at different strain rates. Zhou [23] studied the twin interaction behavior in pure Ti under high strain rate compression, and the results showed that twinning variants that did not follow the Schmid law were more frequently observed under the high strain rate deformation than the quasi-static deformation. These traditional ex situ methods may have some limitations. First, the estimated twin fraction may be underestimated, since the slip activity influences the twin boundaries [22], and when two twin variants meet, the angle between them is not a recognizable twin characteristic angle [25]. Second, the development processes of twinning and slip behaviors cannot be traced, which means the nucleation sites, corresponding stress and strain conditions, and interaction of twins and dislocations cannot be restored. Therefore, the microstructure evolution under dynamic conditions is still not clear. On this basis, in this study, we establish a quasi in situ characterization method to observe the microstructure evolution of pure Ti, which is also suitable for other metals at high strain rate loading conditions.

2. Experimental Procedure

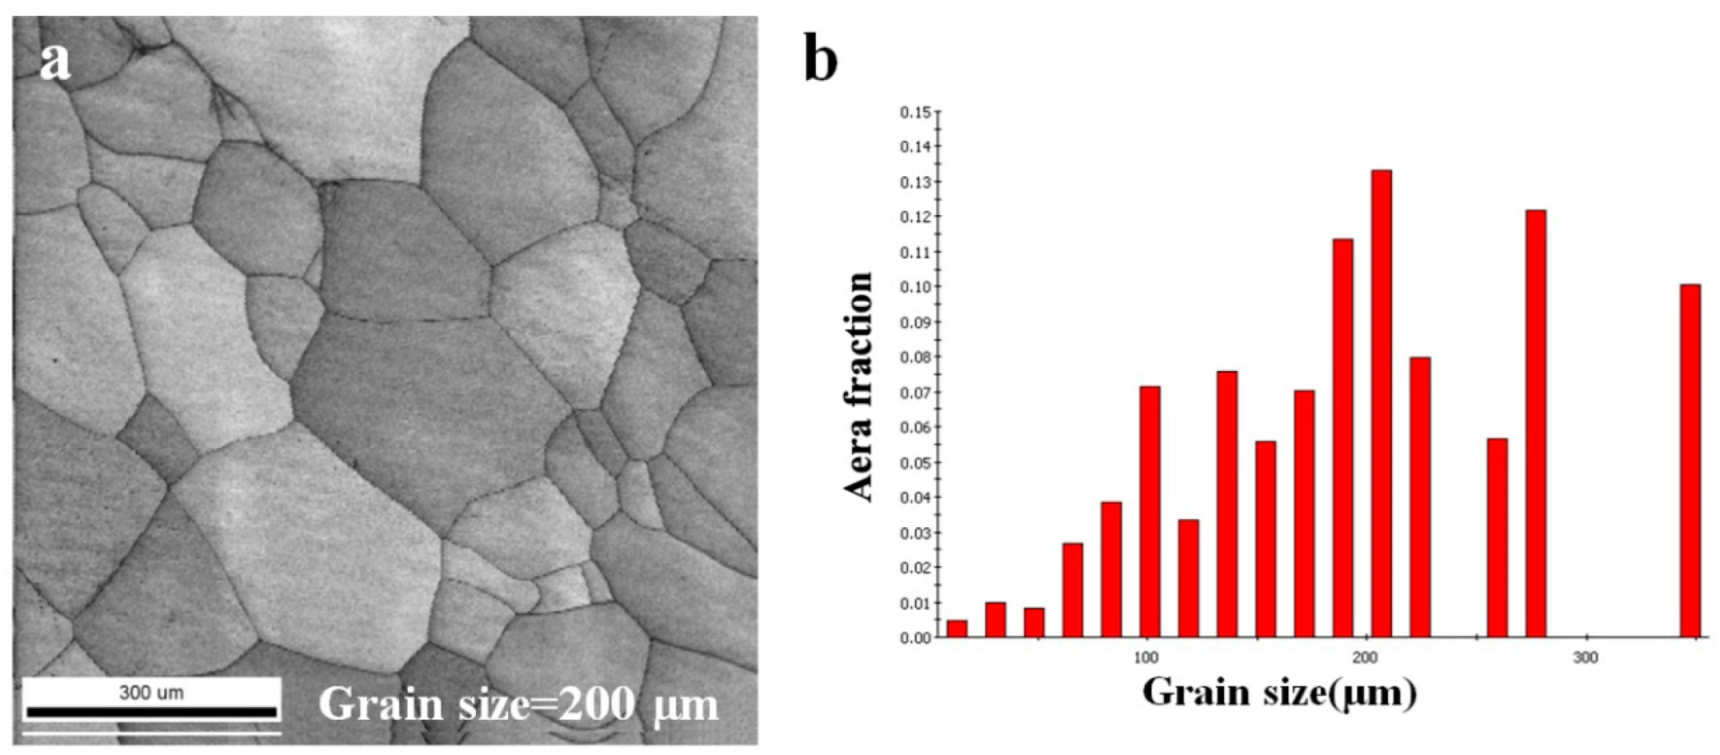
2.1. Material Preparation

The material investigated in this work was high purity titanium (99.995%) obtained as a plate in hot-rolled condition. To obtain an equiaxed single-phase microstructure with a weak texture, the plate was heated to 870 °C for 1 h in atmosphere and then air cooled. The microstructure was examined by scanning electron microscope (SEM, JSM-7001F, Beijing, China) combined with the electron backscattering diffraction (EBSD, JEOL JEM-7900, Beijing, China) technique, and the average grain size of the annealed sample was about 200 μm, as shown in Figure 1.

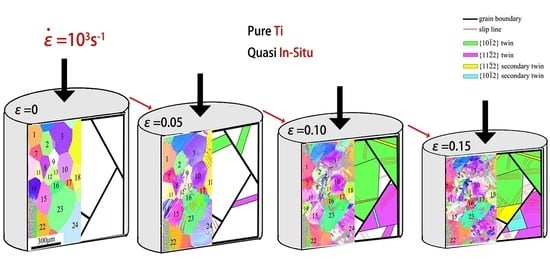
2.2. Quasi In Situ Method

In this research, high strain rate compression was conducted along the axial direction of the specimen at room temperature, utilizing a Split Hopkinson Pressure Bar (SHPB, USTC, Beijing, China). Figure 2a shows the schematic diagram of the SHPB device. The strain rate of every dynamic loading was 4000 s1, which was ensured by setting the same impacting velocity.
The specimen was carefully designed for the quasi in situ microstructure observation. First, a cylinder with 5 mm in diameter and 5 mm in height was exacted from the inner part of the annealed plate mentioned above to avoid the surface oxide layer. Then a flat plane with a dimension of 3 mm × 5 mm (named Surface A) was milled at the side of this cylinder, which was specifically designed for the observation of microstructure evolution, as shown in Figure 2b. The surface was ground using SiC sand paper and electrolytic polished (volume ratio of perchloric acid: acetic acid equals 5:95) at 65 V. In order to analyze the slip lines, the sample surface was not etched, and the electrolytically polished samples were applied to SEM and EBSD. After the surface preparation, a small reference mark (width about 20 μm) was made on Surface A using a diamond cone indenter to help locate the observation site after each stop of the dynamic deformation. Then a 1 mm × 1 mm observation area was selected just near the reference mark (the red rectangle area in Figure 2b. This observation site was far more than 0.5 mm away from the sample boundary.
In order to investigate the microstructural evolution, a quasi in situ characterization method suitable for high strain rate loading conditions was established. The principal procedure was as follows: (1) Observe the microstructure of the marked area by EBSD for the original state. (2) Compress the specimen at a high strain rate to a defined strain by stopper ring, as shown in Figure 2c. (3) Observe the microstructure of the marked area by SEM and EBSD for the first deformation round. (4) Compress the specimen at the same strain rate again and make it a higher strain by using a shorter stopper ring. (5) Observe the microstructure for the second round. Then, repeat the “dynamic loading with a strain increment—microstructure recording at the same area” process on the same specimen. Following these steps, the microstructure evolution of a certain area in a specimen subjected to dynamic compression can be recorded.
After each dynamic loading break, the specimen was only cleaned with acetone to reserve the surface deformation morphology (e.g., slip lines) which was examined by SEM (JSM 6510, Beijing, China), while the crystallographic orientations of each grain were gathered using EBSD. The orientation data were analyzed using EDAX/TSL OIM Analysis 6.2 software(EDAX, Beijing, China). By combining the direction of slip lines with the orientation of the grain where slip lines were located, the specific slip system could be determined. Firstly, the angle between a slip trace and the load direction (also the y-axis in SEM images) θ S E M was measured through the SEM image. Then, the angle between different activated slip systems i and the load direction θ c a l , i was calculated by: [26,27]
θ c a l , i = arccos ( e s y · v S L , i | e s y | · | v S L , i | )
v S L , i = e s z × n s S L , i
where e s y and e s z are the unit vector of the y and z-axis in the sample coordinate system, respectively, and n s S L , i is the unit vector normal to the slip plane (hi ki Ii li) for slip system i in the sample coordination, and was calculated by: [27]
n s S L , i = n c S L , i · ( g T ) 1
where g is the Euler angle, and n c S L , i is the slip plane normal in the crystal coordinate system. Thus, the slip trace on the sample surface can be calculated and represented by v S L , i . The twin variants were determined by OIM.

3. Results and Discussion

3.1. Feasibility of Quasi In Situ Method

Figure 3a–d are the EBSD IPF maps of the observation area corresponding to the strains of 0, 0.05, 0.10, and 0.15, respectively. To obtain a quantitative analysis, grains with complete boundaries in the observation area are numbered from 1 to 29 as shown in IPF maps, respectively. According to Figure 3, the quality of IPF maps decreases with the increase in strain. While the strain approaches 0.15, about 90% of the EBSD results can still be analyzed. The characterization method of quasi in situ established in this paper can be applied to study the microstructure evolution at high strain rates and reveal the deformation mechanism.
It can be found from Figure 3a,b that the relative positions of each grain change obviously from the beginning as the strain increases to 0.05. Twins can be recognized by OIM software. Except for the twins, most of the parent grains show uniform colors, but the colors are different from the beginning, indicating the rotation of grains. The Euler angles of the matrix in 29 grains before and after the first round of deformation are compared. By inputting these Euler angles into the software TexTools, the rotation behavior of 29 grains represented by angle/axis pairs is analyzed and the results are listed in Table 1. The average rotation angle is 4.6° from the beginning. Figure 3c shows the IPF map of the sample with a strain of 0.10. The relative position of each grain does not change much, indicating that the relative movement of grains is not a significant reason for deformation at this strain level. However, the grains’ colors in Figure 3c change a lot from that with a strain of 0.05, indicating that the orientations of grains change obviously while the strain increases to 0.10. Moreover, the disorientation in each grain is not as uniform as before. Thus, the difference in orientations is not only caused by grain rotation behavior. The localized disorientation is the result of dislocation movement. Apart from the localized disorientation area, the average rotation angle of grains in the strain range of 0.05–0.10 is 8.7°, which is much larger than that in the strain range of 0–0.05.

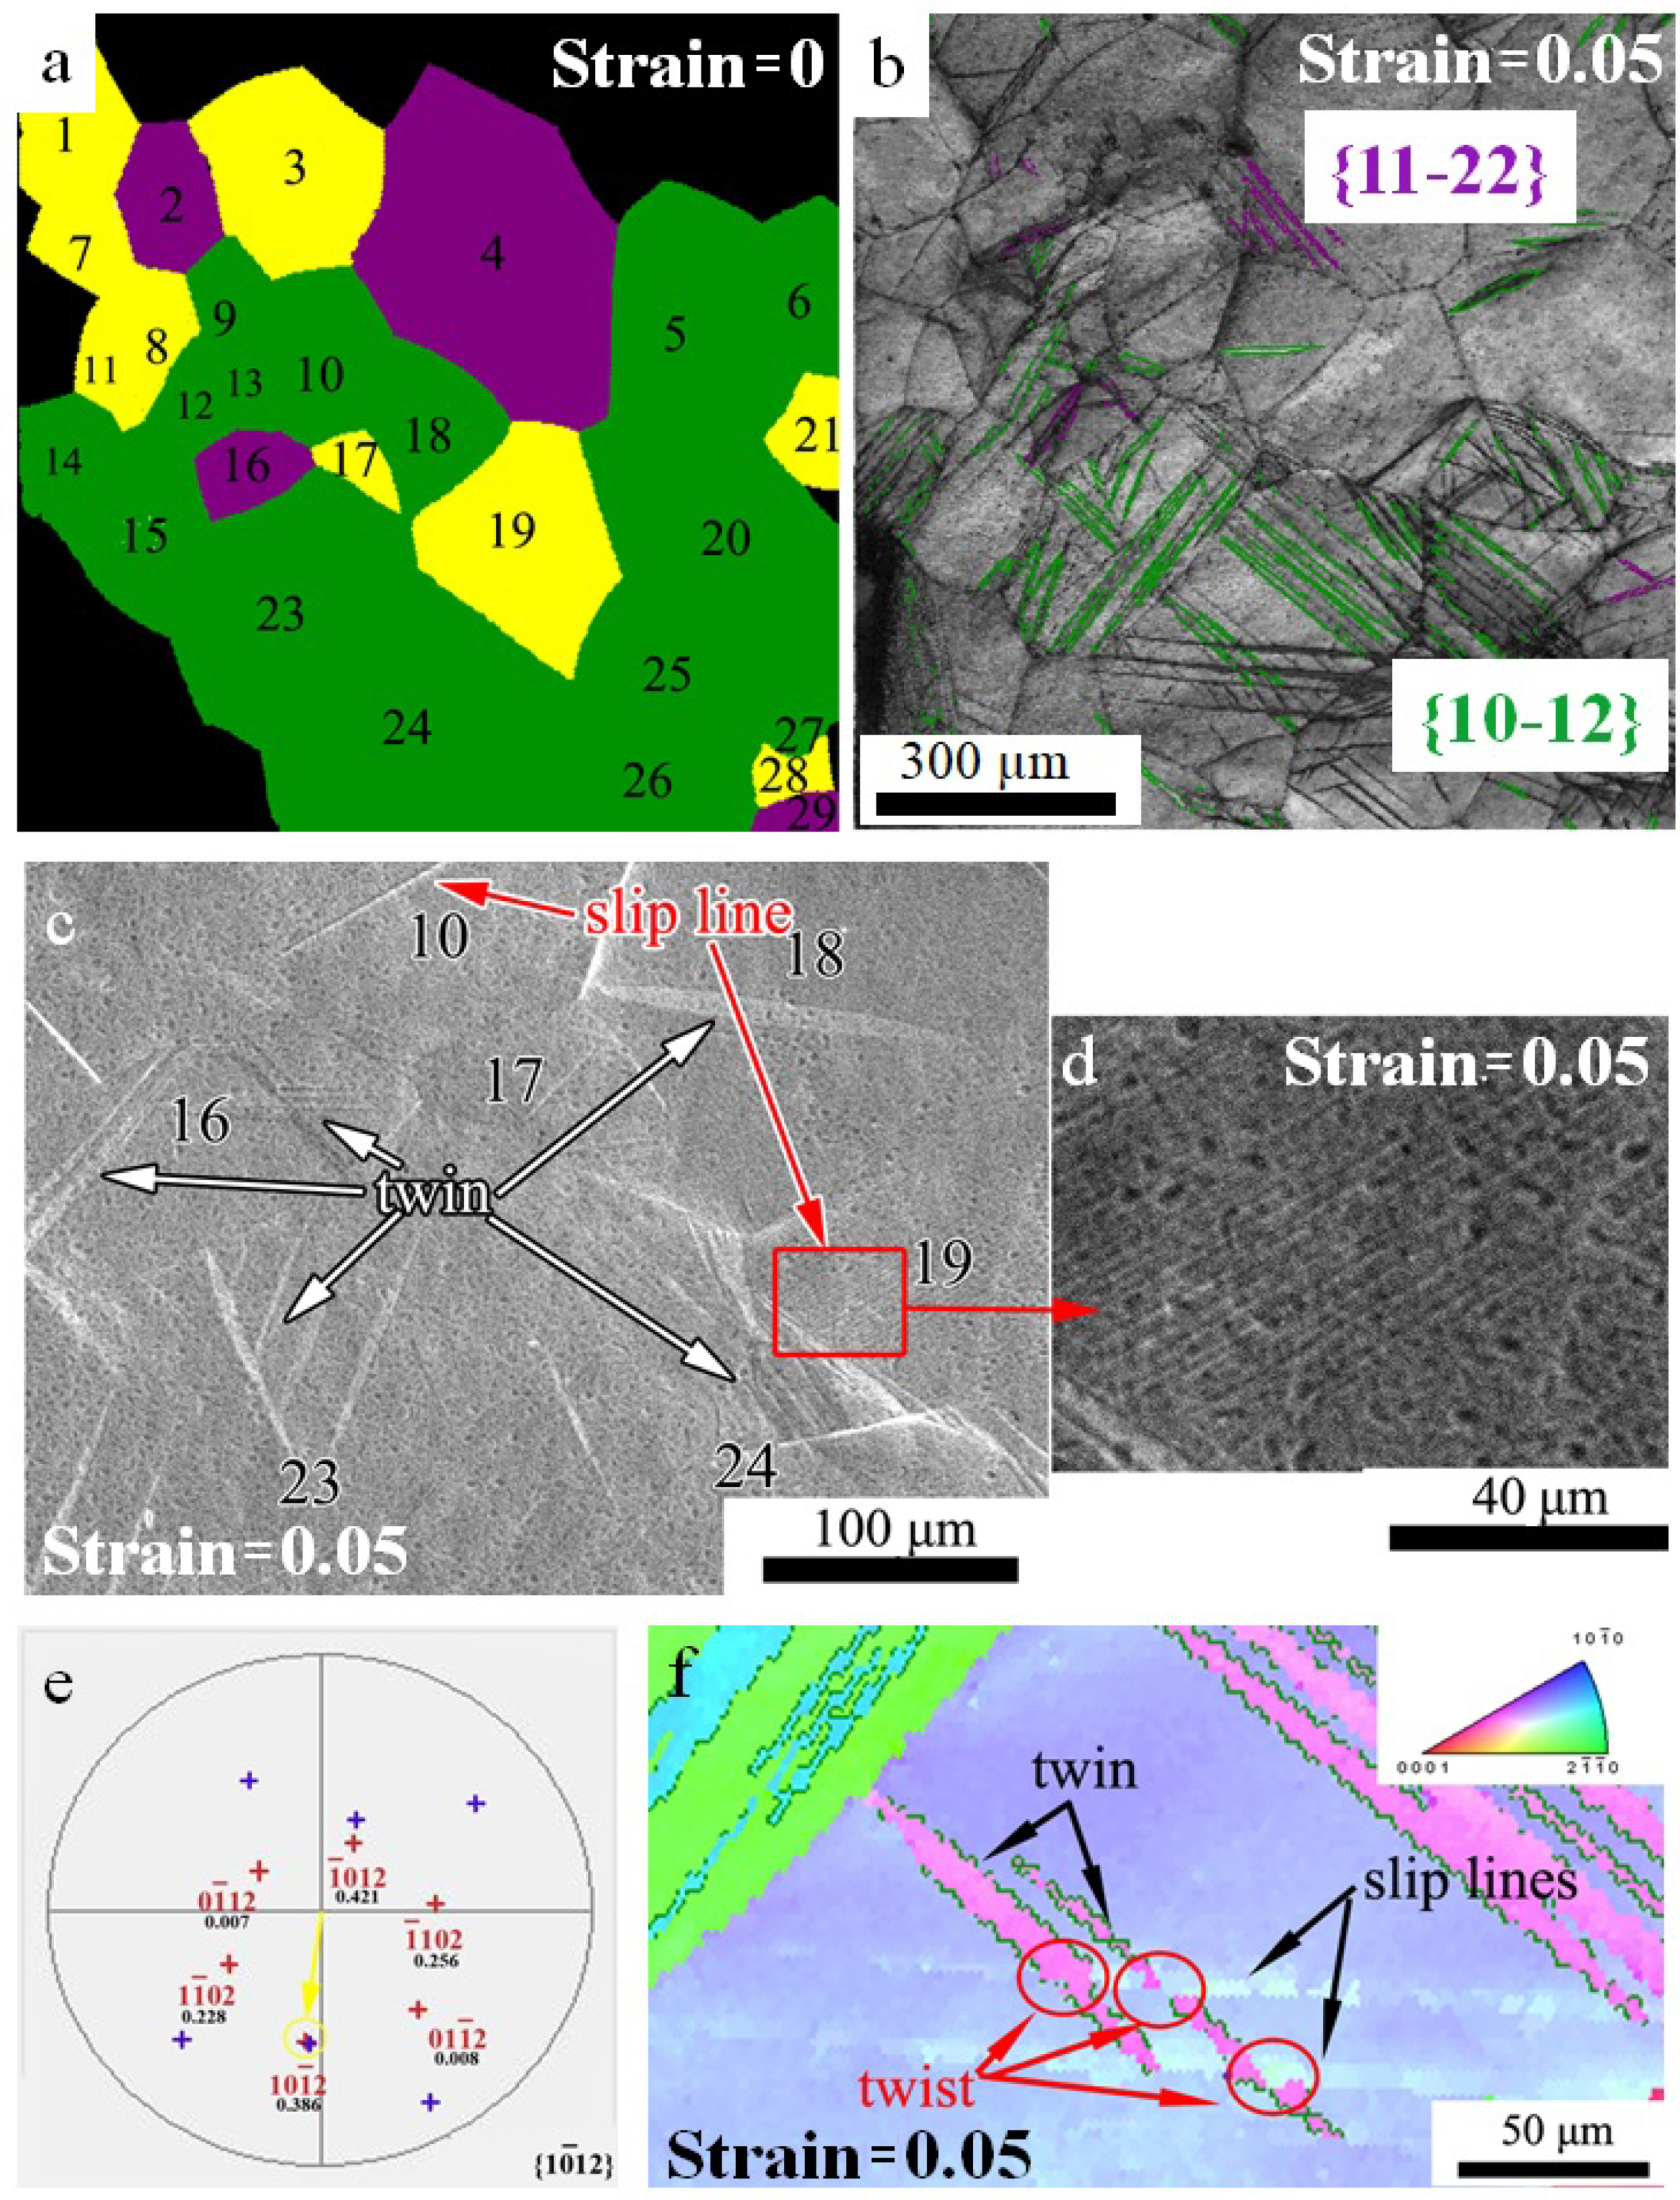
3.2. Deformation Mechanism under High Strain Rate

Figure 4a shows the undeformed area where the twins are about to nucleate, and the twin boundaries at a strain of 0.05 are colored in Figure 4b. According to Figure 4b, the twin systems are also summarized in Table 1. In some grains, i.e., Grain No. 23, two { 10 1 ¯ 2 } twinning variants are activated, which can be clearly seen in Figure 4b. Such activated twin system of these grains is labeled as T{ 10 1 ¯ 2 } × 2 in Table 1. From Figure 4 and Table 1, { 11 2 ¯ 2 } twins nucleate in only 14% of grains (painted purple), and { 10 1 ¯ 2 } twins nucleate in 54% of grains (painted green), while no twins are observed in the rest 32% of grains (painted yellow). Thus, twinning is a leading deformation mechanism at this stage. According to SEM results, slip lines are found in the grains without twinning, as shown in Figure 4c,d, indicating the existence of dislocation slip. Furthermore, some grains are deformed by both twinning and dislocation slip, as shown in Figure 4e,f. Since these twins show discontinues at the twins/slip lines junction, twinning is considered to start before dislocation slip. In a word, under the strain rate of 4000 s−1, twinning is the main mechanism in the strain range of 0–0.05, while dislocation slip also has a contribution. In Xu’s early study [24], deformation twinning is also pointed out to be dominant at the low strain. However, { 11 2 ¯ 1 } and { 11 2 ¯ 4 } twins which were reported by other researchers [22,23,24] are not observed in this study.
The Schmid Factors (SF) of the active twinning variants and slip systems are given in Table 1 by the following method. The variants of twinning and dislocation systems can be obtained based on the Euler angles of the undeformed 29 grains, while the loading direction in the sample coordinate system, parallel to the y-axis of the IPF figure, can be expressed in the crystal coordinate system through coordinate transformation. Then, the angle θ between the loading direction and the twinning/slip plane normal, and the angle η between the loading direction and twinning/slip direction can be determined. Thus, the SF can be calculated in terms of the relation SF value = cosθ × cosη.
When dislocation slip and twinning both occur in the same grain, the SF of dislocation slip is higher than that of twinning. Thus, the CRSS of twinning is lower than that of dislocation slip. At the deformation beginning stage, twinning happens more easily than dislocation slip. This is because increasing the strain rate is equivalent to suppressing the dislocation activities and stimulating the twinning formation [24]. Moreover, only 8 of 19 active variants of twins obtain the largest SF, among the 6 equivalent variants in the same twinning system, indicating that twinning variants do not always follow the Schmid law under high strain rates. Apart from Ti [23,28], this phenomenon is also observed in other HCP metals like Mg [29,30].
SEM results show that when the strain changes from 0.05 to 0.10, a large number of slip lines with different orientations occur, as shown in Figure 5b, indicating the activation of new slip systems. Therefore, dislocation slip is an important deformation mechanism while the strain increases from 0.05 to 0.10. In a model diagram of a strain of 0.05, the area where the twins are about to nucleate and grow is marked in different colors, as shown in Figure 5c. In Figure 5d, the existed twinning area at 0.10 strain level is identified. According to these pictures, it can be found that, in Grain No. 9, No. 12, No. 16, No. 23, No. 24, and No. 25, twins occupy over 70% of the whole grain, while in Grain No. 14 and No. 27, twins have completely occupied the parent grain. Moreover, the new { 11 2 ¯ 2 } twins nucleate in Grain No. 2 and No. 20, while new { 10 1 ¯ 2 } twins nucleate in Grain No. 3, No. 17, and No. 28. Moreover, { 11 2 ¯ 2 } secondary twins nucleate in Grain No. 5, No. 14, No. 24, No. 26, and No. 27, while { 10 1 ¯ 2 } secondary twins nucleate in Grain No. 4. Thus, it can be seen that twinning is also an important deformation mechanism while the strain increases from 0.05 to 0.10. Moreover, the relationship between twin and dislocation is more obvious while the strain increases from 0.05 to 0.10. Figure 5e,f shows the SEM figures of the same area with a strain of 0.05 and 0.10. It can be seen that slip lines occur in twins and parent grains at a strain of 0.10, indicating that dislocations are activated later than twinning. The same phenomenon has also been observed that dislocations in the parent grain can actively interact with the tip of the twin embryos and proceed in step with the twin lamellae [31]. For the reaction of twin-dislocation, researchers have pointed out that slip produced in a soft-oriented grain can stimulate the twin nucleation under a quasi-static condition [32,33]. However, in this paper, under a dynamic deformation condition, no new twins are observed to nucleate within the whole observed area at the places, indicating that twins initiate before dislocation activation instead of being stimulated by dislocation slip.
While the strain increases from 0.10 to 0.15, as shown in Figure 3d, no significant changes in relative position and IPF colors of parent grains are found. Moreover, the growth of twins is not obvious and no new twin is formed. Thus, twinning is not an important deformation mechanism at this deformation stage. Moreover, the existed twins could not be identified due to the uneven surface, as shown in Figure 6b. However, new slip systems occur, resulting in the denser and more complex slip lines, as shown in Figure 6c,d, indicating that dislocation slip has become the dominant deformation mechanism as the strain increases from 0.10 to 0.15.

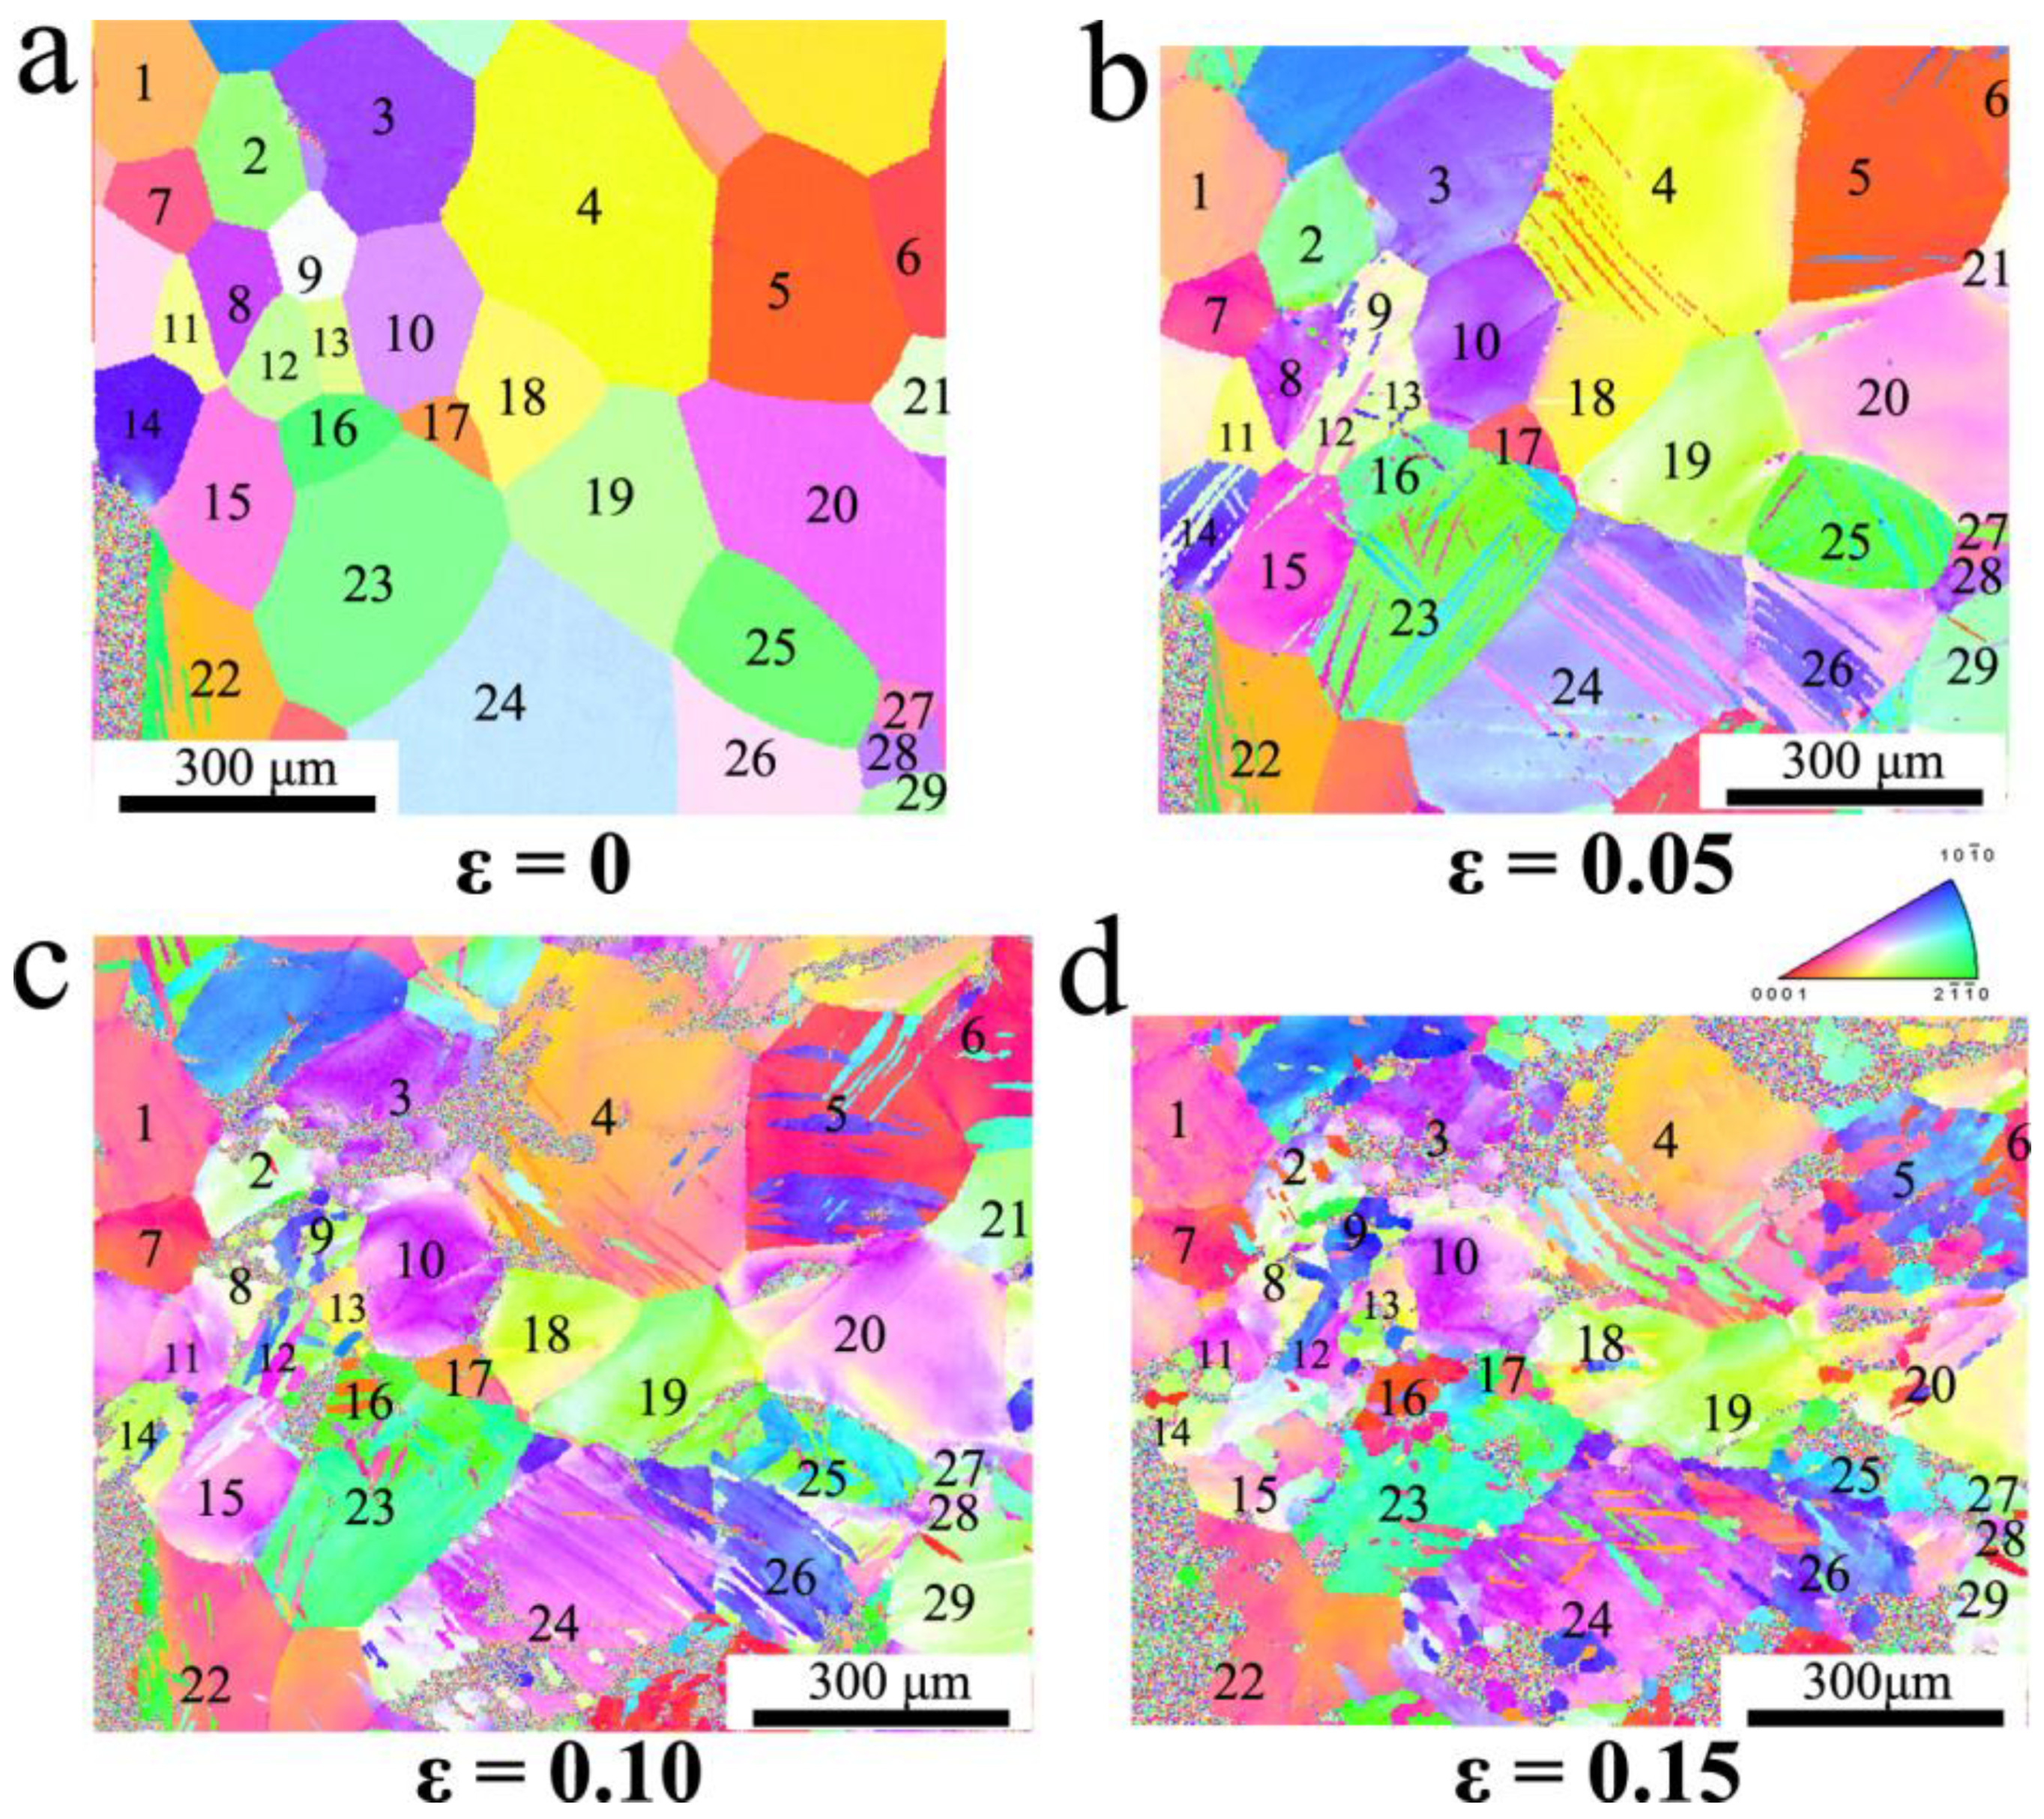
3.3. Microstructural Features and Evolution

The goal of the quasi in situ method is to reveal the microstructural evolution of materials. Compared with the traditional final-state observation method, the quasi in situ method can record the data of deformation microstructure progressively step by step. In Grain No. 27, as shown in Figure 7a,b, a { 10 1 ¯ 2 } twin can be observed when the strain is 0.05. Since the twin has grown to the whole parent grain as the strain increases to 0.10, it cannot be identified according to the twinning feature angle. Instead, a { 11 2 ¯ 2 } secondary twin is observed in the existed { 10 1 ¯ 2 } twin. Thus, if the final observation method is used, the evolution process of { 10 1 ¯ 2 } twin would be ignored.
Based on the above analysis, a microstructural evolution model of pure Ti under high strain rate compression conditions is built, as shown in Figure 8. At the beginning state of deformation, { 10 1 ¯ 2 } and { 11 2 ¯ 2 } twins initiate and are proved to be the main deformation mechanism, while parts of grains are deformed by dislocation slip, as shown in Figure 8b. When the strain increases from 0.05 to 0.10, as Figure 8c shows, the growth of twins, secondary twinning, and dislocation movement were the main deformation mechanisms. In the strain range from 0.10 to 0.15, dislocation movement became the dominant deformation mechanism, as shown in Figure 8d. Compared with traditional research [2,34], the quasi in situ method in the current study offers a new approach to obtaining more microstructure features during the deformation, which effectively reveals the microstructural evolution of pure Ti under dynamic deformation, showing potential to be applied in studying the deformation mechanism of materials under high strain rate condition.

4. Conclusions

To reveal the dynamic deformation behavior of metals, a new and effective quasi in situ characterization method is established in this study. A specimen is compressed under a high strain rate discontinuously, and the increase of strain at each step is controlled precisely. By recording the detailed microstructure characteristics including orientation of each grain, slip line, and twin of the same area under different strain levels during discontinuous dynamic loading deformation carefully, the microstructure evolution can be clearly described. Compared with the traditional observation method, this new method has significant advantages in revealing the influence of strain on the deformation mechanism and the evolution process from primary twinning to secondary twinning.
Using this method, the deformation mechanism transition behavior of pure Ti is investigated at a strain rate of 4000 s−1. It can be found that in the strain range from 0 to 0.05, { 10 1 ¯ 2 } and { 11 2 ¯ 2 } twinning behaviors are proved to be the main deformation mechanisms. As the strain increases to 0.10, the growth of twins, together with the secondary twinning and dislocation movement, dominate the deformation. In the strain range from 0.10 to 0.15, the dislocation movement becomes the dominant deformation mechanism.

Author Contributions

Conceptualization, Y.L.; investigation, Y.L., B.W., and R.W.; methodology, Y.L.; formal analysis, Y.L. and W.G.; writing—original draft preparation, Y.L.; writing—review and editing, W.G. All authors have read and agreed to the published version of the manuscript.

Funding

This research was funded by the Youth Fund Project of GRINM 2021 and the National Natural Science Foundation of China (51601016).

Institutional Review Board Statement

Not applicable.

Informed Consent Statement

Not applicable.

Data Availability Statement

The data presented in this study are available on request from the corresponding authors.

Conflicts of Interest

The authors declare no conflict of interest.

References

  1. Wang, S.Y.; Zhang, Y.D.; Schuman, C.; Lecomte, J.S.; Zhao, X.; Zuo, L.; Philippe, M.J.; Esling, C. Study of twinning/detwinning behaviors of Ti by interrupted in situ tensile tests. Acta Mater. 2015, 82, 424–436. [Google Scholar] [CrossRef]
  2. Wang, L.; Lind, J.; Phukan, H.; Kenesei, P.; Park, J.S.; Suter, R.; Beaudoin, A.; Bieler, T. Mechanical twinning and detwinning in pure Ti during loading and unloading-An in situ high-energy X-ray diffraction microscopy study. Scr. Mater. 2014, 92, 35–38. [Google Scholar] [CrossRef] [Green Version]
  3. Meng, Y.; Gong, G.H.; Wei, D.T.; Xie, Y.M. In situ high temperature X-ray diffraction study on high strength aluminous porcelain insulator with the Al2O3-SiO2-K2O-Na2O system. Appl. Clay Sci. 2016, 132, 760–767. [Google Scholar] [CrossRef]
  4. Malyar, N.; Dehm, G.; Kirchlechner, C. Strain rate dependence of the slip transfer through a penetrable high angle grain boundary in copper. Scr. Mater. 2017, 138, 88–91. [Google Scholar] [CrossRef]
  5. Zhang, K.Z.; Ni, L.C.; Lei, Z.L.; Chen, Y.B.; Hu, X. In situ investigation of the tensile deformation of laser welded Ti2AlNb joints. Mater. Charact. 2017, 123, 51–57. [Google Scholar] [CrossRef]
  6. Ullah, R.; Lu, J.; Sang, L.; Rizwan, M.; Zhang, Y.; Zhang, Z. Investigating the microstructural evolution during deformation of laser additive manufactured Ti-6Al-4V at 400 °C using in-situ EBSD. Mater. Sci. Eng. A 2021, 823, 141761. [Google Scholar] [CrossRef]
  7. Long, W.; Ou, M.G.; Mao, X.Q.; Liang, Y.L. In situ deformation behavior of TC21 titanium alloy with different α morphologies (equiaxed/lamellar). Rare Met. 2021, 40, 1173–1181. [Google Scholar] [CrossRef]
  8. Zhu, S.X.; Guo, Y.Z.; Ruan, Q.C.; Chen, H.S.; Li, Y.L.; Fang, D.N. Formation of adiabatic shear band within Ti-6Al-4V: An in-situ study with high-speed photography and temperature measurement. Int. J. Mech. Sci. 2020, 171, 105401. [Google Scholar] [CrossRef]
  9. Zhang, L.H.; Pellegrino, A.; Townsend, D.; Petrinic, N. Thermomechanical constitutive behaviour of a near α titanium alloy over a wide range of strain rates: Experiments and modelling. Int. J. Mech. Sci. 2021, 189, 105970. [Google Scholar] [CrossRef]
  10. Vinel, A.; Seghir, R.; Berthe, J.; Portemont, G.; Réthoré, J. Metrological assessment of multi-sensor camera technology for spatially-resolved ultra-high-speed imaging of transient high strain-rate deformation processes. Strain 2021, 57, e12381. [Google Scholar] [CrossRef]
  11. Tarfaoui, M.; El Moumen, A.; Ben Yahia, H. Damage detection versus heat dissipation in E-glass/Epoxy laminated composites under dynamic compression at high strain rate. Compos. Struct. 2018, 186, 50–61. [Google Scholar] [CrossRef] [Green Version]
  12. Gangireddy, S.; Komarasamy, M.; Faierson, E.J.; Mishra, R.S. High strain rate mechanical behavior of Ti-6Al-4V octet lattice structures additively manufactured by selective laser melting (SLM). Mater. Sci. Eng. A 2019, 745, 231–239. [Google Scholar] [CrossRef]
  13. Xu, X.F.; Ali, T.; Wang, L.; Cheng, H.W.; Zhou, Z.; Ning, Z.X.; Liu, X.P.; Liu, A.J.; Zhang, B.B.; Cheng, X.W. Research on dynamic compression properties and deformation mechanism of Ti6321 titanium alloy. J. Mater. Res. Technol. 2020, 9, 11509–11516. [Google Scholar]
  14. Wang, Y.L.; Hui, S.X.; Liu, R.; Ye, W.J.; Yu, Y.; Kayumov, R. Dynamic response and plastic deformation behavior of Ti-5Al-2.5Sn ELI and Ti-8Al-1Mo-1V alloys under high-strain rate. Rare Met. 2014, 33, 127–133. [Google Scholar] [CrossRef]
  15. Meyers, M.A. Dynamic Behavior of Materials; John Wiley & Sons Inc.: Hoboken, NJ, USA, 1994; p. 1. [Google Scholar]
  16. Bai, Y.L.; Dodd, B. Adiabatic Shear Localization: Occurrence, Theories, and Applications; Pergamon Press Ltd.: Oxford, UK, 1992; pp. 101–115. [Google Scholar]
  17. Cui, Y.M.; Zheng, W.W.; Li, C.H.; Cao, G.H.; Wang, Y.D. Effectiveness of hot deformation and subsequent annealing for β grain refinement of Ti-5Al-5Mo-5V-1Cr-1Fe titanium alloy. Rare Met. 2021, 40, 3608–3615. [Google Scholar] [CrossRef]
  18. Yang, Q.Y.; Ma, M.; Tan, Y.B.; Xiang, S.; Zhao, F.; Liang, Y.L. Microstructure and texture evolution of TB8 titanium alloys during hot compression. Rare Met. 2021, 40, 2917–2926. [Google Scholar] [CrossRef]
  19. Zhao, Q.Y.; Yang, F.; Torrens, R.; Bolzoni, L. In-situ observation of the tensile deformation and fracture behaviour of powder-consolidated and as-cast metastable beta titanium alloys. Mater. Sci. Eng. A 2019, 750, 45–59. [Google Scholar] [CrossRef]
  20. Shao, H.; Zhao, Y.Q.; Ge, P.; Zeng, W.D. In-situ SEM observations of tensile deformation of the lamellar microstructure in TC21 titanium alloy. Mater. Sci. Eng. A 2013, 559, 515–519. [Google Scholar] [CrossRef]
  21. Barkia, B.; Couzinié, J.P.; Lartigue-Korinek, S.; Guillot, I.; Doquet, V. In situ TEM observations of dislocation dynamics in α titanium: Effect of the oxygen content. Mater. Sci. Eng. A 2017, 703, 331–339. [Google Scholar] [CrossRef]
  22. Gurao, N.; Kapoor, R.; Suwas, S. Deformation behaviour of commercially pure titanium at extreme strain rates. Acta Mater. 2011, 59, 3431–3446. [Google Scholar] [CrossRef]
  23. Zhou, P.; Xiao, D.W.; Jiang, C.L.; Sang, G.; Zou, D.L. Twin interactions in pure Ti under high strain rate compression. Metall. Mater. Trans. A 2017, 48, 126–138. [Google Scholar] [CrossRef]
  24. Xu, F.; Zhang, X.Y.; Ni, H.T.; Liu, Q. {11-24} deformation twinning in pure Ti during dynamic plastic deformation. Mater. Sci. Eng. A 2012, 541, 190–195. [Google Scholar] [CrossRef]
  25. Luo, Y.-M. Study on Multi-steps Dynamic Compression Deformation Behavior of Ti-5.5Al Alloy. In IOP Conference Series: Materials Science and Engineering; IOP Publishing: Bristol, UK, 2019; Volume 585. [Google Scholar] [CrossRef]
  26. Yang, P. Electron Backscattered Diffraction Technology and Application; Metallurgical Industry Press: Beijing, China, 2007; p. 91. [Google Scholar]
  27. Engler, O.; Randle, V. Introduction to Texture Analysis: Macrotexture, Microtexture, and Orientation Mapping, 2nd ed.; CRC Press Inc.: Boca Raton, FL, USA, 2009; pp. 24–34. [Google Scholar]
  28. Qin, H.; Jonas, J.J. Variant selection during secondary and tertiary twinning in pure titanium. Acta Mater. 2014, 75, 198–211. [Google Scholar] [CrossRef]
  29. Jonas, J.J.; Mu, S.; Al-Samman, T.; Gottstein, G.; Jiang, L.; Martin, Ė. The role of strain accommodation during the variant selection of primary twins in magnesium. Acta Mater. 2011, 59, 2046–2056. [Google Scholar] [CrossRef]
  30. Mu, S.; Jonas, J.J.; Gottstein, G. Variant selection of primary, secondary and tertiary twins in a deformed Mg alloy. Acta Mater. 2012, 60, 2043–2053. [Google Scholar] [CrossRef]
  31. Song, S.; Gray, G., III. Structural interpretation of the nucleation and growth of deformation twins in Zr and Ti—II. Tem study of twin morphology and defect reactions during twinning. Acta Metall. Mater. 1995, 43, 2339–2350. [Google Scholar] [CrossRef]
  32. Capolungo, L.; Beyerlein, I.; Tomé, C. Slip-assisted twin growth in hexagonal close-packed metals. Scr. Mater. 2009, 60, 32–35. [Google Scholar] [CrossRef]
  33. Wang, L.; Yang, Y.; Eisenlohr, P.; Bieler, T.; Crimp, M.; Mason, D. Twin nucleation by slip transfer across grain boundaries in commercial purity titanium. Metall. Mater. Trans. A 2010, 41, 421–430. [Google Scholar] [CrossRef]
  34. Proust, G.; Tomé, C.N.; Jain, A.; Agnew, S.R. Modeling the effect of twinning and detwinning during strain-path changes of magnesium alloy AZ31. Int. J. Plast. 2009, 25, 861–880. [Google Scholar] [CrossRef]
Figure 1. (a) Microstructure; (b) grain size distribution of the pure Ti sample used in this study.
Crystals 12 00677 g001
Figure 2. Schematic diagram of (a) SHPB device; (b) specimen; (c) stopper ring.
Crystals 12 00677 g002
Figure 3. IPF maps of the observation area with strains of (a) 0; (b) 0.05; (c) 0.10; (d) 0.15.
Crystals 12 00677 g003
Figure 4. (a): The undeformed grains where twinning is going to happen. The grains painted green, purple, and yellow indicate { 10 1 ¯ 2 } twins, { 11 2 ¯ 2 } twins, and no twins, respectively. (b): Microstructure with the boundaries of { 10 1 ¯ 2 } twins in green and { 11 2 ¯ 2 } twins in purple; (c,d): SEM morphology with twins and slip lines; (e) pole figure and (f) IPF map of Grain No. 24 at the 0.05 strain level.
Crystals 12 00677 g004
Figure 5. SEM figures at the same place with a strain of (a): 0.05, (b): 0.10 indicating the slip lines; (c): the model diagram with a strain of 0.05 where twinning is going to nucleate and grow. The place painted green, purple, orange, and yellow indicate { 10 1 ¯ 2 } twins, { 11 2 ¯ 2 } twins, both of the two twinning systems, and no twins, respectively; (d): microstructure at 0.10 strain level, with { 10 1 ¯ 2 } twin boundaries (in green) and { 11 2 ¯ 2 } twin boundaries (in purple); SEM morphology with a strain of (e): 0.05 (a,f): 0.10.
Crystals 12 00677 g005
Figure 6. (a): Model diagram with a strain of 0.10. The places where twinning is going to nucleate and grow are painted green, purple, and yellow indicating { 10 1 ¯ 2 } twins, { 11 2 ¯ 2 } twins, and no twins, respectively. The place where existed twins become unidentified is painted in blue; (b): microstructure at 0.15 strain level, with { 10 1 ¯ 2 } twin boundaries (in green) and { 11 2 ¯ 2 } twin boundaries (in purple) identified by EDAX/TSL OIM Analysis 6.2; SEM morphology with a strain of (c): 0.10 and (d): 0.15.
Crystals 12 00677 g006
Figure 7. IPF and misorientation map with strains of (a): 0.05; (b): 0.10.
Crystals 12 00677 g007
Figure 8. A schematic diagram showing the microstructural evolution of pure Ti under high strain rate compression with strains of (a): 0; (b): 0.05; (c): 0.10; (d): 0.15.
Crystals 12 00677 g008
Table 1. Rotation, twinning, and slip systems of 29 observed grains, at the 0.05 strain level. The SFs of activated variants that do not have the largest SF of the six equivalent variants are marked in bold. ‘×2’ signs in twin and slip systems represent the two different equivalent variants observed.
No.Angle/Axis of RotationTwin SystemBiggest SF for This SystemCorresponding SF of Active VariantSlip SystemCorresponding SF
AngleAxis
16.6[ 2   2   4 ¯   3 ¯ ] D{0002}< 11 2 ¯ 0 > 0.321
23.7[ 5   1 ¯   4 ¯   3 ¯ ]T{ 11 2 ¯ 2 }0.2550.187D{ 10 1 ¯ 1 }< 1 2 ¯ 10 > 0.406
[ 5   4 ¯   1 ¯   9 ¯ ] D{ 11 2 ¯ 2 }< 11 ¯ 23 > 0.387
42.7[ 11   7 ¯   4 ¯   18 ¯ ]T{ 11 2 ¯ 2 }0.2940.294D{ 10 1 ¯ 1 }< 1 2 ¯ 10 > 0.471
D{ 10 1 ¯ 0 }< 1 2 ¯ 10 > 0.335
54.5[ 8   7 ¯   1 ¯   21   ]T{ 10 1 ¯ 2 }0.4210.421
63.4[ 1 ¯   0   1   1 ]T{ 10 1 ¯ 2 }0.3970.226
75.5[ 2   4 ¯   2   9 ] D{ 10 1 ¯ 0 }< 1 2 ¯ 10 > 0.497
84[ 14   4 ¯   10 ¯   9 ¯ ] D{0002}< 11 2 ¯ 0 > 0.487
D{ 1 1 ¯ 01 }< 11 2 ¯ 0 > 0.322
95.4 [ 4   1   5 ¯   0 ] T{ 10 1 ¯ 2 }0.3010.301D{ 10 1 ¯ 1 }< 1 2 ¯ 10 > 0.410
105.8[ 4   1   5 ¯   6 ¯ ]T{ 10 1 ¯ 2 }0.4630.188D{ 10 1 ¯ 1 }< 1 2 ¯ 10 > 0.487
113.7 [ 1   7   8 ¯   6 ] D{ 11 2 ¯ 2 }< 11 ¯ 23 > 0.306
125.3[ 7 ¯   11   4 ¯   0 ]T{ 10 1 ¯ 2 } × 20.435 and 0.3890.389 and 0.130
134.4 [ 2   4 ¯   2   9 ¯ ] T { 10 1 ¯ 2 }0.4430.443
145.1[ 1 ¯   4 ¯   5   6 ]T{ 10 1 ¯ 2 }0.4970.147
154.9[ 2   1 ¯   1 ¯   0 ]T{ 10 1 ¯ 2 }0.4820.455
164.4[ 2   4 ¯   2   3 ¯ ]T{ 11 2 ¯ 2 } × 20.497 and 0.4840.414 and 0.343
177.3[ 7 ¯   8   1 ¯   0 ] D{ 10 1 ¯ 1 }< 1 2 ¯ 10 > × 20.478 and 0.372
182.7[ 1   1   2 ¯   0 ]T{ 10 1 ¯ 2 }0.2100.198
194.7[ 5   8   13 ¯   3 ¯ ] D{ 10 1 ¯ 1 }< 1 2 ¯ 10 > 0.446
205.4[ 5 ¯   1   4   3 ]T{ 10 1 ¯ 2 }0.2100.210
215.8[ 1   0   1 ¯   1 ] D{0002}< 11 2 ¯ 0 > 0.443
235.5[ 7   8 ¯   1   9 ¯ ]T{ 10 1 ¯ 2 } × 20.394 and 0.3930.394 and 0.393
242.7[ 2   1 ¯   1 ¯   9 ¯ ]T{ 10 1 ¯ 2 } × 20.485 and 0.4780.478 and 0.206D{ 10 1 ¯ 1 }< 1 2 ¯ 10 > × 20.420 and 0.497
257[ 1   1   2 ¯   15 ]T{ 10 1 ¯ 2 } × 20.361 and 0.3190.361 and 0.037D{ 10 1 ¯ 1 }< 1 2 ¯ 10 > 0.427
263.9[ 9   3 ¯   6 ¯   3 ¯ ]T{ 10 1 ¯ 2 }0.4850.481
274.2[ 7 ¯   8   1 ¯   0 ]T{ 10 1 ¯ 2 }0.3650.365
282.7[ 1   2 ¯   1   12 ¯ ] D{ 10 1 ¯ 1 }< 1 2 ¯ 10 > 0.446
293.9[ 4 ¯   1 ¯   5   0 ]T{ 11 2 ¯ 2 } × 20.261 and 0.2510.142 and 0.113
Publisher’s Note: MDPI stays neutral with regard to jurisdictional claims in published maps and institutional affiliations.

