Article

Characterization of Microstructural Damage and Failure Mechanisms in C45E Structural Steel under Compressive Load

1
Department for Production Engineering, Faculty of Mechanical Engineering, University of East Sarajevo, Vuka Karadžića 30, 71123 East Sarajevo, Bosnia and Herzegovina
2
Department of Machining, Assembly and Engineering Metrology, Faculty of Mechanical Engineering, Technical University of Ostrava, 17. Listopadu 2172/15, 708 00 Ostrava, Czech Republic
3
Institute of Manufacturing Technology, Faculty of Mechanical Engineering, Brno University of Technology, Technicka 2896/2, 616 69 Brno, Czech Republic
4
Department for Production Engineering, Faculty of Technical Sciences, University of Novi Sad, Trg Dositeja Obradovića 6, 21000 Novi Sad, Serbia
*
Author to whom correspondence should be addressed.
Crystals 2022, 12(3), 426; https://doi.org/10.3390/cryst12030426
Submission received: 25 February 2022 / Revised: 14 March 2022 / Accepted: 17 March 2022 / Published: 19 March 2022

Abstract

:
In this paper, the microstructural damage evolution of a steel with a ferrite–pearlite microstructure (C45E) was investigated during the process of cold upsetting. The development and the accumulation of microstructural damage were analyzed in different areas of samples that were deformed at different strain levels. The scanning electron microscopy (SEM) results showed that various mechanisms of nucleation of microcavities occurred during the upsetting process. In quantitative terms, microcavities were predominantly generated in pearlite colonies due to the fracture of cementite lamellae. In addition, the mechanism of decohesion had a significant influence on the development of a macroscopic crack, since a high level of microcracks, especially at higher degrees of deformation, was observed at the ferrite/pearlite or ferrite/ferrite interfaces. It was found that the distribution of microcavities along the equatorial plane of the sample was not uniform, as the density of microcavities increased with increasing strain level. The influence of stress state, i.e., stress triaxiality, on the nucleation and distribution of microcracks, was also analyzed.

1. Introduction

Metal forming processes offer many techno-economic benefits in producing structural parts and components. One of the main advantages is a significant improvement in the mechanical properties (strength, hardness, etc.) of the material during forming, which results from microstructural modifications due to different strengthening mechanisms (strain hardening and grain refinement). Therefore, components produced by metal forming exhibit high performance, robustness and reliability in use, and as a rule they are employed in demanding environments where dynamic loading and human safety are critical considerations. However, the process of plastic deformation also causes some microstructural changes that cause material performance degradation (damage) at different levels (micro-scale, meso-scale and macro-scale levels).
The phenomenology of material damage in metal forming processes has been the subject of extensive research [1,2,3,4,5,6,7]. Different methodological approaches have been used to study mechanisms associated with material structural changes that negatively affect material ductility and lead to material failure. The failure of polycrystalline metals is mainly related to the evolution (nucleation, growth and coalescence) of discontinuities in the material volume (microcracks or microvoids) that propagate further to the macro level until material fracture. This is a progressive, irreversible and complex (multi-scale, multi-mechanism) process, and therefore it is quite challenging to predict the behavior of materials during plastic deformation, as well as the damage level in a formed component [8]. The level of accumulated microstructural damage depends on several factors, of which the stress–strain state is the dominant factor [7,9,10,11,12,13,14,15,16]. It should be noted that most polycrystalline metals exhibit substantial plastic deformation prior to fracture (ductility).
In the case of heterogeneous materials (here, this refers to strength heterogeneity, i.e., materials with soft and hard domains), interface decohesion and the fracture of second-phase particles are basic damage nucleation mechanisms [17]. These mechanisms are driven by differences in the deformation behavior of the (soft) metal base and (hard) secondary particles, i.e., deformation incompatibility at the particle/metallic matrix. On the other hand, microvoid growth and coalescence are mainly affected by the stress state and microstructure topography. The critical deformation at which the process of nucleation of microcavities begins to take place by the decohesion mechanism is influenced by several factors [18]: proportion, size, shape and orientation of secondary-phase particles, particle strength, metal base strength, generated stress state at the boundary surface, the achieved degree of deformation, the ratio of hydrostatic and effective stresses, processing temperature, deformation rate, etc. This work also provides a summary of various criteria used for analyzing nucleation of microcavities by the mechanism of decohesion. When modeling microcavity nucleation via a decohesion mechanism, regardless of the chosen criterion, it is assumed that the particles of secondary phases are deformed only elastically, while the metal base is deformed plastically [19]. Regarding the second mechanism of nucleation of microcavities, i.e., fracture of secondary particles, previous researchers [18,20] have shown that in the case of cold forming, the onset of fracture depends on the shape, size and brittleness of particles but predominantly on the degree of deformation. The main influence of brittle particles on the void nucleation mechanism is manifested through a change in the local stress state.
Avramović-Cingara et al. [2,3] studied the influence of morphology and volume fraction of the different microconstituents on the mechanical properties and ductility of steel materials. They found the following: (1) the tensile capacity (or strength) of the material is severely reduced when the volume fraction of secondary phases is increased; (2) at constant volume fraction, a uniform distribution of microconstituents ensures better mechanical properties and ductility; (3) the morphology and the orientation of secondary particles, especially hard carbides, significantly affect the level of accumulated damages. Matsuno et al. [21] reported that the volume fraction of individual microconstituents also affects the intensity of nucleation and growth of microvoids. Regarding the influence of mechanical characteristics of materials and process parameters, Benzerga [20] stated that the yield stress and strain hardening coefficient of the metal base, the strength of secondary particles and the ratio of hydrostatic and effective stress are key factors that affect the activation of a certain microvoid nucleation mechanism. The core mechanisms of microstructural damage for metallic materials under different deformation conditions were reviewed by Lin et al. [22], who also summarized typical constitutive equations developed to model the individual damage mechanisms.
Steels with a ferrite-pearlite microstructure and a carbon content of less than 0.6% belong to the group of structural steels. Due to various benefits (good strength/weight ratio, high creep resistance and strength at elevated temperatures, etc.), these steels are used in a wide range of constructions. In addition, structural steels exhibit good ductility, and thus they are suitable for cold forming processes. In order to predict their behavior during plastic deformation and to obtain defect-free components, it is necessary to understand the morphological changes of individual constitutive phases, as well as their interactions, under the effect of local stress–strain states [23] and processing conditions. The influence of the volume fraction of ferrite and pearlite on ductility and the development of microstructural damage in the case of structural steels was investigated by Gladshtein et al. [24]. They reported that the pearlite content, especially above 20%, has a noticeable but not always favorable effect on the ductility and resistance to fracture propagation. On the other hand, the ultimate tensile strength, hardness and work-hardening rate increase with increasing the volume fraction of pearlite in the microstructure. [25]. The results presented in the study by Brandaleze [26] show that an increased proportion of ferrite in the microstructure (or a decrease in the carbon content of steel) prevents a decrease in the distance between the cementite lamellae in pearlite, which has a negative effect on the ductility. In addition, the crystal grain size [27], microstructural morphology [28], micro alloying [29] and distance between cementite lamellae [30,31] have a strong influence on the mechanical properties and formability/workability of ferritic–pearlitic steels. In general, it can be said that a microstructure that increases material strength tends to reduce ductility, and vice versa.
Due to the complex influence of various factors, different damage nucleation mechanisms could be activated in the microstructure of ferritic–pearlitic steels during plastic deformation. Ohata and Toyoda [32] stated that the development of ductile fracture under cyclic loading is mostly affected by the microvoid nucleation in the soft ferritic base, formed in the vicinity of the ferrite–pearlite boundary surface. Investigating the plastic damage evolution in a structural steel with 0.21% C under the action of tensile stress, Wang et al. [6] also noticed the nucleation of voids at the ferrite/pearlite interface, describing it as a continuous process that may occur at different degrees of deformation. However, in their case, the dominant nucleation mechanism took place in the soft ferritic base. Based on tests performed under different tensile stress conditions (from uniaxial to biaxial plane tension), Isavand and Assempour [28] found that microstructural damage is mostly caused by considerable plastic deformation of ferrite grains located near pearlite colonies. Intense plastic deformation of ferrite grains is a consequence of a severe deformation incompatibility between the soft and hard phases (ferrite and pearlite). Incompatibility of deformation is also the main cause of the activation of the decohesion mechanism at the boundary surface between non-metallic inclusions and the soft ferritic base [33]. De Geus et al. [34] developed a simple microstructural model to study the impact of the stress state on the microstructural failure mechanisms of a dual-phase material consisting of a ductile soft phase and a brittle hard phase. By varying the stress triaxiality ratio (β) over a wide range (−0.4, 1.5) authors found that only one of the phases dominated macroscopic fracture: at low stress triaxiality (β < 0.2) the ductile failure mechanism occurring in the soft phase was dominant, whereas at high triaxialities β > 0.5, the macroscopic fracture initiation derives from brittle fracture of the hard phase. In the range 0.2 < β < 0.5, no single mechanism was dominant. The value of stress triaxiality (critical triaxiality) above which the brittle failure mechanism becomes dominant depends largely on the hard-phase volume fraction and the elastic modulus difference between phases.
The majority of investigations dealing with microstructural damage evaluation and failure in metals and alloys during forming processes are focused on the mechanisms of crack initiation, growth and propagation under tensile loading. However, the evolution process of cracks subjected to compressive stresses is far less analyzed and understood. Most bulk metal forming processes are performed under three-dimensional compression and negative stress triaxiality, while crack propagation and surface cracking mainly occur under loading mode I (opening mode) and loading mode II (shear or sliding mode) [35]. According to Bao and Wierzbicki [36], shear fracture prevails in upsetting and shear testing, that is, in the range of low and negative stress triaxiality. Isaksson and Ståhle [37] investigated the mechanisms of fracture propagation in a compressed elastic–perfectly plastic material. They developed an analytical solution for predicting the direction of initial crack propagation using slip-line theory and projection stress-based criteria. Lou et al. [38] conducted a series of tests ranging from plane strain compression to balanced biaxial tension to examine the mechanisms of ductile fracture under a variety of loading conditions (stress triaxialities varying from −0.57 to 0.67). It was observed that, in each model, fractures tended to propagate in the direction of the maximum shear stress.
The main objective of this research was to identify and characterize the damage mechanisms in cylindrical specimens of a ferrite–pearlite steel (C45E) during cold upsetting process. Efforts were also made to clarify the role of microconstituents in the formation of microvoids and to find a quantitative-qualitative relationship between the generated stress state (stress triaxiality) and the density of microcracks along the equatorial plane of the specimen, which is a novelty in the field. These findings could help researchers better understand evolution of microstructural damage and the mechanisms of ductile crack propagation in structural steels subjected to compressive loads.

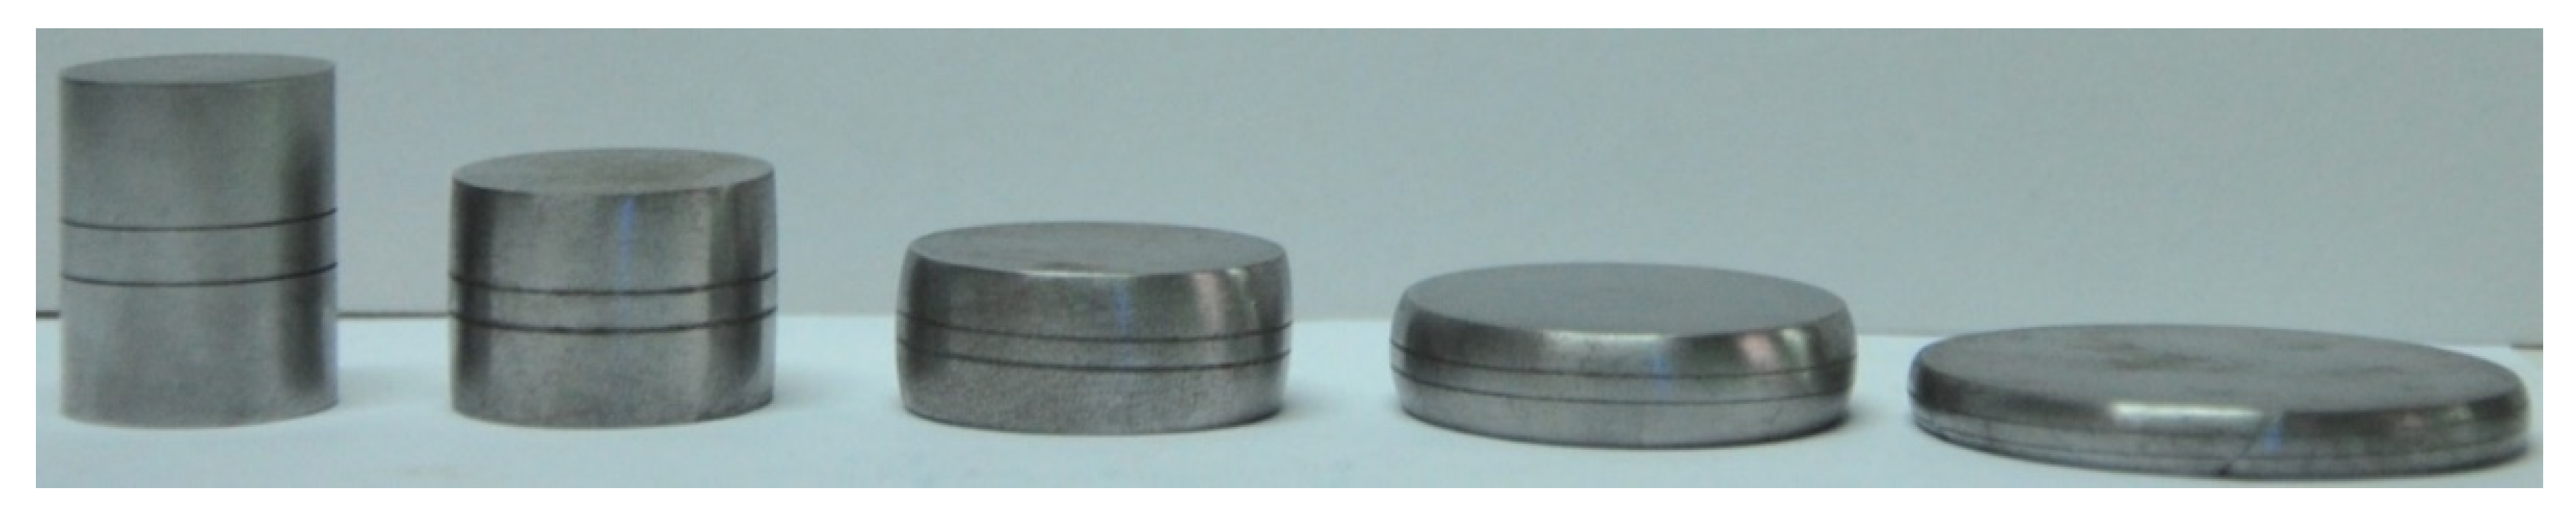
2. Experimental Work

To study the microstructure evolution and the failure mechanisms under compressive stresses, cylindrical specimens of initial dimensions Ø25 × 20 mm were upset with flat dies (plates) for different degrees of deformation (height reduction) until the appearance of a visible crack at the free surface of the specimen. This model was chosen due to the fact that upsetting is an elementary bulk metal forming operation, which is often found in multi-stage cold and hot bulk metal forming processes (extrusion, heading, forging, etc.). In addition, upsetting tests performed with dies and specimens of various shapes are extensively used for workability analysis of materials: the uniaxial upsetting (compression) test is one of three basic forming models for determining the forming limit curve (FLC) in bulk forming.
The forming step (stroke) was 30% of the specimen height from the previous phase, which resulted in four different degrees of deformation (Figure 1). The total number of specimens was 12, that is, 3 per forming step. After each forming step the axial strain εz was calculated using Equation (1).
ε z i = ln ( h 0 h i ) ,
where h is the height of specimens, while i refers to the current upsetting pass.
The cylindrical specimens were made of normalized C45E steel. This is a medium carbon steel formulated for primary forming into wrought products. It also is a general engineering structural steel that exhibits moderately high tensile strengths, good machinability and ductility at room temperature. Various engineering elements such as axles, nuts and bolts, crankshafts, bearings, forged wheels, etc., are made from this steel. The chemical composition of C45E steel, determined by an ARL 2460 optical emission spectrometer, is shown in Table 1.
The basic mechanical properties of C45E steel used in the experimental work were determined by uniaxial tensile testing according to the standard ISO 6892-1 (Rp0.2—yield stress at 0.2% plastic strain, Rm—ultimate tensile stress, εm—strain under maximum load (strain at Rm), ψ—reduction of area) [29]. The tensile test was carried out on a VEB ZDM 5/91 universal testing machine with a crosshead speed of 5 mm/min. The values given in Table 2 are the average values obtained on the basis of three specimens with 8 mm diameter and a gauge length of 100 mm. The Brinell hardness HB was measured on both the upper and lower surface of the cylindrical specimens (in accordance with the ISO 6506-1:2011 standard) using a ball of 2.5 mm diameter and a VEB HPO 250 machine. The average values of the six measurements are given in Table 2.
The flow curve or work-hardening behaviour of the material, which is represented by the relationship between true stress (K) and true (plastic) strain (ε), was determined by the Rastegaev compression test. A mathematical description of the work-hardening phenomenon is given in the form of Ludwik’s equation (Equation (2)):
K = K 0 + C ε n ,
where K0 is the yield stress (K0 = 462.8 MPa), C is the strength index and n is the work-hardening exponent. By fitting the experimental results for five specimens (initial dimensions d0 × h0 = 20 × 20 mm), the numerical values for the parameters were determined with a regression coefficient value of 0.988 as follows: C = 451.92 MPa and n = 0.379.
For microstructural characterization of both undeformed (as-received material) and deformed specimens, a Leitz Orthoplan light microscope (LM) and a Jeol JSM-6460LV scanning electron microscope (SEM) were employed. The specimens were prepared by the conventional metallographic technique, which consisted of cutting, multi-stage grinding, polishing and etching. The etching was performed using 2% Nital (solution of nitric acid in ethanol). In order to eliminate the effect of electron charging and obtain a clear SEM image, the etched samples were coated with gold in a BAL-TEC SCD 005 vacuum evaporator for 90 s. A total of 5 randomly selected samples (one undeformed and one for each degree of deformation) were analyzed by SEM.
The SEM analysis for the quantification of the microstructural damage was performed according to the plan shown in Figure 2, which was defined on the basis of the results of previous research dealing with the influence of the stress–strain state on crack initiation and development during forming operations [9,39,40,41]. Bearing in mind that the stress–strain state in a specimen during free upsetting is symmetric about the vertical axis (z), the SEM analysis was performed only for one half of the longitudinal cross section of each sample. The testing area covered a narrow area around the equatorial plane and was divided into two sections. The section closer to the free surface (Section I in Figure 2) was a “critical” zone, where a large strain gradient (the rate at which strain changes throughout the cross section of the specimen) was expected. Therefore, a fine mesh, i.e., a large number of testing points was selected to capture the proper strain distribution and evolution of the microstructure in this section. For all samples the length of Section I was the same (7 mm, measured from the free surface). This section was further divided into four subdomains with the following lengths: 1.5 mm (Zone I), 1.5 mm (Zone II), 2 mm (Zone III) and 2 mm (Zone IV). In contrast, the SEM analysis of the central part of the specimen (Section II in Figure 2) was performed only for a few points (M and S) since there was a very low strain gradient in this section. The length of Section II in Figure 2 varied from sample to sample (depending on the strain value) but the positions of testing points M and S relative to the axis of symmetry (CL) were identical. JmicroVision software was used to quantify the microstructural defects in pearlite colonies.

3. Results and Discussion

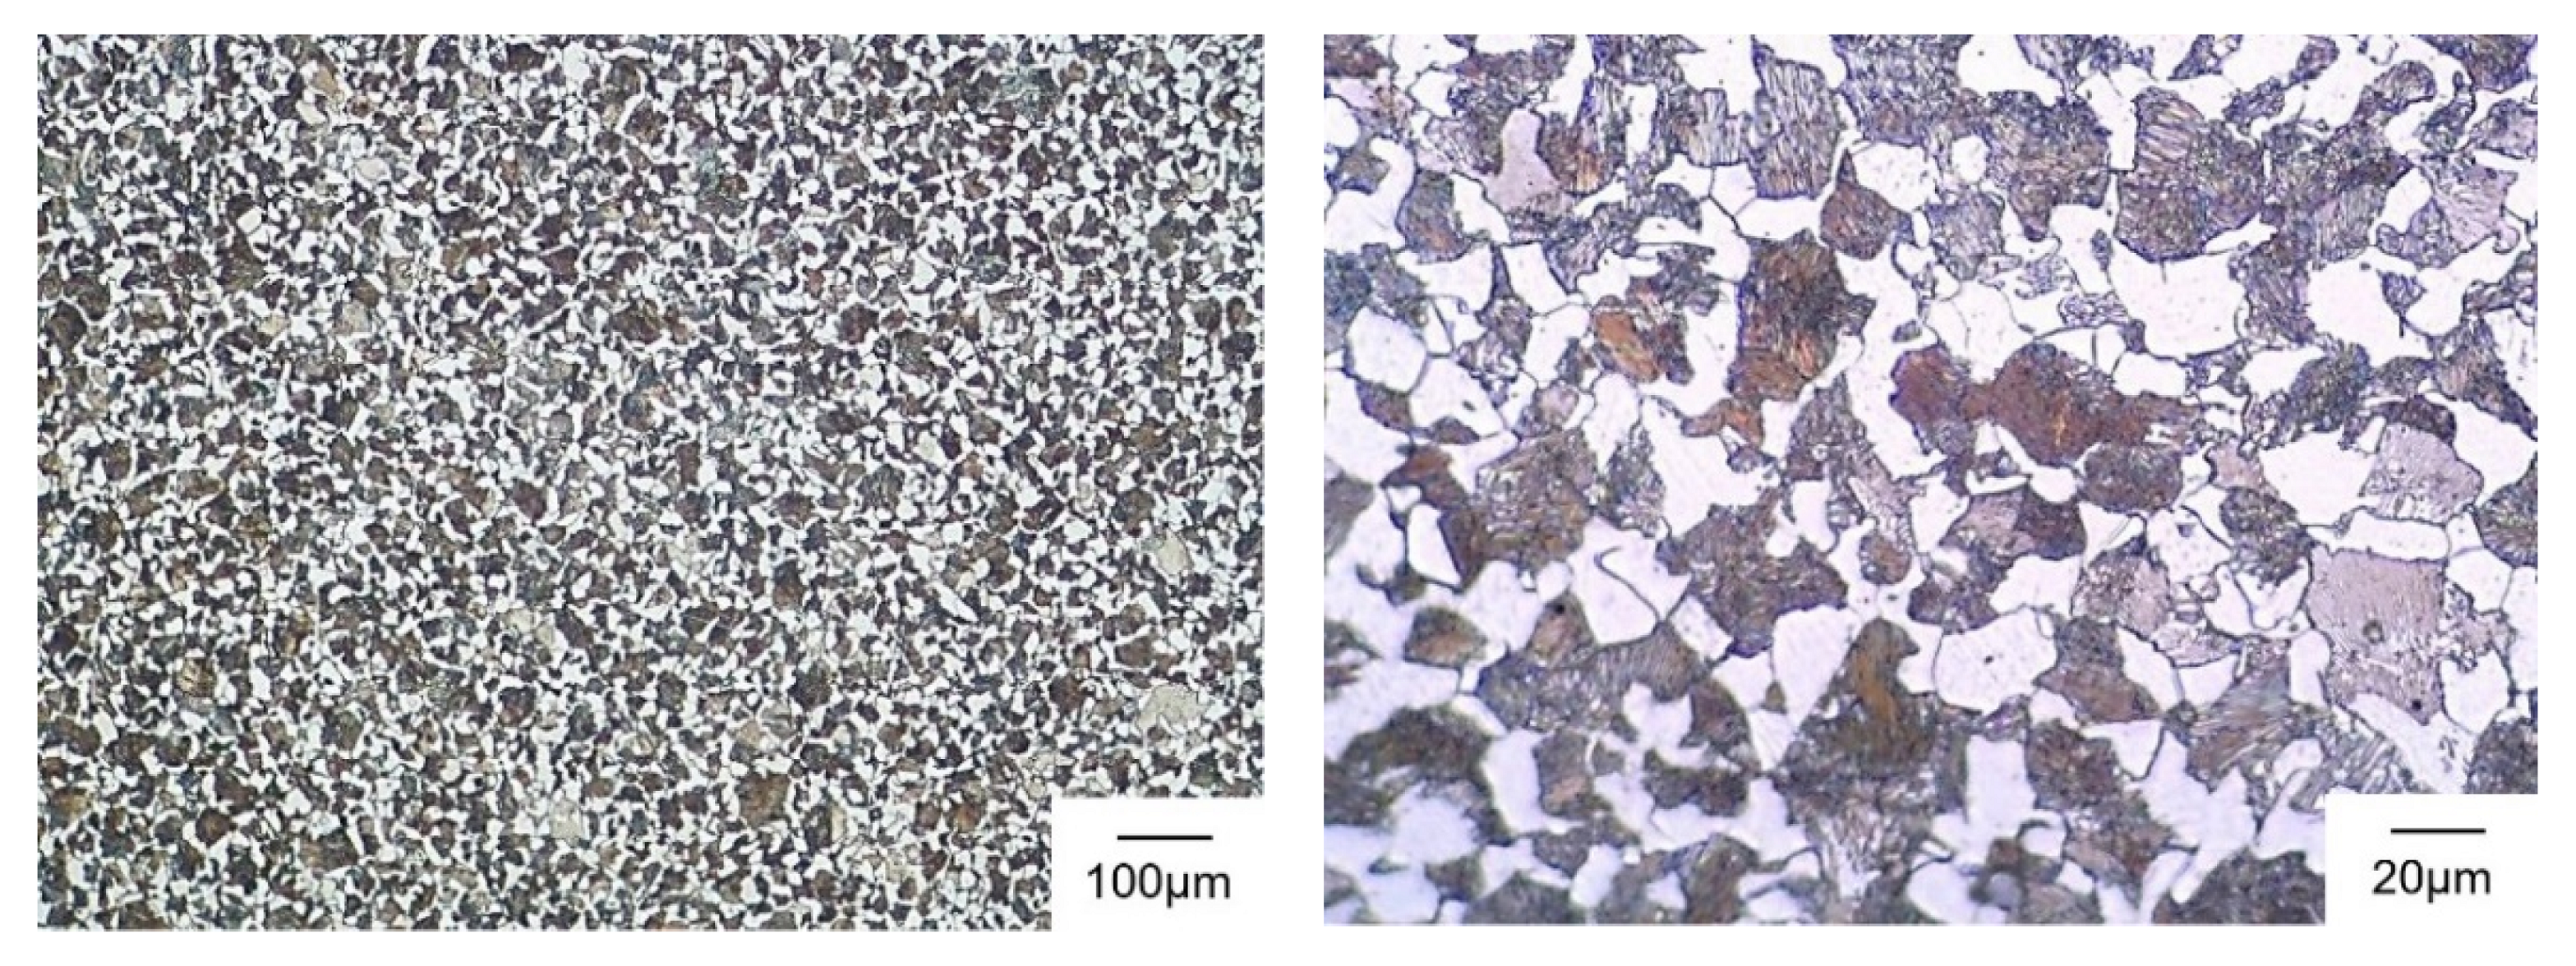
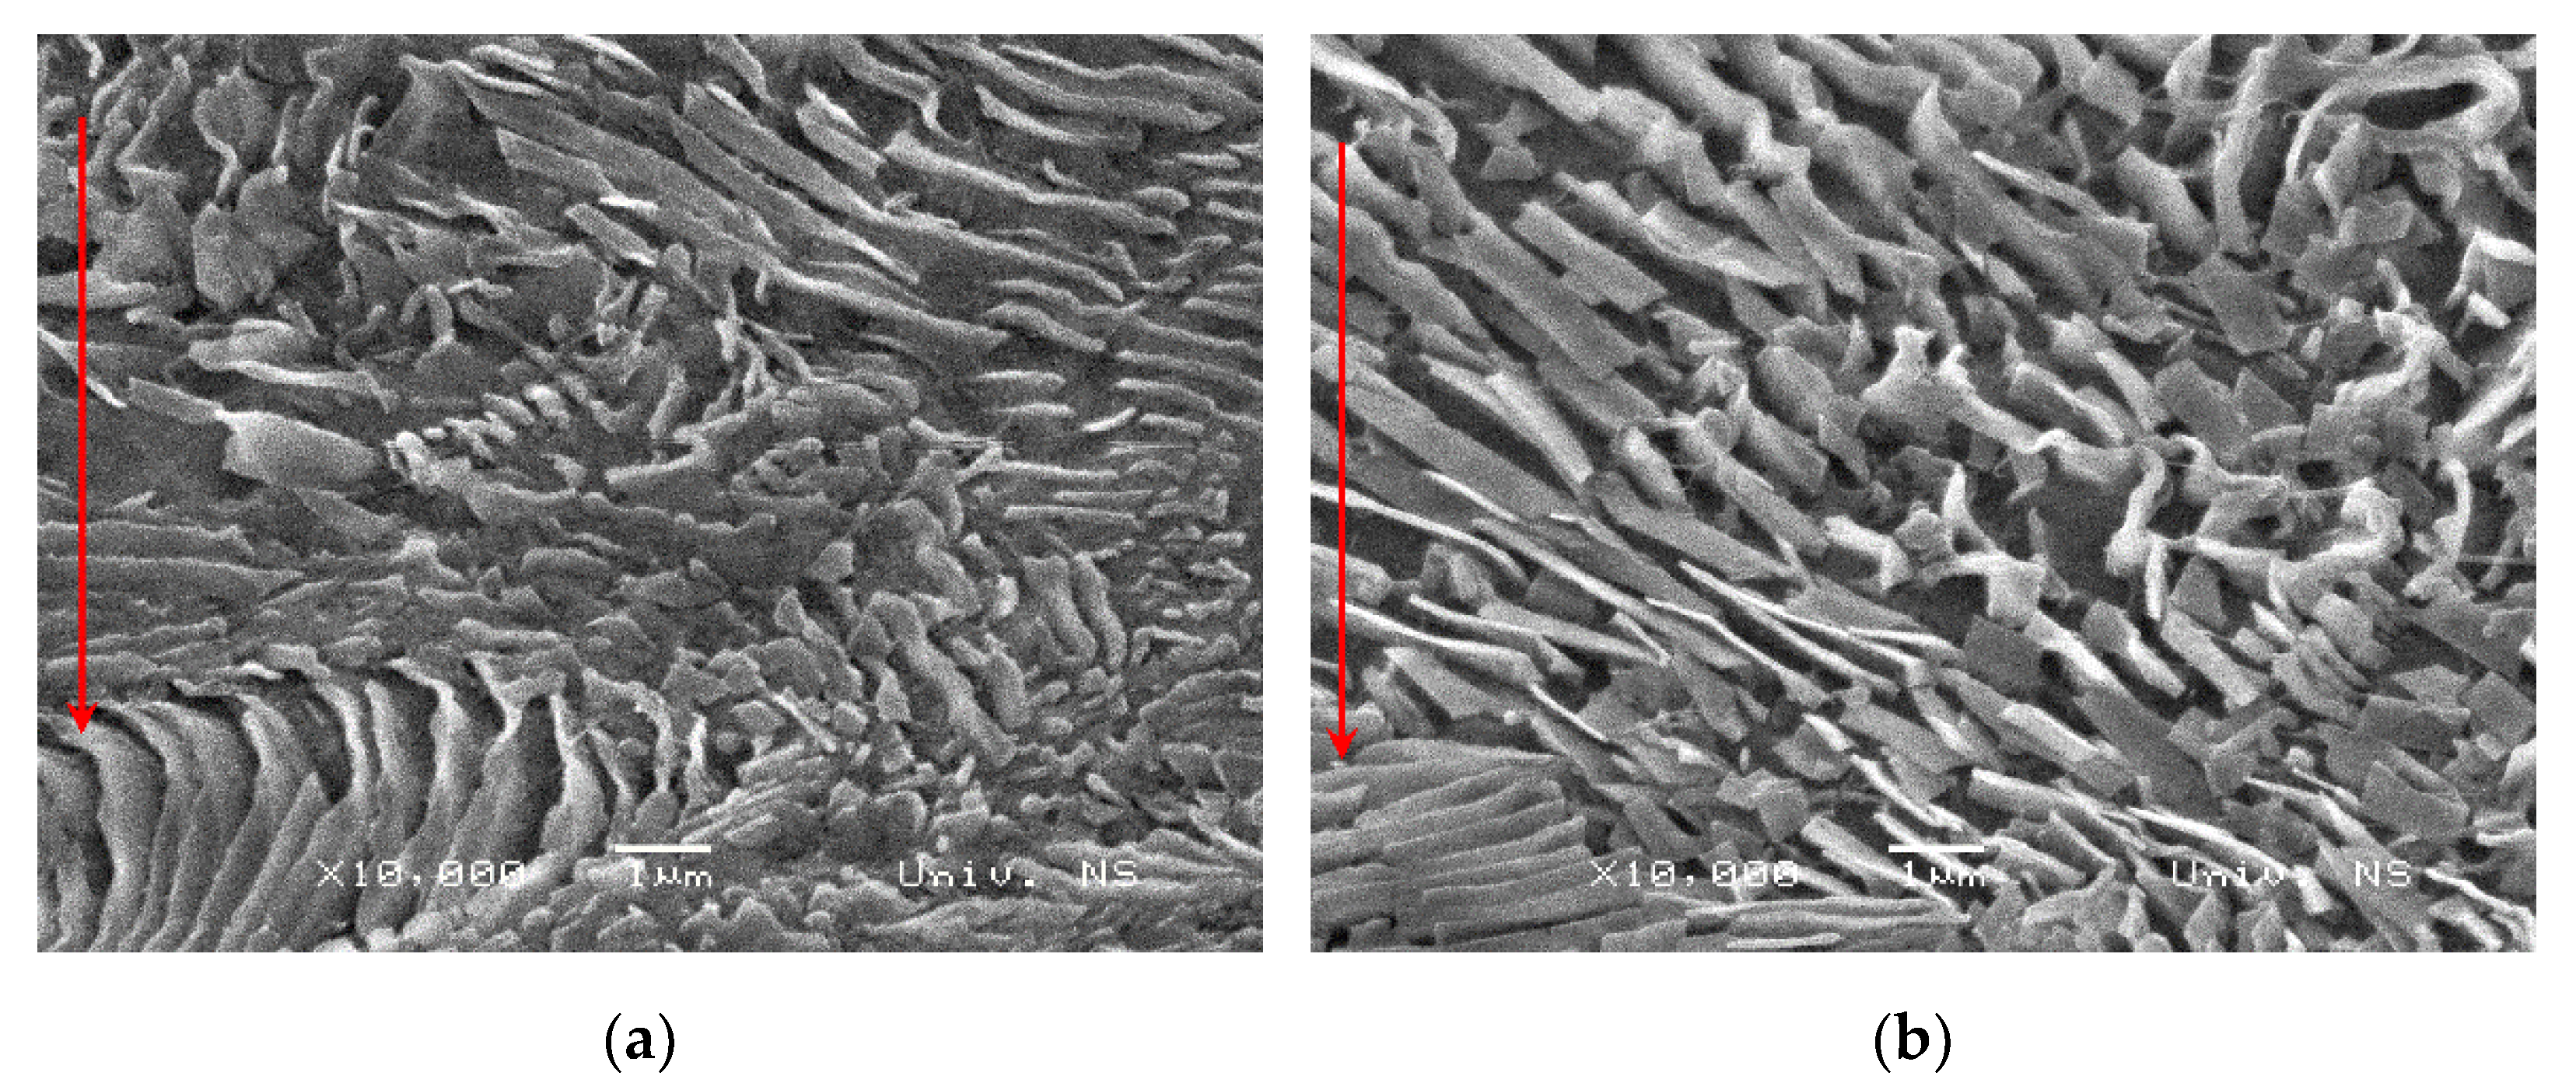
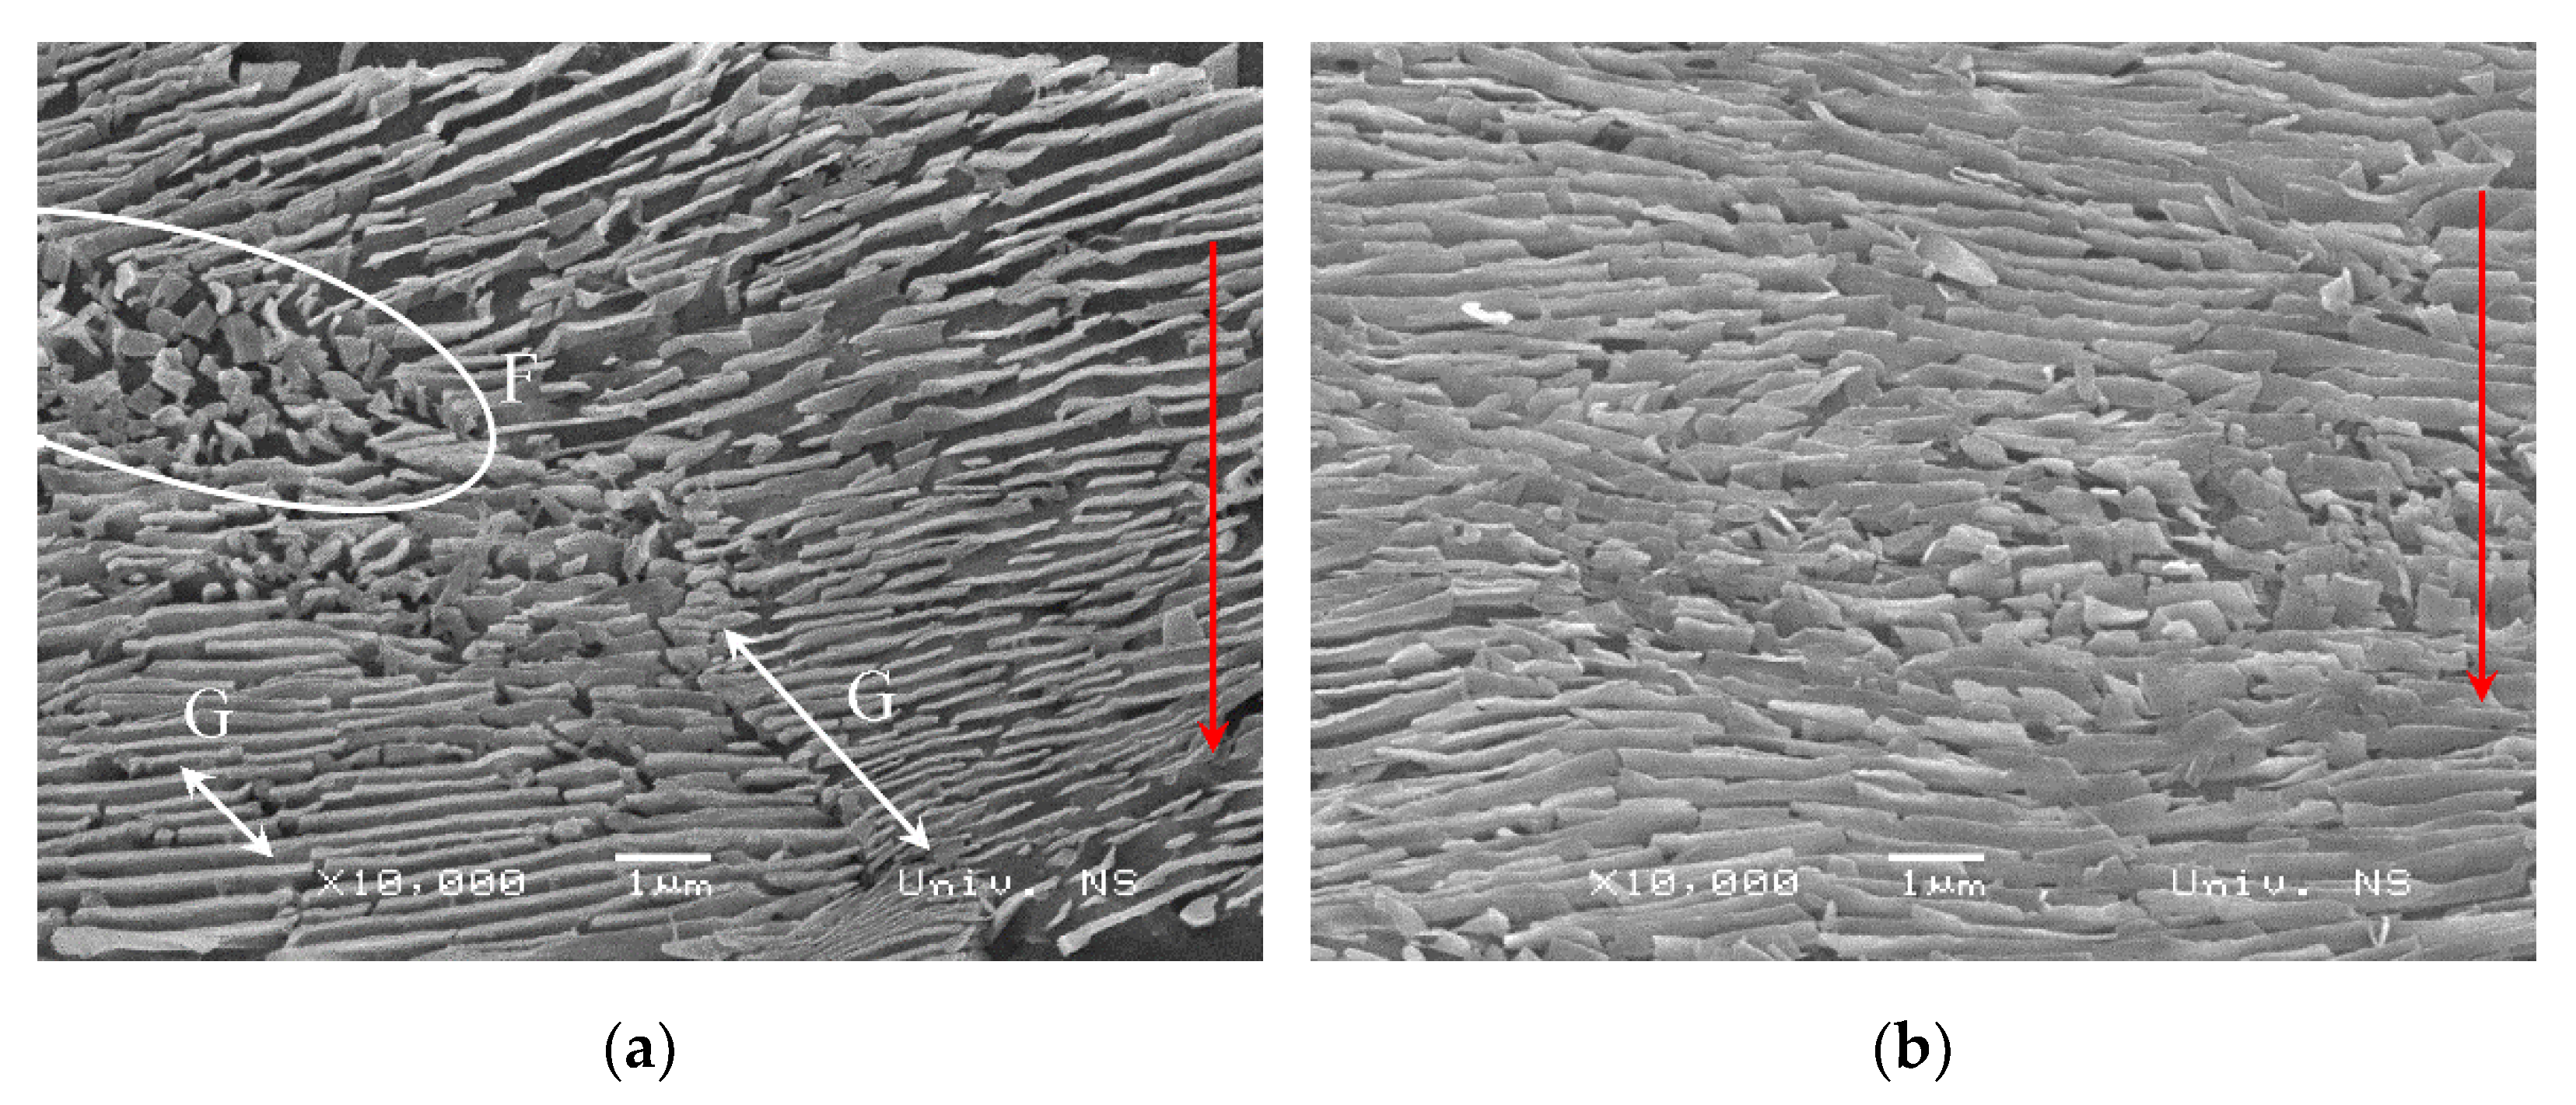
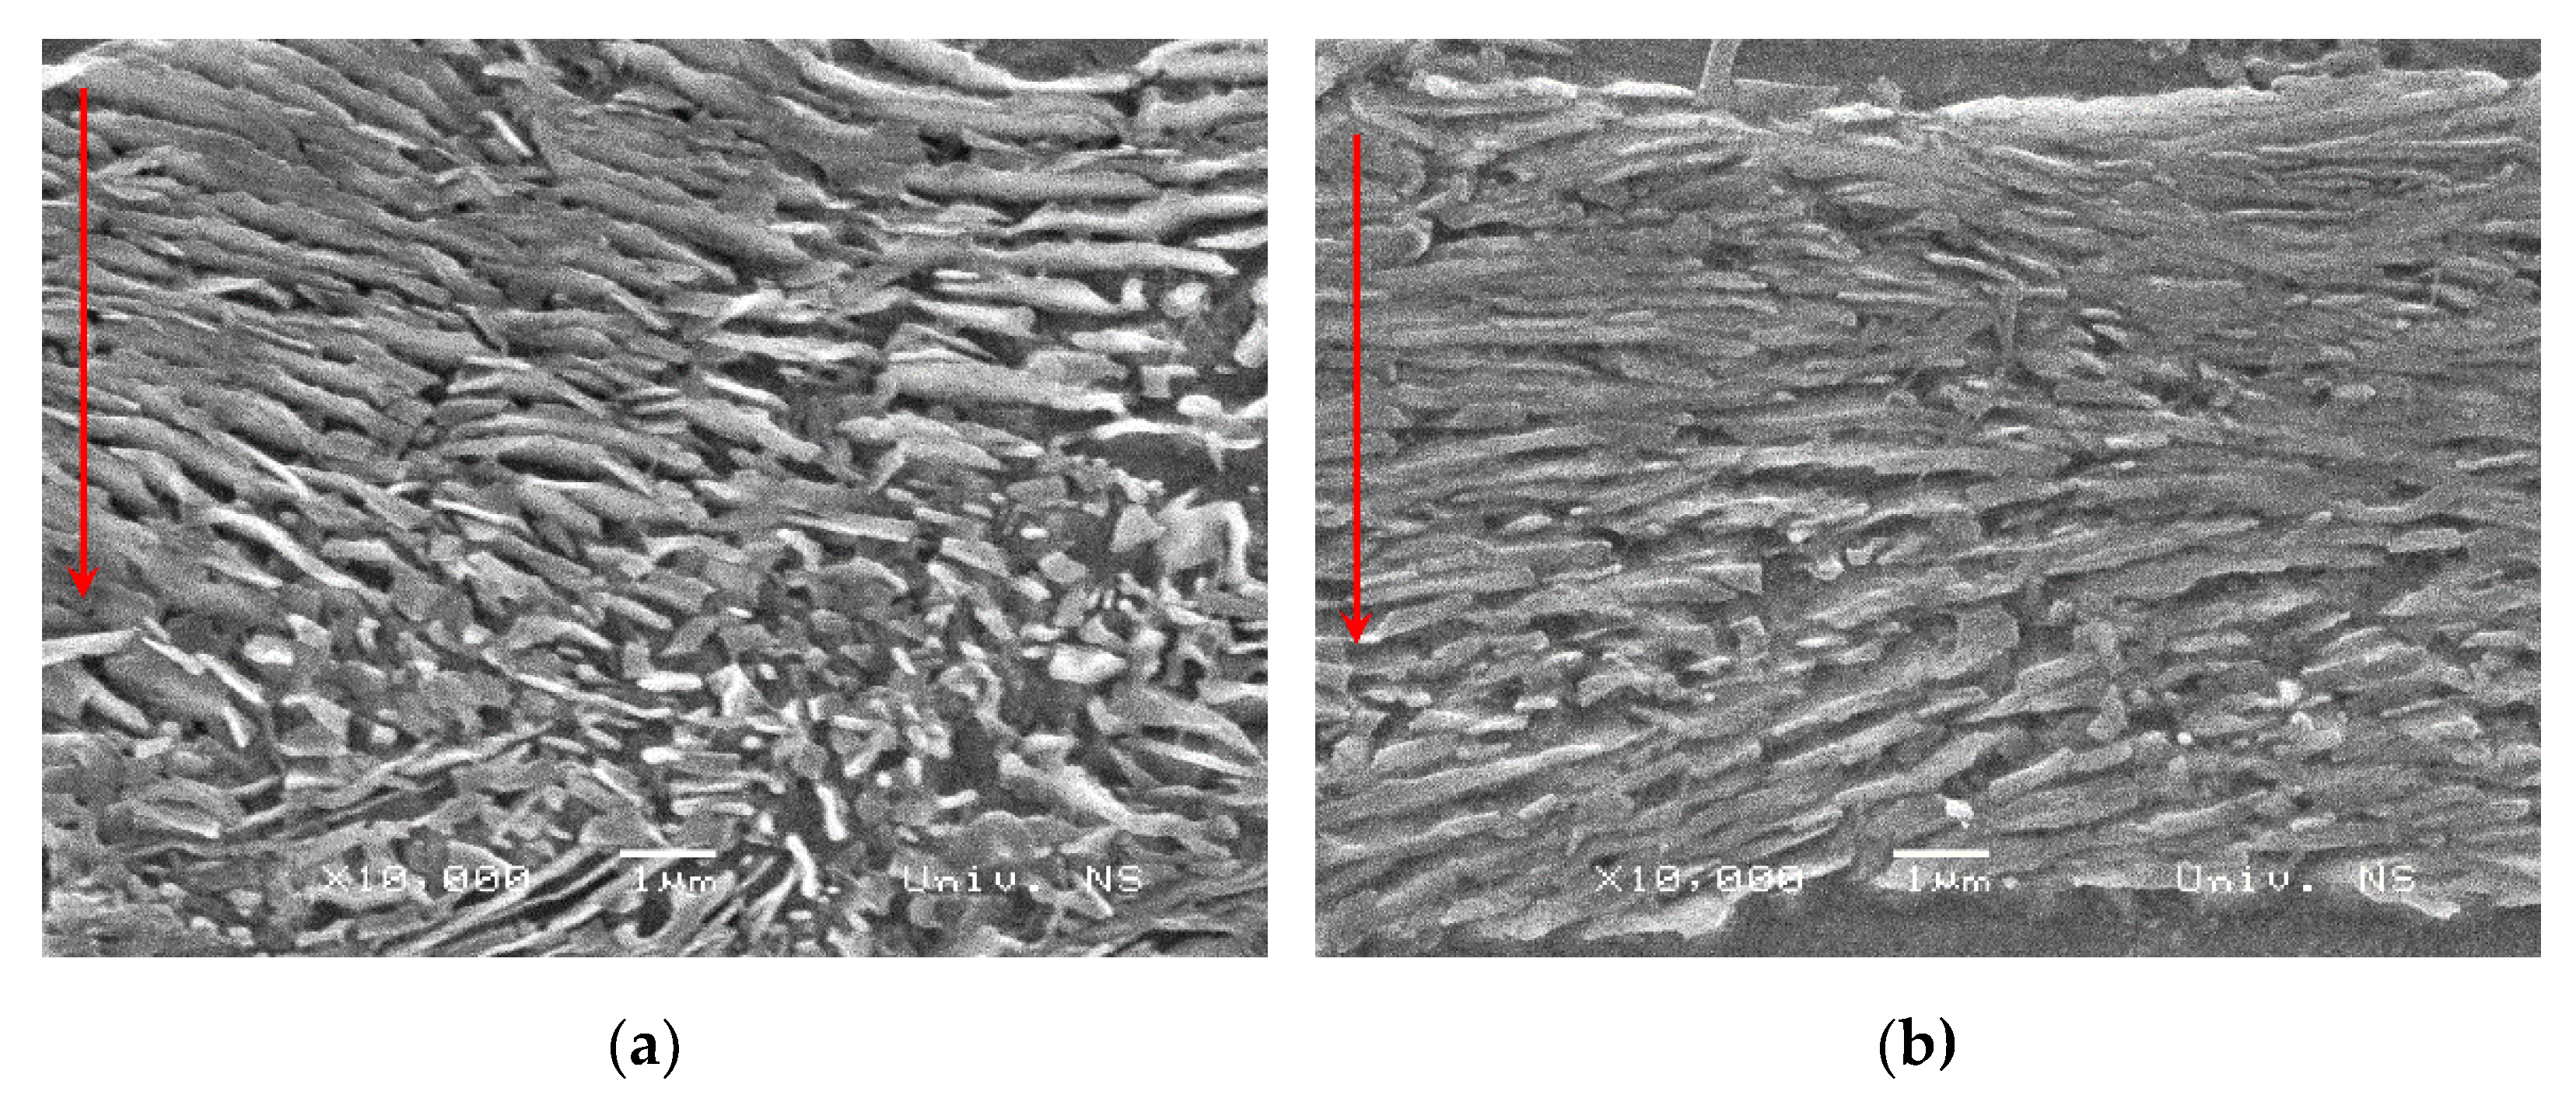
3.1. Overview of the Microstructures

The microstructure of the undeformed sample at different magnifications is shown in Figure 3 and Figure 4. It consists of ferrite grains (40%) and lamellar pearlite colonies (60%), according to ASTM E562. In addition, a small quantity of non-metallic inclusions (elongated and spheroidal) can be observed in the metal base (Figure 4). The size of the ferrite grains was size 8 (according to ASTM E112), which corresponds to a mean size of 22 µm, and the corresponding size for the pearlite colony was 6, which is equivalent to a mean size of 44 µm. The microstructure for the undeformed sample in Figure 4b shows the cementite lamellae with an arbitrary orientation with respect to the longitudinal axis of the sample (direction of the arrow). It should be noted that this axis also coincides with the compression direction (for all the SEM images shown in this paper the vertical axis is parallel to the load direction).
Figure 5 shows the morphological changes of the microconstituents that were identified on the longitudinal cross section of the samples deformed to different strain levels. It can be seen that during the upsetting process, a fiber texture was gradually formed, and horizontal elongation in the radial direction (perpendicular to the compression direction) was noticeable even for the sample strained to εz1 = 0.38. As expected, the changes in the microstructure are most noticeable after the final phase of deformation (εz4 = 1.59), when effective deformation, from the point of view of workability, reaches the limiting value. The ferrite grains were particularly heavily deformed (elongated), and some have been partly fragmented, mostly in the zone of shear instability (letter B in Figure 5d). It should be noted that critical damages of the microstructure were not observed at a magnification of 2000×, except at the inclusion/ferrite grain or inclusion/pearlite colony boundary surfaces, where even for low degrees of deformation (εz1 = 0.38) noticeable microcavities formed by the decohesion mechanism were present (letter A in Figure 5a). Therefore, further identification and quantification of the microcracks was performed at a magnification of 10,000×.

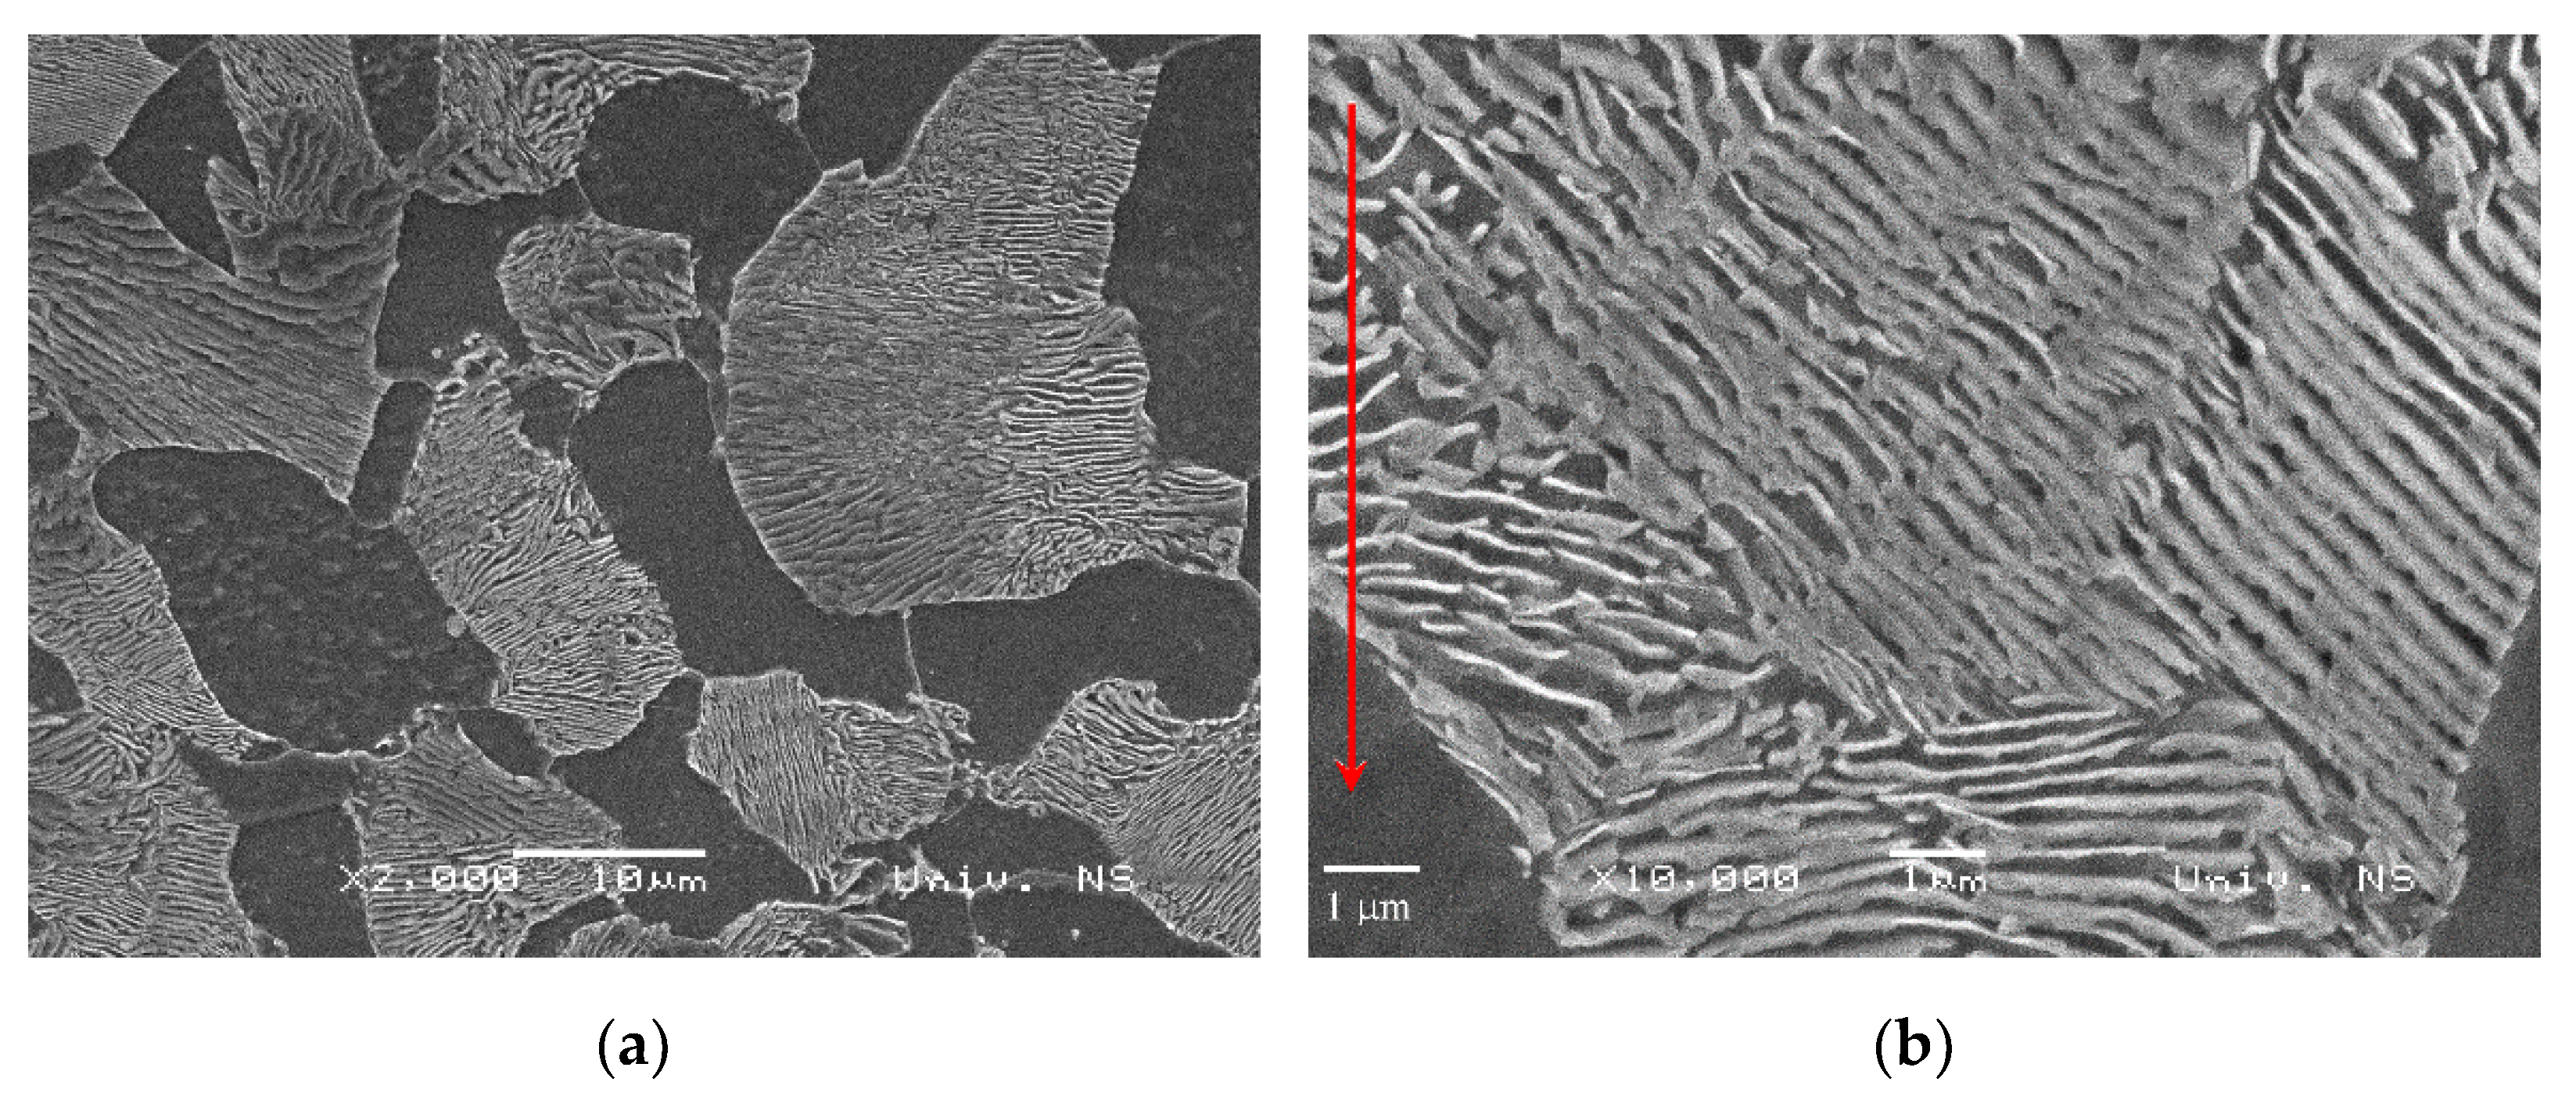
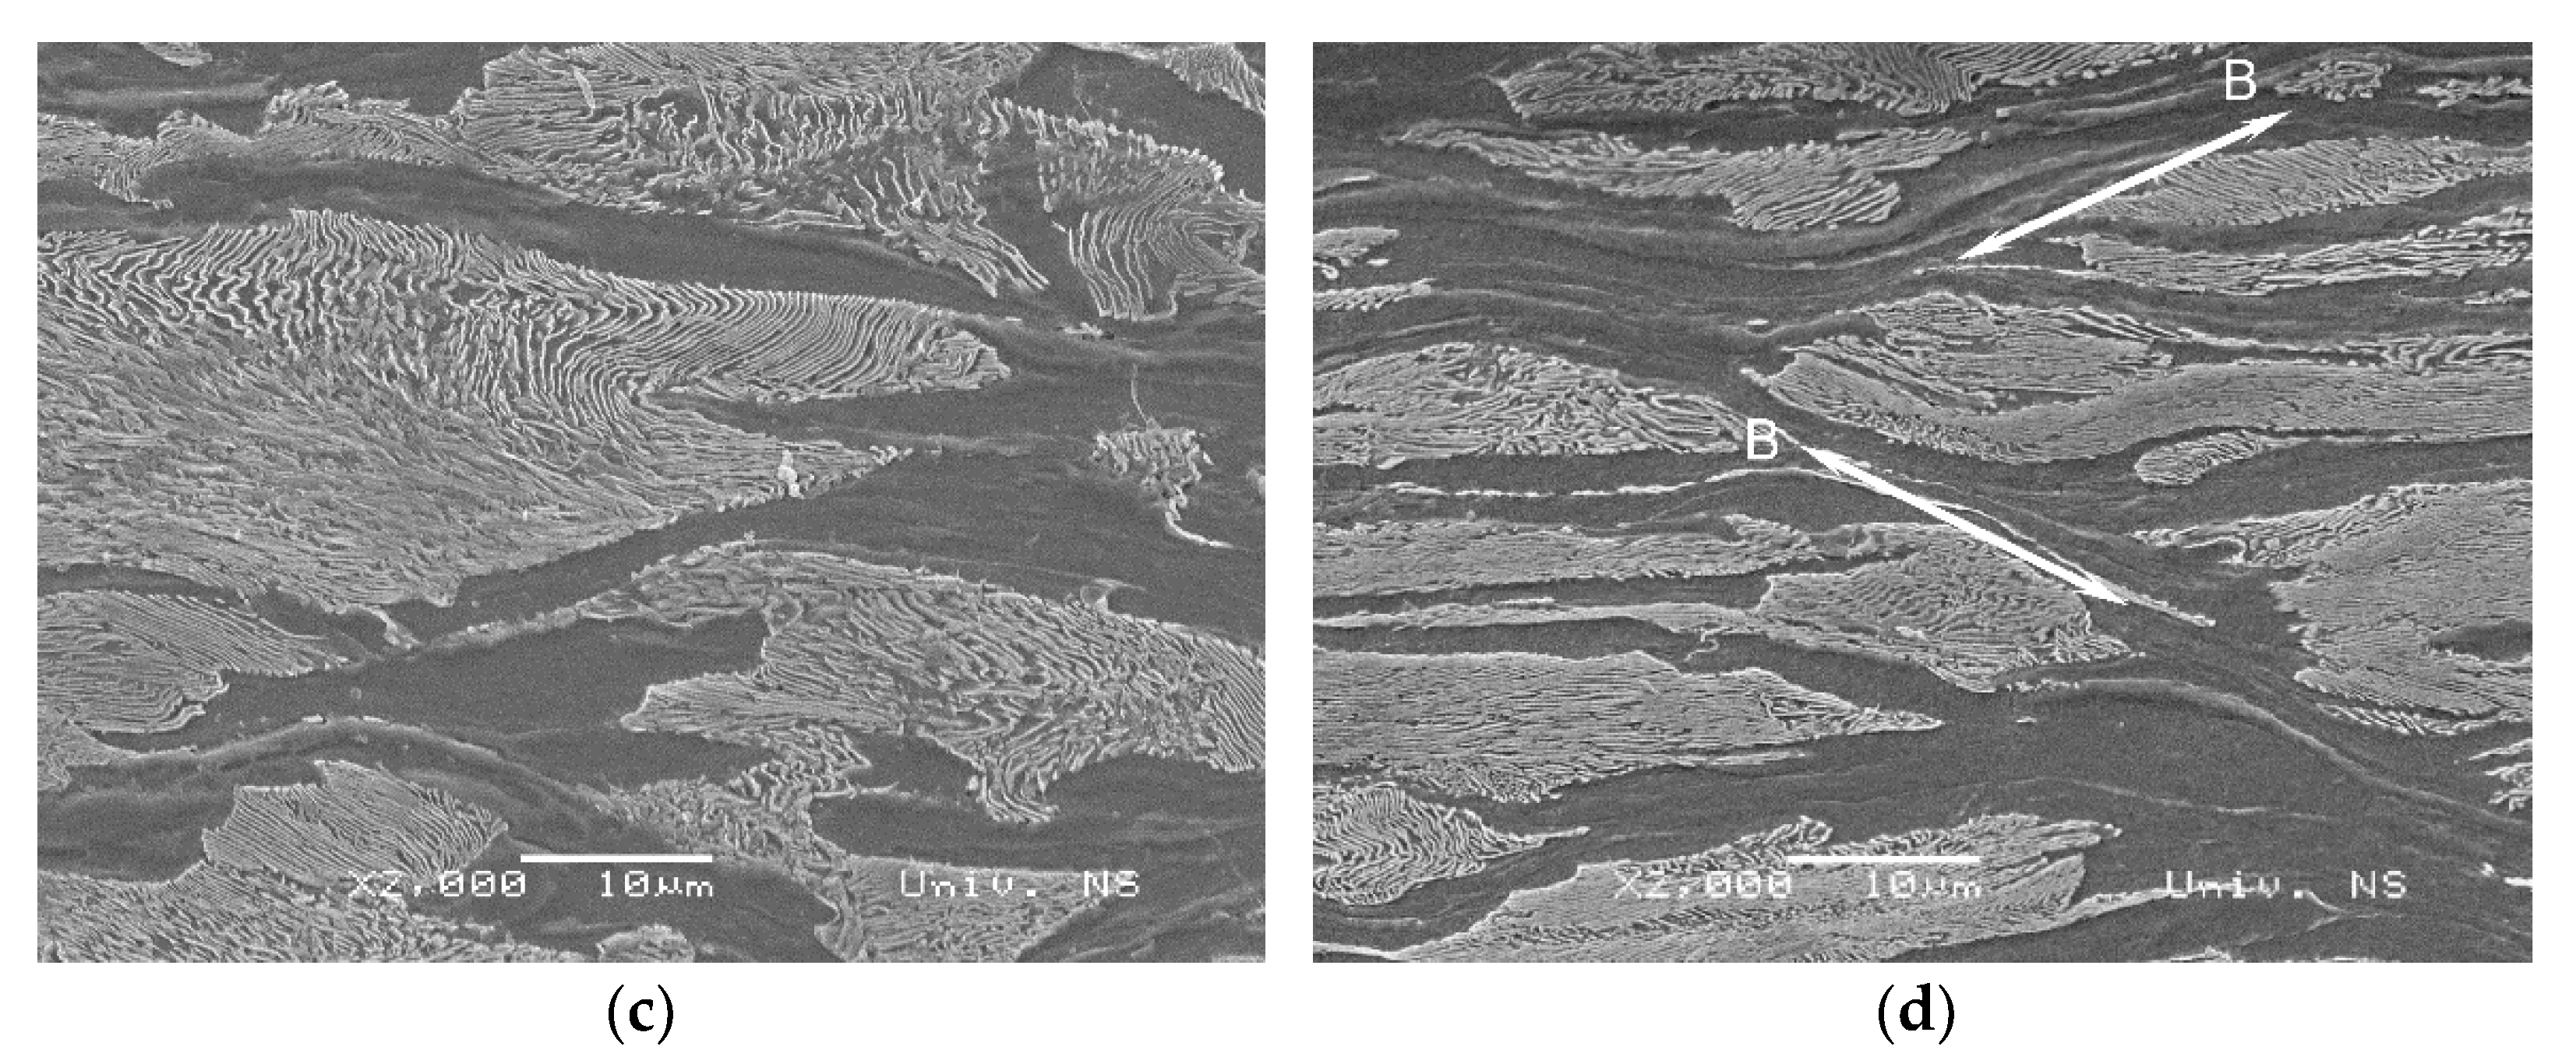
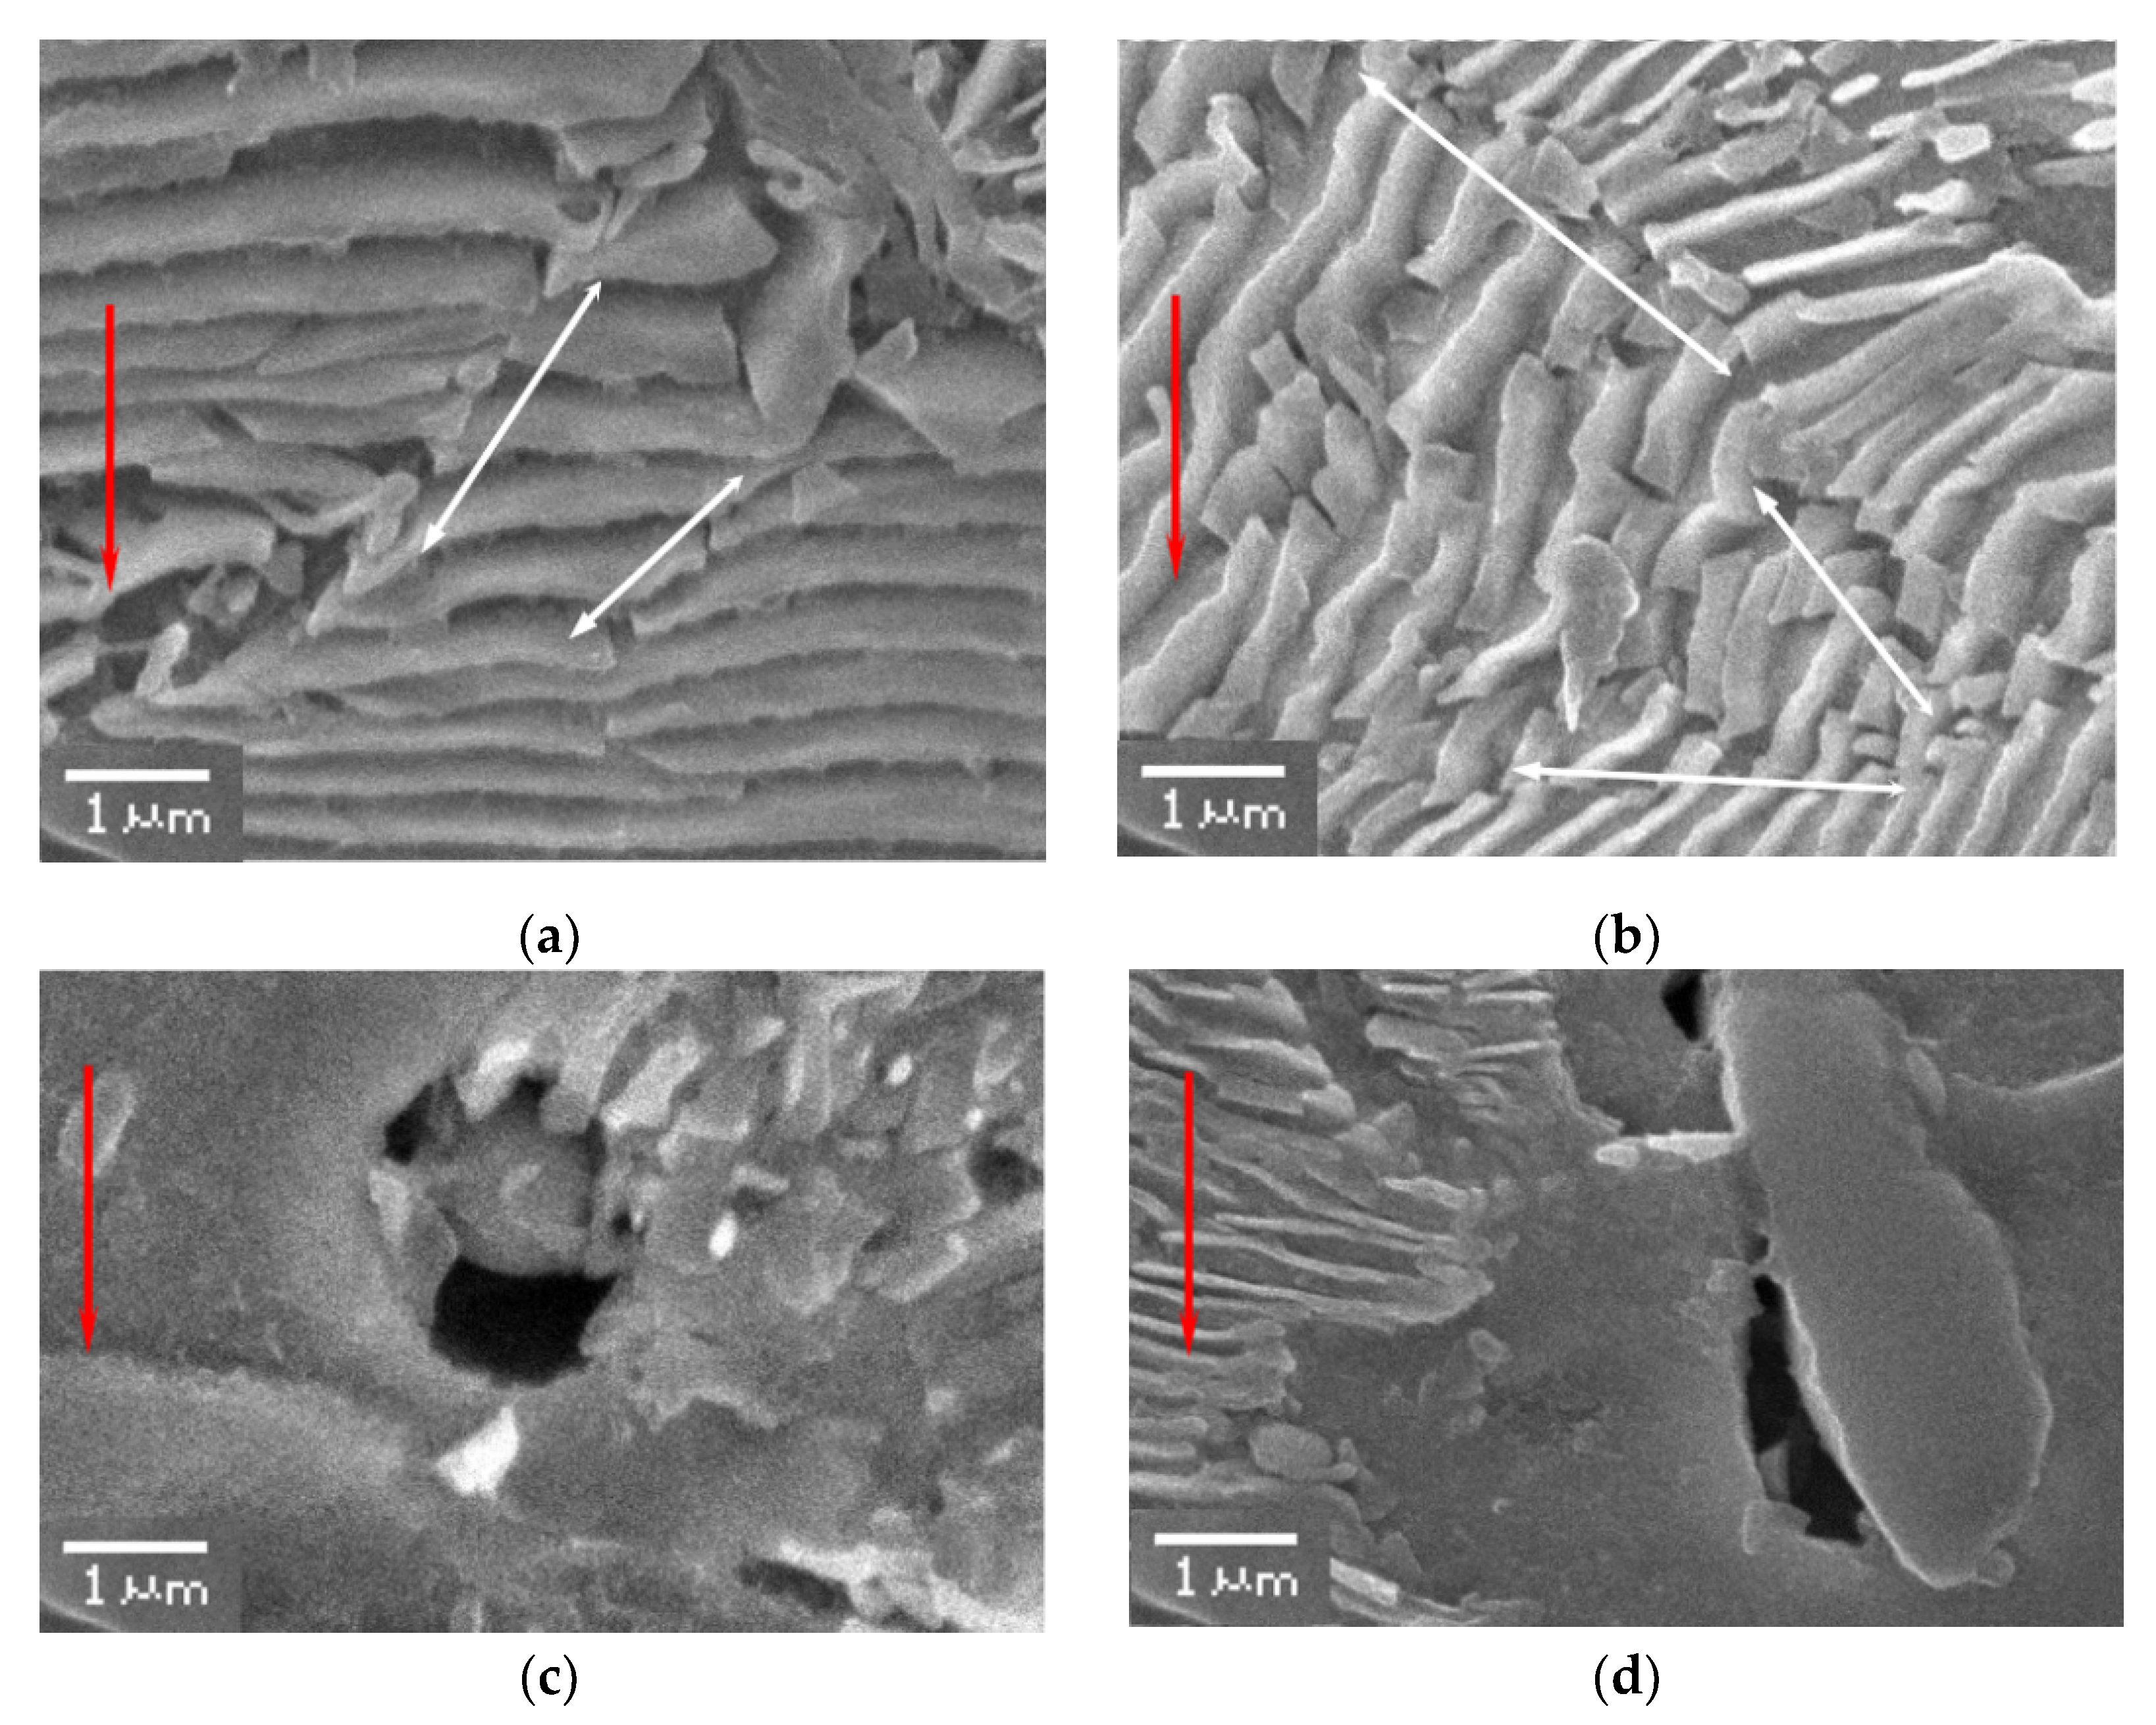
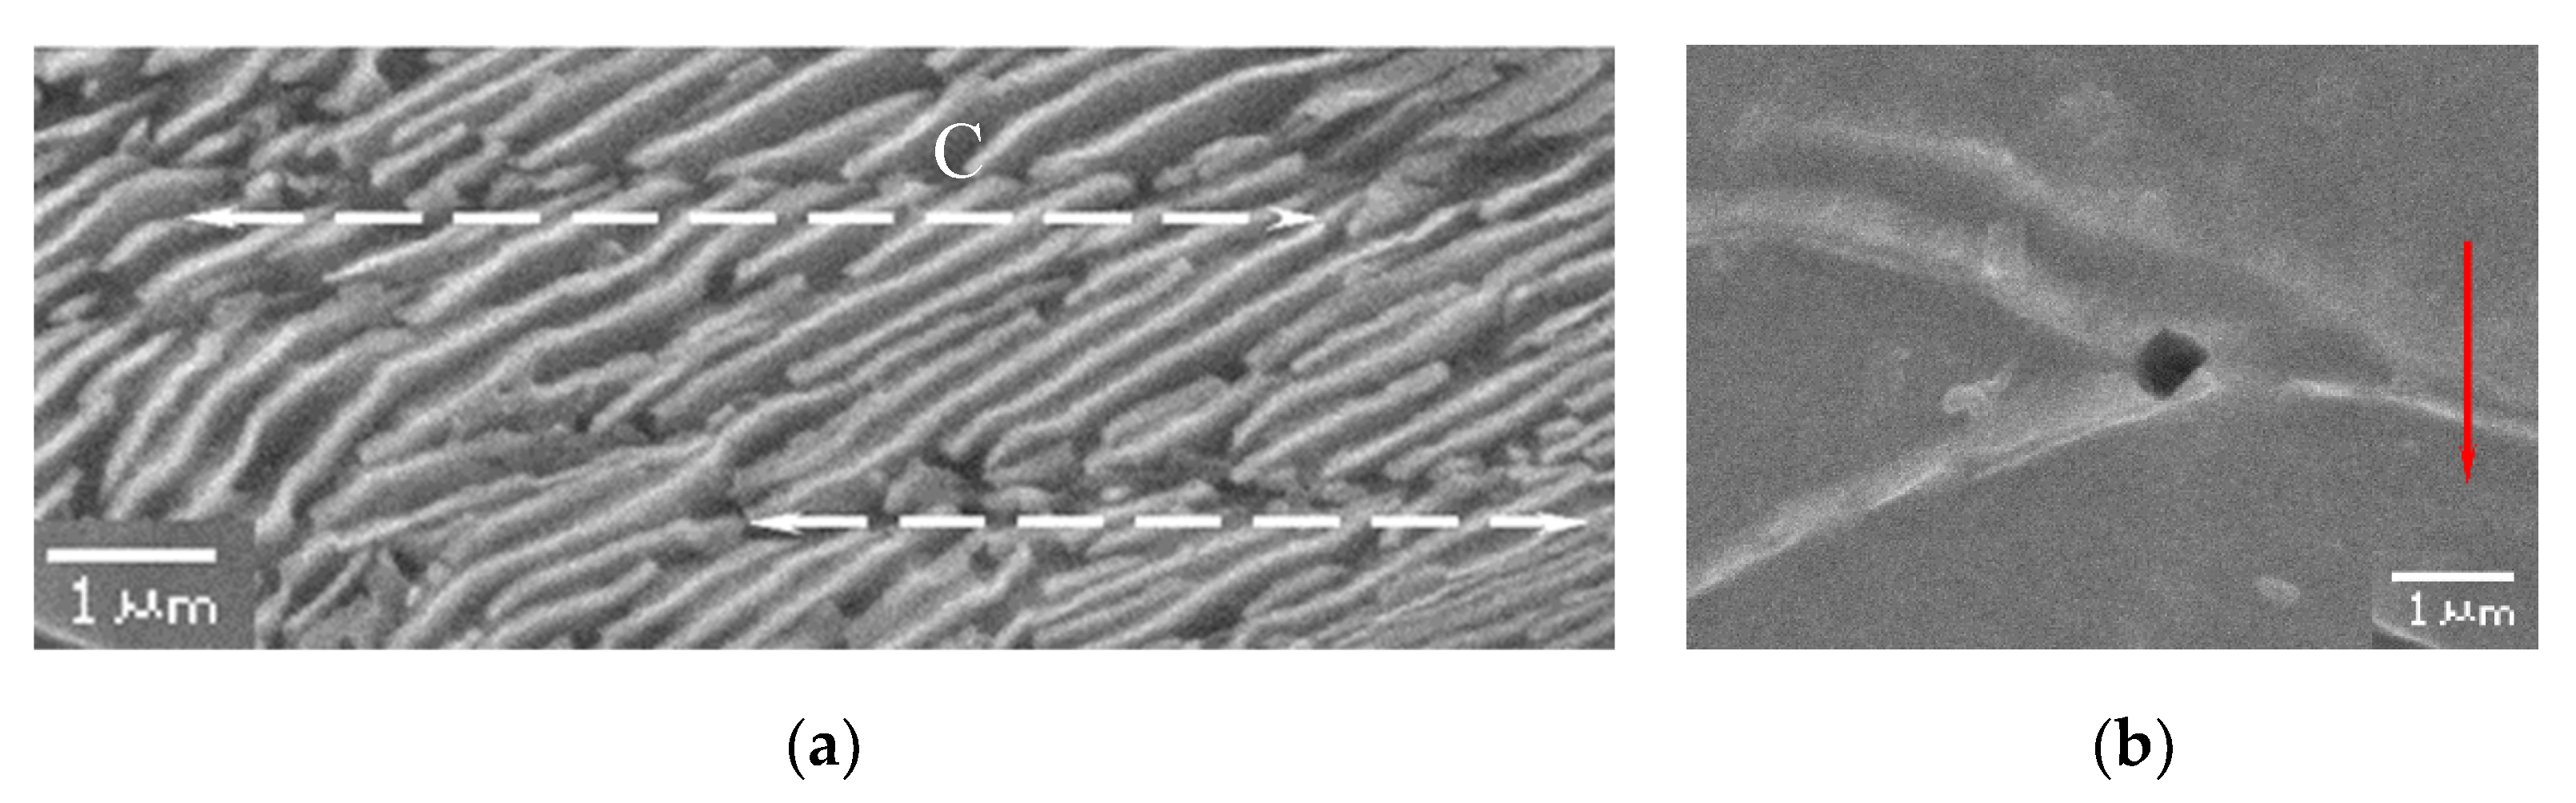
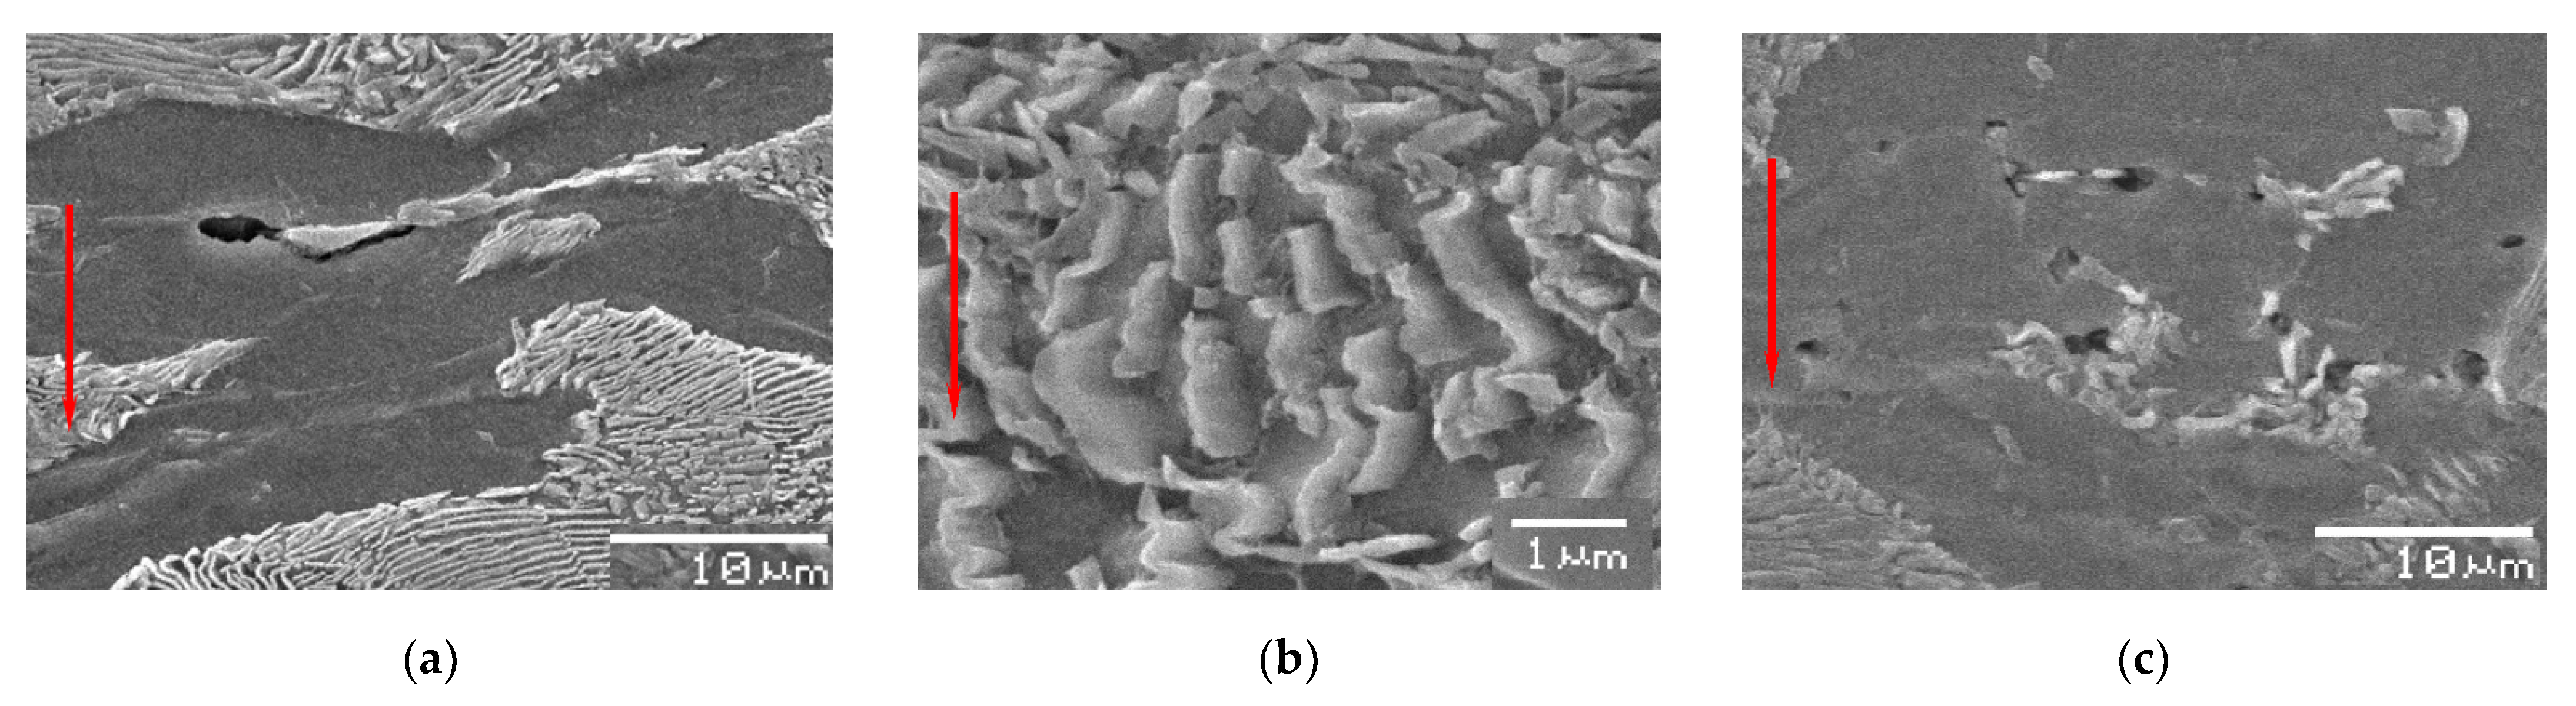
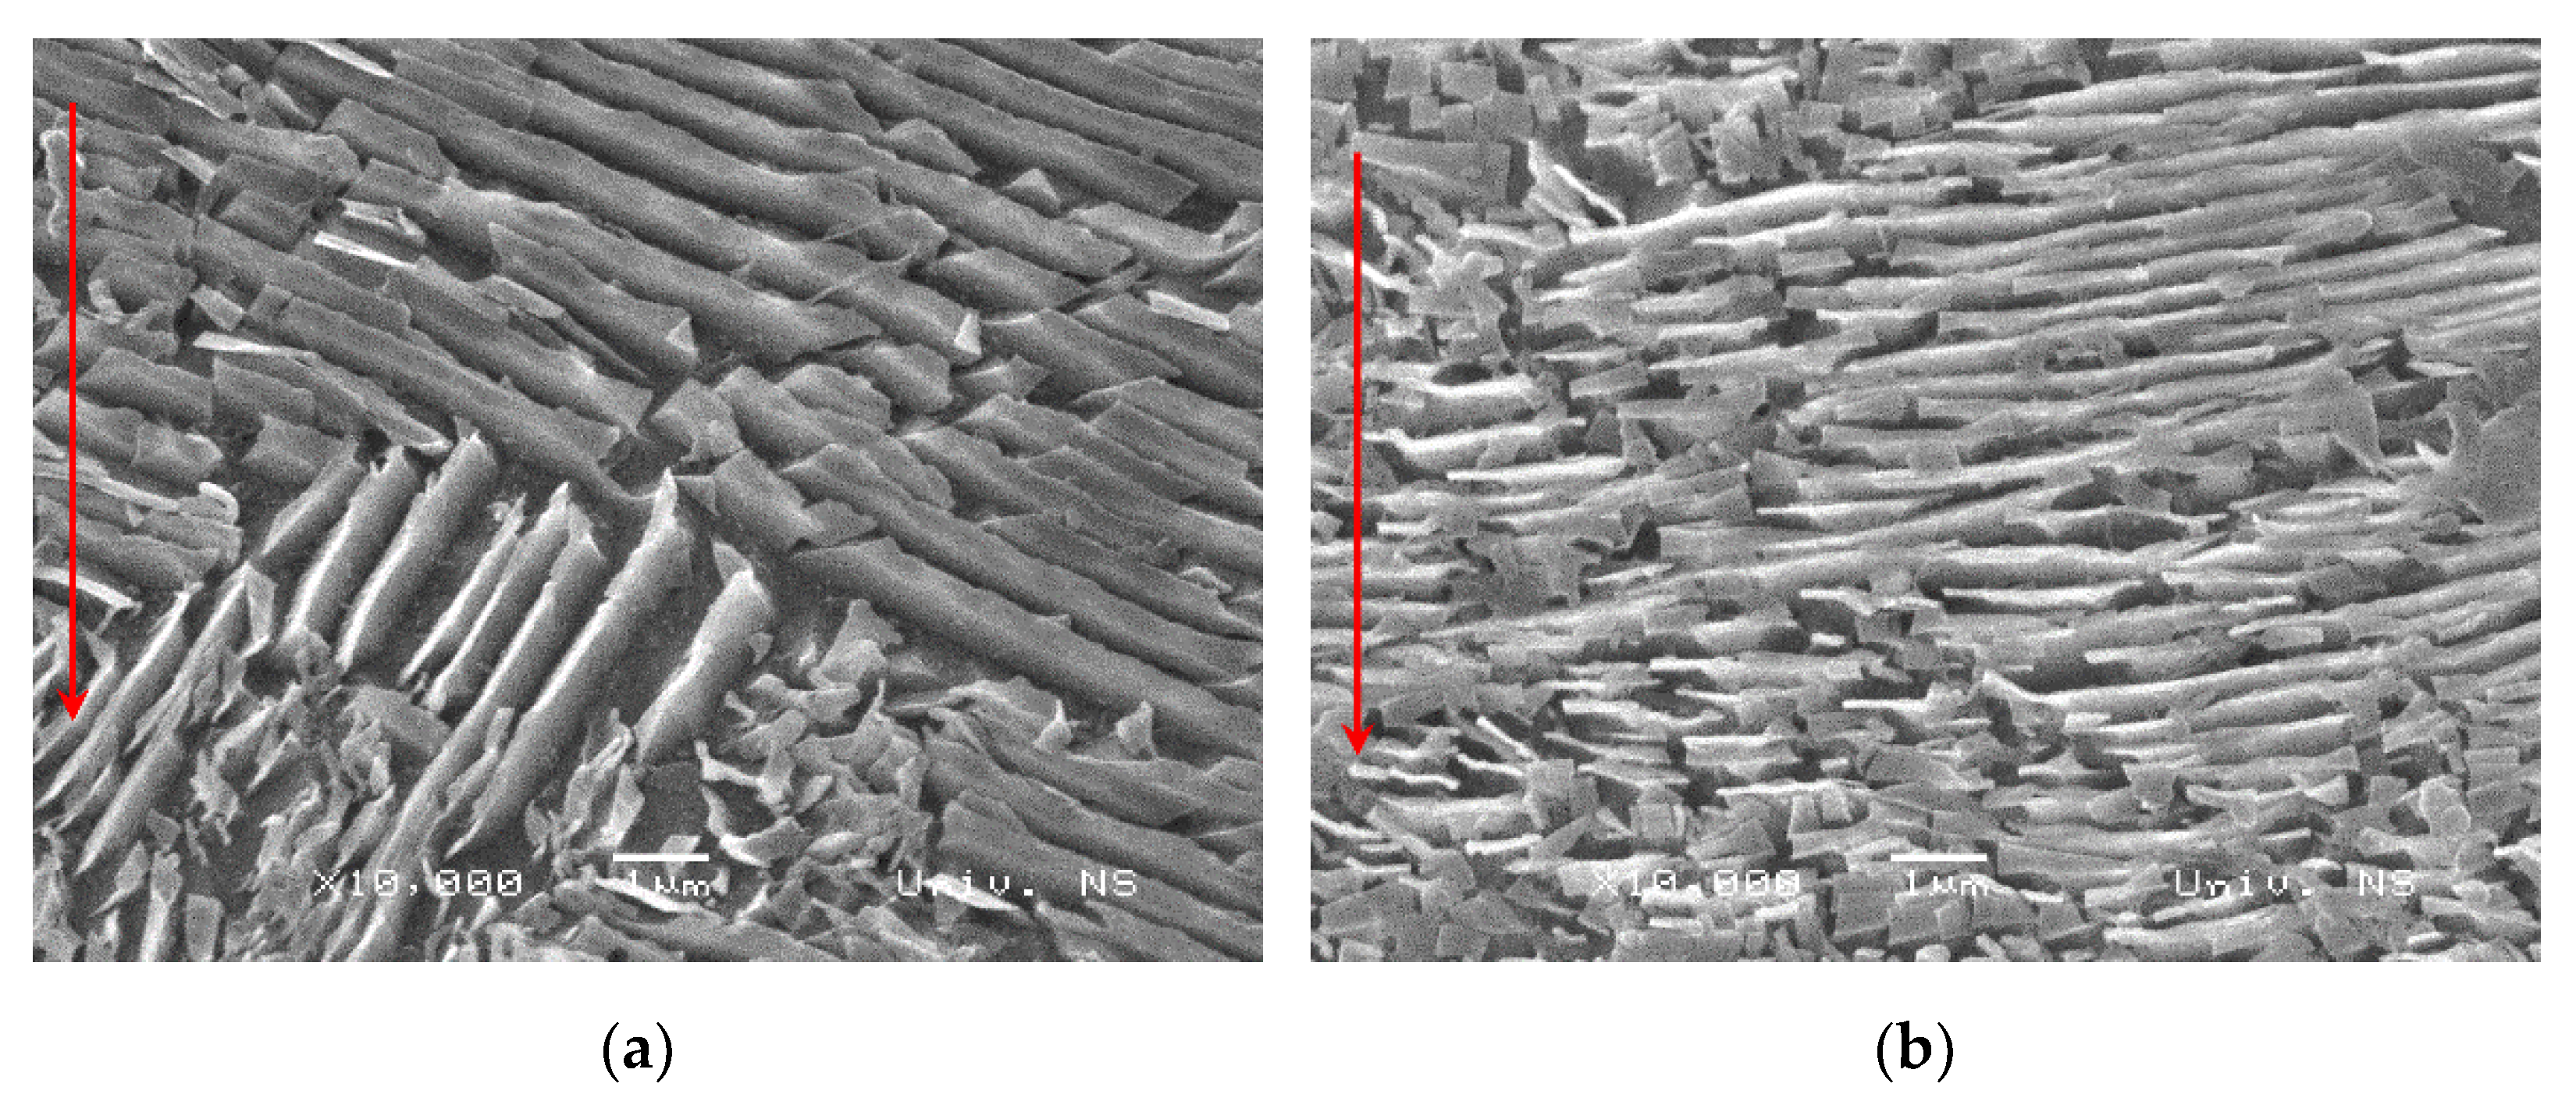
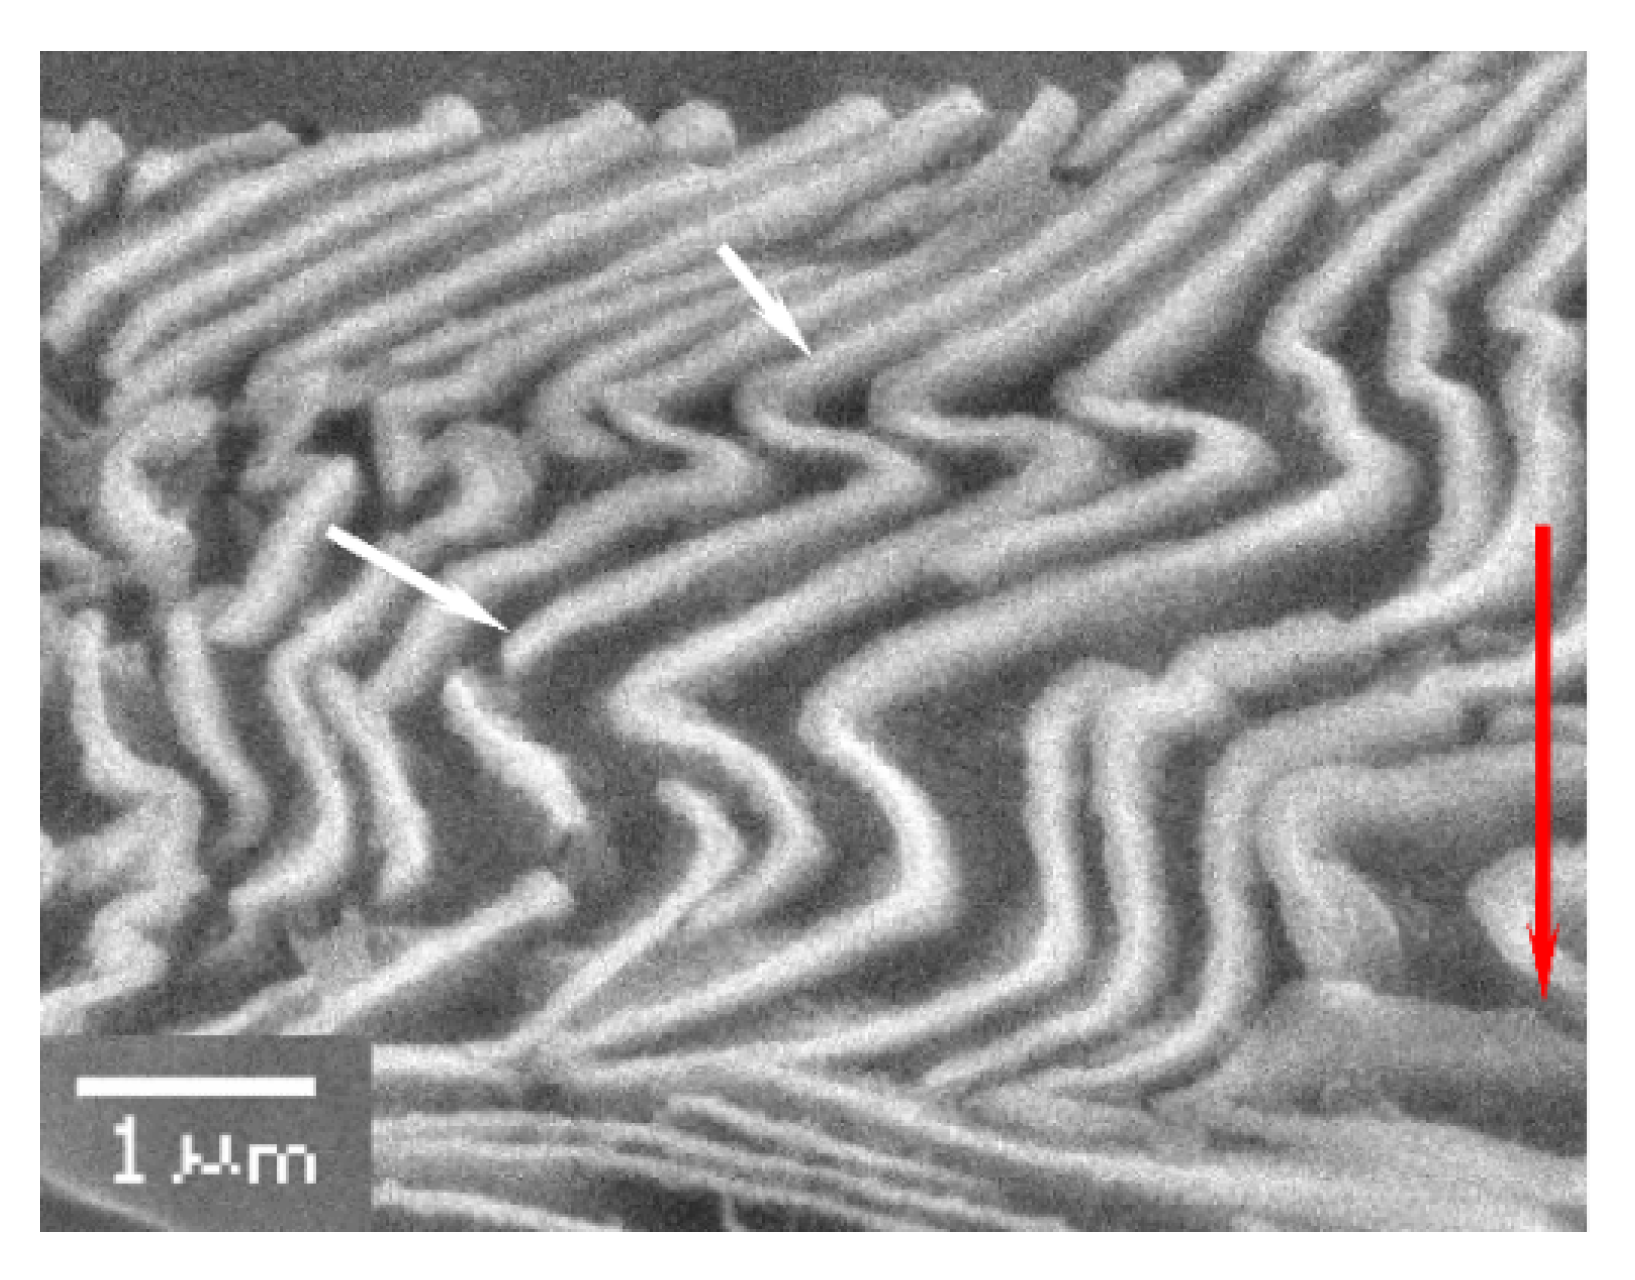
3.2. Mechanisms of Microstructural Damage

The SEM analysis of the undeformed specimen (as-received condition) indicated the presence of minor damages across the specimen volume resulting from previous manufacturing stages (Figure 6). In contrast, after the first forming stage (εz1 = 0.38), the microcracks, which were predominantly detected on the pearlite colonies, were clearly visible. Figure 7a,b shows the damages in the form of the fracture of cementite lamellae (white arrows in Figure 7a,b), occurring at different distances from the free surface of the sample. This further resulted in the nucleation of microcracks whose orientation and propagation direction coincided mostly with the direction of the maximum shear stresses (angle of 45 degrees relative to the compression direction). In addition, microvoid nucleation by the mechanism of interference decohesion was also observed (Figure 7c,d). Microvoids were generated at the non-metallic inclusion–ferrite interface due to incoherence, i.e., incompatibility of deformation between these phases (non-metallic particles are much less deformable compared to the soft ferrite base). The nucleation of microvoids for a spheroidal inclusion (diameter about 1.5 μm) and an elongated inclusion (length 5.5 μm and maximum thickness 1.5 μm) is shown in Figure 7c,d. It should be noted that no fracture of the inclusions was observed.
The process of nucleation and growth of microvoids due to the fracture of the cementite lamellae became more intense with an increase in external load and strain degree (εz1 = 0.38 → εz2 = 0.75). It can be seen from Figure 8a that the length of microcracks (marked with C in Figure 8) was almost doubled (maximum 7.5 μm) compared to the previous upsetting stage (εz1 = 0.38). In general, the microcracks propagated through the pearlite colonies at an angle of 45° relative to the cementite lamellae. As mentioned above, the microcracks of the soft ferrite base observed for the specimen strained to εz1 = 0.38 arose only from the process of decohesion at the ferrite–inclusion or ferrite–pearlite boundary surfaces, while other damage mechanisms (in the ferrite base) were not seen. However, in the case of the specimen deformed to εz2 = 0.75, the nucleation of microvoids also occurred at sites where three ferrite grains met, as shown in Figure 8b. Taking into account the fact that the microvoids formed in free ferrite by this mechanism were less than 1 μm, it can be deduced that a high degree of deformation is required for their growth and coalescence.
Further deformation of the sample to strain level εz3 = 1.10 was accompanied by a high accumulation of microcracks, which occurred due to the mechanism of decohesion at ferrite grain interfaces or due to the radial expansion of microvoids previously generated at ferrite/pearlite interfaces. Previously formed microvoids, regardless of the nucleation mechanism, propagated rapidly, and a fracture mechanism of microvoid coalescence was observed. As a result of the coalescence of microvoids, small linear cracks (microcracks) were formed. Figure 9a shows a microcrack developed along the ferrite–pearlite colony interface with a tendency to propagate further into the ferrite base. The density of the microcracks in pearlite colonies also increased. These damages were manifested in the form of multiple fractures of the cementite lamellae (Figure 9b), regardless of their original orientation. The fractured parts of the lamellae were about 1 μm. A representative SEM image showing the level of microstructure degradation for εz3 = 1.10 is shown in Figure 9c.
During the next (final) upsetting stage, a crack appeared on the outer surface of the sample at the strain εz4 = 1.59 (this value was adopted as the plastic-limit strain), which means that the microcavity reached a critical volume in terms of the material workability. At this level of deformation, the cementite lamellae were highly crushed (Figure 10a) and therefore, in some regions, were transformed into submicroscopic particles of size below 1 μm. The damages in the ferrite were most noticeable along the grain boundaries, due to the growth and coalescence of microcracks formed in the previous forming stages. In the final forming stage, the length of microcracks varied from several tens of μm inside the sample up to macroscopic proportions on the outer surface. Figure 10b shows a microcrack generated in the equatorial plane in the vicinity of the central line of the sample (Section II in Figure 2). It can be seen that the coalescence of microcavities was not completed at some parts of the ferrite grain boundaries (marked as D in Figure 10b). The intensive flow of material in the radial direction affected the increase in the density and size of microcracks. The level of microstructural damage at a distance of 4 mm from the free surface of the sample is shown in Figure 10c. The presence of a large number of microcracks was observed, mostly propagating along the boundaries of the ferrite grains. Their average length was about 25 μm (maximum identified value was 40 μm), which is significantly larger than the length of the microcracks located in the central area of the sample and considerably larger than the microcracks from previous forming stages.
The effect of the coalescence of microcavities was most visible in the region close to the outer surface of the sample, as expected. Figure 11 shows the coalescence of two large microcracks (marked as E) at a distance of 1.5 mm from the free surface, propagating normally to the upsetting direction. This led to the formation of a central crack of macroscopic size at the free surface of the sample (Figure 12).

3.3. Quantification of Microcracks in Pearlite Colonies

Based on the test plan (Figure 2), an average of 40 different locations were analyzed for each degree of deformation in order to quantify the microcracks in lamellar pearlite colonies. For this purpose, JMicroVision v1.27 software (Figure 13) was employed. In Table 3, the average densities of microcracks in pearlite (Np/100 µm2) colonies are given for different degrees of deformation εz, while Figure 14 shows their distribution in the central zone (Zone S—the zone around point S in Figure 2) and Zone I.
The results of microstructure testing show that during the process of cold upsetting of the cylinder, the level of accumulated damage increased continuously. The mean number of identified microcracks in the examined area of the equatorial plane of the sample, which refers to the reference surface of pearlite colonies of 100 μm2, had a minimum value of 7 for the undeformed microstructure (εz0 = 0), while a maximum value of 144 was reached after the final upsetting stage (εz4 = 1.59). This result is in accordance with previous findings [2,3], as ductile damage accumulation rate depends directly on the strain level. It is also evident from Table 3 that the microcracks were not evenly distributed along the equatorial plane of the sample for a given degree of deformation.
If the data for Zone I, which was nearest to the free surface, are compared with the data for areas close to the center line of the specimen (Zone IV and Zone S), different trends in the distribution of microcracks are observed. For the lowest degree of deformation (εz1 = 0.38), the number of microcracks increased from a minimum of 35 (detected in Zone I) up to a maximum of 60 in the central Zone S. The uneven distribution of damages in pearlite colonies can be seen in Figure 15, where the microstructures of Zones I and IV after the first deformation step (εz1 = 0.38) are shown. However, if the microstructures of the same zones after the second deformation step z2 = 0.75) are analyzed, no significant differences in terms of the level of accumulated damages can be seen (Figure 16). In other words, the distribution of damages is more uniform, but slightly higher values can still be identified in the zones closer to the workpiece axis (Zones III, IV and A (see Table 3)).
With a further increase in strain (εz3 = 1.10), there was a change in the trend of the microstructural damage evolution and distribution. This can be seen in Figure 17. In Zone I (Figure 17a), the microcracks in the form of multiple fractures of cementite lamellae (area marked F) and the microcracks (marked G) are very noticeable. On the other hand, in Zone IV (Figure 17b), the damages generated due to the fracture of cementite lamellae are also present but the coalescence of the microcavities is not clearly visible, i.e., the level of accumulated damage is lower compared to Zone I. A similar distribution of microcracks can be detected for Zones I and IV at the limiting strain of εz4 = 1.59 (Figure 18).

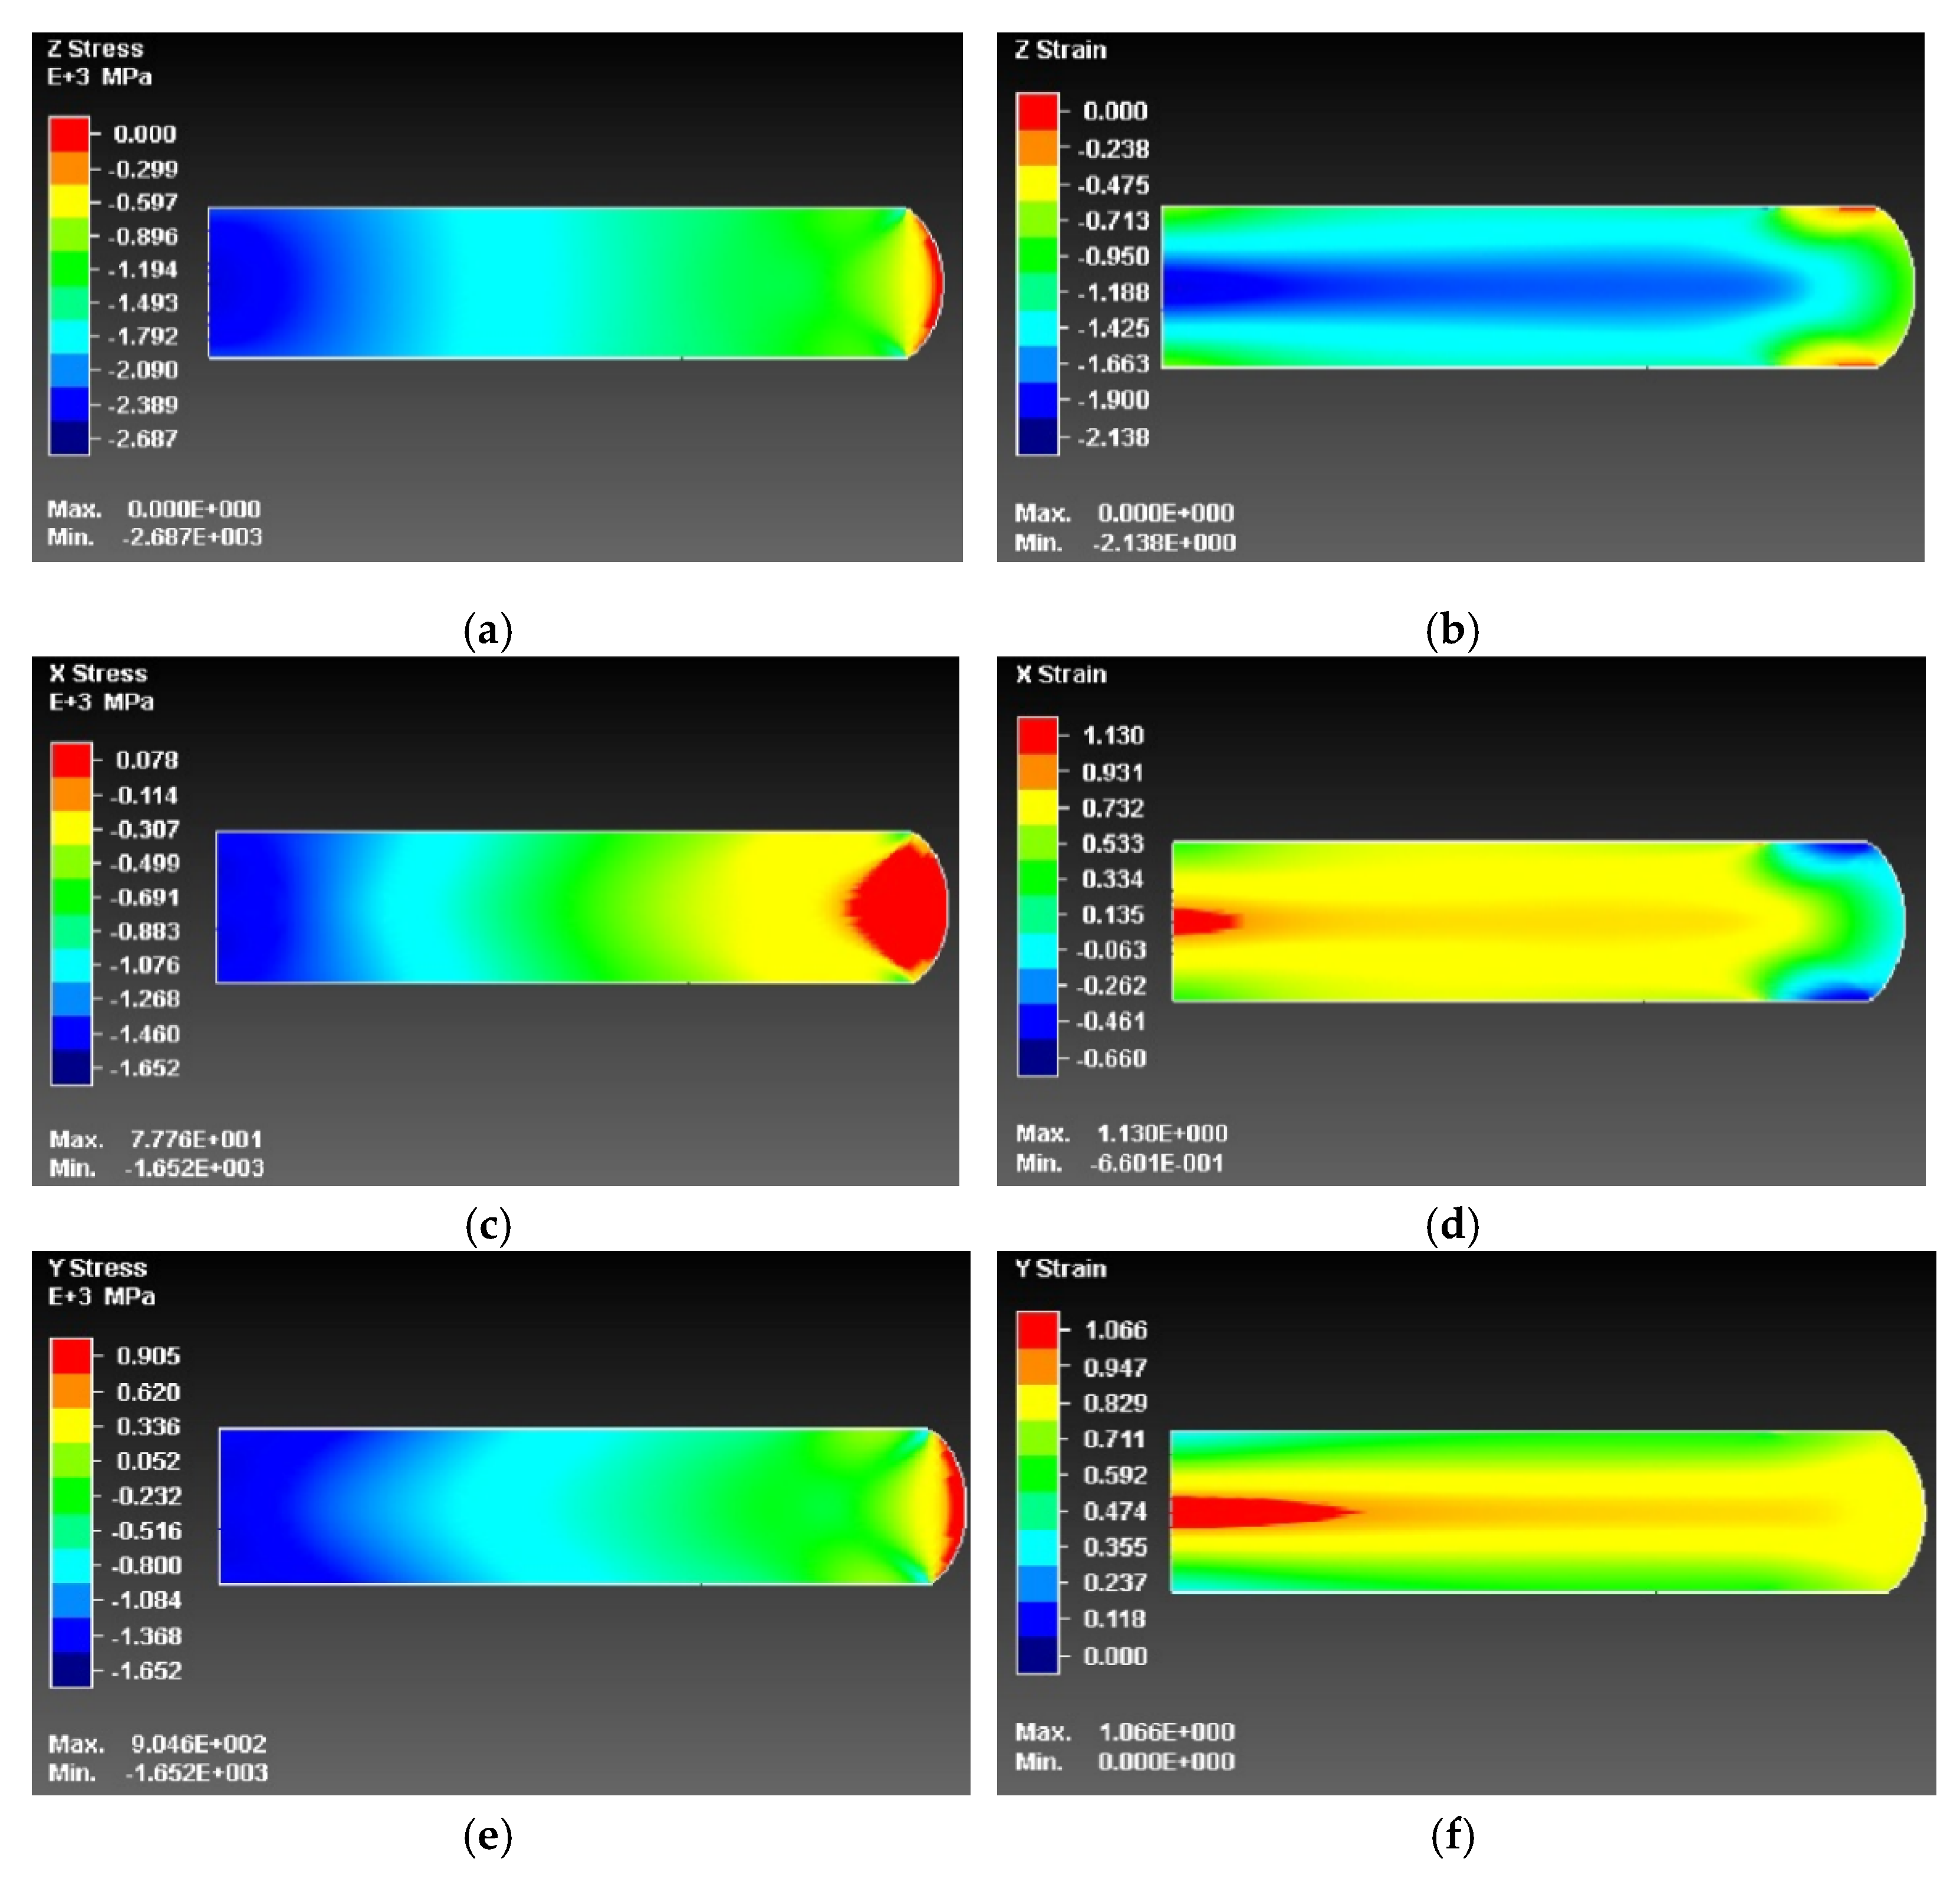
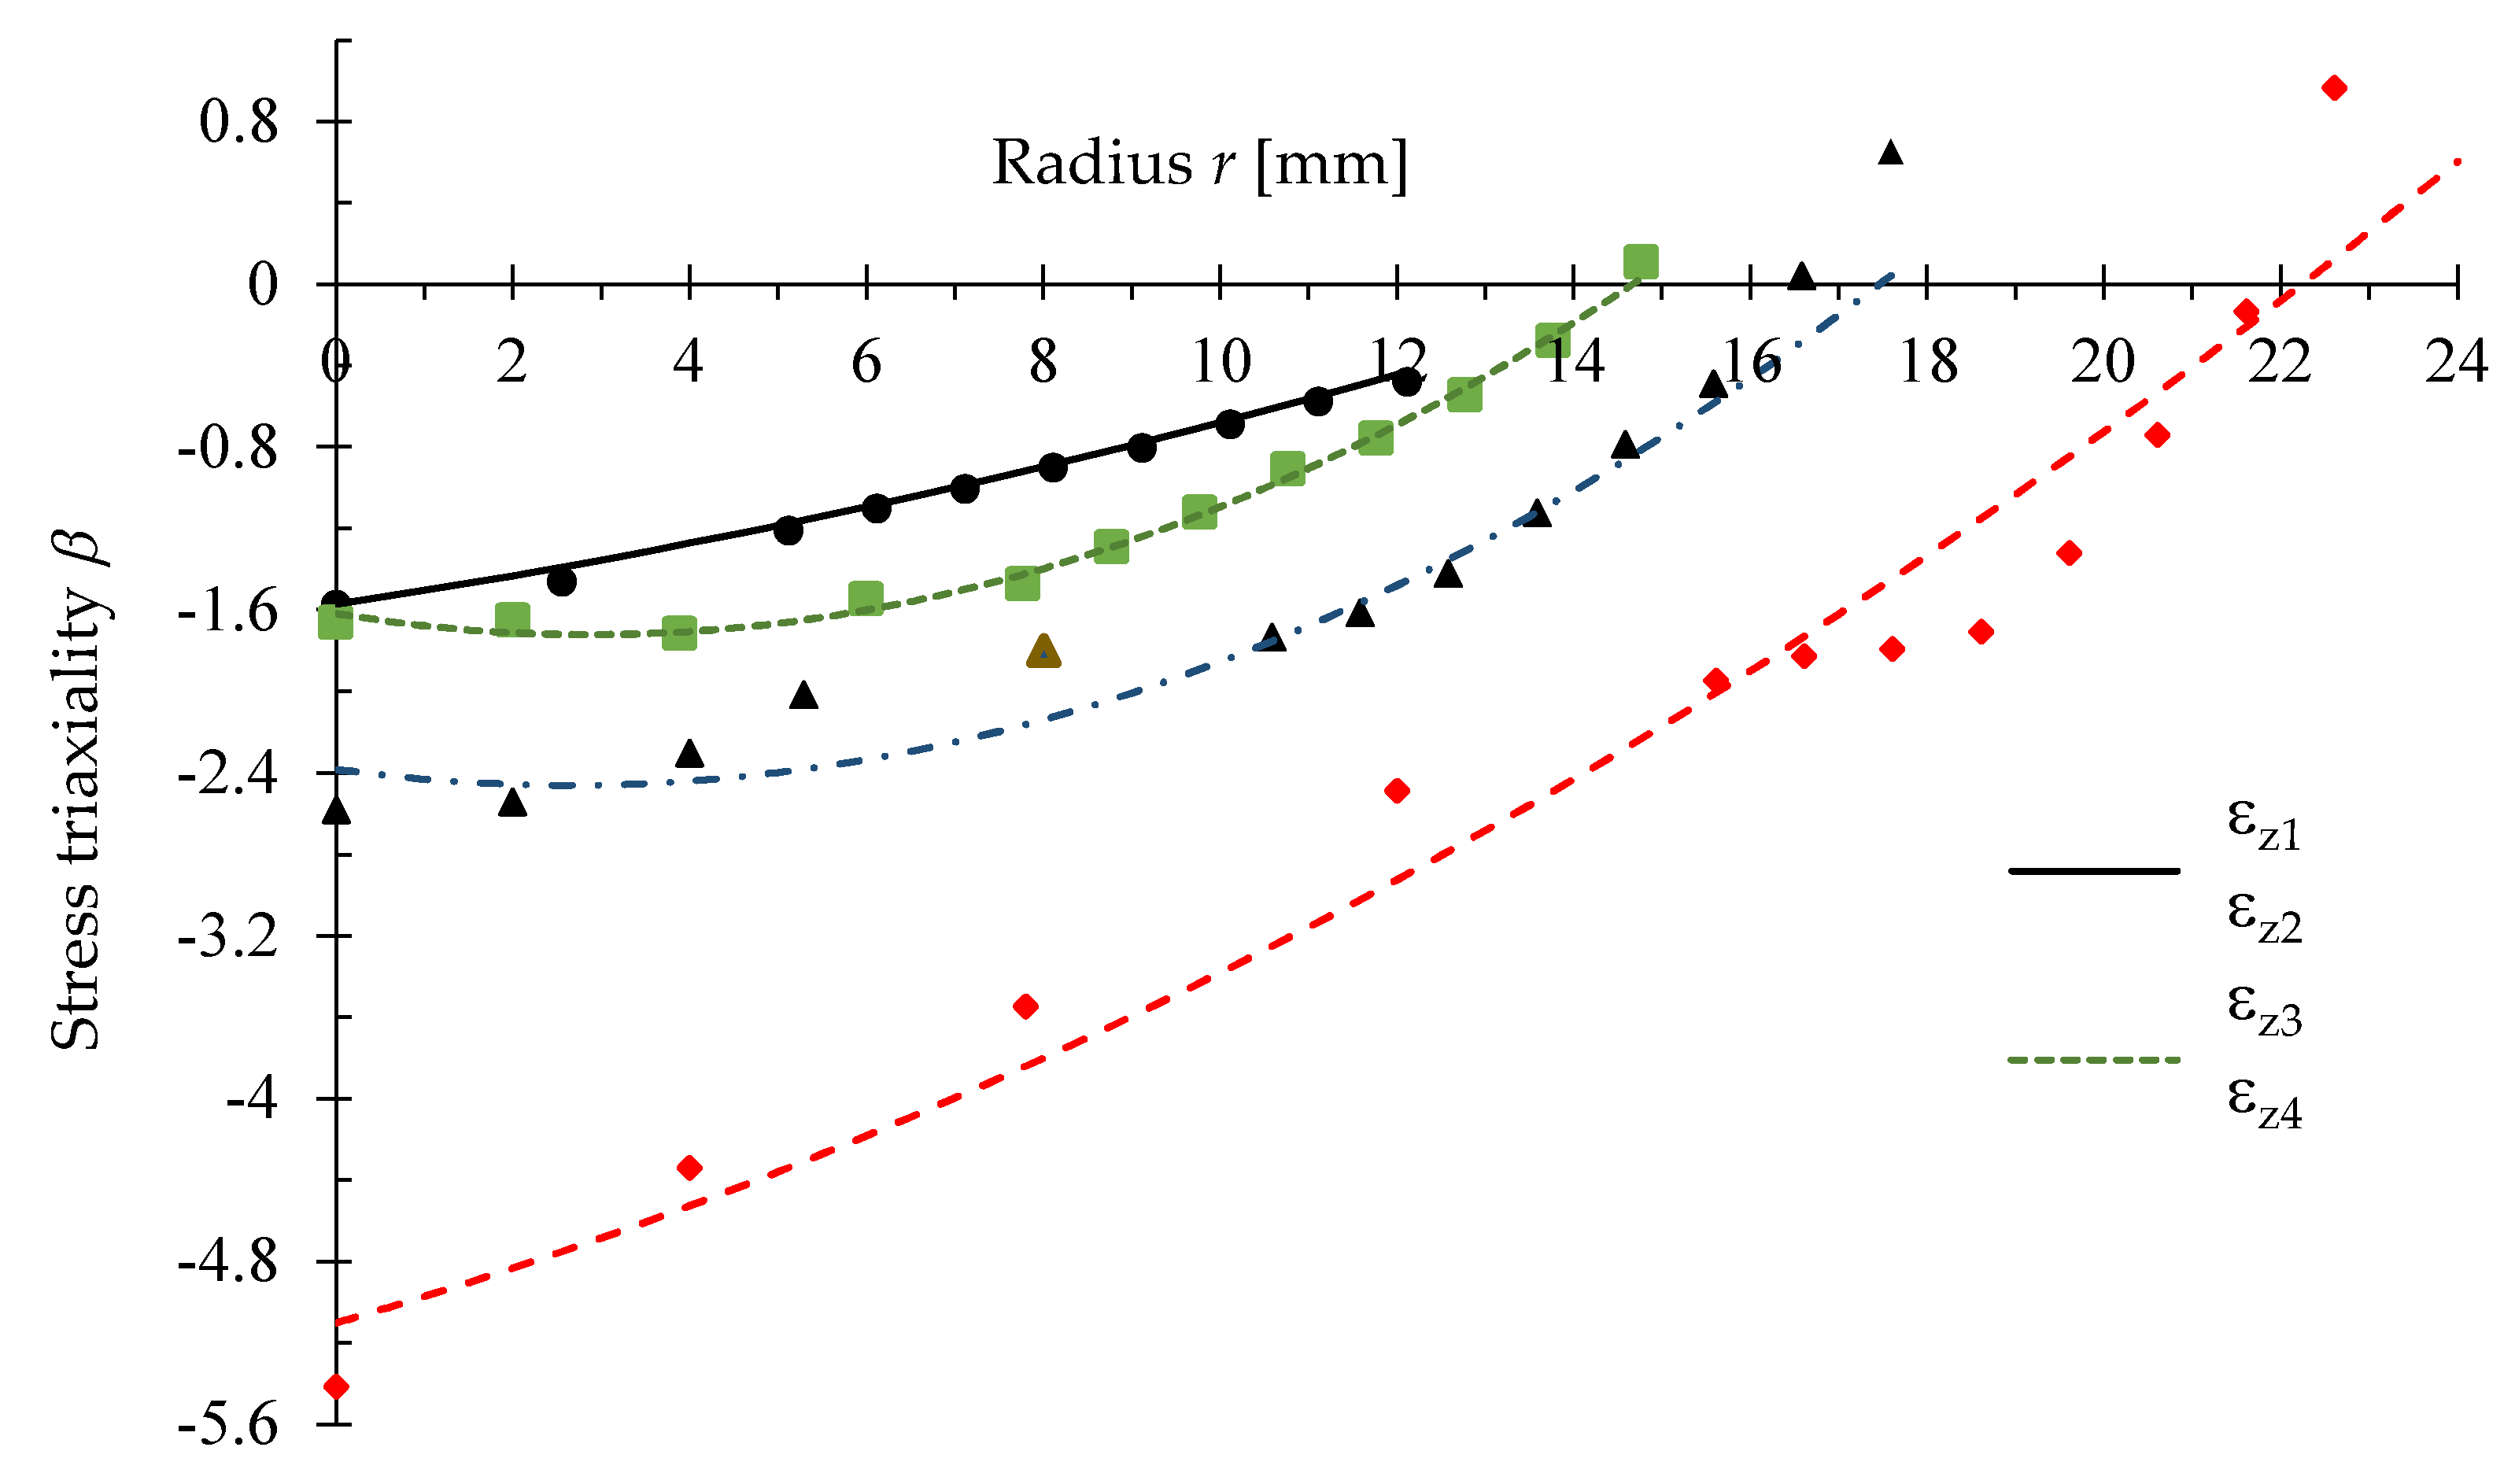
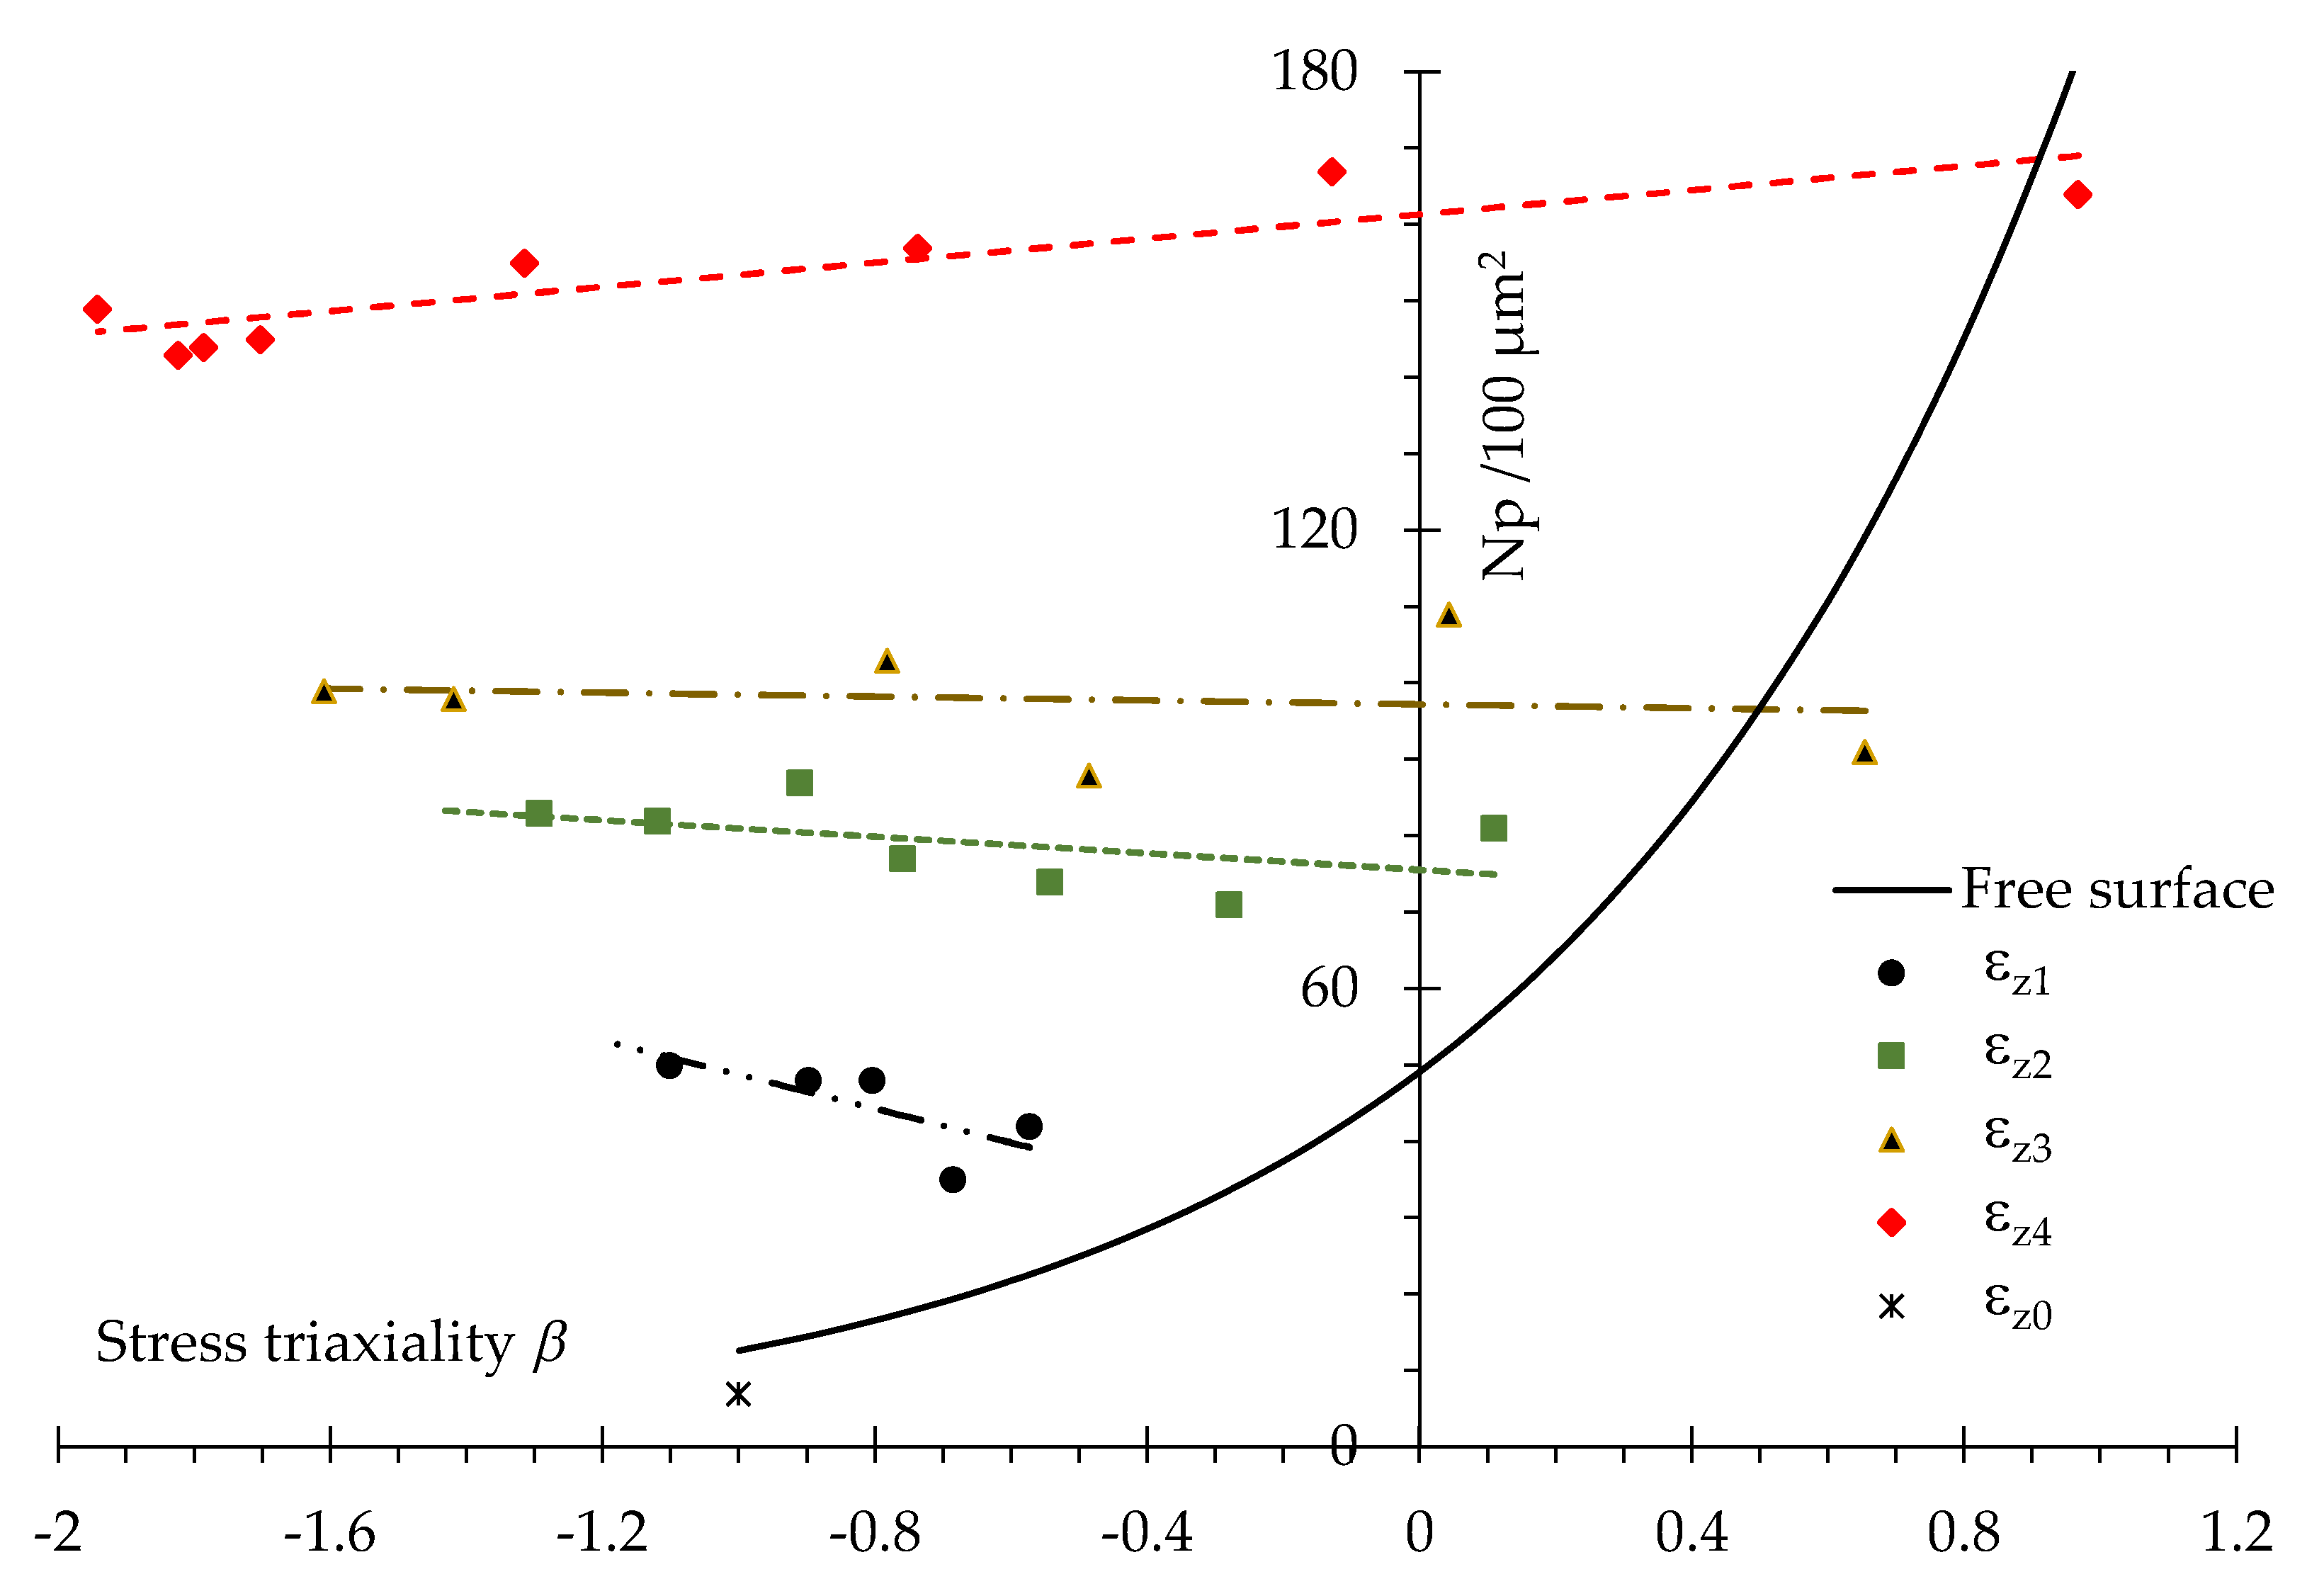
3.4. Effect of Stress Triaxiality Ratio on the Distribution of Microcracks

Another aspect of this study relates to the influence of the stress state on the nucleation and distribution of microcracks along the equatorial cross section of the specimen. The stress state was represented by the stress triaxiality ratio (β), which is defined by Equation (3):
β = 3 σ m σ e q = σ z + σ r + σ θ 2 2 ( σ z σ r ) 2 + ( σ r σ θ ) 2 + ( σ θ σ z ) 2 ,
where σz, σr and σθ are the principal stresses, σm is the hydrostatic stress and σeq is the effective (von Mises) stress.
The stress–strain state of specimens during the upsetting process was determined using the finite element method (FEM) and the software package Simufact Forming [42]. In the simulations, the upper and lower die were treated as rigid bodies, while an elastic–plastic material model was chosen for the specimen. The material properties and the flow curve, which were determined experimentally and are listed in Section 2 (Experimental Work), were used in the simulations. The Coulomb friction model with a coefficient of friction of μ = 0.12 [43] was used to describe tribological conditions along the die–workpiece contact surface. The distribution of stress–strain components at the limiting strain (εz4 = 1.59) obtained by the numerical simulations is shown in Figure 19.
From the point of view of microcrack nucleation and propagation, i.e., workability potential, the stress field in the outermost zone of the sample was disadvantageous, since the circumferential tensile (positive) stress σϴ was dominant (Figure 19). On the other hand, the levels of compressive stresses (axial σz and radial σr) were low in this zone and therefore these stresses did not have a significant effect on the foregoing processes. It should be noted that in the central zone of the workpiece, all three stresses were compressive, with high (negative) values. It can therefore be said that distribution of the stress components σz and σϴ along the equatorial plane was unfavorable, since on approaching the free surface the value of the axial compressive stress σz decreased progressively, while the compressive circumferential stress σϴ shifted to a tensile stress. A similar conclusion can be drawn from the distribution of the stress triaxiality β along the equatorial radius r, which is shown in Figure 20 for different strain levels. A common feature for all upsetting stages was a steady increase in the values of the β-factor from the center to the outer surface of the specimen, which was particularly noticeable in the final phase. The graph of the functions β = f(r) confirms the well-known fact that the equatorial free surface of the barreled cylindrical specimen is a critical zone of deformation. It is also clear that the influence of the tensile stress component σθ, in terms of material workability performance, increases with an increase in strain level.
The graph showing the relationship between the density of microcracks identified in pearlite colonies and the stress triaxiality is given in Figure 21. This dependence is best approximated by a linear function. Numerical values were calculated for each strain level (Figure 21).
In the initial phase of upsetting, εz1 = 0.38, the stress triaxiality depended mostly on the compressive stress σz. As the value of this stress decreased along the equatorial radius, there was an increase in the value of the β-factor and thus, in the general case, it could be expected that the quantity (density) of microcracks would also increase. However, the obtained results showed the opposite trend. The explanation could be found in the microstructural composition of the tested material. For steels with a normalized ferrite–pearlite microstructure, the orientation of cementite lamellae has a significant influence on the nucleation of microcavities at lower degrees of deformation [2]. In this respect, the SEM analysis showed that cementite lamellae parallel to the compression axis could experience large plastic deformations before fracture (Figure 22). Since the stress triaxiality increased gradually along the workpiece radius for strain level εz1 = 0.38 (βmin = −1.21 at distance of 7 mm from the free surface and βmax = −0.57 at the free surface), and the tensile stress σθ was very small, this led to the conclusion that, in this case, microstructural changes occurred primarily due to the compressive stress component σz in such a way that the cementite lamellae parallel to the load direction were only plastically deformed, while microcavities were exclusively generated in pearlite colonies with random (different, non-parallel) orientations. Considering that the influence of cementite lamella orientation on the development of microcracks was not studied in detail in this research, it can be assumed that a significant number of pearlite colonies with an orientation parallel to the compression axis were present in the area close to the free surface, and therefore fewer microcracks were generated in this area compared with the central part of the specimen. However, with a further increase in strain level, the plastic deformation capacity of the cementite lamellae decreased. In addition, there was a significant increase in the tensile stress σθ, which became the main factor in the process of nucleation and propagation of microcavities. Both these phenomena led to the change in the trend of the distribution of the microcrack density, where the number of microcracks in pearlite colonies increased with an increase in the stress triaxiality and the equatorial radius.
In contrast to the linear approximation for the microcrack density distribution along the equatorial radius, an exponential function model was used to describe the increase in microcracks at the free surface (Figure 22). The intensity of the damage accumulation was particularly large for positive values of the stress triaxiality, which confirms the dominant influence of the tensile stress σθ on the microcrack nucleation.

4. Conclusions

This research was focused on the characterization of morphological changes, identification of nucleation mechanisms and microcavity growth, as well as the quantification of microcracks in pearlite colonies in the case of free upsetting of cylindrical specimens made from C45E carbon steel. Based on the results of the experimental research and FEM numerical simulations, the following can be concluded:
  • The detected microcracks in C45E steel were the result of different mechanisms of the nucleation and growth of microcavities. The dominant mechanism was the fracture of cementite lamellae. On the other hand, no fracturing of non-metallic inclusions was observed. A significant amount of microstructural damage was also generated by the mechanism of decohesion at the boundary surfaces between ferrite grains and pearlite colonies. Microcavities generated at the boundary surfaces between non-metallic inclusions and ferrite or pearlite colonies did not have a significant impact on the overall level of accumulated damages, due to the small quantity of non-metallic inclusions in the steel matrix.
  • Pearlite colonies played the most important role in the development of microstructural damage. The first microcavities were the result of fractures of cementite lamellae that did not have a parallel orientation with the compression axis. Coalescence of microcavities and further microcrack propagation occurred mainly at an angle of 45° with respect to the position of the cementite lamellae. With an increase in the strain level, there was an intensive propagation of microcracks in the radial direction of the sample. At the limiting strain, the fracture of cementite lamellae was clearly visible, and the growth and propagation of microcracks occurred in a plane perpendicular to the upsetting direction.
  • Damage of ferrite grains for lower degrees of deformation was not observed. However, when the deformation became significant, the nucleation and growth of microvoids at the junction of three ferrite grains occurred. In addition, at the limiting strain, growth and coalescence of microcracks along the ferrite grain boundaries were detected.
  • The quantitative analysis of the density of microcracks in pearlite colonies showed that the distribution of microcracks along the equatorial plane was not uniform. At lower degrees of deformation, the number of microcracks detected in the central part of the specimen was higher compared to the outside region and the free surface. For larger deformation, the distribution was the opposite. The critical level of accumulated microcracks was identified at the equatorial free surface of the sample when deformation reached the limiting strain.
  • The stress state, i.e., the stress triaxiality, greatly affected the microstructural damage evolution during the upsetting process. The stress triaxiality increased with an increase in strain level and it changed with the equatorial radius. At the beginning of upsetting, the axial compressive stress had a major influence on the value of this factor and on the mechanism of microcrack nucleation. As the degree of deformation increased, the effect of the circumferential tensile stress on the stress triaxiality increased, and hence it changed from negative to positive (β < 0 → β> 0). The result of this was an increase in the density of microcracks in pearlite colonies, especially at the free surface. This confirms that tensile stresses have a dominant influence on microcrack accumulation and material deformability.

Author Contributions

Conceptualization, M.K. and M.M.; methodology, M.K. and S.B.; software, M.M. and A.A.; investigation, M.K., R.Č., M.M. and S.B.; resources, R.Č. and K.K.; writing—original draft preparation, M.K. and M.M.; writing—review and editing, S.B. and K.K.; project administration, A.A.; funding acquisition, R.Č. All authors have read and agreed to the published version of the manuscript.

Funding

This research received no external funding.

Data Availability Statement

All data in this study are provided in the present manuscript.

Acknowledgments

This paper is part of a study in the project “Collaborative systems in the digital industrial environment” No. 142-451-2671/2021-01/02, supported by the Provincial Secretariat for Higher Education and Scientific Research of the Autonomous Province of Vojvodina.

Conflicts of Interest

The authors declare no conflict of interest.

References

  1. Šiđanin, L.; Miyasato, S. Void nucleation and growth in dual phase steel wires. Mater. Sci. Technol. 1989, 5, 1200–1206. [Google Scholar] [CrossRef]
  2. Avramovic-Cingara, G.; Ososkov, Y.; Jain, M.K.; Wilkinson, D.S. Effect of martensite distribution on damage behaviour in DP600 dual phase steels. Mater. Sci. Eng. A 2009, 516, 7–16. [Google Scholar] [CrossRef]
  3. Avramovic-Cingara, G.; Saleh, C.A.R.; Jain, M.K.; Wilkinson, D.S. Void nucleation and growth in dual-phase steel 600 during uniaxial tensile testing. Metall. Mater. Trans. A 2009, 40, 3117–3127. [Google Scholar] [CrossRef]
  4. Klocke, F.; Timmer, A.; Bäcker, V. Crack prediction in cold forging operations through a phenomenological differentiation of crack types. In Proceedings of the 12th International Cold Forging Congress—ICFC, Stuttgart, Germany, 19 May 2011; pp. 65–72. [Google Scholar]
  5. Qayyum, F.; Umar, M.; Elagin, V.; Kirschner, M.; Hoffmann, F.; Guk, S.; Prahl, U. Influence of non-metallic inclusions on local deformation and damage behavior of modified 16MnCrS5 steel. Crystals 2022, 12, 281. [Google Scholar] [CrossRef]
  6. Wang, X.; Chen, J.G.; Su, G.; Li, H.Y.; Wang, C. Plastic damage evolution in structural steel and its non-destructive evaluation. J. Mater. Res. Technol. 2020, 9, 1189–1199. [Google Scholar] [CrossRef]
  7. Gerstein, G.; Besserer, H.B.; Nürnberger, F.; Barrales-Mora, L.A.; Shvindlerman, L.S.; Estrin, Y.; Maier, H.J. Formation and growth of voids in dual-phase steel at microscale and nanoscale levels. J. Mater. Sci. 2017, 52, 4234–4243. [Google Scholar] [CrossRef]
  8. Hirt, G.; Tekkaya, A.E.; Clausmeyer, T.; Lohmar, J. Potential and status of damage controlled forming processes. Prod. Eng. Res. Devel. 2020, 14, 1–4. [Google Scholar] [CrossRef] [Green Version]
  9. Li, H.; Fu, M.W.; Lu, J.; Yang, H. Ductile fracture: Experiments and computations. Int. J. Plast. 2011, 27, 147–180. [Google Scholar] [CrossRef]
  10. Collini, L.; Moroni, F.; Pirondi, A. Modeling the influence of stress triaxiality on the failure strain of nodular cast iron microstructures. Procedia Struct. Integr. 2019, 18, 671–687. [Google Scholar] [CrossRef]
  11. Tasan, C.C.; Hoefnagels, J.P.M.; Ten Horn, C.H.L.J.; Geers, M.G.D. Experimental analysis of strain path dependent ductile damage mechanics and forming limits. Mech. Mater. 2009, 41, 1264–1276. [Google Scholar] [CrossRef]
  12. Gao, X.; Zhang, G.; Roe, C. A Study on the effect of the stress state on ductile fracture. Int. J. Damage Mech. 2010, 19, 75–94. [Google Scholar]
  13. Behrens, A.; Just, H. Verification of the damage model of effective stresses in cold and warn forging operations by experimental testing and FE simulations. J. Mater. Process. Technol. 2002, 125–126, 295–301. [Google Scholar] [CrossRef]
  14. Brünig, M.; Gerke, S. Simulation of damage evolution in ductile metals undergoing dynamic loading conditions. Int. J. Plast. 2011, 27, 1598–1617. [Google Scholar] [CrossRef]
  15. Samei, J.; Green, D.E.; Cheng, J.; Lima, M.S.C. Influence of strain path on nucleation and growth of voids in dual phase steel sheets. Mater. Des. 2016, 92, 1028–1037. [Google Scholar] [CrossRef]
  16. Kusche, C.F.; Pütz, F.; Münstermann, S.; Al-Samman, T.; Korte-Kerzel, S. On the effect of strain and triaxiality on void evolution in a heterogeneous microstructure—A statistical and single void study of damage in DP800 steel. Mater. Sci. Eng. A 2021, 799, 140332. [Google Scholar] [CrossRef]
  17. Babout, L.; Brechet, Y.; Maire, E.; Fougères, R. On the competition between particle fracture and particle decohesion in metal matrix composites. Acta Mater. 2004, 52, 4517–4525. [Google Scholar] [CrossRef]
  18. Šiđanin, L. Morphology and Fracture Mechanisms of Low Carbon Steel. Ph.D. Thesis, Faculty of Technical Sciences, Novi Sad, Serbia, 1984. (In Serbian). [Google Scholar]
  19. Zhang, Z.L. A complete Gurson model. In Nonlinear Fracture and Damage Mechanics—Chapter 8; Alibadi, M.H., Ed.; WIT Press: Southampton, UK, 2001; pp. 223–248. [Google Scholar]
  20. Benzerga, A.A.; Leblond, J.B. Ductile Fracture by void growth to coalescence. Adv. Appl. Mech. 2010, 44, 169–305. [Google Scholar]
  21. Matsuno, T.; Maeda, D.; Shutoh, H.; Uenishi, A.; Suehiro, M. Effect of martensite volume fraction on void formation leading to ductile fracture in dual phase steels. ISIJ Int. 2014, 54, 938–944. [Google Scholar] [CrossRef] [Green Version]
  22. Lin, J.; Liu, Y.; Dean, T.A. A Review on Damage Mechanisms, Models and Calibration Methods under Various Deformation Conditions. Int. J. Damage Mech. 2005, 14, 299–319. [Google Scholar] [CrossRef]
  23. Gadalińska, E.; Baczmański, A.; Braham, C.; Gonzalez, G.; Sidhom, H.; Wroński, S.; Buslaps, T.; Wierzbanowski, K. Stress localisation in lamellar cementite and ferrite during elastoplastic deformation of pearlitic steel studied using diffraction and modelling. Int. J. Plast. 2020, 127, 102651. [Google Scholar] [CrossRef]
  24. Gladshtein, L.I.; Larionova, N.P.; Belyaev, B.F. Effect of ferrite-pearlite microstructure on structural steel properties. Metallurgist 2012, 56, 579–590. [Google Scholar] [CrossRef]
  25. Gonzaga, R.A. Influence of ferrite and pearlite content on mechanical properties of ductile cast irons. Mater. Sci. Eng. A 2013, 567, 2013. [Google Scholar] [CrossRef]
  26. Brandaleze, E. Structural Evolution of Pearlite in Steels with Different Carbon Content under Drastic Deformation during Cold Drawing. Procedia Mater. Sci. 2015, 8, 1023–1030. [Google Scholar] [CrossRef] [Green Version]
  27. Muñoz, J.A.; Khelfa, T.K.; Komissarov, A.; Cabrera, J.M. Ductility and plasticity of ferritic-pearlitic steel after severe plastic deformation. Mater. Sci. Eng. A 2021, 805, 140624. [Google Scholar] [CrossRef]
  28. Isavand, S.; Assempour, A. Effects of Microstructural Morphology on Formability, Strain Localization, and Damage of Ferrite-Pearlite Steels: Experimental and Micromechanical Approaches. Metall. Mater. Trans. A 2021, 52, 711–725. [Google Scholar] [CrossRef]
  29. Khalid, F.A.; Farooque, M.; Haq, A.; Khan, A.Q. Role of ferrite/pearlite banded structure and segregation on mechanical properties of microalloyed hot rolled steel. Mater. Sci. Technol. 1999, 15, 1209–1215. [Google Scholar] [CrossRef]
  30. Peng, X.; Pi, W.; Fan, J. A Microstructure-Damage-Based Description for the Size Effect of the Constitutive Behavior of Pearlitic Steels. Int. J. Damage Mech. 2010, 19, 821–849. [Google Scholar] [CrossRef]
  31. Yahyaoui, H.; Sidhom, H.; Braham, C.; Baczmanski, A. Effect of interlamellar spacing on the elastoplastic behavior of C70 pearlitic steel: Experimental results and self-consistent modeling. Mater. Des. 2014, 55, 888–897. [Google Scholar] [CrossRef] [Green Version]
  32. Ohata, M.; Toyoda, M. Damage concept for evaluating ductile cracking of steel structure subjected to large-scale cyclic straining. Sci. Technol. Adv. Mater. 2004, 5, 241–249. [Google Scholar] [CrossRef]
  33. Qiu, H.; Mori, H.; Enoki, M.; Kishi, T. Evaluation of Ductile Fracture of Structural Steels by Microvoid Mode. ISIJ Int. 1999, 39, 358–364. [Google Scholar] [CrossRef]
  34. de Geus, W.J.; Peerlings, R.H.J.; Geers, M.G.D. Competing damage mechanisms in a two-phase microstructure: How microstructure and loading conditions determine the onset of fracture. Int. J. Solids Struct. 2016, 97–98, 687–698. [Google Scholar] [CrossRef]
  35. Silva, C.M.A.; Alves, L.M.; Nielsen, C.V.; Atkinsc, A.G.; Martins, A.G. Failure by fracture in bulk metal forming. J. Mater. Process. Technol. 2015, 215, 287–298. [Google Scholar] [CrossRef]
  36. Bao, Y.; Wierzbicki, T. On fracture locus in the equivalent strain and stress triaxiality space. Int. J. Mech. Sci. 2004, 46, 81–98. [Google Scholar] [CrossRef]
  37. Isaksson, P.; Ståhle, P. Crack kinking under high pressure in an elastic-plastic material. Int. J. Fract. 2001, 108, 351–366. [Google Scholar] [CrossRef]
  38. Lou, Y.; Yoon, J.W.; Huh, H.; Chao, Q.; Song, J.H. Correlation of the maximum shear stress with micro-mechanisms of ductile fracture for metals with high strength-to-weight ratio. Int. J. Mech. Sci. 2018, 146–147, 583–601. [Google Scholar] [CrossRef]
  39. Atkins, A.G. Fracture in forming. J. Mater. Process. Technol. 1996, 56, 609–618. [Google Scholar] [CrossRef]
  40. Gouveia, B.P.P.A.; Rodrigues, J.M.C.; Martins, P.A.F. Ductile fracture in metalworking: Experimental and theoretical research. J. Mater. Process. Technol. 2000, 101, 52–63. [Google Scholar] [CrossRef]
  41. Vu, C.H.; Seo, D.W.; Lim, J.K. Site of ductile fracture initiation in cold forging: A finite element model. Theor. Appl. Fract. Mech. 2005, 44, 58–69. [Google Scholar]
  42. Simufact Software. Available online: https://www.simufact.com/simufactforming-forming-simulation.html (accessed on 24 November 2021).
  43. Movrin, D.; Milutinovic, M.; Vilotic, M.; Alexandrov, S.; Lang, L. A Method for Determining the Workability Diagram by Varying Friction Conditions in the Upsetting of a Cylinder between Flat Dies. Crystals 2021, 11, 1411. [Google Scholar] [CrossRef]
Figure 1. Deformed specimens after each forming pass.
Crystals 12 00426 g001
Figure 2. Locations of the testing points (longitudinal cross section) (o—SEM testing points; FS—free surface; EP—equatorial plane; CL—center line; R—equatorial radius).
Crystals 12 00426 g002
Figure 3. The LM images of microstructure of undeformed sample (transverse cross section) at different magnifications.
Crystals 12 00426 g003
Figure 4. The SEM images of microstructure of undeformed sample: (a) ferrite–pearlite structure of base metal (×2000 magnification); (b) orientation of cementite lamellae (red arrow—direction of upsetting), ×10,000 magnification.
Crystals 12 00426 g004
Figure 5. The SEM images of microstructure for different strains): (a) εz1 = 0.38; (b) εz2 = 0.75; (c) εz3 = 1.10; (d) εz4 = 1.59; (×2000 magnification).
Crystals 12 00426 g005aCrystals 12 00426 g005b
Figure 6. The SEM images of some fractured cementite lamellae of undeformed specimen: (a) Zone I; (b) Zone IV; (×10 000 magnification).
Crystals 12 00426 g006
Figure 7. Microstructural damage for strain level εz1 = 0.38: (a,b) fracture of lamellar cementite at different distances from the free surface of the sample (Zone I) ((a) 1 mm, (b) 2 mm); (c,d) nucleation of microvoids by decohesion mechanism ((c) spheroidal inclusion, (d) elongated inclusion (red arrows—direction of upsetting).
Crystals 12 00426 g007
Figure 8. Microstructural damage for strain level εz2 = 0.75: (a) propagation of microcracks in pearlite colonies; (b) nucleation of microvoids at the junction of three ferrite grains (red arrow—direction of upsetting).
Crystals 12 00426 g008
Figure 9. Microstructural damage for strain level εz3 = 1.1: (a) development of a microcrack in the ferrite base; (b) fracture of cementite lamellae; (c) microdamages caused by decohesion at the ferrite/ferrite or ferrite/pearlite boundary surfaces (red arrow—direction of upsetting).
Crystals 12 00426 g009
Figure 10. Microstructural damage for strain level εz4 = 1.59: (a) submicroscopic particles of lamellar cementite; (b) nucleation of microcracks in the central zone of the sample; (c) microcracks in the peripheral zone of the sample (×5000 magnification, red arrow—direction of upsetting).
Crystals 12 00426 g010
Figure 11. Coalescence of microcracks (red arrow—direction of upsetting).
Crystals 12 00426 g011
Figure 12. Macroscopic crack at free surface (red arrow—direction of upsetting).
Crystals 12 00426 g012
Figure 13. Identification of damage in pearlite colonies using JMicroVision v1.27 software.
Crystals 12 00426 g013
Figure 14. Density of microcracks in pearlite colonies for Zone 1 and Zone S.
Crystals 12 00426 g014
Figure 15. Microstructure of specimen in Zone I (a) and Zone IV (b) for strain level εz1 = 0.38 (red arrow—direction of upsetting).
Crystals 12 00426 g015
Figure 16. Microstructure of specimen in Zone I (a) and Zone IV (b) for strain level εz2 = 0.75 (red arrow—direction of upsetting).
Crystals 12 00426 g016
Figure 17. Microstructure of specimen in Zone I (a) and Zone IV (b) for strain level εz3 = 1.10 (red arrow—direction of upsetting).
Crystals 12 00426 g017
Figure 18. Microstructure of specimen in Zone I (a) and Zone IV (b) for strain level εz4 = 1.59 (red arrow—direction of upsetting).
Crystals 12 00426 g018
Figure 19. Distribution of stress and strain components for the limiting strain z4 = 1.59): (a) axial stress σz; (b) axial strain εz; (c) radial stress σr; (d) radial strain εr; (e) circumferential stress σϴ; (f) circumferential strain εθ.
Crystals 12 00426 g019
Figure 20. Distribution of stress triaxiality along the equatorial radius for different degrees of deformation.
Crystals 12 00426 g020
Figure 21. Density of microcracks in Zones I-IV as a function of stress triaxiality.
Crystals 12 00426 g021
Figure 22. Deformation of cementite lamellae z2 = 0.75, Zone IV) (red arrow—direction of upsetting).
Crystals 12 00426 g022
Table 1. Chemical composition of medium carbon steel C45E (Fe is balance).
Chemical ElementCSiMnSCrPCuNiMoVAlSn
Content (wt.%)0.460.230.6680.0260.1210.0210.170.0540.0110.0060.0180.005
Table 2. The mechanical properties of C45E steel (SD—standard deviation).
PropertyRm [MPa]Rp0.2 [MPa]εm [%]Ψ [%]HB
Mean ± SD709.1 ± 3.77462.8 ± 3.268.1 ± 0.4638.6 ± 1.87179 ± 3.74
Table 3. Quantification of microcracks in pearlite colonies.
Strain LevelThe Mean Density of Microcracks in Pearlite Colonies per 100 µm2
Zone IZone IIZone IIIZone IVZone MZone S
εz0 = 0768786
εz1 = 0.38353749485060
εz2 = 0.75797784838275
εz3 = 1.101029592969390
εz4 = 1.59161156149145128124
Publisher’s Note: MDPI stays neutral with regard to jurisdictional claims in published maps and institutional affiliations.

