
Unraveling the Relationship between Microstructure and Mechanical Properties of Friction Stir-Welded Copper Joints by Fuzzy Logic Neural Networks

 ,
,  , and
, and
Abstract
:1. Introduction
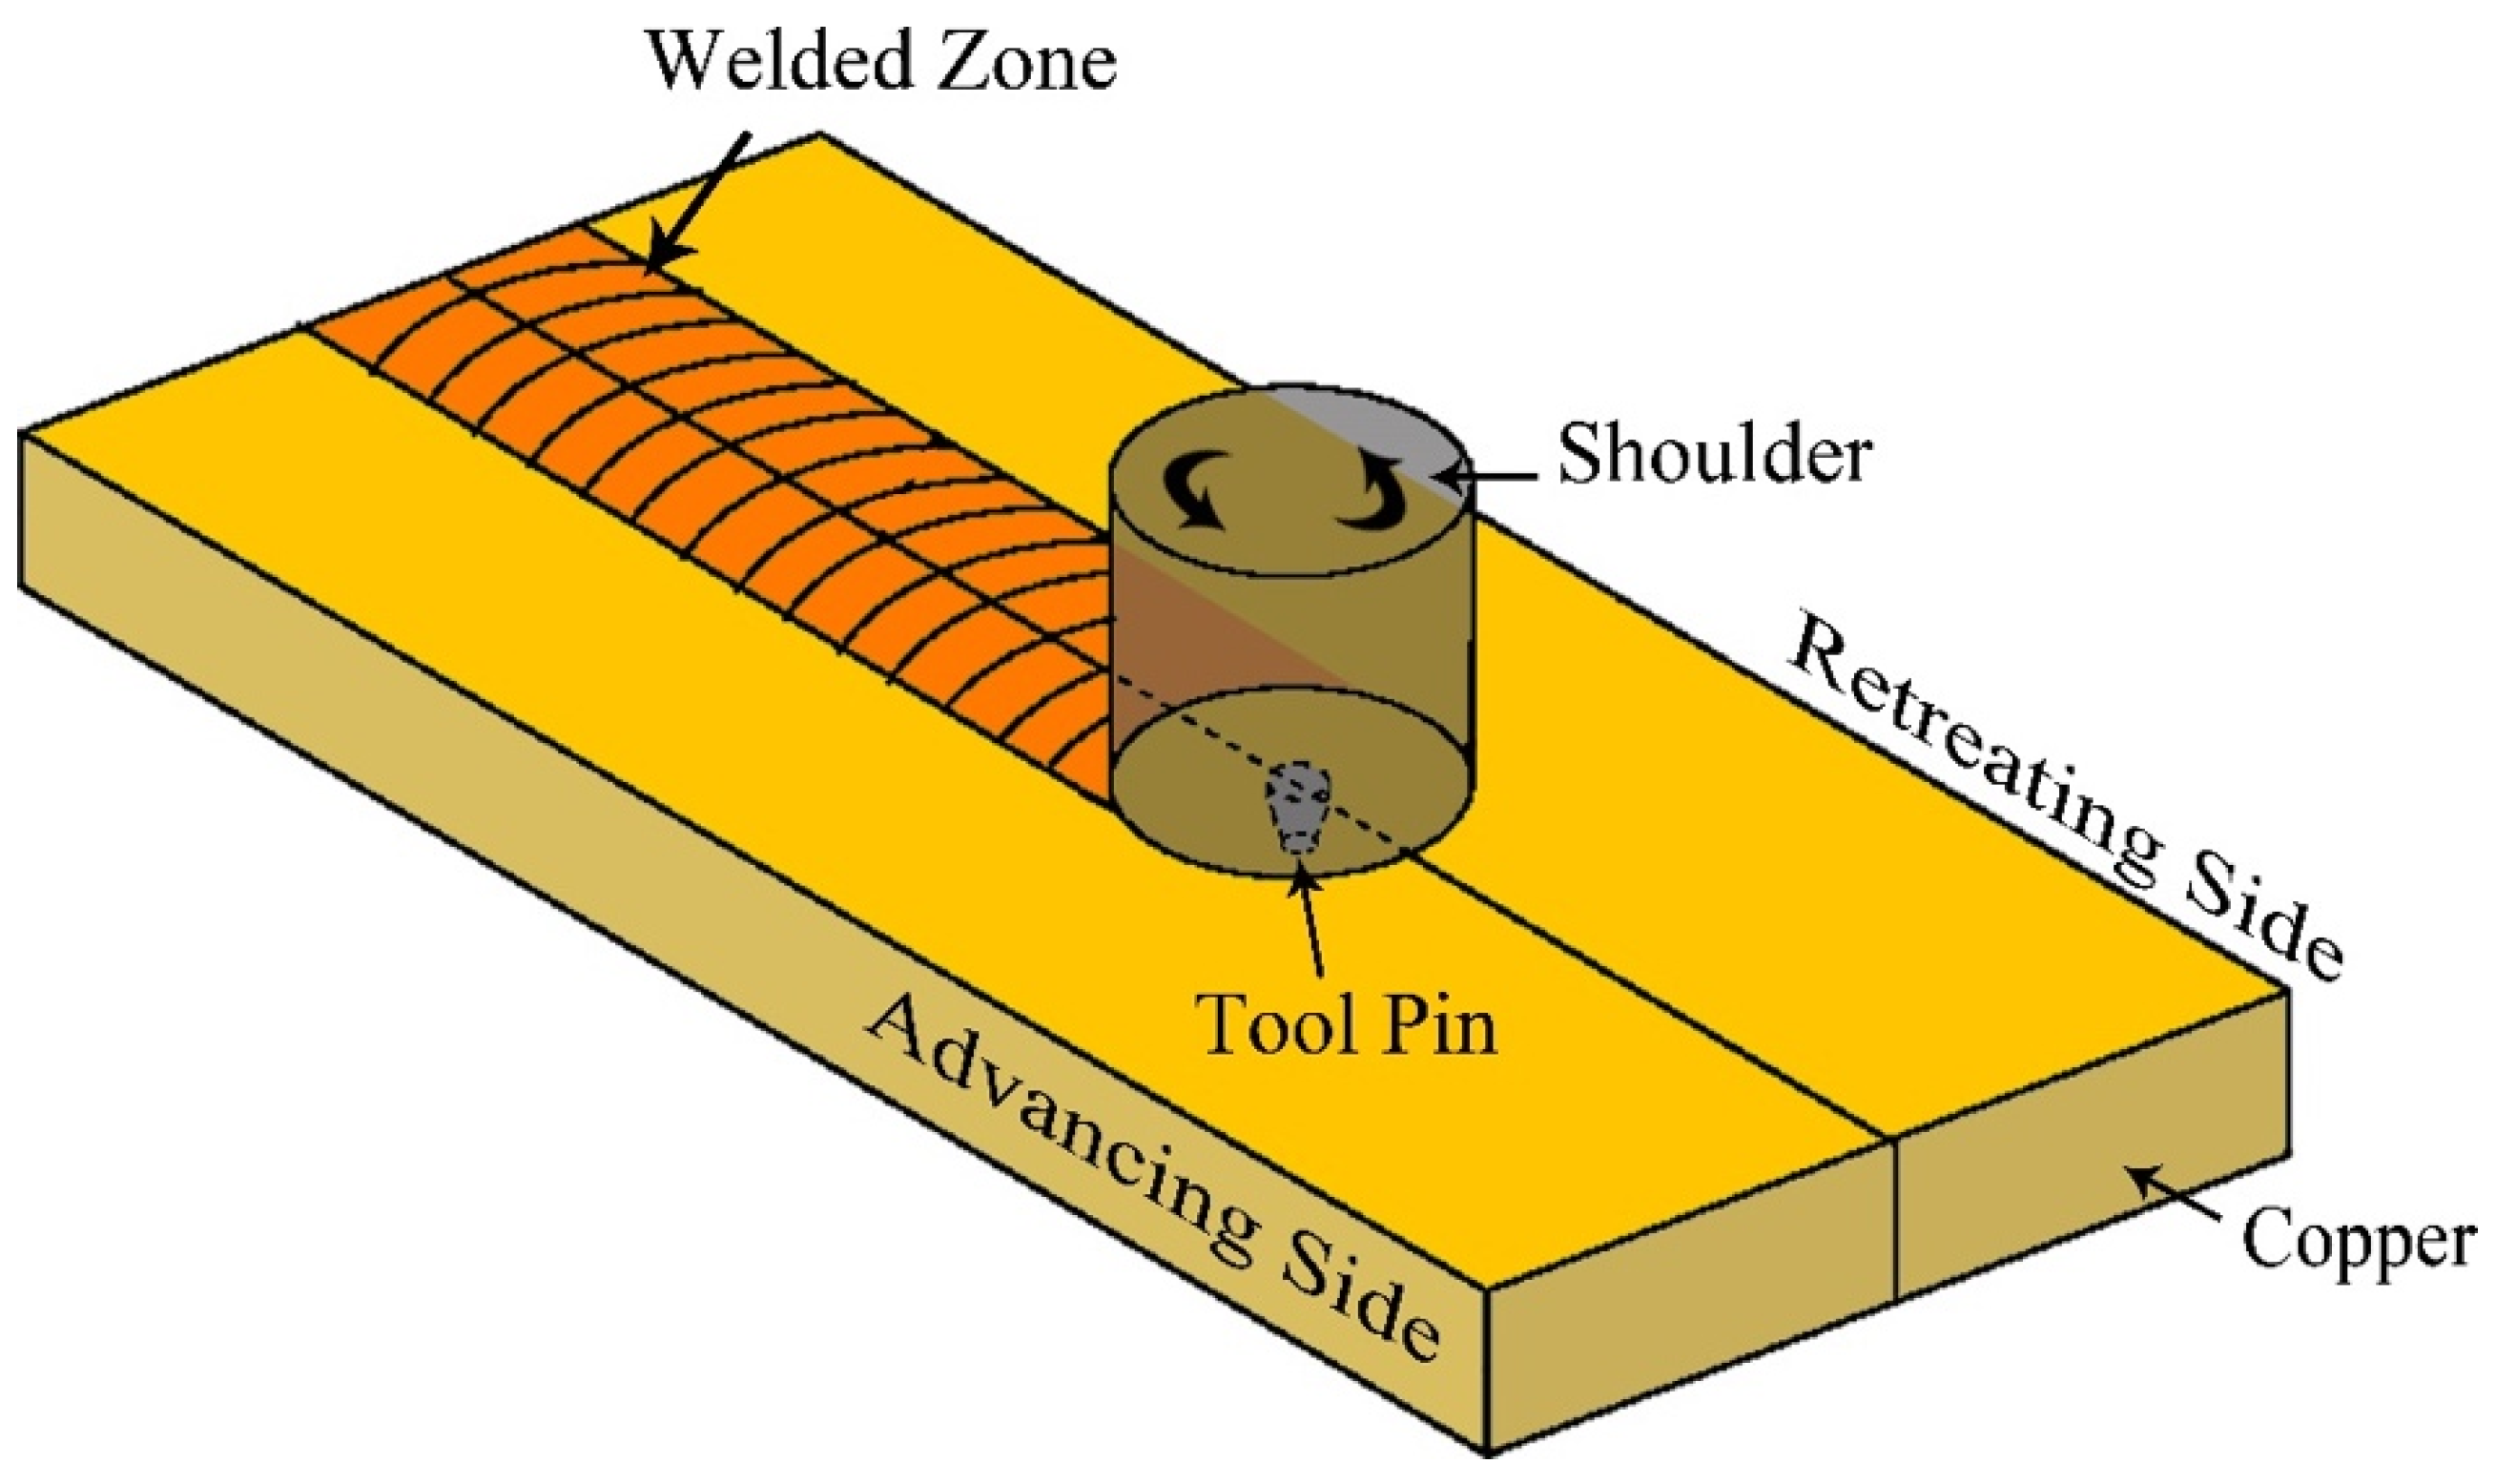
2. Experimental Procedure
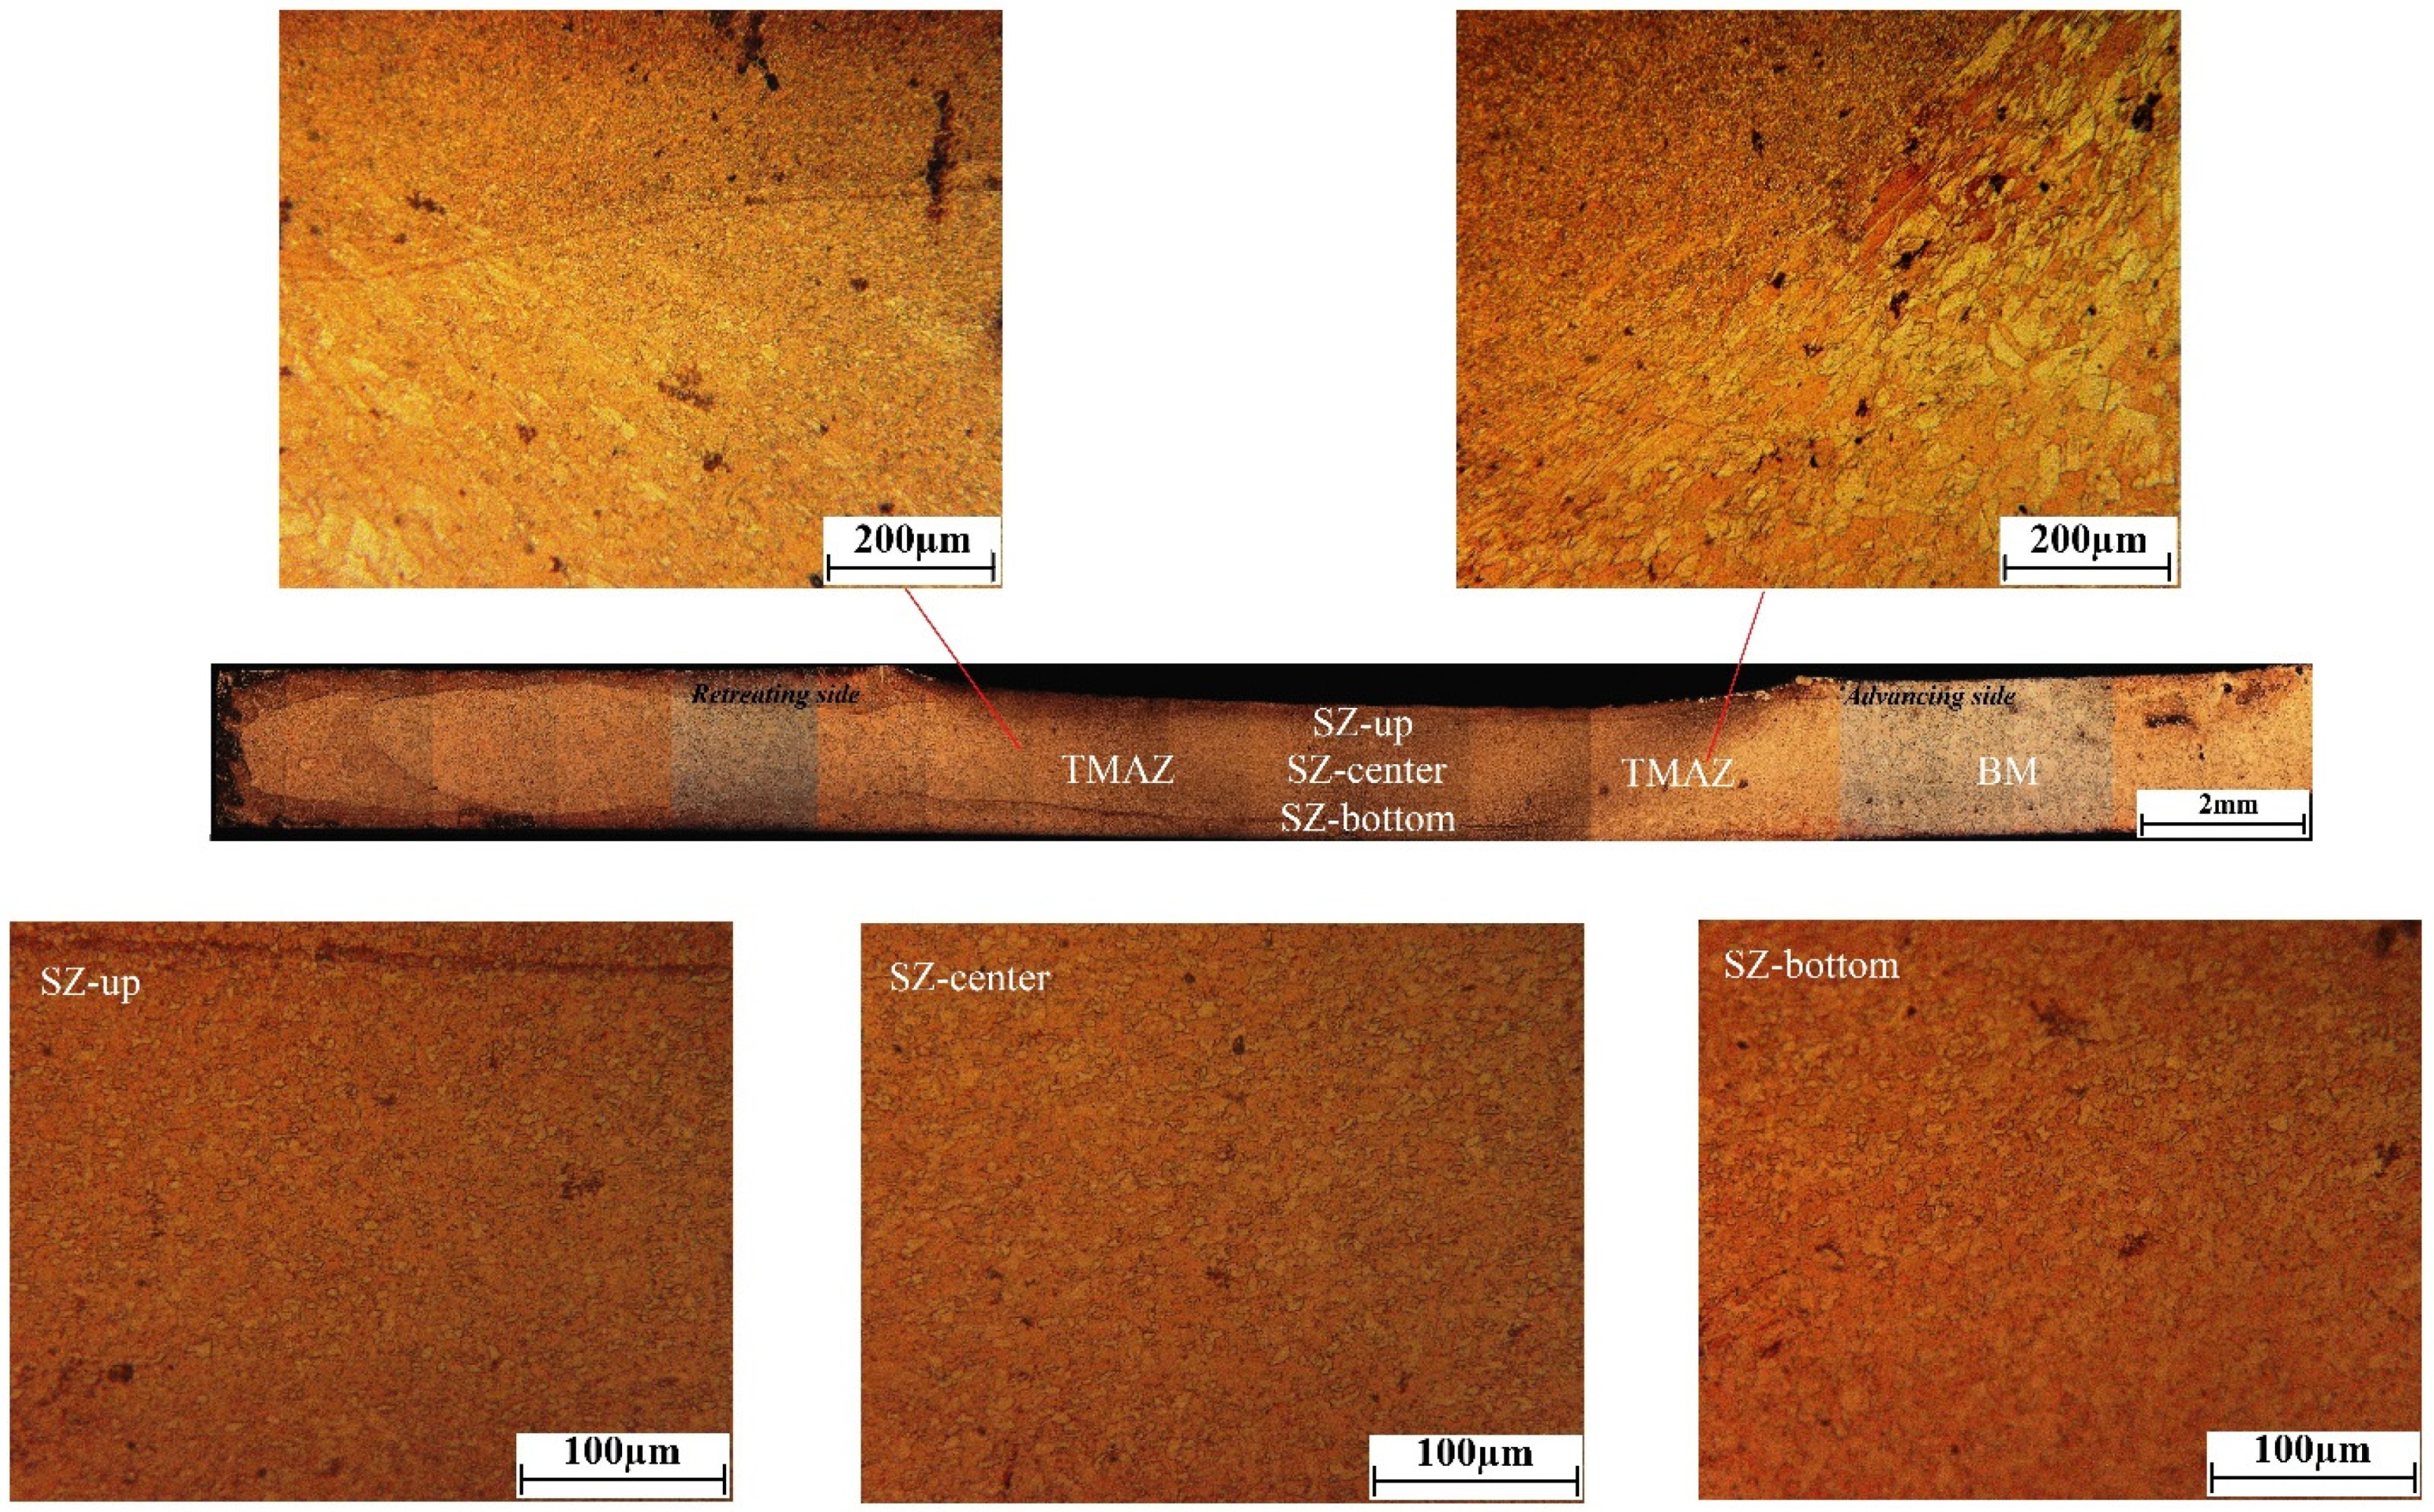
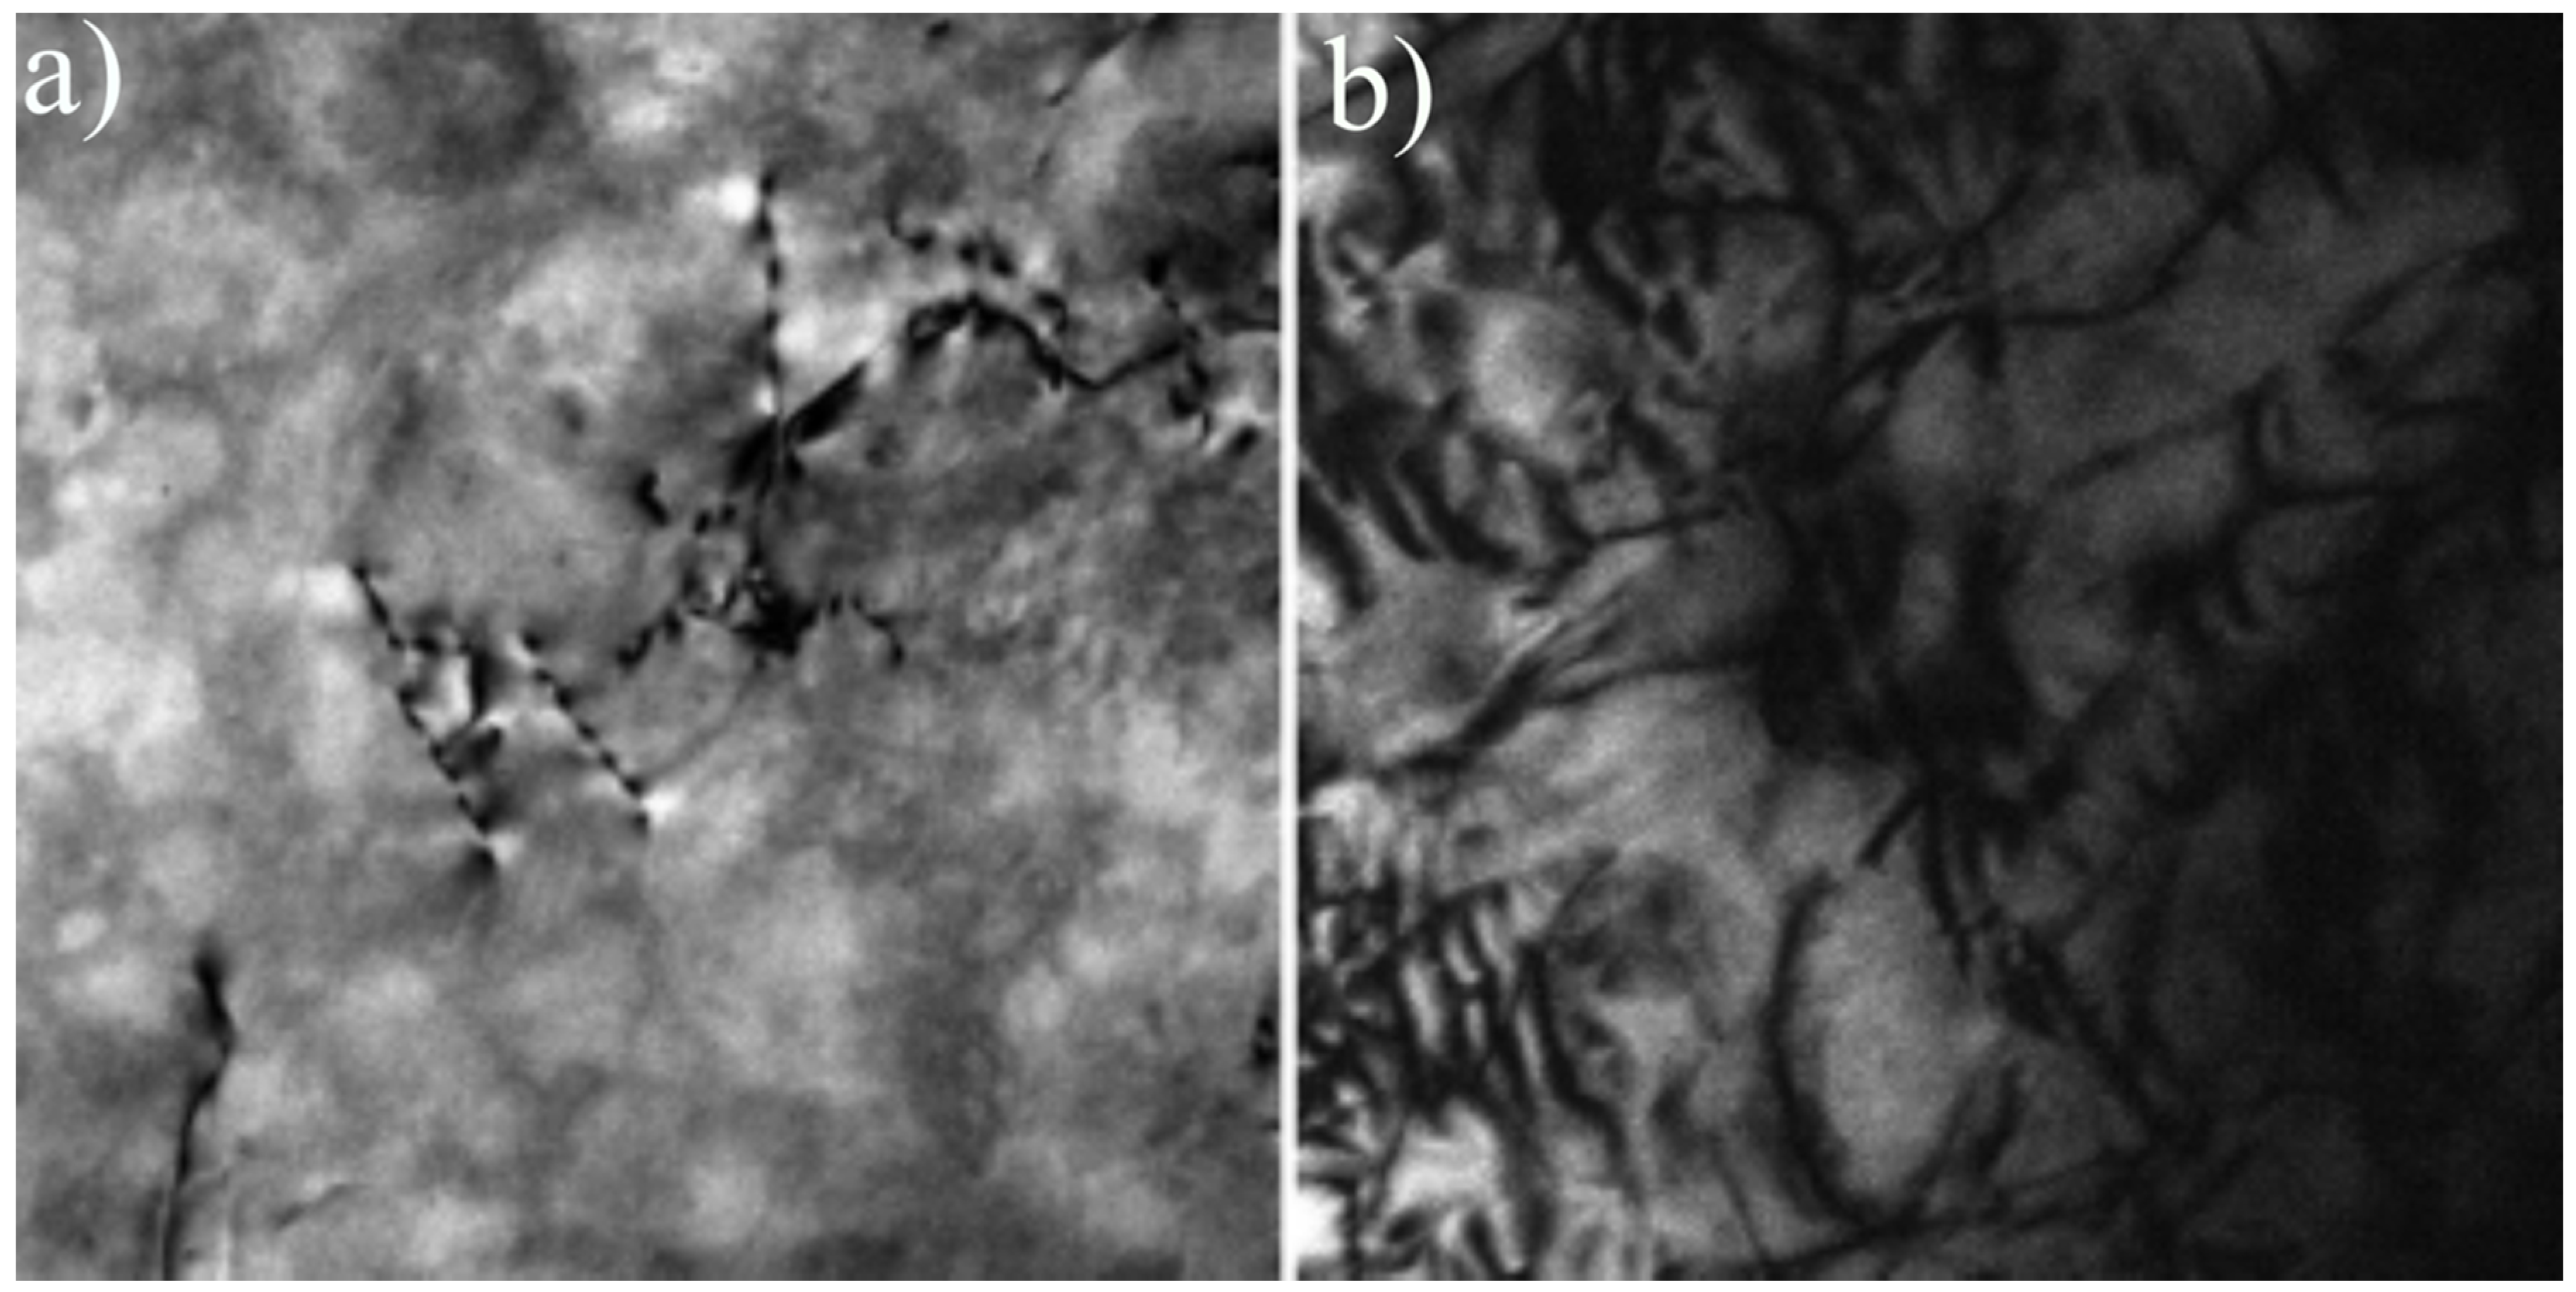
3. Results
4. Discussion
5. Conclusions
Author Contributions
Funding
Institutional Review Board Statement
Informed Consent Statement
Data Availability Statement
Conflicts of Interest
References
- Davis, J.R. Copper and Copper Alloys; ASM International: Materials Park, OH, USA, 2001. [Google Scholar]
- Heidarzadeh, A.; Saeid, T.; Klemm, V.; Chabok, A.; Pei, Y. Effect of Stacking Fault Energy on the Restoration Mechanisms and Mechanical Properties of Friction Stir Welded Copper Alloys. Mater. Des. 2019, 162, 185–197. [Google Scholar] [CrossRef]
- Heidarzadeh, A.; Saeid, T. Correlation between Process Parameters, Grain Size and Hardness of Friction-Stir-Welded Cu–Zn Alloys. Rare Met. 2018, 37, 388–398. [Google Scholar] [CrossRef]
- Mironov, S.; Inagaki, K.; Sato, Y.S.; Kokawa, H. Microstructural Evolution of Pure Copper During Friction-Stir Welding. Philos. Mag. 2015, 95, 367–381. [Google Scholar] [CrossRef]
- Heidarzadeh, A.; Mironov, S.; Kaibyshev, R.; Çam, G.; Simar, A.; Gerlich, A.; Khodabakhshi, F.; Mostafaei, A.; Field, D.P.; Robson, J.D.; et al. Friction Stir Welding/Processing of Metals and Alloys: A Comprehensive Review on Microstructural Evolution. Prog. Mater. Sci. 2021, 117, 100752. [Google Scholar] [CrossRef]
- Meng, X.; Huang, Y.; Cao, J.; Shen, J.; dos Santos, J.F. Recent Progress on Control Strategies for Inherent Issues in Friction Stir Welding. Prog. Mater. Sci. 2021, 115, 100706. [Google Scholar] [CrossRef]
- Babu, S.R.; Hudgikar, S.R.K.; Sekhar, Y.P. Experimental Investigation on Friction Stir Welding of Hdpe Reinforced with Sic and Al and Taguchi-Based Optimization. In Advances in Applied Mechanical Engineering; Springer: Singapore, 2020. [Google Scholar] [CrossRef]
- Kumar, D.; Kumar, J. Optimization of Parameters in Friction Stir Welding of Aa6101-T6 by Taguchi Approach. In Advanced Engineering Optimization through Intelligent Techniques; Springer: Singapore, 2020. [Google Scholar] [CrossRef]
- Shunmugasundaram, M.; Kumar, A.P.; Sankar, L.P.; Sivasankar, S. Optimization of Process Parameters of Friction Stir Welded Dissimilar Aa6063 and Aa5052 Aluminum Alloys by Taguchi Technique. Mater. Today Proc. 2020, 27, 871–876. [Google Scholar] [CrossRef]
- Dhabale, R.B.; Jatti, V.S. Experimental Study of Defects and Mechanical Properties During under-Water Friction Stir Welding of Al6061-6063 Alloys. In Techno-Societal 2018; Springer Nature: Cham, Switzerland, 2020. [Google Scholar] [CrossRef]
- Ramesh, N.R.; Kumar, V.S. Experimental Erosion-Corrosion Analysis of Friction Stir Welding of Aa 5083 and Aa 6061 for Sub-Sea Applications. Appl. Ocean Res. 2020, 98, 102121. [Google Scholar] [CrossRef]
- Heidarzadeh, A.; Javidani, M.; Mofarrehi, M.; Farzaneh, A.; Chen, X. Submerged Dissimilar Friction Stir Welding of Aa6061 and Aa7075 Aluminum Alloys: Microstructure Characterization and Mechanical Property. Metals 2021, 11, 1592. [Google Scholar] [CrossRef]
- Senthil, S.M.; Parameshwaran, R.; Nathan, S.R.; Kumar, M.B.; Deepandurai, K. A Multi-Objective Optimization of the Friction Stir Welding Process Using Rsm-Based-Desirability Function Approach for Joining Aluminum Alloy 6063-T6 Pipes. Struct. Multidiscip. Optim. 2020, 62, 1117–1133. [Google Scholar] [CrossRef]
- Sasikumar, A.; Gopi, S.; Kumar, M.S.; Selvarajan, L. Predicting Tensile Strength of Filler Added Friction Stir Welded Aa6082 and Aa5052 Dissimilar Joint. Mater. Today Proc. 2020, 46, 9207–9211. [Google Scholar] [CrossRef]
- Huang, Y.; Xie, Y.; Meng, X.; Li, J.; Zhou, L. Joint Formation Mechanism of High Depth-to-Width Ratio Friction Stir Welding. J. Mater. Sci. Technol. 2019, 35, 1261–1269. [Google Scholar] [CrossRef]
- Huang, Y.; Xie, Y.; Meng, X.; Lv, Z.; Cao, J. Numerical Design of High Depth-to-Width Ratio Friction Stir Welding. J. Mater. Processing Technol. 2018, 252, 233–241. [Google Scholar] [CrossRef]
- Heidarzadeh, A.; Testik, Ö.M.; Güleryüz, G.; Barenji, R.V. Development of a Fuzzy Logic Based Model to Elucidate the Effect of Fsw Parameters on the Ultimate Tensile Strength and Elongation of Pure Copper Joints. J. Manuf. Processes 2020, 53, 250–259. [Google Scholar] [CrossRef]
- Eren, B.; Guvenc, M.A.; Mistikoglu, S. Artificial Intelligence Applications for Friction Stir Welding: A Review. Met. Mater. Int. 2021, 27, 193–219. [Google Scholar] [CrossRef]
- Dao, M.; Chollacoop, N.; Van Vliet, K.J.; Venkatesh, T.A.; Suresh, S. Computational Modeling of the Forward and Reverse Problems in Instrumented Sharp Indentation. Acta Mater. 2001, 49, 3899–3918. [Google Scholar] [CrossRef] [Green Version]
- Xie, Y.; Meng, X.; Chang, Y.; Mao, D.; Yang, Y.; Xu, Y.; Wan, L.; Huang, Y. Ameliorating Strength-Ductility Efficiency of Graphene Nanoplatelet-Reinforced Aluminum Composites Via Deformation-Driven Metallurgy. Compos. Sci. Technol. 2022, 219, 109225. [Google Scholar] [CrossRef]
- Xie, Y.; Meng, X.; Li, Y.; Mao, D.; Wan, L.; Huang, Y. Insight into Ultra-Refined Grains of Aluminum Matrix Composites Via Deformation-Driven Metallurgy. Compos. Commun. 2021, 26, 100776. [Google Scholar] [CrossRef]
- Zuiko, I.; Kaibyshev, R. Deformation Structures and Strengthening Mechanisms in an Al-Cu Alloy Subjected to Extensive Cold Rolling. Mater. Sci. Eng. A 2017, 702, 53–64. [Google Scholar] [CrossRef]
- Tian, Y.Z.; Gao, S.; Zhao, L.J.; Lu, S.; Pippan, R.; Zhang, Z.F.; Tsuji, N. Remarkable Transitions of Yield Behavior and Lüders Deformation in Pure Cu by Changing Grain Sizes. Scr. Mater. 2018, 142, 88–91. [Google Scholar] [CrossRef]
- Heidarzadeh, A. Tensile Behavior, Microstructure, and Substructure of the Friction Stir Welded 70/30 Brass Joints: Rsm, Ebsd, and Tem Study. Arch. Civ. Mech. Eng. 2019, 19, 137–146. [Google Scholar] [CrossRef]
- Starink, M.J.; Deschamps, A.; Wang, S.C. The Strength of Friction Stir Welded and Friction Stir Processed Aluminium Alloys. Scr. Mater. 2008, 58, 377–382. [Google Scholar] [CrossRef] [Green Version]
- Heidarzadeh, A.; Laleh, H.M.; Gerami, H.; Hosseinpour, P.; Shabestari, M.J.; Bahari, R. The Origin of Different Microstructural and Strengthening Mechanisms of Copper and Brass in Their Dissimilar Friction Stir Welded Joint. Mater. Sci. Eng. A 2018, 735, 336–342. [Google Scholar] [CrossRef]


| Parameters | Unit | Levels | ||||
|---|---|---|---|---|---|---|
| −1.68 | −1 | 0 | 1 | 1.68 | ||
| Rotational speed (A) | rpm | 463 | 600 | 800 | 1000 | 1136 |
| Traverse speed (B) | mm/min | 16 | 50 | 100 | 150 | 184 |
| Axial force (C) | kN | 1.66 | 2 | 2.5 | 3 | 3.34 |
| Run | Rotational Speed (rpm) | Traverse Speed (mm/min) | Axial Force (kN) |
|---|---|---|---|
| 1 | 600 | 50 | 2 |
| 2 | 1000 | 50 | 2 |
| 3 | 600 | 150 | 2 |
| 4 | 1000 | 150 | 2 |
| 5 | 600 | 50 | 3 |
| 6 | 1000 | 50 | 3 |
| 7 | 600 | 150 | 3 |
| 8 | 1000 | 150 | 3 |
| 9 | 463 | 100 | 2.5 |
| 10 | 1136 | 100 | 2.5 |
| 11 | 800 | 16 | 2.5 |
| 12 | 800 | 184 | 2.5 |
| 13 | 800 | 100 | 1.66 |
| 14 | 800 | 100 | 3.34 |
| 15 | 800 | 100 | 2.5 |
| 16 | 800 | 100 | 2.5 |
| 17 | 800 | 100 | 2.5 |
| 18 | 800 | 100 | 2.5 |
| 19 | 800 | 100 | 2.5 |
| 20 | 800 | 100 | 2.5 |
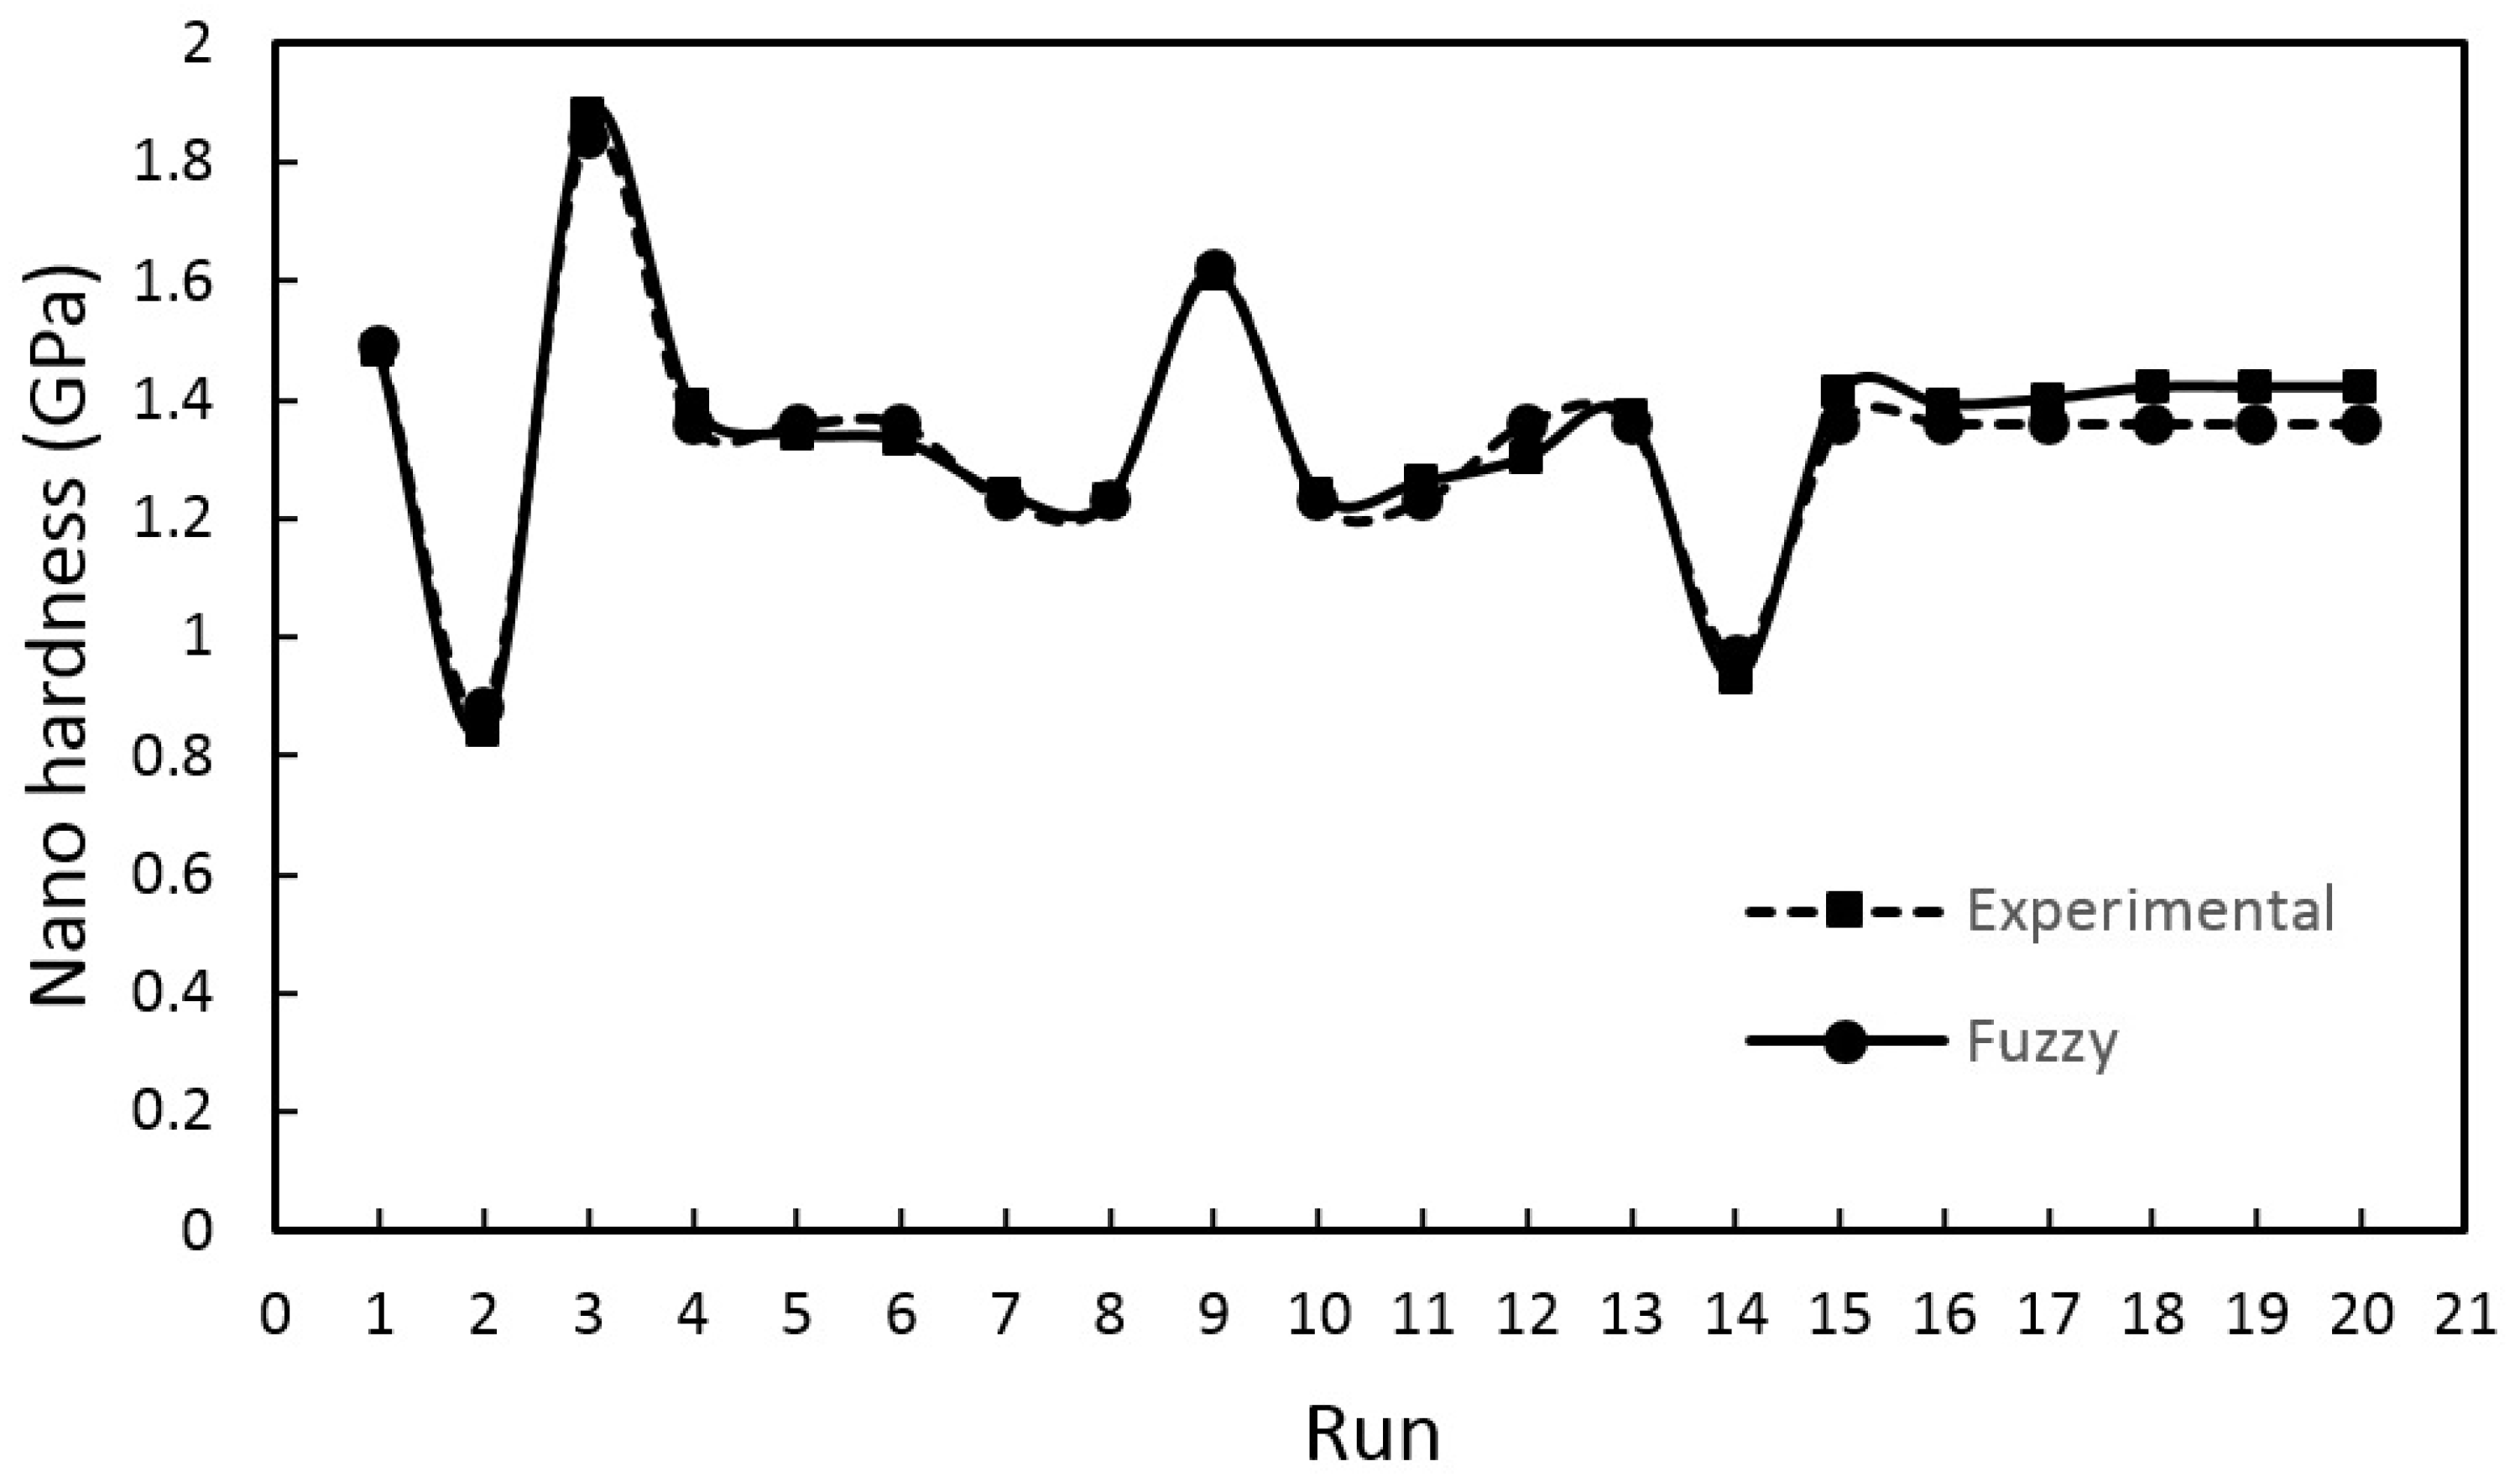
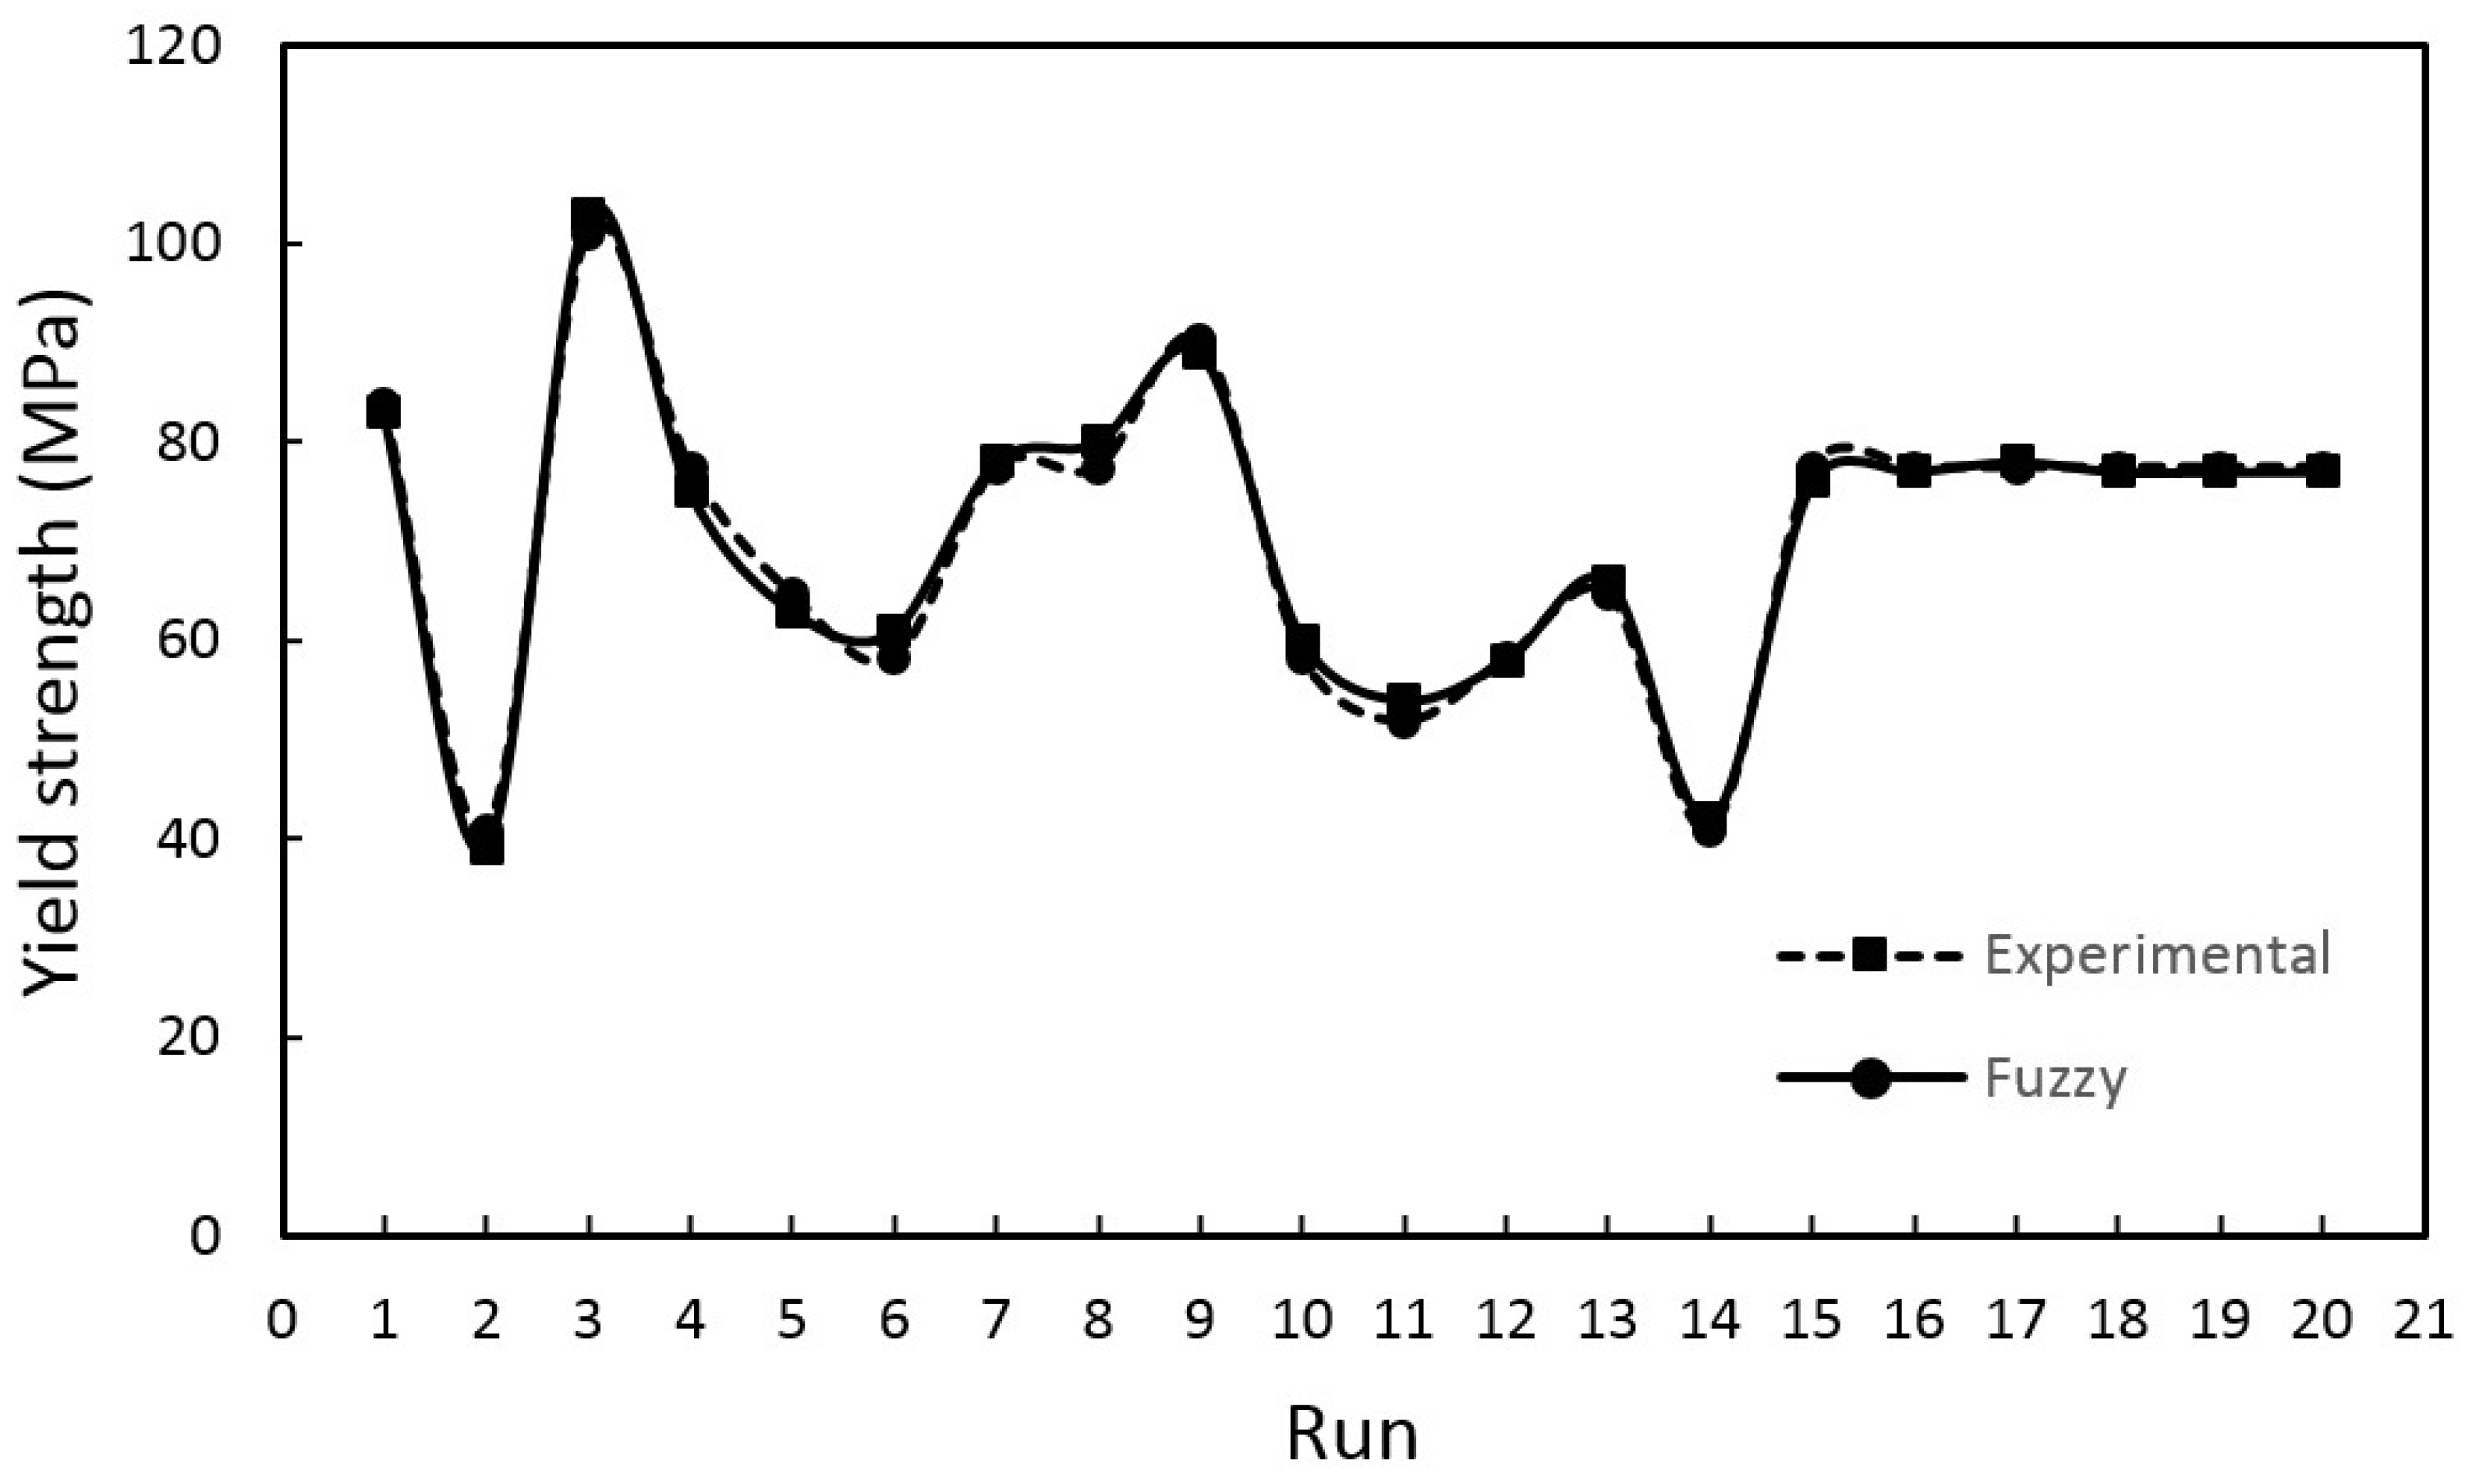
| Run | Micro-Hardness (HV) | Fuzzy Micro-Hardness (HV) | Nano-Hardness (GPa) | Fuzzy Nano-Hardness (GPa) | Yield Strength (MPa) | Fuzzy Yield Strength (MPa) |
|---|---|---|---|---|---|---|
| 1 | 75 | 72.7 | 1.48 | 1.49 | 83 | 83.8 |
| 2 | 58 | 57.8 | 0.84 | 0.88 | 39 | 40.9 |
| 3 | 108 | 105 | 1.88 | 1.84 | 103 | 101 |
| 4 | 79 | 81.5 | 1.39 | 1.36 | 75 | 77.4 |
| 5 | 75 | 72.7 | 1.34 | 1.36 | 78 | 64.6 |
| 6 | 62 | 63.8 | 1.33 | 1.36 | 61 | 58.2 |
| 7 | 70 | 72.7 | 1.24 | 1.23 | 63 | 77.4 |
| 8 | 67 | 63.8 | 1.23 | 1.23 | 80 | 77.4 |
| 9 | 97 | 99.2 | 1.61 | 1.62 | 89 | 90.2 |
| 10 | 62 | 63.8 | 1.24 | 1.23 | 60 | 58.2 |
| 11 | 63 | 63.8 | 1.26 | 1.23 | 54 | 51.8 |
| 12 | 69 | 72.7 | 1.3 | 1.36 | 58 | 58.2 |
| 13 | 71 | 72.7 | 1.37 | 1.36 | 66 | 64.6 |
| 14 | 55 | 57.8 | 0.93 | 0.97 | 42 | 40.9 |
| 15 | 74 | 72.7 | 1.41 | 1.36 | 76 | 77.4 |
| 16 | 74 | 72.7 | 1.39 | 1.36 | 77 | 77.4 |
| 17 | 75 | 72.7 | 1.4 | 1.36 | 78 | 77.4 |
| 18 | 75 | 72.7 | 1.42 | 1.36 | 77 | 77.4 |
| 19 | 75 | 72.7 | 1.42 | 1.36 | 77 | 77.4 |
| 20 | 78 | 81.5 | 1.42 | 1.36 | 77 | 77.4 |
| Response | Goal | Lower | Target | Upper |
|---|---|---|---|---|
| Micro-hardness (HV) | Maximum | 57.8 | 104 | 105 |
| Nano-hardness (Gpa) | Maximum | 0.88 | 1.85 | 1.84 |
| Yield strength (Mpa) | Maximum | 40.9 | 100 | 101 |
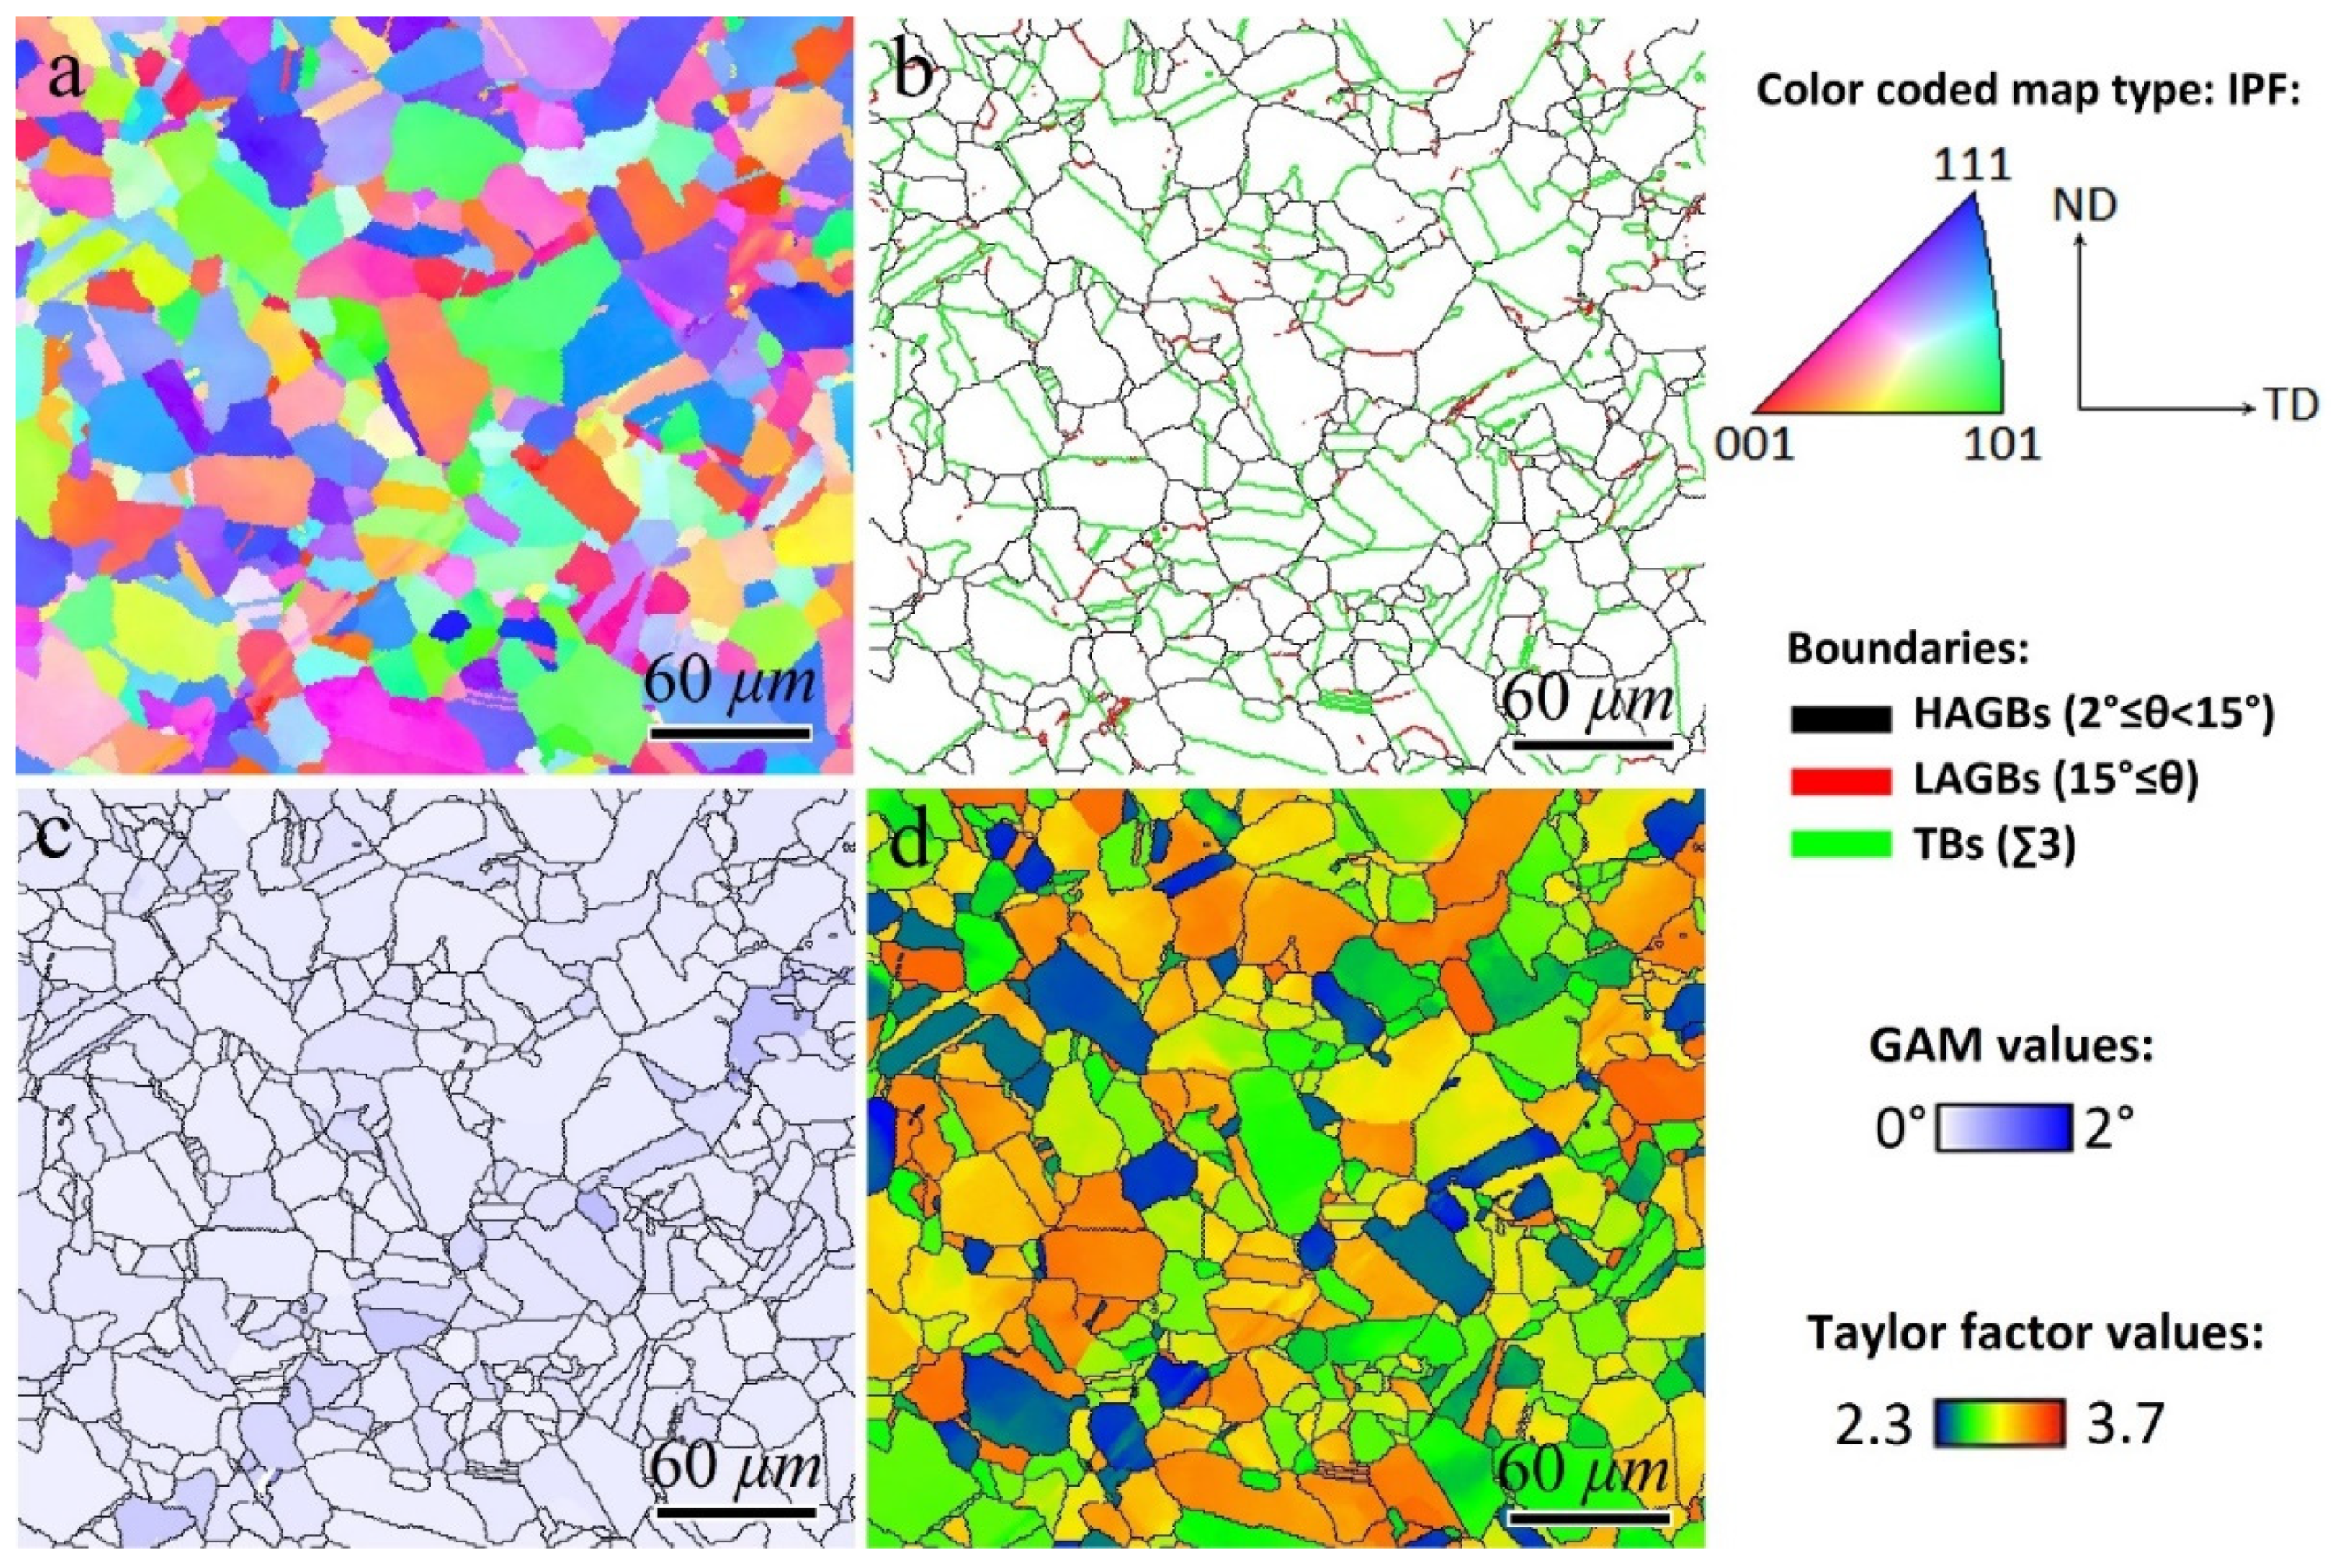
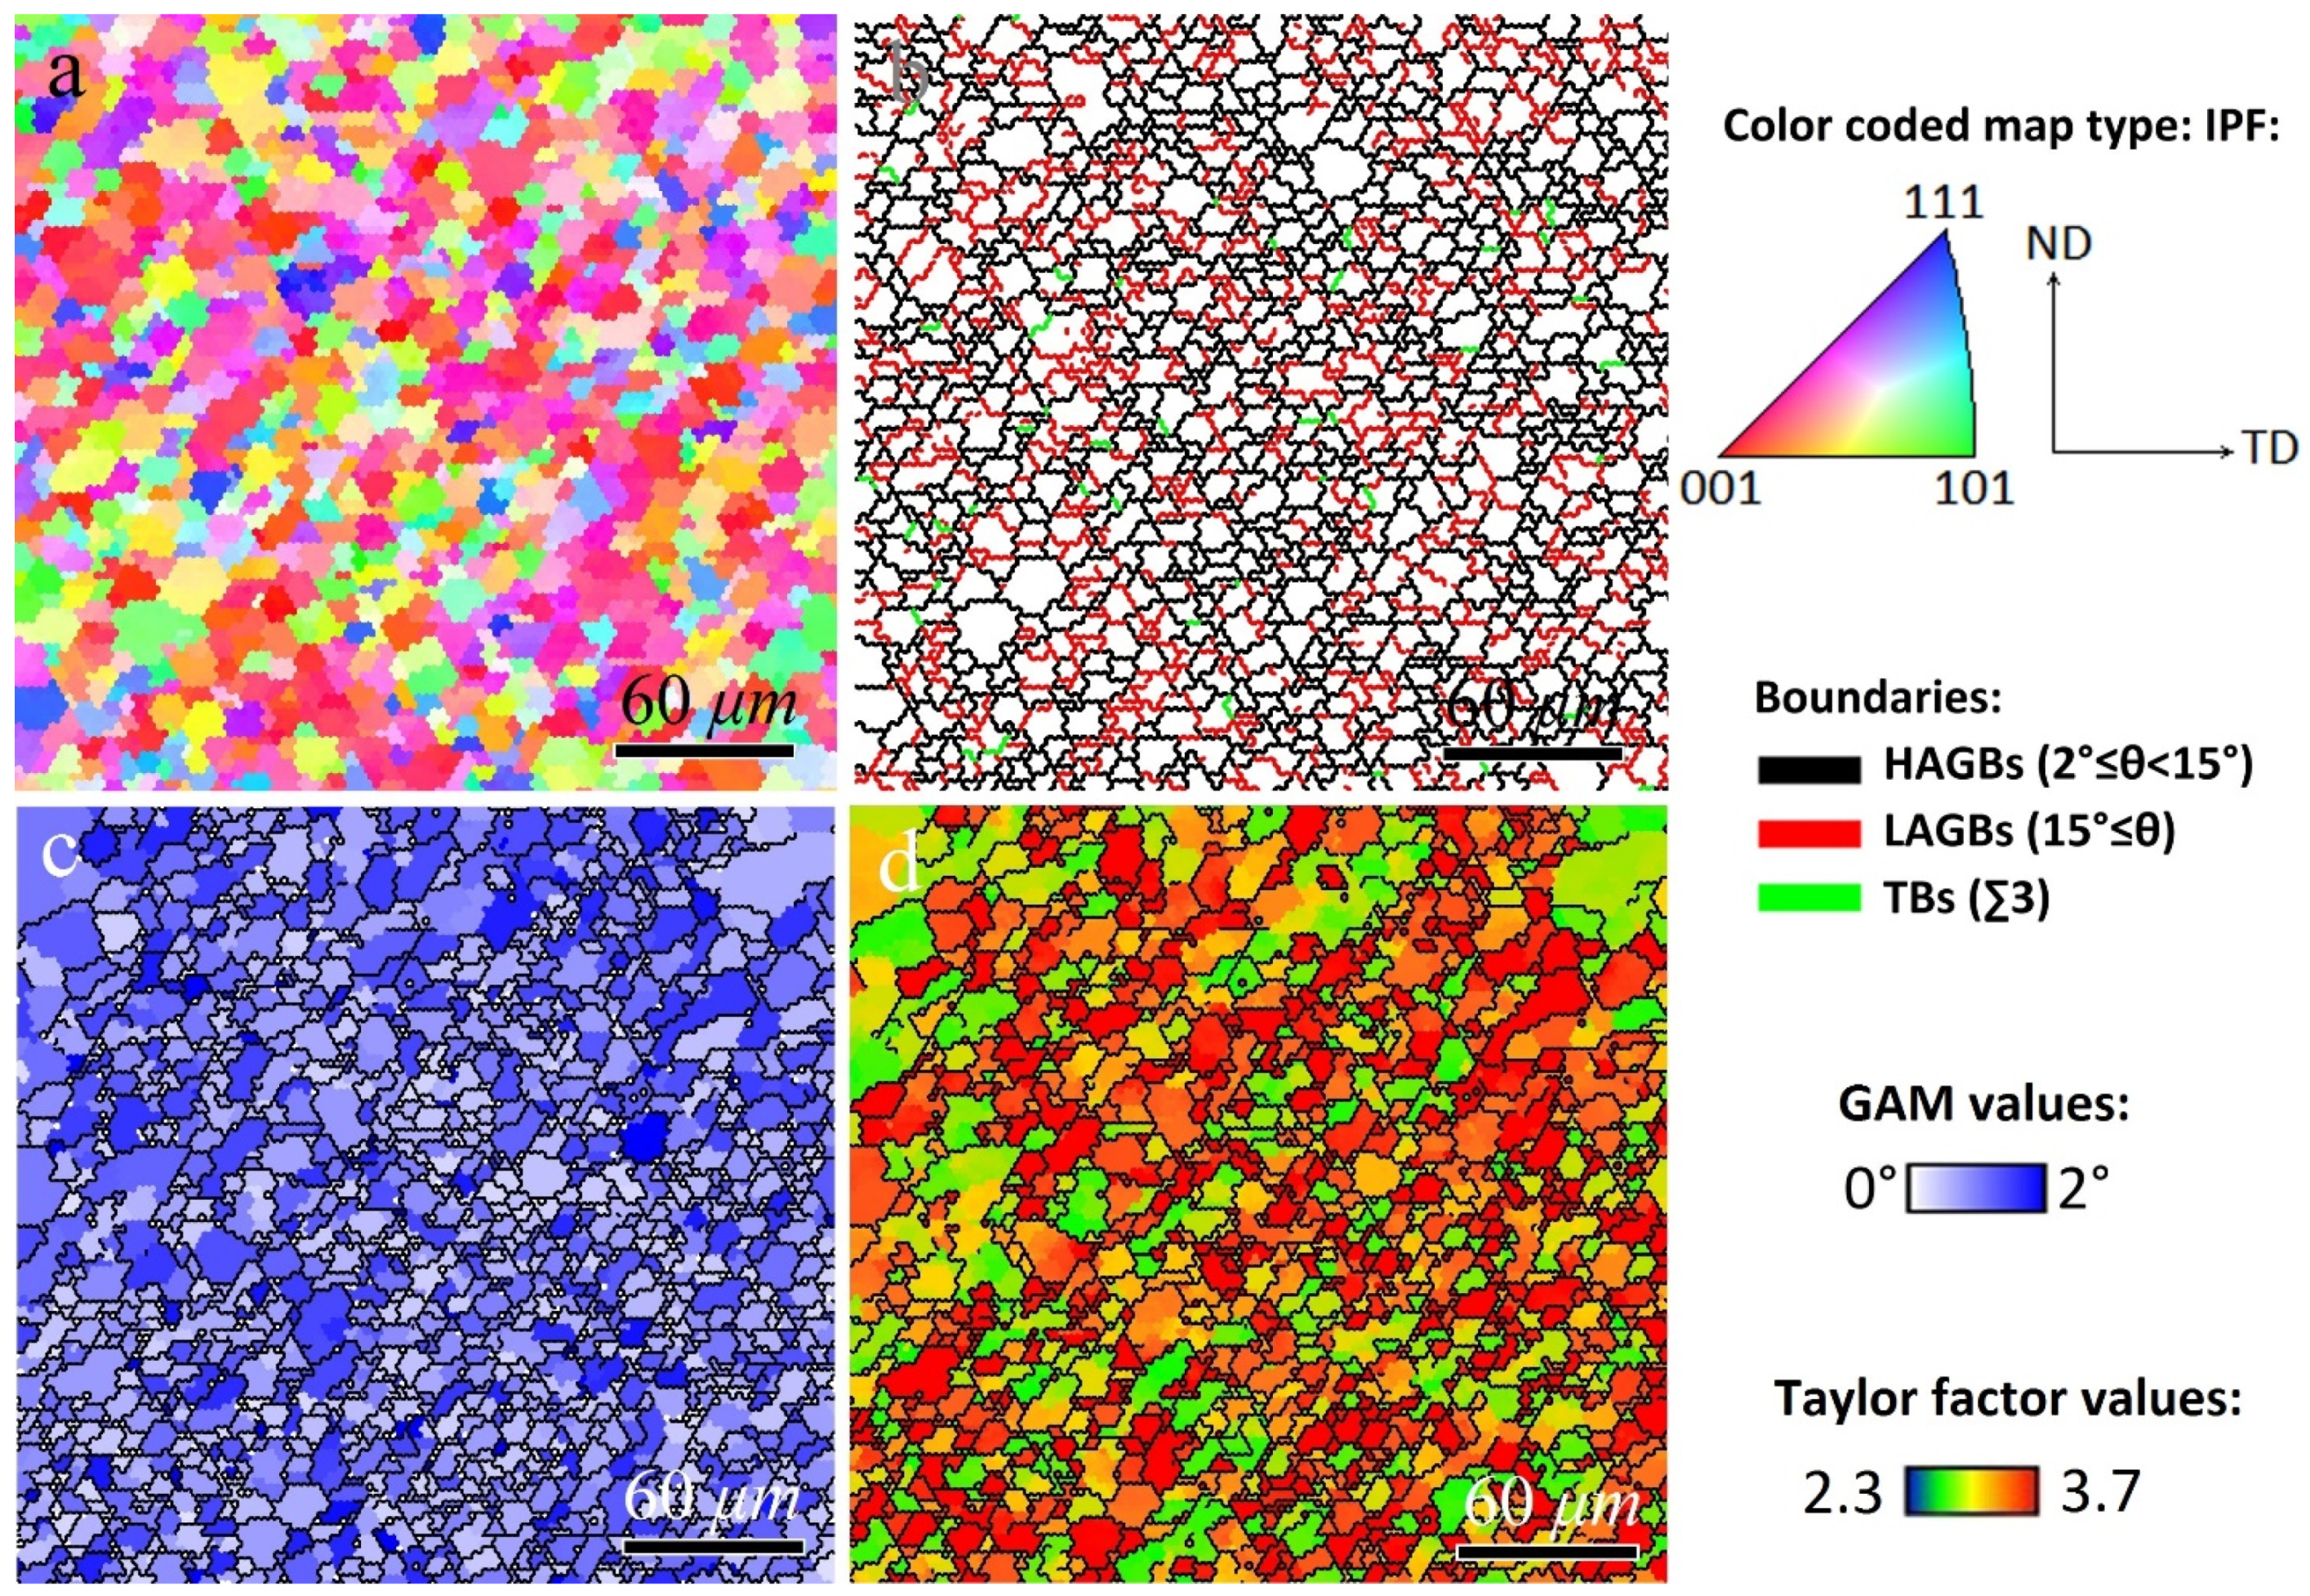
| Sample | Grain Size (μm) | HAGB (mm) | Average GAM Value | Average Taylor Factor | Peak Temperature (°C) |
|---|---|---|---|---|---|
| Run 2 (high heat input) | 26.9 | 5.01 | 0.56 | 2.8 | 450 |
| Run 5 (low heat input) | 12.1 | 8.72 | 1.82 | 3.2 | 310 |
Publisher’s Note: MDPI stays neutral with regard to jurisdictional claims in published maps and institutional affiliations. |
© 2022 by the authors. Licensee MDPI, Basel, Switzerland. This article is an open access article distributed under the terms and conditions of the Creative Commons Attribution (CC BY) license (https://creativecommons.org/licenses/by/4.0/).
Share and Cite
Javidani, M.; Heidarzadeh, A.; Vatankhah Barenji, R.; Paidar, M.; Jafarian, H.R. Unraveling the Relationship between Microstructure and Mechanical Properties of Friction Stir-Welded Copper Joints by Fuzzy Logic Neural Networks. Crystals 2022, 12, 216. https://doi.org/10.3390/cryst12020216
Javidani M, Heidarzadeh A, Vatankhah Barenji R, Paidar M, Jafarian HR. Unraveling the Relationship between Microstructure and Mechanical Properties of Friction Stir-Welded Copper Joints by Fuzzy Logic Neural Networks. Crystals. 2022; 12(2):216. https://doi.org/10.3390/cryst12020216
Chicago/Turabian StyleJavidani, Mousa, Akbar Heidarzadeh, Reza Vatankhah Barenji, Moslem Paidar, and Hamid Reza Jafarian. 2022. "Unraveling the Relationship between Microstructure and Mechanical Properties of Friction Stir-Welded Copper Joints by Fuzzy Logic Neural Networks" Crystals 12, no. 2: 216. https://doi.org/10.3390/cryst12020216