Article

Study on Gemological Characteristics and Inclusions of Yellow Topaz

1
School of Gemology, China University of Geosciences, Beijing 100083, China
2
Beijing Key Laboratory of Materials Utilization of Nonmetallic Minerals and Solid Wastes, National Laboratory of Mineral Materials, School of Materials Sciences and Technology, China University of Geosciences, Beijing 100083, China
*
Authors to whom correspondence should be addressed.
Crystals 2022, 12(12), 1746; https://doi.org/10.3390/cryst12121746
Submission received: 31 October 2022 / Revised: 25 November 2022 / Accepted: 28 November 2022 / Published: 2 December 2022
(This article belongs to the Section Mineralogical Crystallography and Biomineralization)

Abstract

:
Topaz is a kind of mineral with variable composition and a common gemstone variety. Because of its wide distribution and rich colors, it has attracted the attention of scholars around the world. In this paper, the composition, spectral, and gemological characteristics of yellow topaz were systematically characterized, and the dark inclusions inside the samples were discussed and analyzed. The results show that the yellow topaz has a glassy luster, transparent, with a refractive index of 1.609–1.617 and a birefringence of 0.008. The topaz sample has columnar crystal shape and a typical rhomboid cross section. The infrared spectral characteristic absorption peaks of yellow topaz mainly appear near 3649, 3426, 950, 628, 550, and 457 cm−1. The characteristic absorption peaks for Raman spectra are mainly at 937, 404, and 267 cm−1. The UV-vis spectra of all samples only had strong absorption bands in the range of 200–300 nm. The results of XRF and EMPA showed that the contents of Al2O3 and SiO2 in the samples were 52.79 (wt%) and 29.55 (wt%), respectively, and it was reasonable to speculate that the chromogenic element of the yellow color was iron. The inclusions in yellow topaz samples are mainly fluid inclusions, healing cracks, and albite. This paper has enriched the gemological characteristics of topaz and can provide theoretical data for the research and marketization of topaz.

1. Introduction

Topaz is a kind of transparent gemstone with glassy luster, which belongs to the orthorhombic system. The chemical formula of the most common variety of topaz is Al2[SiO4] (F, OH)2, in which the substitution of fluorine by hydroxyl will lead to changes in specific gravity, birefringence, optical axial angle, and crystal axial ratio. It usually develops into a fine crystal form or water-worn cobblestone, and it is associated with tourmaline, quartz, fluorite, apatite, beryl, and wolframite [1].
At present, the research on topaz mainly focuses on color improvement, color mechanism, and mineralogical characteristics [2,3,4,5]. Skvortsova et al. used the infrared, Raman, and UV-Visible absorption spectra to investigate the effect of irradiation on natural topaz crystals from Ukraine. It was found that irradiated topaz has blue color and a characteristic UV-visible absorption band around 230~620 nm, and they assume that the blue color is associated with the presence of impurities of Cr3+, Fe2+, and Mn2+ ions [2]. By paramagnetic resonance of metal ions, Dickinson et al. found that, in colored topaz, not the yellow, but the pink, produced by heating is caused by chromium. Both the natural yellow and blue and the heated and irradiated yellow are related to certain electronic defect centers in the crystal structure [5]. Qiu et al. has made a preliminary study and summary on the mineralogical characteristics of topaz in Taishan, Guangdong, China [3]. Zhou et al. systematically analyzed the geological characteristics of topaz produced in large tungsten-sn quartz vein deposits in Guangxi, China, which filling the gap in local topaz research [4]. However, there are few reports on the gemological characteristics and inclusions of natural yellow topaz.
Accordingly, the gemological characteristics and inclusions of yellow topaz were observed under gemstone microscope in this paper. Infrared, Raman and UV-Visible absorption spectra were used to explore the spectral characteristics of yellow topaz. The composition of yellow topaz was analyzed by XRF and EMPA. The coloration elements of yellow topaz were speculated preliminarily, and the mineral species of dark inclusions in yellow topaz were determined, which improved the related studies of yellow topaz and provided an experimental basis for the gemological characteristics and identification of topaz.

2. Materials and Methods
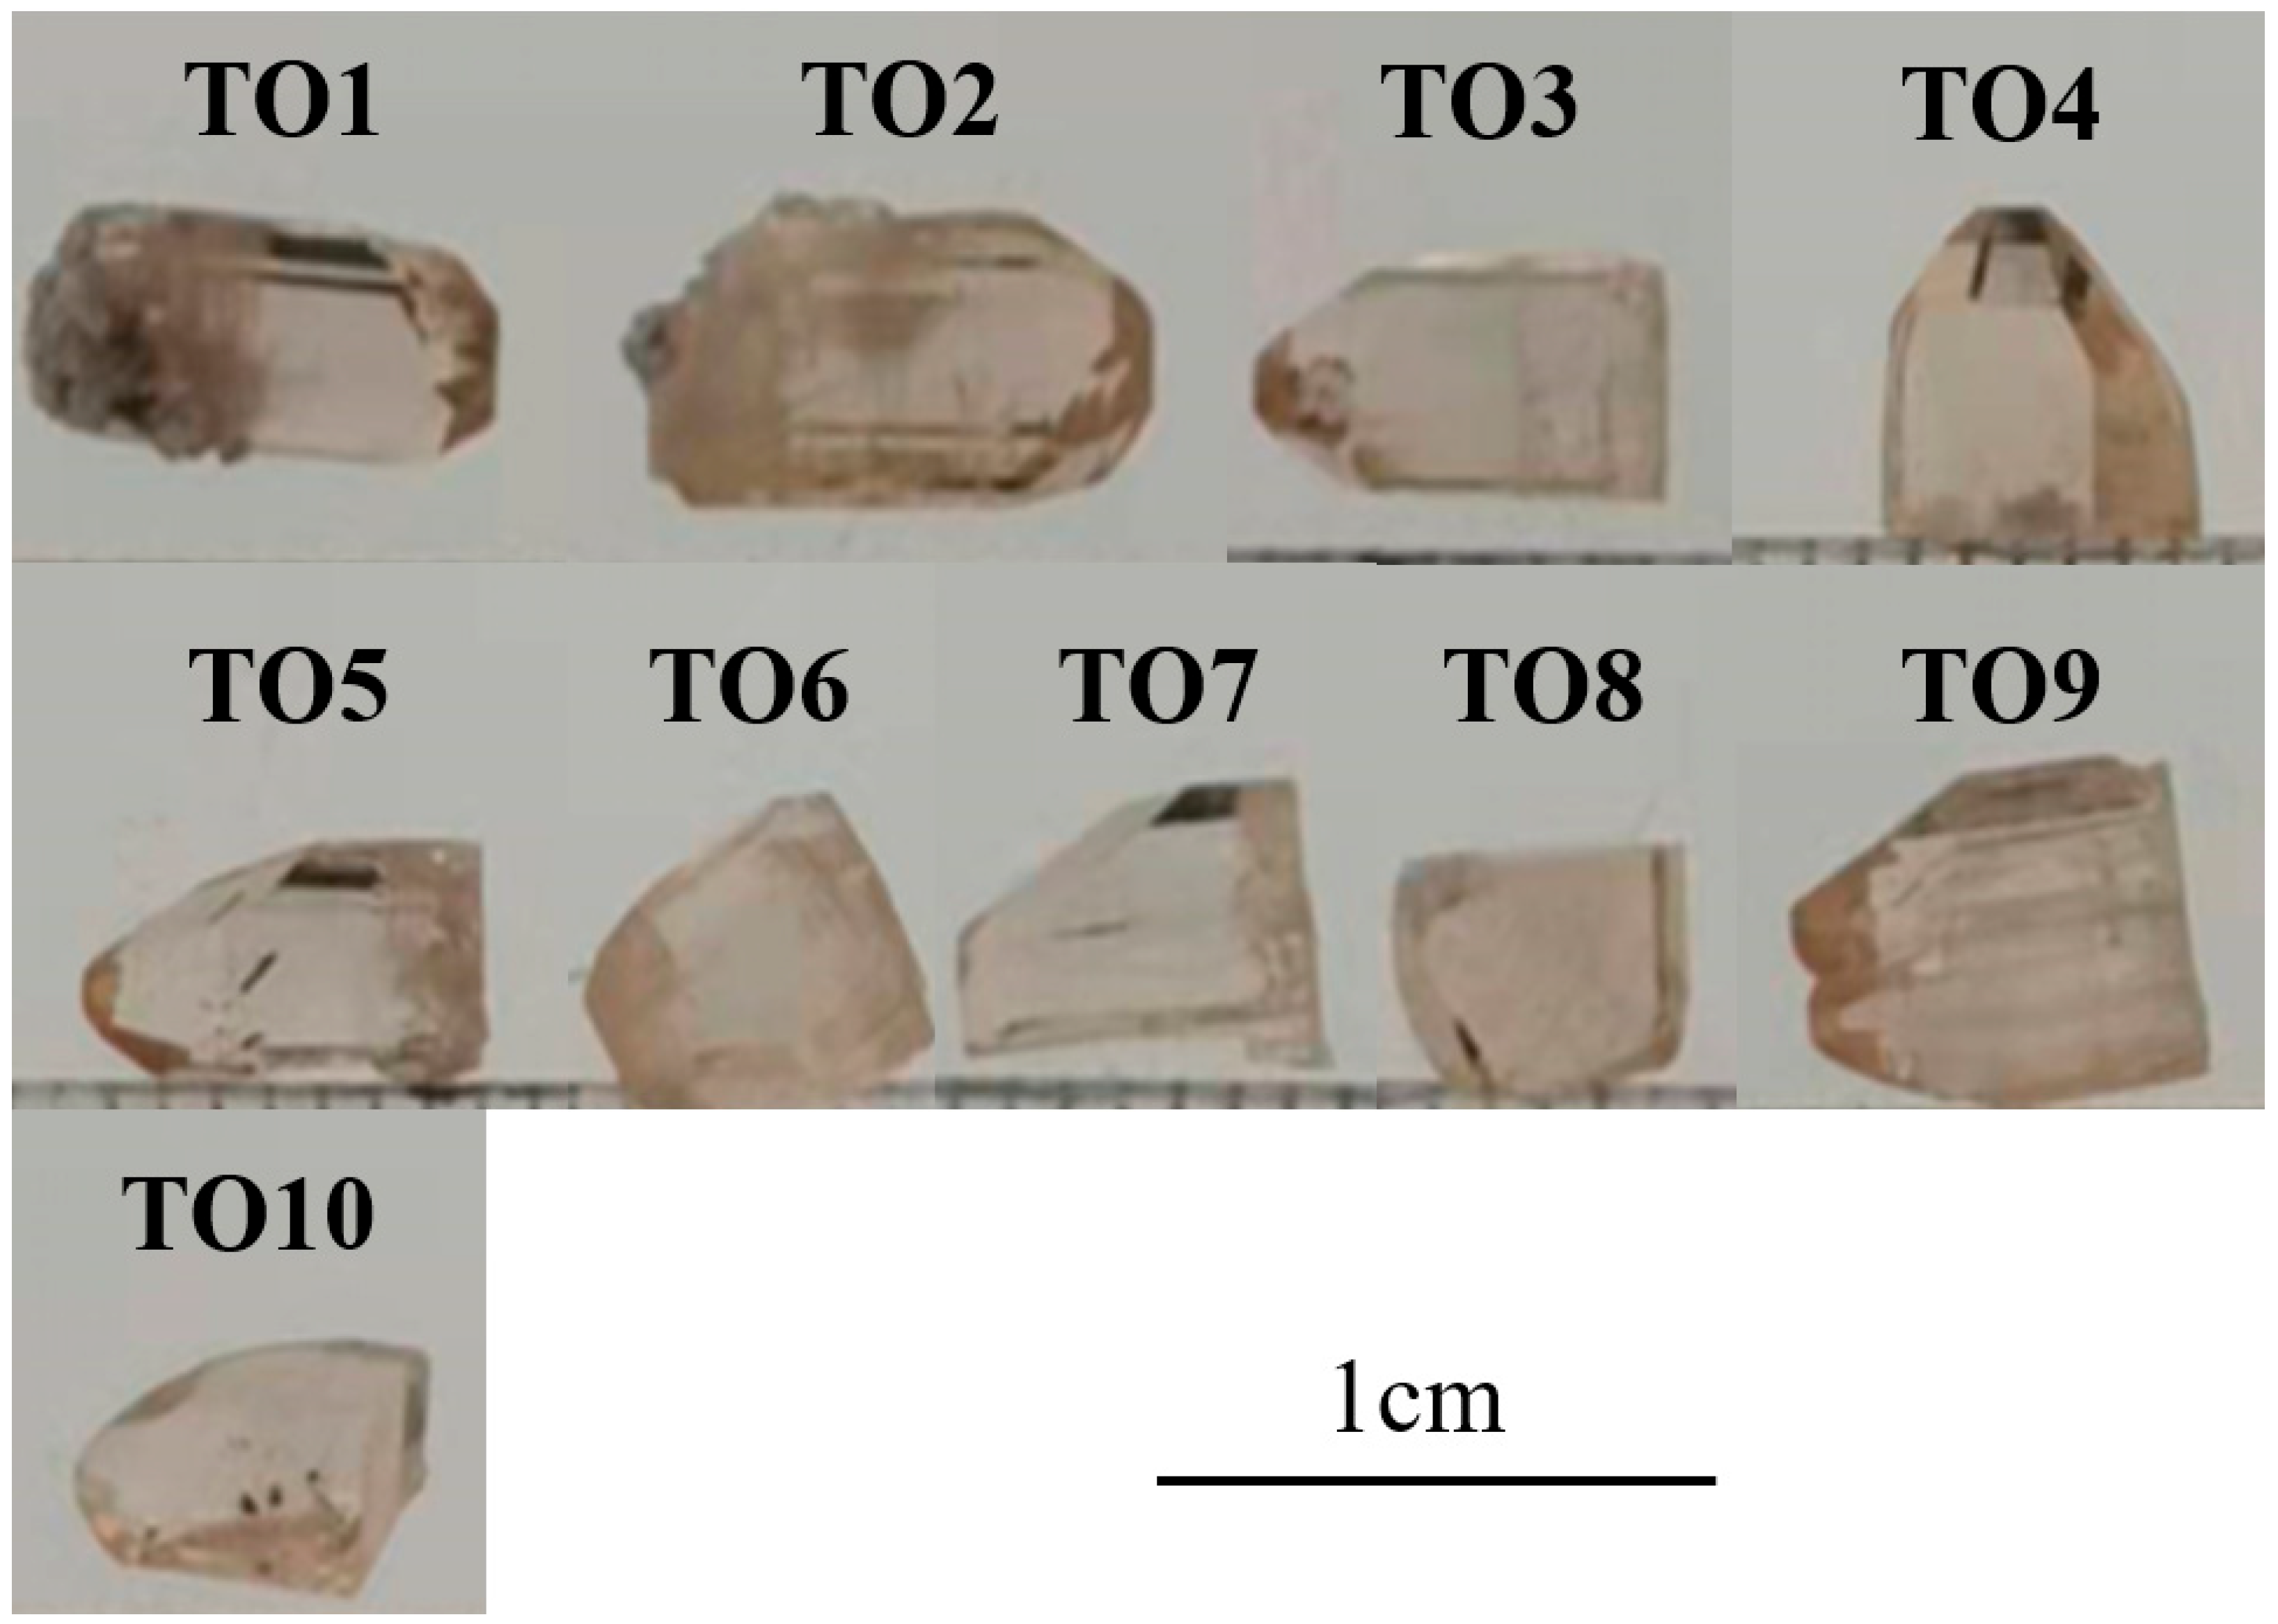
2.1. Materials

Figure 1 shows ten natural topaz samples from Utah, USA. The color of the ten samples is yellow.

2.2. Methods

Conventional gemological characteristics were determined at the Gemological Experimental Teaching Center, School of Gemmology, China University of Geosciences (Beijing) (CUGB). The refractive index was measured by point measurement using a gemstone refractometer. The specific gravity was measured using the hydrostatic weighing method, and the pleochroism was observed with a dichroscope. Microscopic observation was carried out using the GI-MP22 gemological photographic microscope.
Raman spectra were collected with the HR Evolution micro-Raman spectroscope produced by HORIBA, Japan, in the Gem Testing Laboratory at the School of Gemmology, CUGB. The excitation laser was 532 nm, and the scanning range was 100–3000 cm−1. The test environment was: room temperature 18 °C, humidity: 33%, 220 V, 10 A.
Infrared spectra were obtained by FT-IR Spectrometer Tensor 27, produced by Bruker, Germany, in the Gem Testing Laboratory at the School of Gemmology, CUGB. The scanning range was 400–2000 cm−1 (transmission) and 400–4000 cm−1 (reflection). The test environment was: room temperature 18 °C, humidity: 33%.
UV-Visible absorption spectra were collected with UV-3600 UV-VIS-NIR Spectrophotometer produced by Shimadzu, Japan, in the Gem Testing Laboratory at the School of Gemmology, CUGB. The scanning range was 200–800 nm. The test environment was: room temperature 18 °C, humidity: 33%. Sampling interval: 1.0 s.
XRF data were collected with an EDX-7000 XRF Spectrometer produced by Shimadzu, Japan, in the Gem Testing Laboratory at the School of Gemmology, CUGB. The test conditions were: vacuum, qualitative scanning, 1 mm.
EMPA data were collected with an EPMA-1720 produced by Shimadzu, Japan, in the Geoscience Test Center of CUGB. The test environment was: room temperature 17 °C, humidity: 33%. The test conditions were: 15 kV, 10 Na, beam spot diameter 5 μm.

3. Results and Discussion

3.1. Conventional Gemological Features

Table 1 shows the conventional gemological characteristics of yellow topaz. Ten yellow topaz samples were tested, and the refractive index of most samples was 1.609–1.617, and the birefringence index was 0.008. The relative density of the samples ranges from 3.421 to 3.583, which was consistent with the theoretical range of Topaz. The samples did not show obvious characteristic fluorescence under the UV light.
As shown in Figure 2a, the well developed contact twin crystal in parallel c-axis of sample TO9 can be clearly observed under the microscope. There are twinning striations developed on the interface of twin, and there is another topaz crystal overgrowth on the TO7 crystal surface (Figure 2a), one of which is floating on the other crystal along the {001} direction. The two crystals grow in the same direction, and the crystallographic orientations are parallel to each other. As shown in Figure 2c, evident cleavage of sample TO9 is perpendicular to the c-axis, and there is a set of {001} perfect cleavage.

3.2. Composition Analysis of Topaz

3.2.1. X-ray Fluorescence Spectrum Analysis

As shown in Supporting document S1-XRF, the main elements of topaz are Al, Si, and O. The ratio of silicon to aluminum is close to the theoretical value. However, the contents of main components Al2O3 and SiO2 in topaz are significantly different from the theoretical values of 55.4 and 32.6 (wt%) [6], and it was found that the difference is caused by the fact that the F element cannot be detected in the X-ray fluorescence spectrum. Among the impurities of topaz, aluminum ions do not show regular changes related to color, and barium ions do not belong to transition metals and do not cause color changes. In the XRF data, the content of iron is higher than that of other impurity elements, and when the yellow tone of topaz sample changes, the content of iron also increases or decreases, specifically showing that the yellow tone of topaz samples deepens, and their iron content gradually increases. Based on the data, the yellow tint of topaz was mainly affected by Fe, and the color of the topaz enhanced with the increase in iron content.

3.2.2. Electron Microprobe Analysis

In the qualitative and quantitative analysis of gem minerals, EMPA is a test method of great significance [3,7,8]. Compared with other test methods, it has higher accuracy in the analysis of micro-area compositions and more accurate test data results and can carry on the nondestructive test to the sample, which is very friendly to the gem research.
Two points of each sample to be tested were randomly selected for electron microprobe detection, and the detection results are shown in Supporting document S2-EMPA. EMPA data showed that F content ranged from 15.37 to 18.61 (wt%), and the average contents of Al2O3 and SiO2 are 52.788 and 29.552 (wt%), which has no significant difference with the theoretical value. This slight discrepancy is presumably due to the inability of the electron microprobe to detect light elements and hydroxyl.
In the infrared spectra and Raman spectra of yellow topaz in this study, some characteristic absorption peaks of the samples indicate that the content of OH in the sample is unusually rich, which leads to the sum of the EMPA data below 100% [2,9].

3.3. Spectroscopy Analysis of Topaz

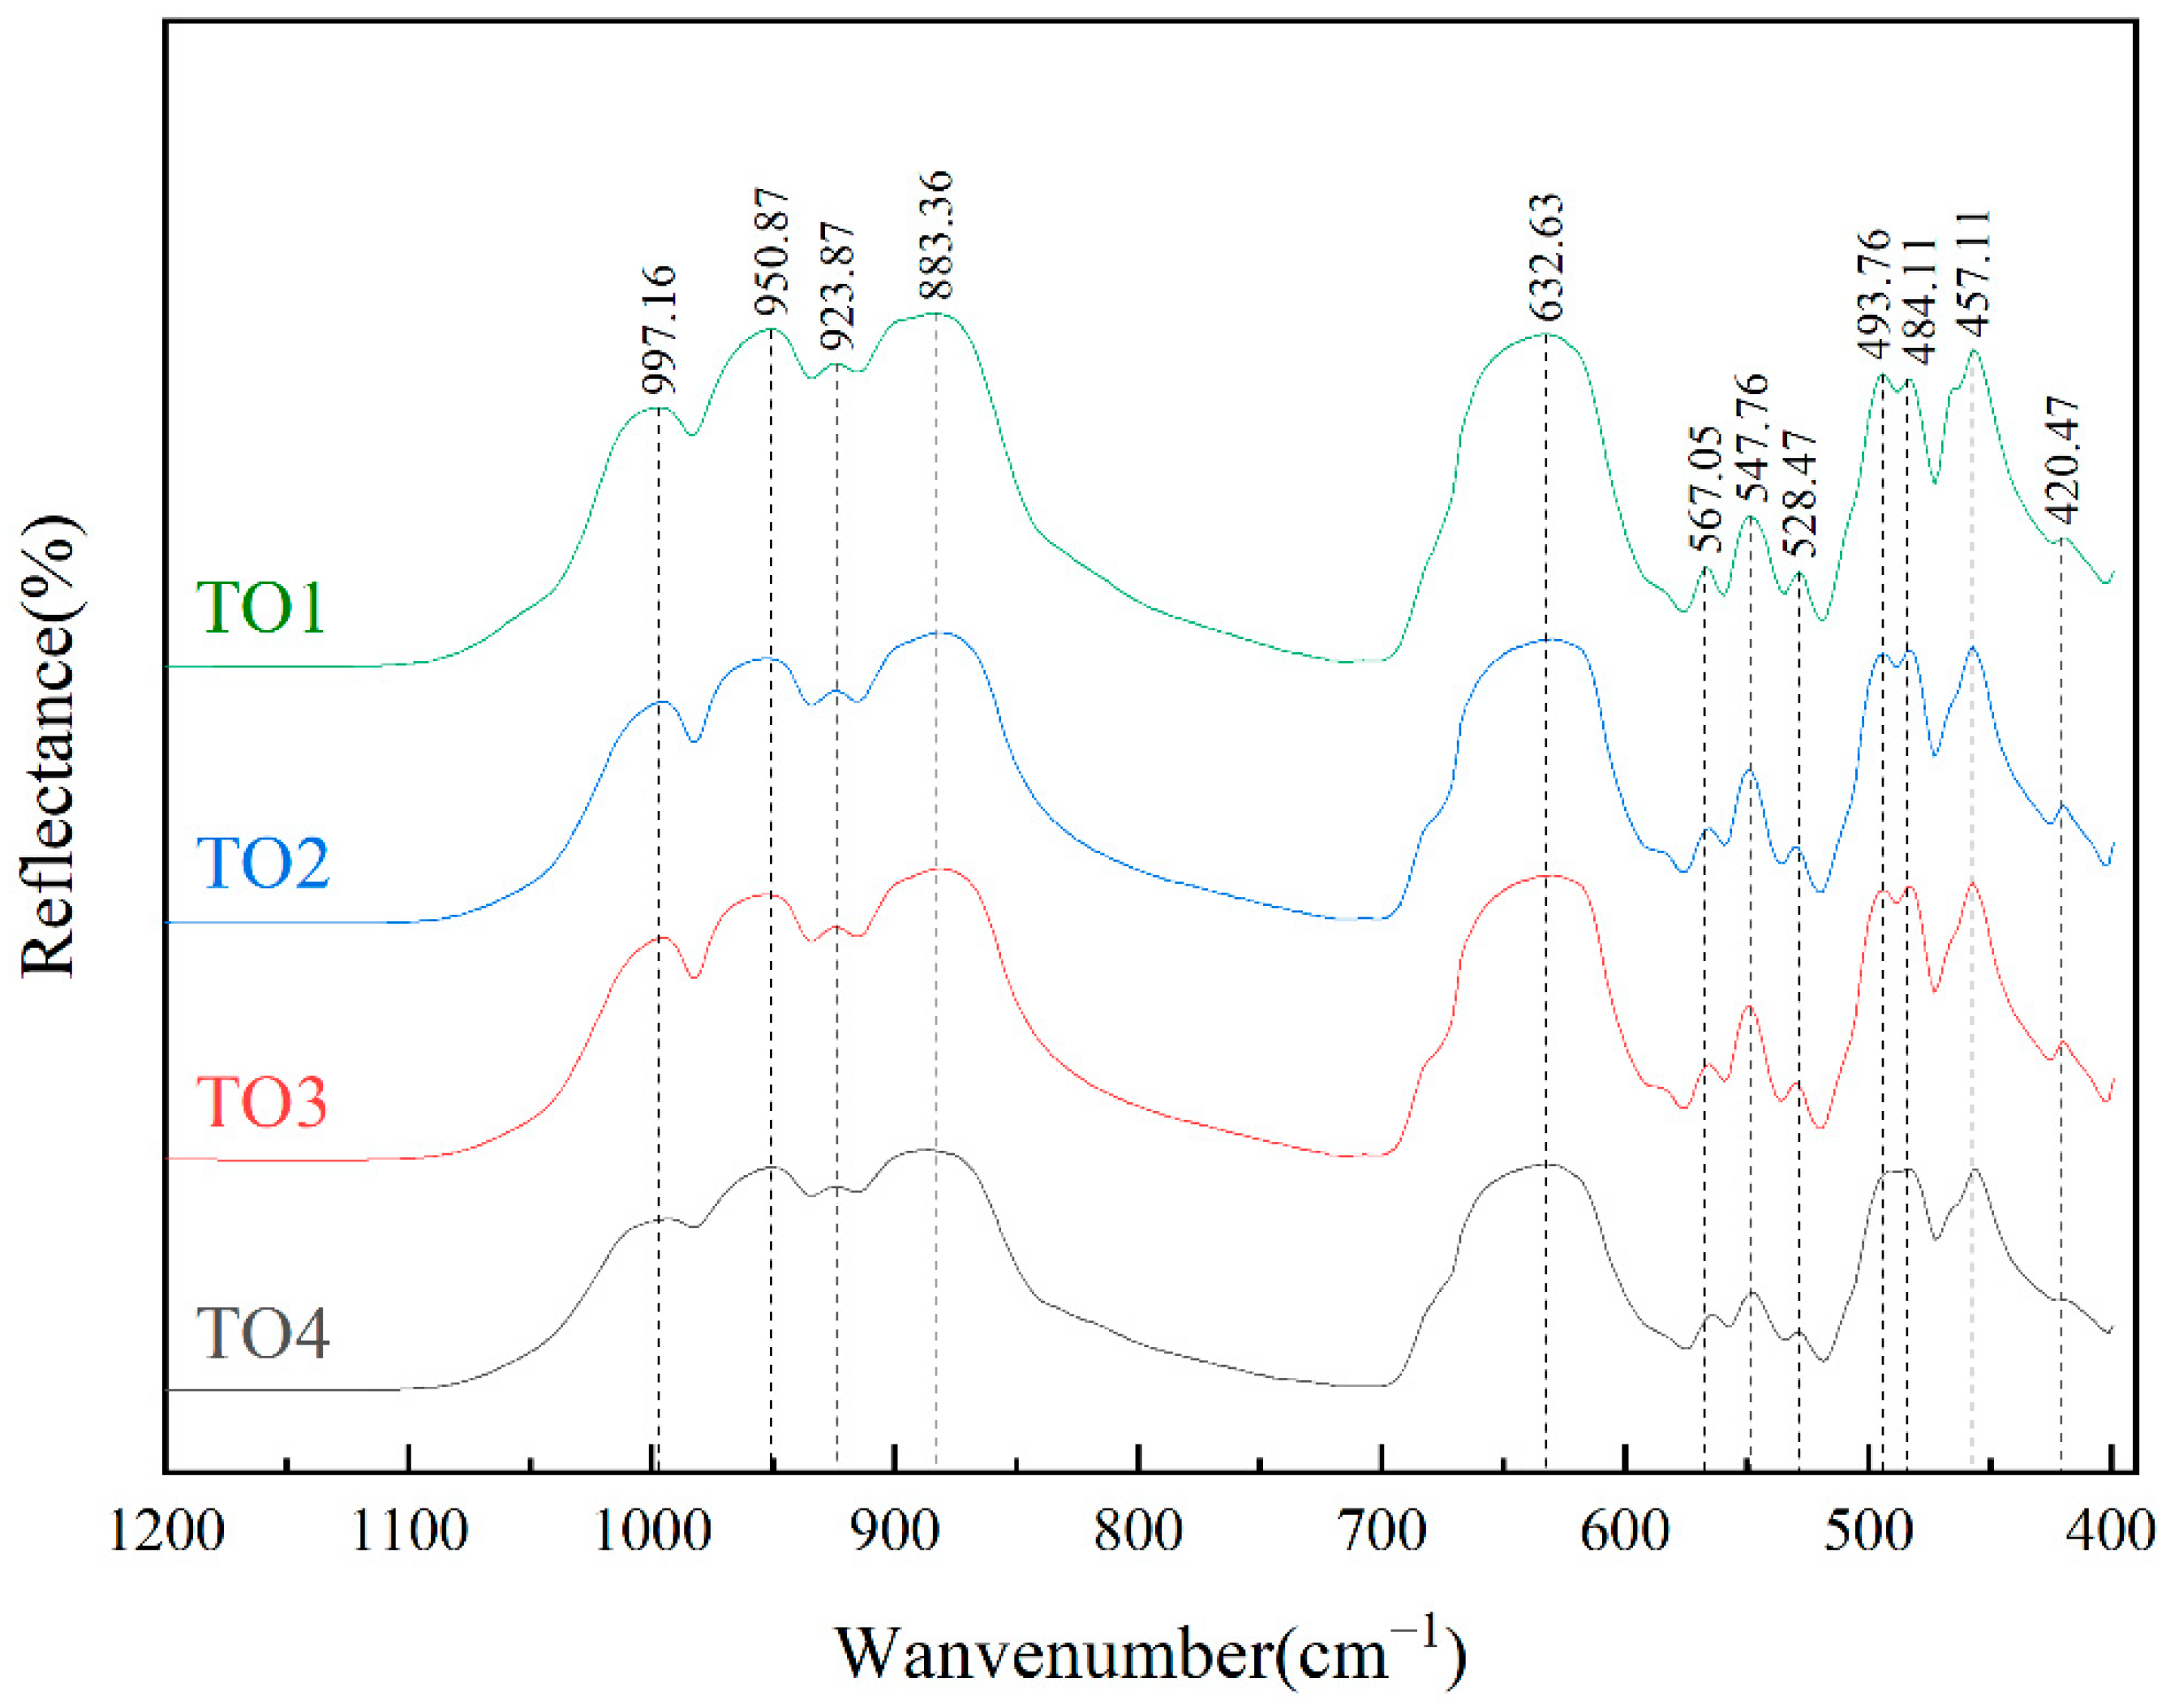
3.3.1. Infrared Spectra Analysis

The yellow topaz samples were tested by transmission and reflection methods, and the results are shown in Figure 3 and Figure 4. The infrared transmission spectra showed that the absorption peaks of yellow topaz samples mainly appeared in the range of 3700–3400 cm−1, and all samples had obvious strong absorption peaks near 3649 cm−1, and slightly weaker absorption peaks of 3426 cm−1 [10]. The absorption peaks at about 2600 cm−1 for TO1, TO4, and TO7 are relatively evident, while the absorption peaks of other samples were relatively weak near this point. In the infrared reflection spectra, strong absorption peaks were observed at 995, 950, 881, 628, 493, and 457 cm−1, while weak absorption peaks were observed at 550 cm−1. The infrared transmission spectra of all yellow topaz samples are slightly different, but generally the same.
Figure 3 shows a strong absorption peak near 3649 cm−1, which is the absorption peak of the symmetric stretching vibration of hydroxyl [11]. The absorption peak near 3426 cm−1 is directly related to the yellow-brown color of the sample, which also indicates the abnormal position of OH and excessively high OH content in samples [9]. In topaz (Al2[SiO4] (F, OH)2), silicon atoms and oxygen atoms together constitute the silicon–oxygen backbone, and the infrared absorption peak in the region from 400 cm−1 to 2000 cm−1 is mainly manifested by the vibration of Si-O atomic groups [9].
In Figure 4, the absorption peaks at 995, 950, and 923 cm−1 are the results of symmetric and asymmetric stretching vibrations of the Si-O group. In the nesosilicate structure of topaz, oxygen ions, fluoride ions, and hydroxide ions are parallel to the (010) crystal plane, showing the double hexagonal closest packed. The tetrahedral voids in the above structure are occupied by silicon ions, and the octahedral voids are occupied by aluminum ions. This structure of topaz approximates that the tetrahedra [SiO4] are related to each other by the octahedron [AlO4(F, OH)2]. As shown in Figure 3, the stretching vibration absorption peak of Al-O is near 881 cm−1, and the strong absorption peak caused by bending vibration of Al-O-Si is around 628 cm−1 [4].

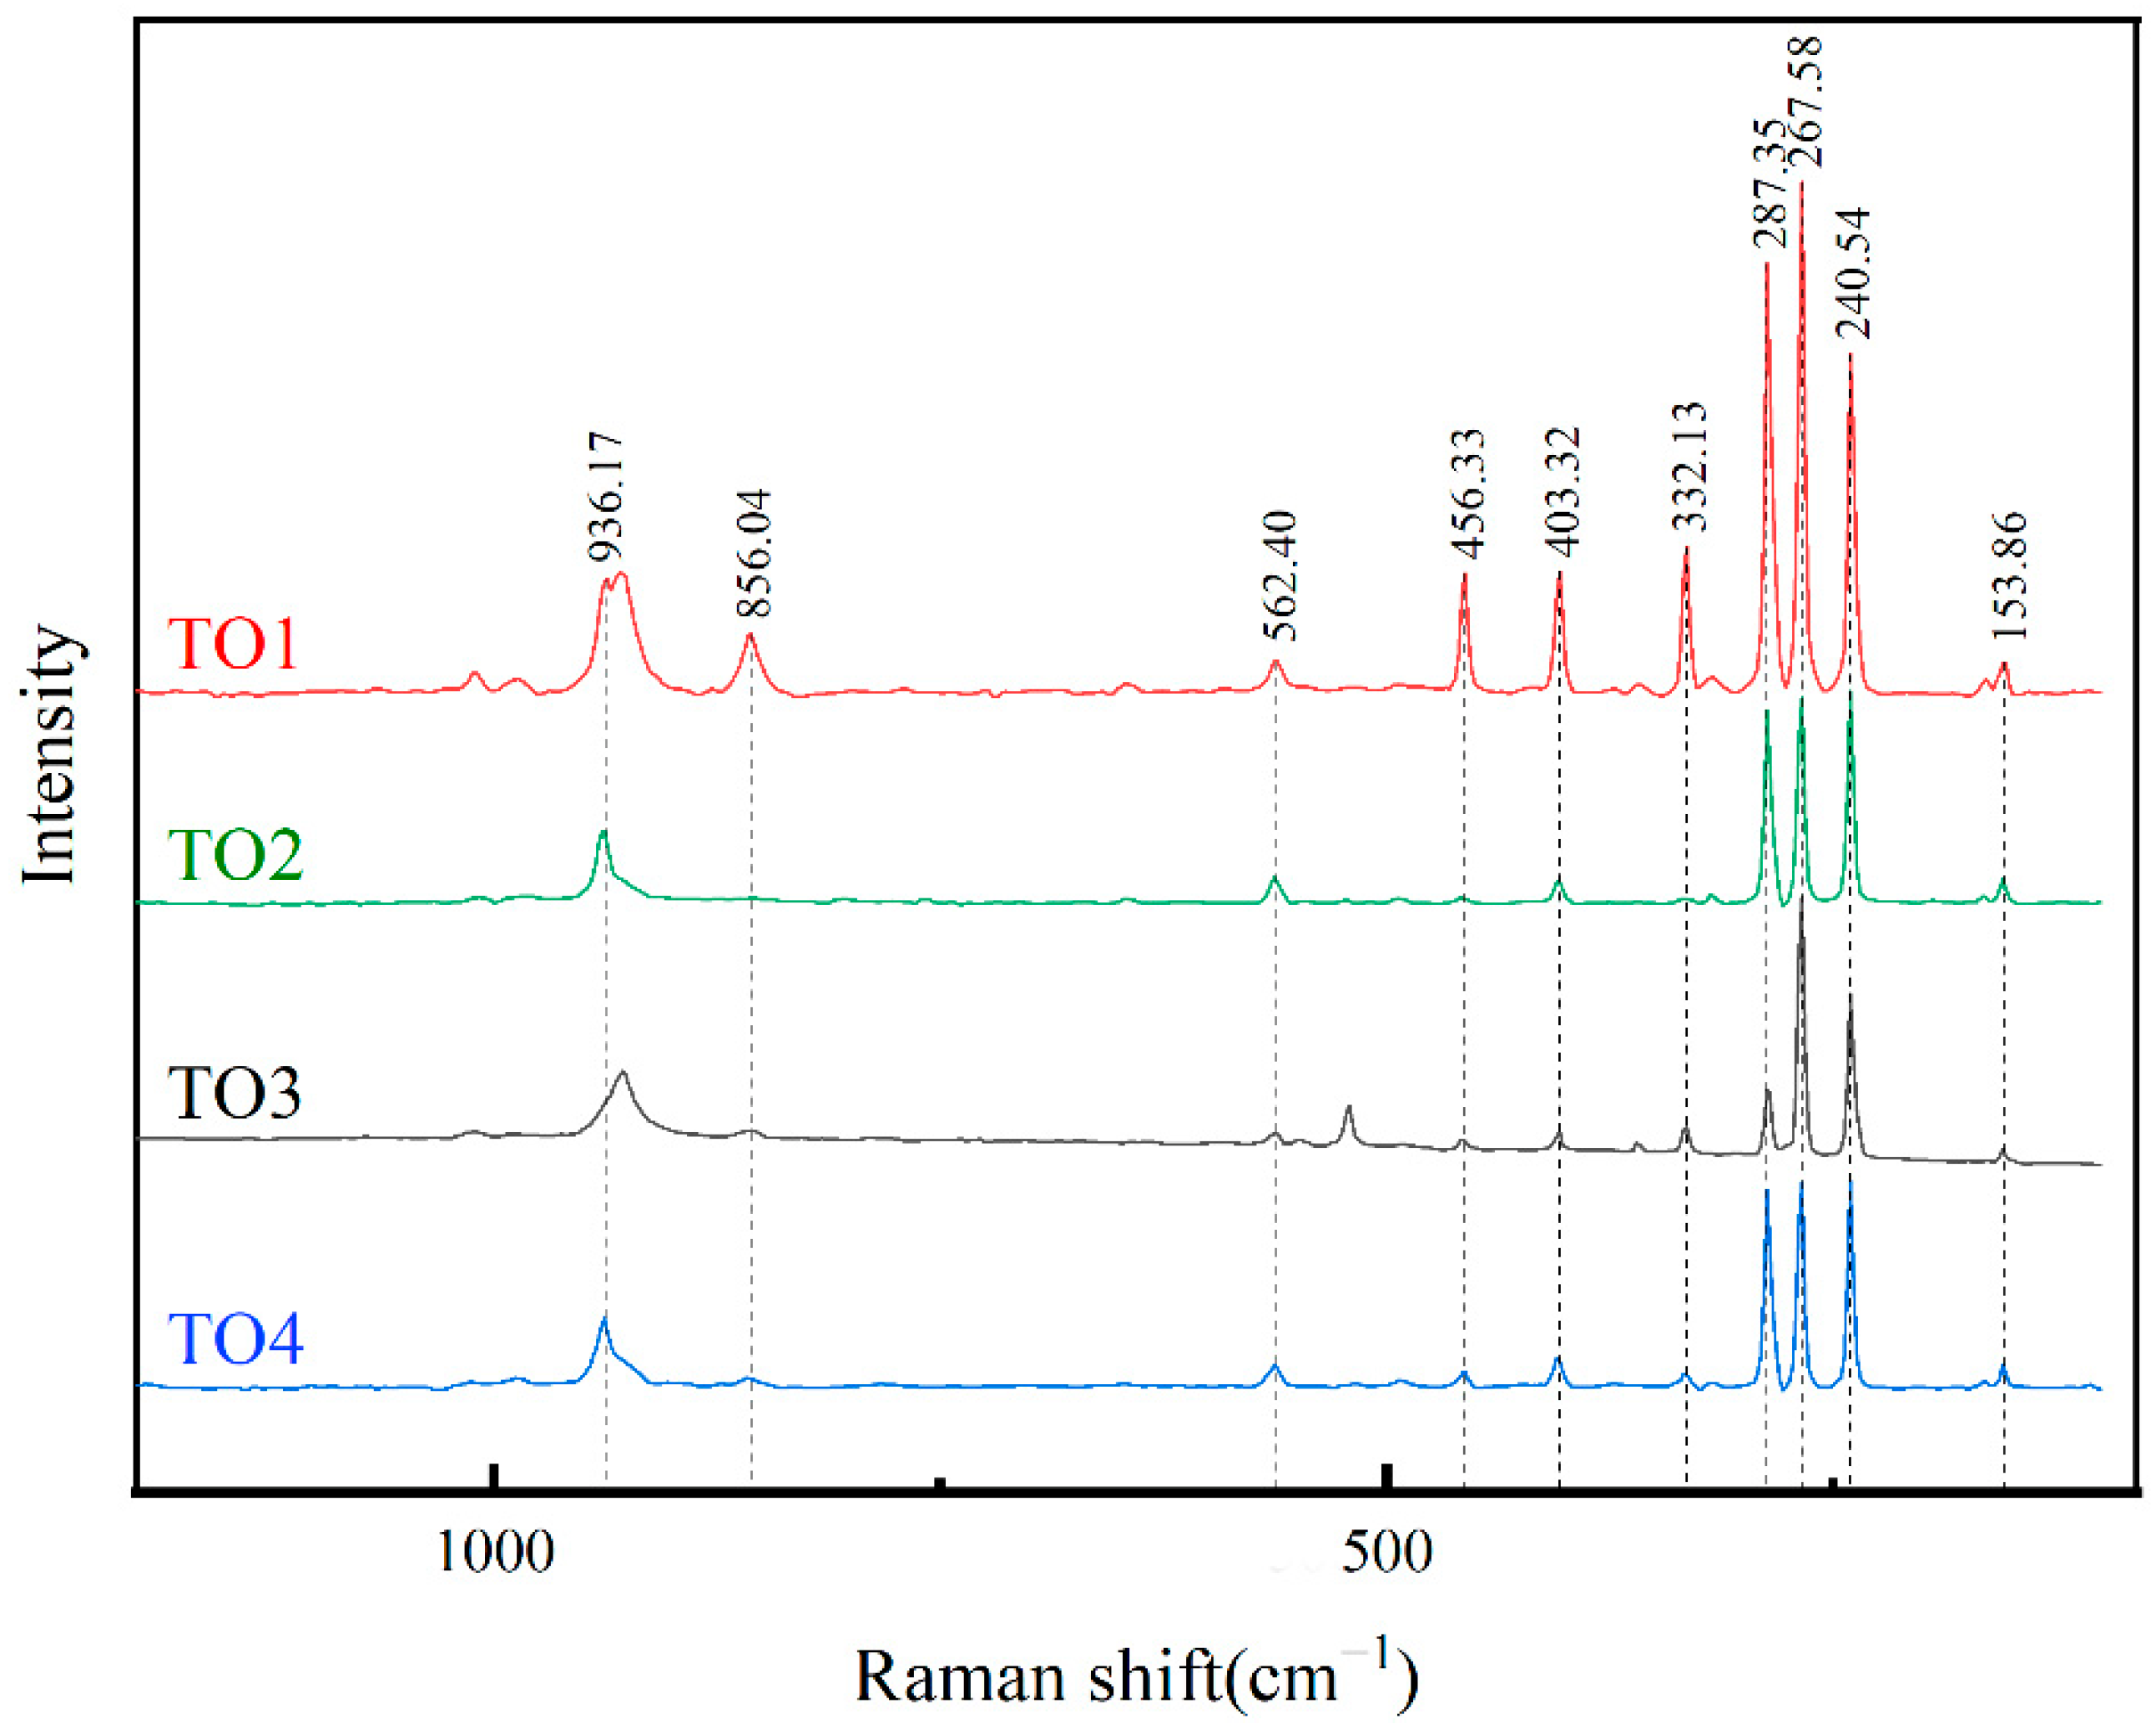
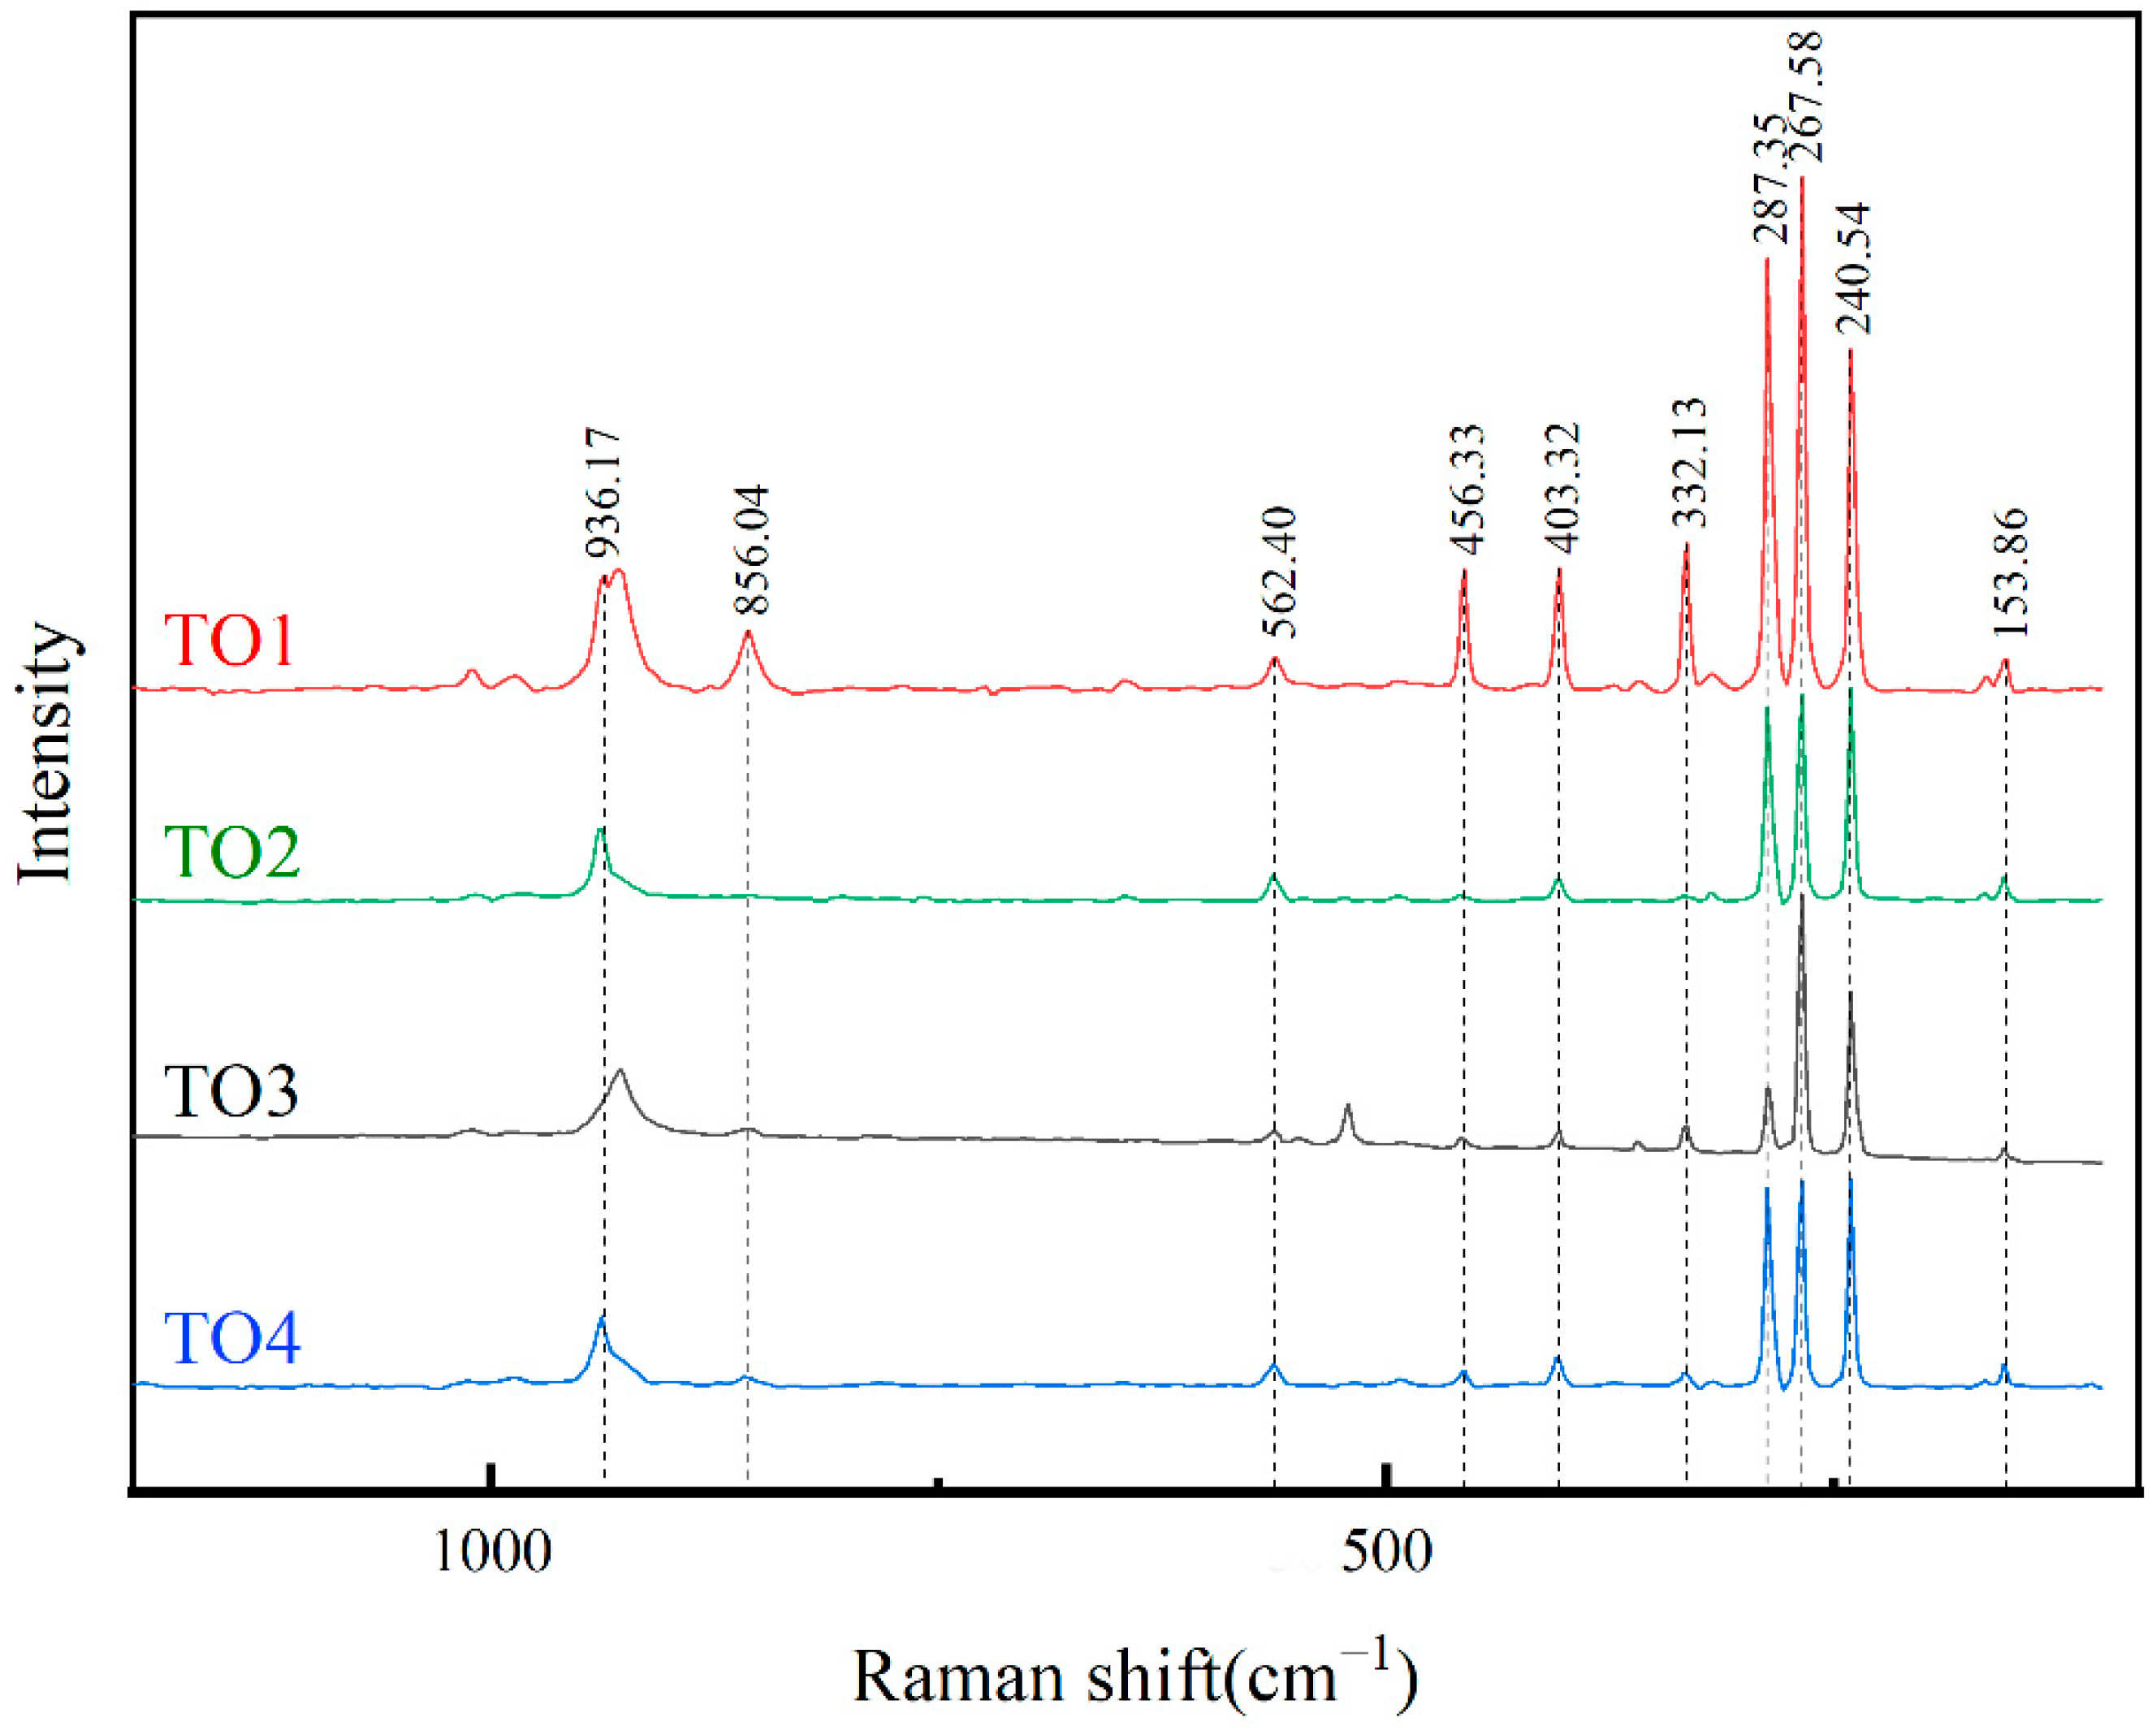
3.3.2. Raman Spectra Analysis

It can be seen from Figure 5 that there is a characteristic absorption peak of TO1, TO3, and TO4 near 856 cm−1. It is speculated that the peak may be related to the brown tone of the sample. The peak of 937 cm−1 is regarded as the coupling result of symmetric stretching vibration and asymmetric stretching vibration of [SiO4] [12]. The 850 cm−1 band of TO1 is the result of the coupling of asymmetric stretching vibration and symmetric stretching vibration caused by hydroxyl substituting fluorine, from which it can be inferred that the content of hydroxyl in TO1, TO3, and TO4 samples is unusually rich [9]. The absorption peaks at 267 and 287 cm−1 are all caused by a series of Si-O group vibrations in the [SiO4] tetrahedron [2].
The series of sharp bands in the 330–500 cm−1 range are assigned with stretching and bending modes of [AlO6] octahedral coupled with the bending modes of [SiO4] tetrahedra. The band observed at 320 cm−1 is assigned to Al-F stretching modes [10,13].

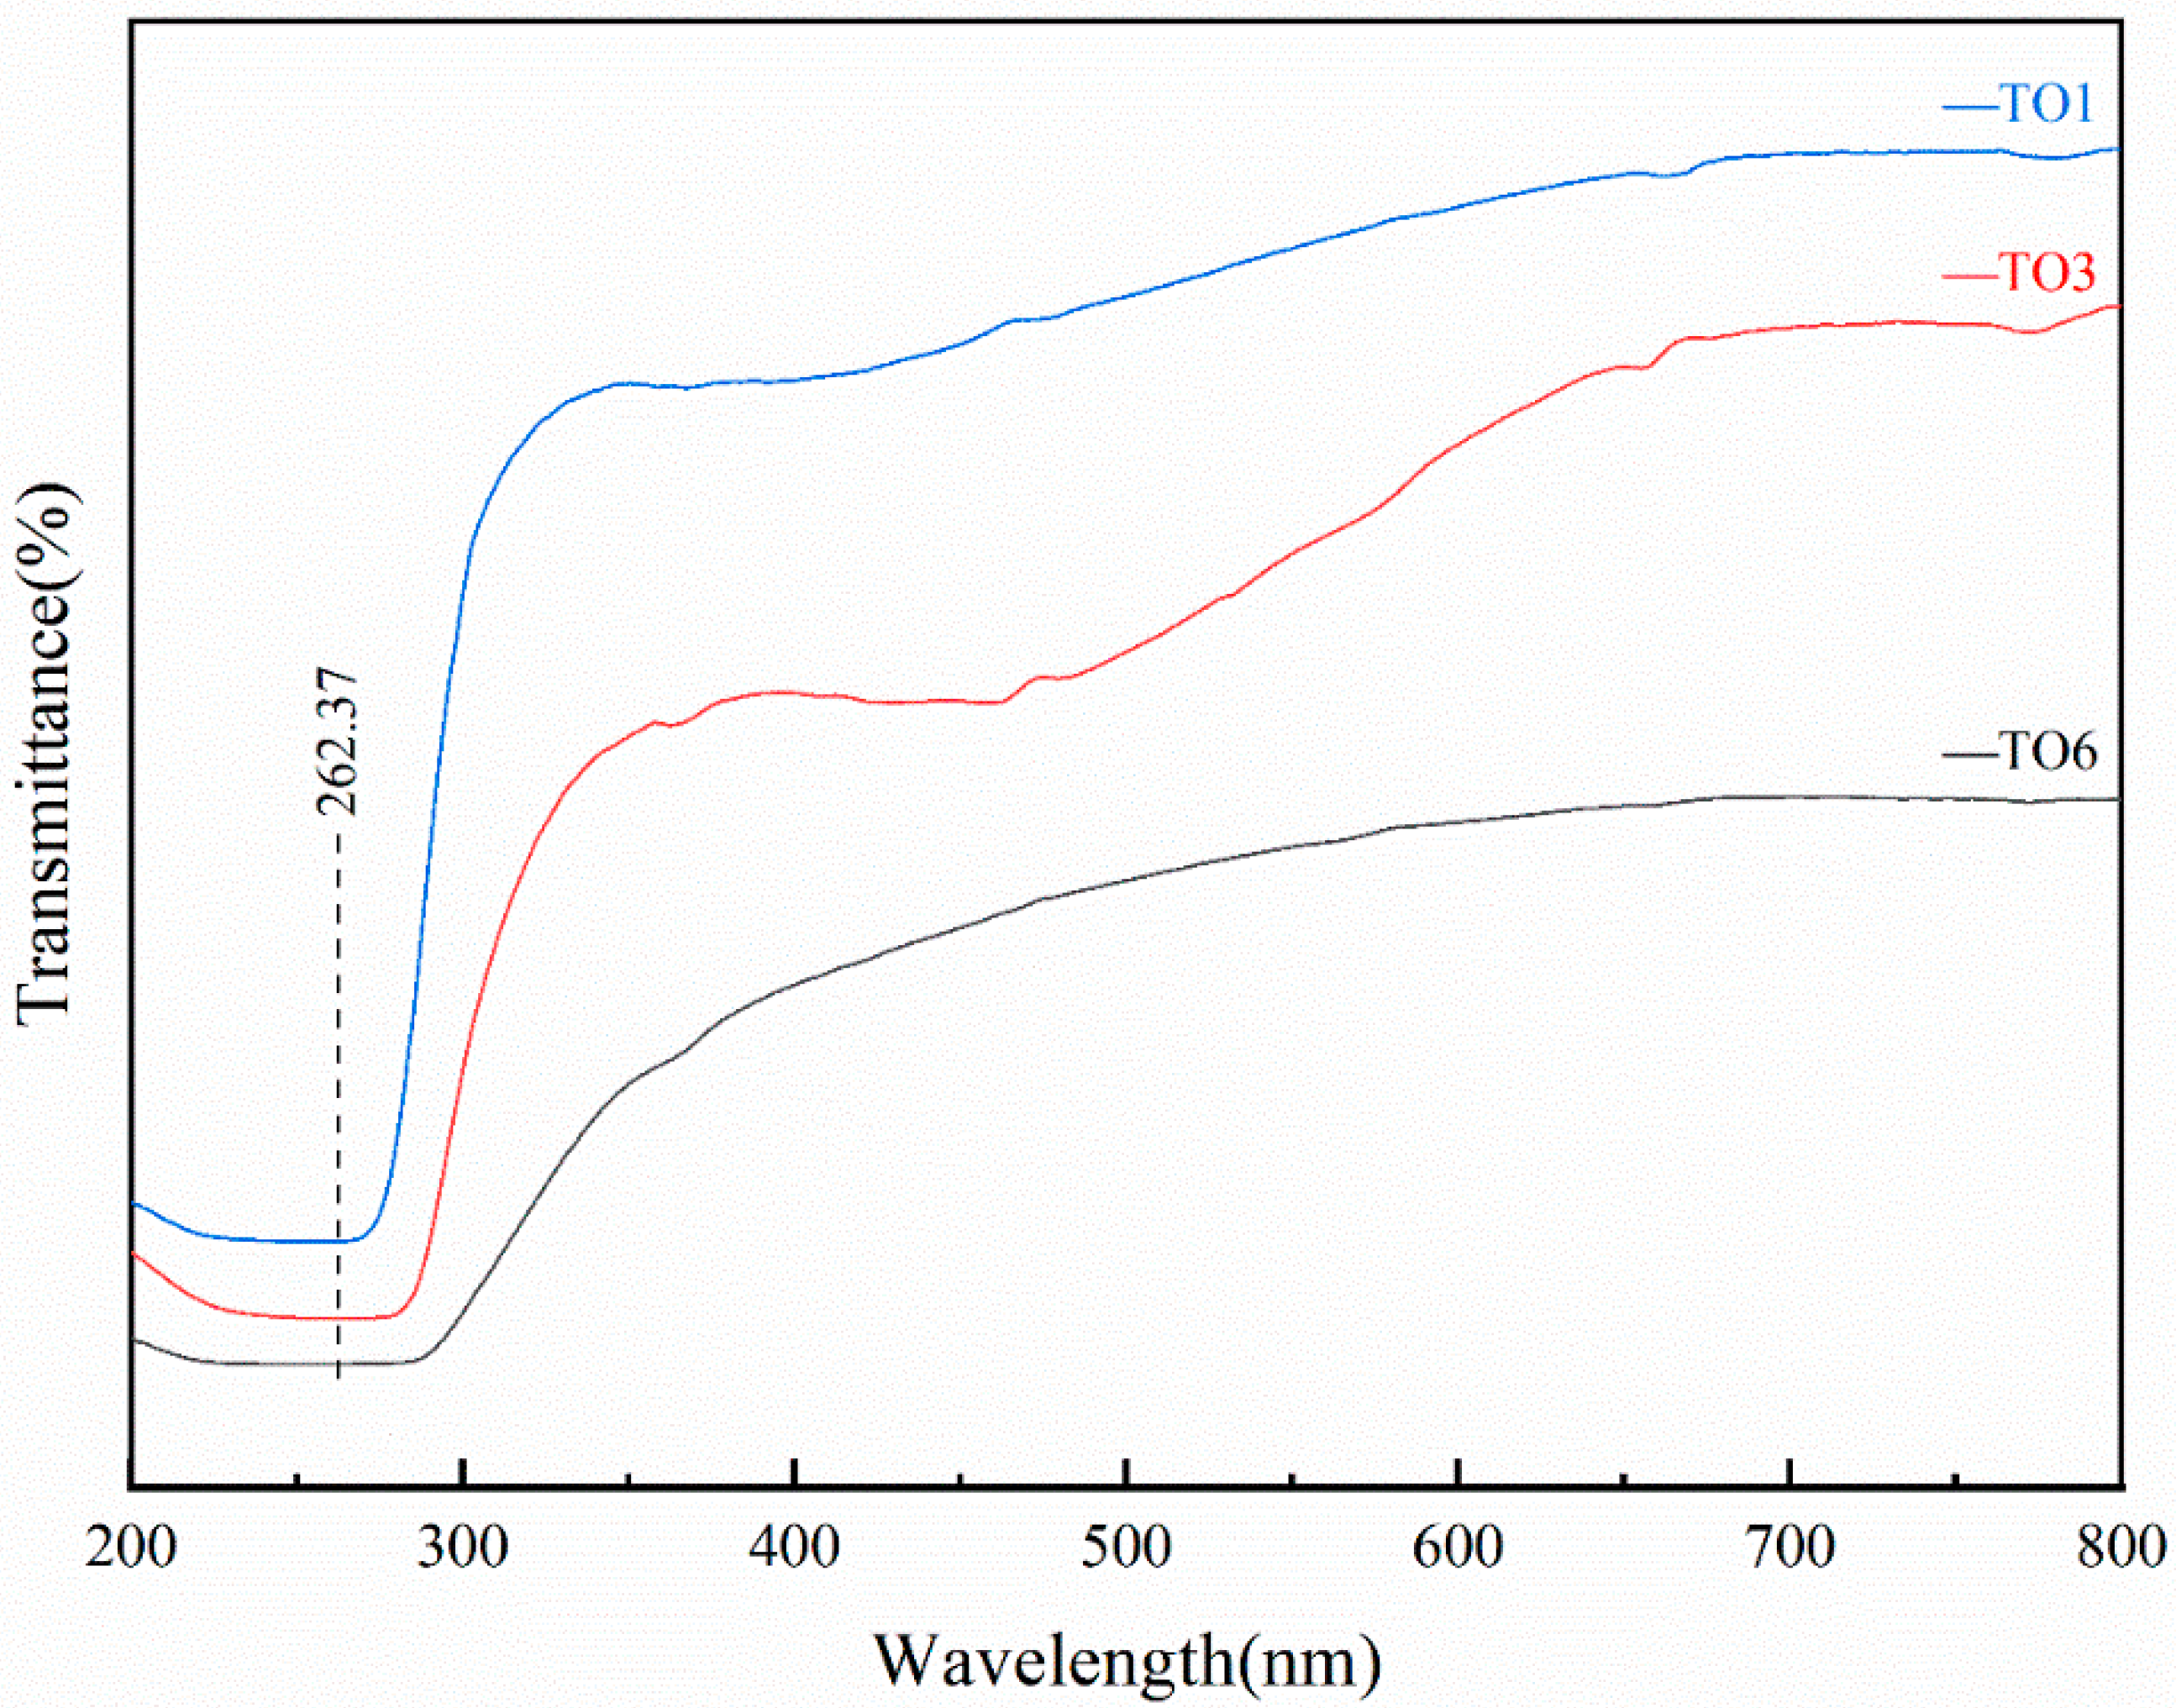
3.3.3. UV-VIS Analysis

As shown in Figure 6, all samples had strong absorption bands in the range of 200–300 nm, but no obvious absorption peak in the range above 300 nm. The sample TO6 has a brown tone, and TO3 has a light brown tone, and TO1 has the lightest yellow-brown tone. We found that, as the color of the sample enhances, the absorption band moves toward the long wave direction.

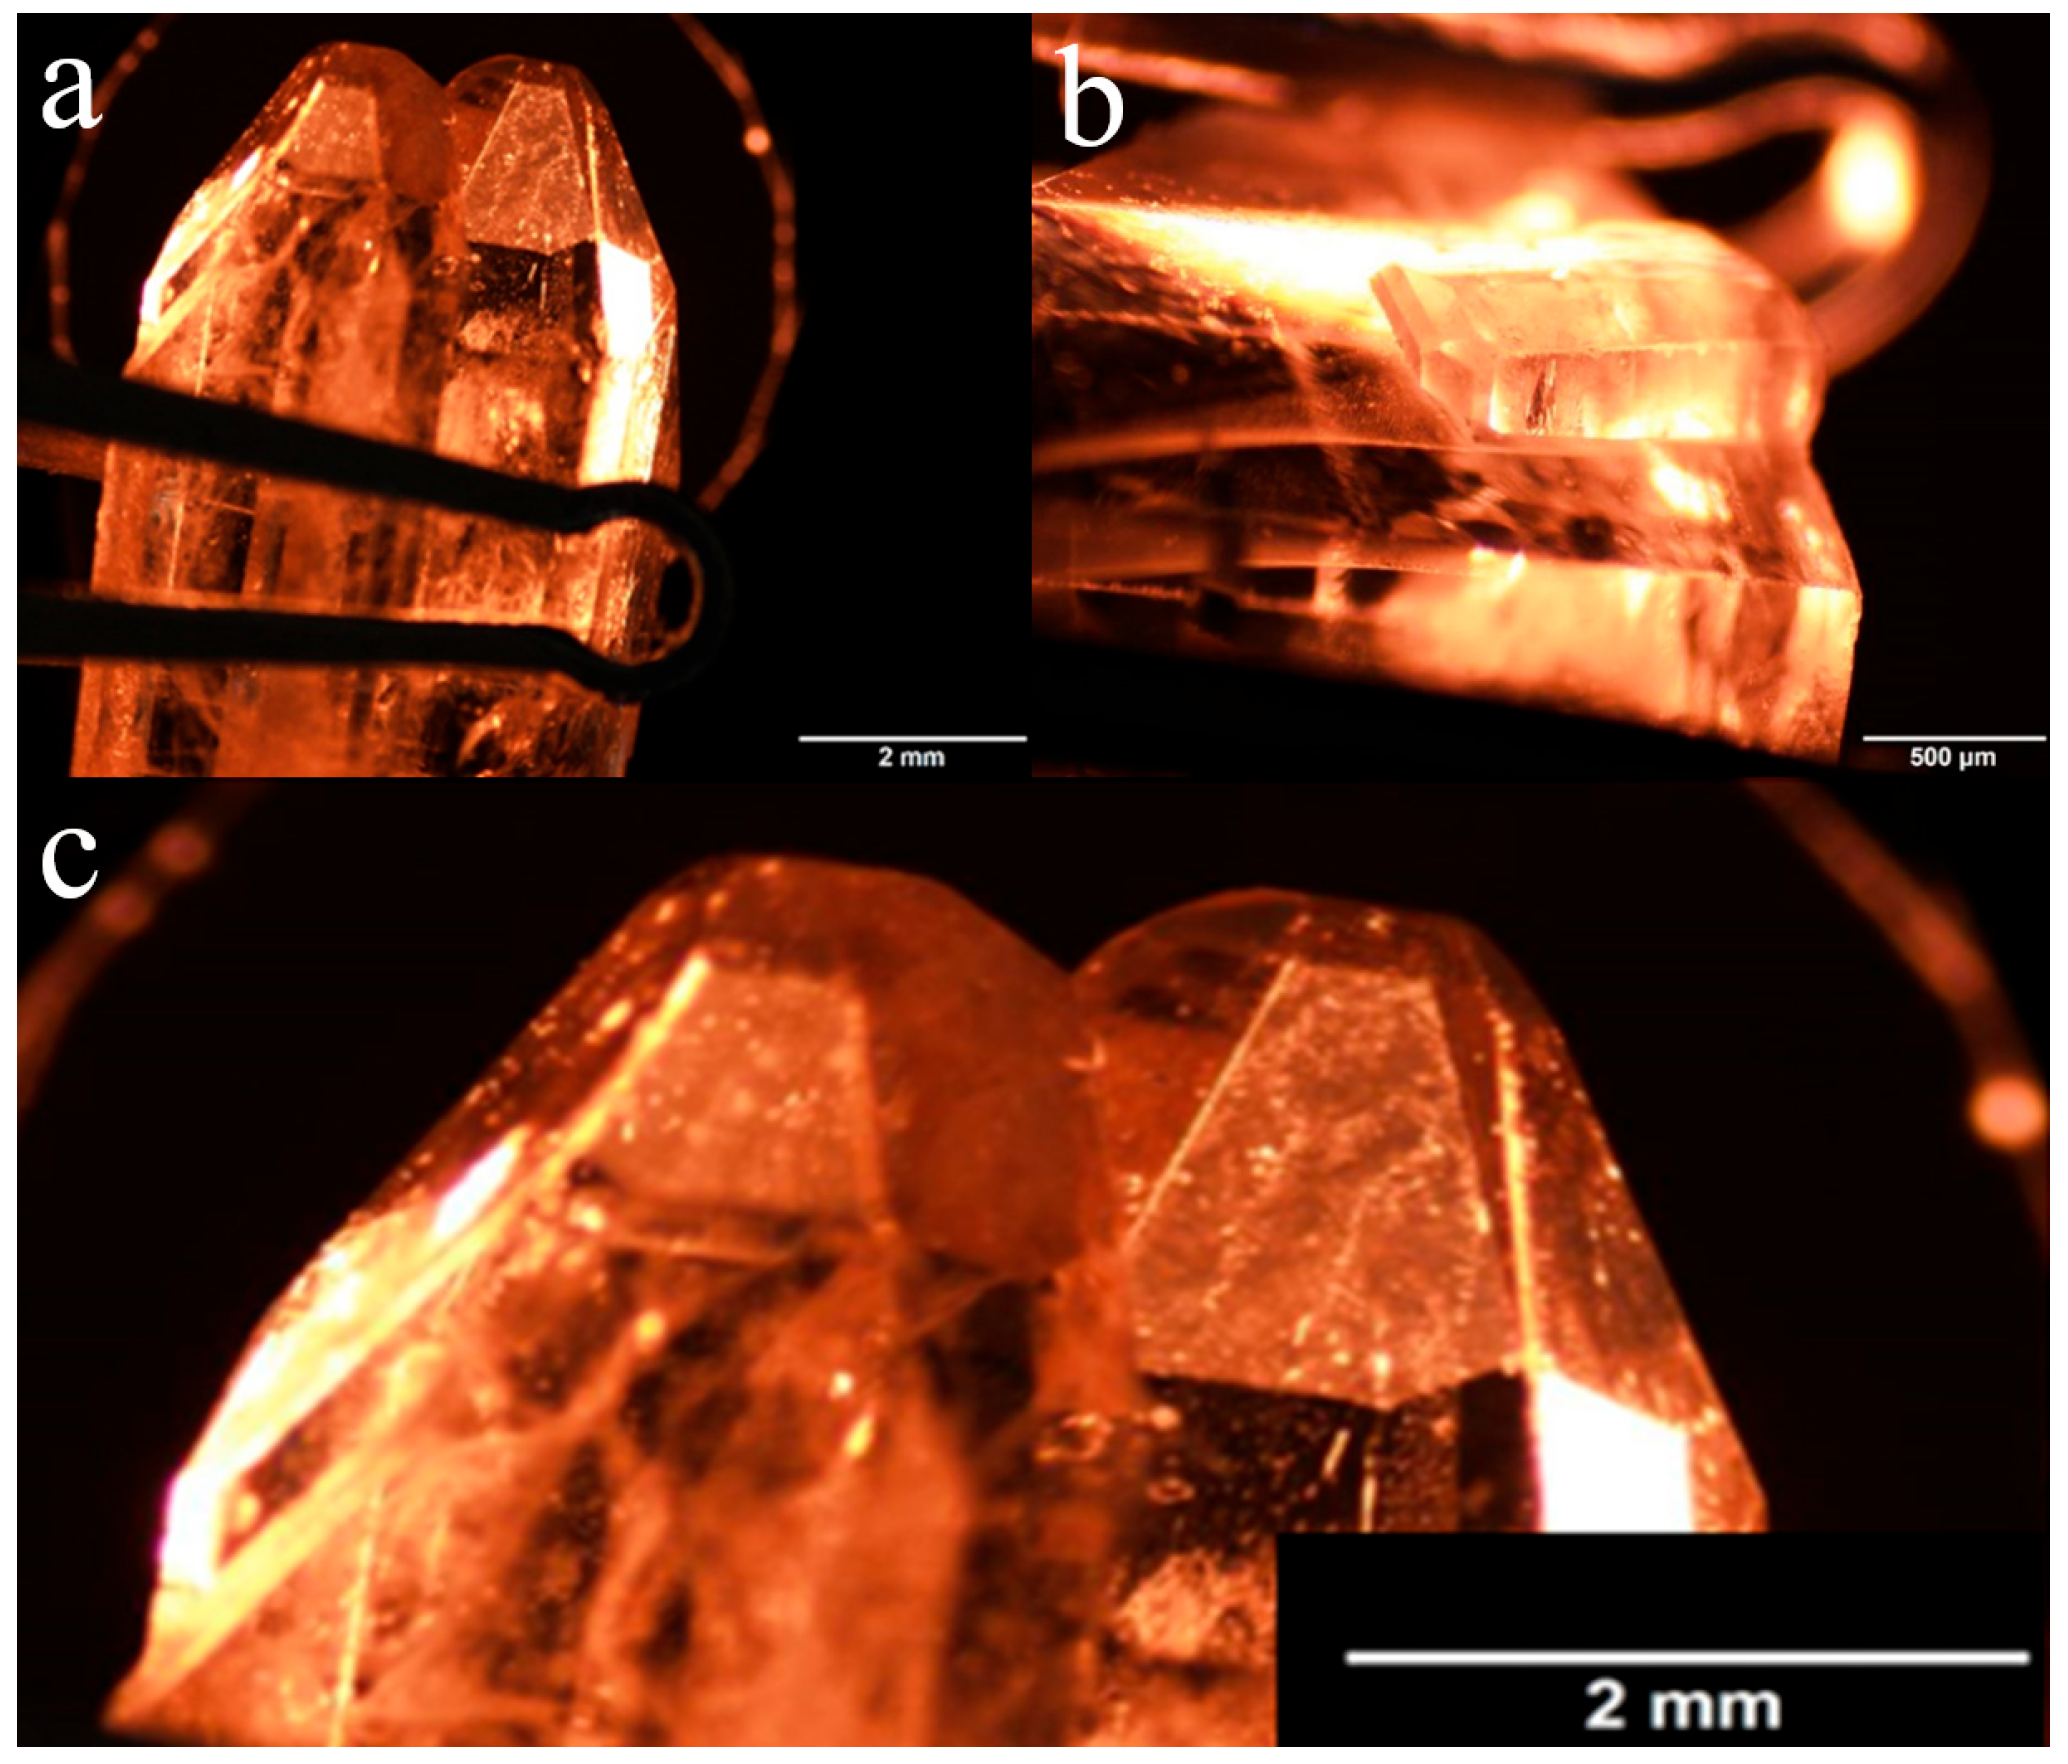
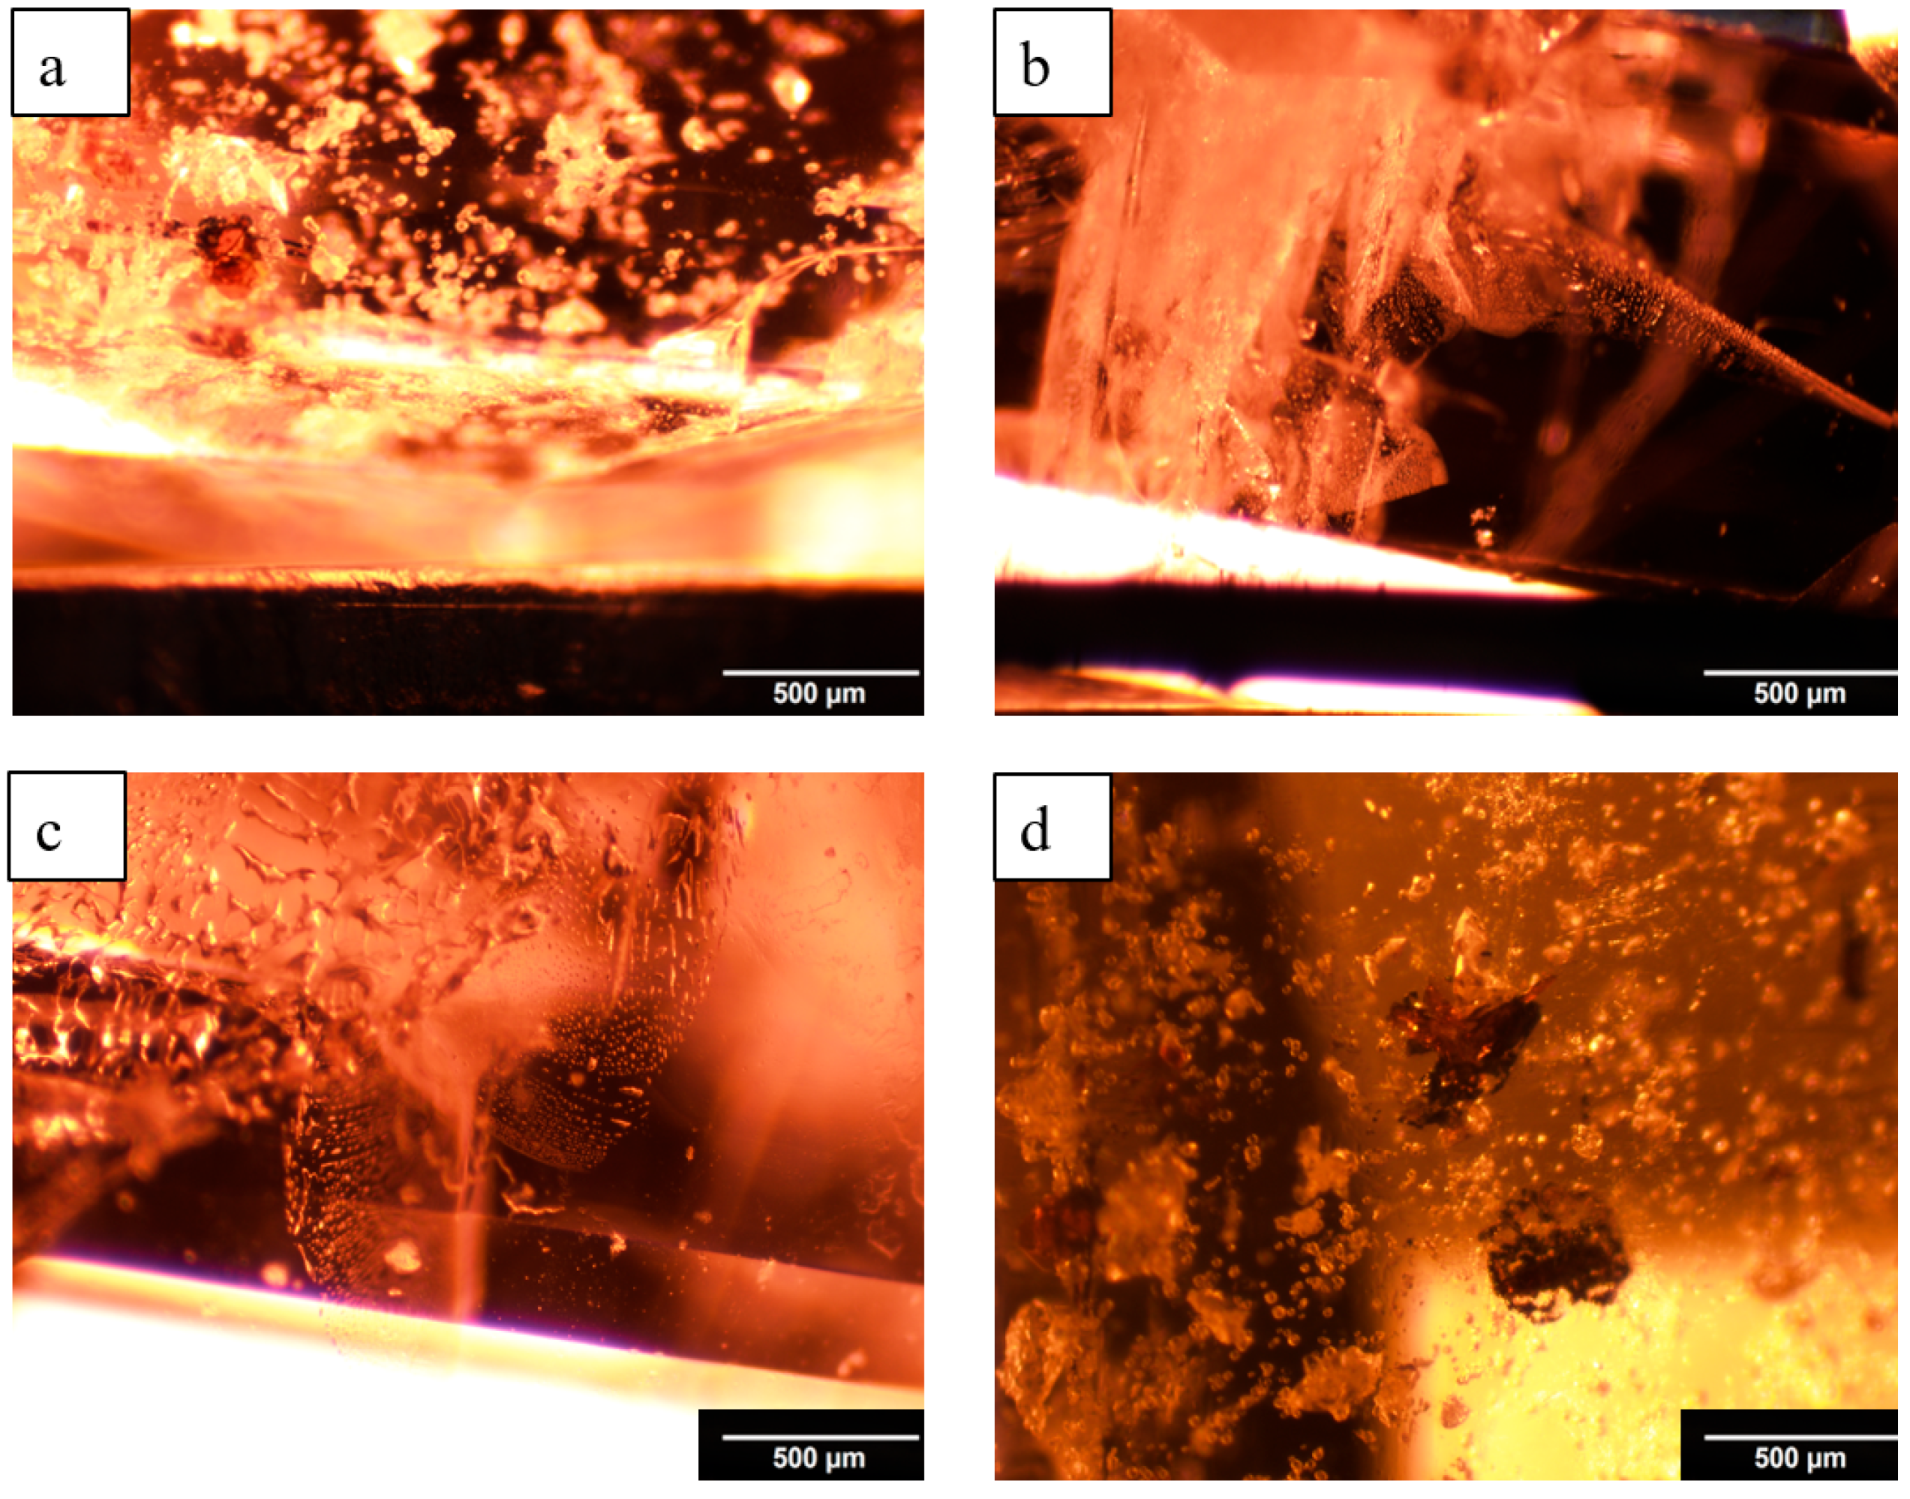
3.4. Inclusions in Topaz

The photographs of the inclusions of the sample are shown in Figure 7. Figure 7a shows a large number of fluid inclusions observed in TO6, which is speculated to be formed by the capture of the ore-forming medium by the topaz crystals during the formation process. Healed cracks were observed in TO3 and TO7 as shown in Figure 7b,c. Dark solid inclusions were observed in sample TO10 (Figure 7d), which were presumably formed by trapping surrounding rock minerals during the crystal development of topaz, and no obvious characteristic crystal form of the inclusion was observed, so further analysis of it was needed.
In order to identify the dark inclusions, Raman spectra were acquired on the inclusions, and the results were shown in Figure 8.
The Raman spectra of the dark solid inclusions are consistent with the standard Raman spectra of albite, which indicate that the inclusion is albite. Topaz is a kind of high temperature pneumatolytic hydrothermal mineral. The albite inclusion did not show a complete crystal form. It is speculated that the albite was captured by the developing topaz during hydrothermal alteration and, eventually, became an inclusion.

4. Conclusions

In summary, the gemological characteristics, composition, spectral characteristics, and inclusions of yellow topaz samples were systematically analyzed by using basic gemological instruments and modern testing techniques. The topaz sample has columnar crystal form, rhomboid cross section, a growth striation can be seen on the crystal face, and a simple contact twin and a set of {001} perfect cleavage are commonly developed. Most yellow topazes are transparent of glassy luster, with an average relative density of 3.523 and a refractive index of 1.609–1.617 (±0.010), with no obvious fluorescence phenomenon. Yellow topaz has the unique spectral characteristics of aluminosilicates. The coloration element for topaz is iron, and the dark inclusions in the yellow are albite.

Supplementary Materials

The following supporting information can be downloaded at: https://www.mdpi.com/article/10.3390/cryst12121746/s1, Supporting document S1-XRF; Supporting document S2-EMPA.

Author Contributions

Z.S., writing—original draft preparation and formal analysis; Q.G., review and editing; L.L., review and editing. All authors have read and agreed to the published version of the manuscript.

Funding

This study was supported by the National Science and Technology Infrastructure—The National Infrastructure of Mineral, Rock and Fossil Resources for Science and Technology (http://www.nimrf.net.cn, accessed on 25 December 2021), as well as the Program of the Data Integration and Standardization in the Geological Science and Technology from MOST, China, grant number 2013FY110900-3.

Institutional Review Board Statement

Not applicable.

Informed Consent Statement

Not applicable.

Data Availability Statement

Not applicable.

Conflicts of Interest

There are no conflict to declare.

References

  1. Howard, J.W. TOPAZ. J. Chem. Educ. 1935, 12, 153–155. [Google Scholar] [CrossRef]
  2. Skvortsova, V.; Mironova-Ulmane, N.; Trinkler, L.; Chikvaidze, G. Optical properties of natural topaz. In IOP Conference Series: Materials Science and Engineering; IOP Publishing: Bristol, UK, 2013; Volume 49, p. 012051. [Google Scholar]
  3. Xie, L.; Wang, R.C.; Groat, L.A.; Zhu, J.C.; Huang, F.F.; Cempírek, J. A combined EMPA and LA-ICP-MS study of Libearing mica and Sn–Ti oxide minerals from the Qiguling topaz rhyolite (Qitianling District, China): The role of fluorine in origin of tin mineralization. Ore Geol. Rev. 2015, 65 Pt 4, 779–792. [Google Scholar] [CrossRef]
  4. Peiling, Z. The Characteristics of Gemology of Topaz in a Mining Area, Guangxi. J. Guilin Coll. Geol. 1991, 11, 43–49. [Google Scholar]
  5. Dickinson, A.C.; Moore, W.J. Paramagnetic resonance of metal ions and defect centers in topaz. Phys. Chem. 1967, 71, 231–240. [Google Scholar] [CrossRef]
  6. Linus, P. The Crystal Structure of Topaz. Proc. Natl. Acad. Sci. USA 1928, 14, 603–606. [Google Scholar]
  7. Xu, B.; Hou, Z.Q.; Griffin, W.L.; Lu, Y.; Belousova, E.; Xu, J.F.; O’Reilly, S.Y. Recycled volatiles determine fertility of porphyry deposits in collisional settings. Am. Mineral. 2021, 106, 656–661. [Google Scholar] [CrossRef]
  8. Xu, B.; Hou, Z.Q.; Griffin, W.L.; Zheng, Y.C.; Wang, T.; Guo, Z.; Hou, J.; Santosh, M.; O’Reilly, S.Y. Cenozoic lithospheric architecture and metallogenesis in Southeastern Tibet. Earth Sci. Rev. 2021, 214, 103472. [Google Scholar] [CrossRef]
  9. Wang, B.; Tu, J. The Spectroscopic Study of Topaz. Spectrosc. Spectr. Anal. 2000, 20, 40–43. [Google Scholar]
  10. Rossman, G.R.; Aines, R.D. Spectroscopy of a birefringent grossular from Asbestos, Quebec, Canada. Am. Mineral. 1986, 71, 779–780. [Google Scholar]
  11. Komatsu, K.; Kagi, H.; Okada, T.; Kuribayashi, T.; Parise, J.B.; Kudoh, Y. Pressure dependence of the OH-stretching mode in F-rich natural topaz and topaz-OH. Am. Mineral. 2005, 90, 266–270. [Google Scholar] [CrossRef]
  12. Beny, J.M.; Piriou, B. Vibrational spectra of single-crystal topaz. Phys. Chem. Miner. 1987, 15, 148–159. [Google Scholar] [CrossRef]
  13. Kloprogge, J.T.; Frost, R.L. Raman microscopic study at 300 and 77 K of some pegmatite minerals from the Iveland-Evje area, Aust-Agder, Southern Norway. Spectrochim. Acta Part A Mol. Biomol. Spectrosc. 2000, 56, 501–513. [Google Scholar] [CrossRef] [PubMed]
Figure 1. Photos of yellow topaz samples.
Crystals 12 01746 g001
Figure 2. (a) The well-developed twin crystal of TO9. (b) Overgrowth can be seen in TO7. (c) A set of {001} perfect cleavage of TO9.
Crystals 12 01746 g002
Figure 3. Infrared transmission spectra of yellow topaz samples (1800–4000 cm−1).
Crystals 12 01746 g003
Figure 4. Infrared reflection spectra of yellow topaz samples (380–1200 cm−1).
Crystals 12 01746 g004
Figure 5. Raman Spectra of yellow topaz samples (100–1200 cm−1).
Crystals 12 01746 g005
Figure 6. The UV-VIS spectra of yellow topaz samples.
Crystals 12 01746 g006
Figure 7. (a) Fluid inclusions of TO6. (b,c) Healed cracks inclusions of TO3 and TO7. (d) Dark solid inclusions of TO10.
Crystals 12 01746 g007
Figure 8. Raman spectra of inclusions of TO10 samples.
Crystals 12 01746 g008
Table 1. The conventional gemological characteristics of yellow topaz.
ColorLusterTransparencyFluorescenceRefractive IndexRelative Density
yellowGlassy lusterTransparentNo
fluorescence
1.609–1.6173.421–3.583
Publisher’s Note: MDPI stays neutral with regard to jurisdictional claims in published maps and institutional affiliations.

