Article

End-of-Life Liquid Crystal Displays Recycling: Physico-Chemical Properties of Recovered Liquid Crystals

1
Unité Matériaux et Transformations (UMET), UMR 8207, CNRS, INRAE, Centrale Lille, Université de Lille, 59000 Lille, France
2
Laboratoire Physico-Chimie des Matériaux-Catalyse et Environnement (LPCM-CE), Université des Sciences et de la Technologie d’Oran Mohamed Boudiaf (USTOMB), BP 1505, El M’naouer, Oran 31000, Algeria
3
Laboratoire Physico-Chimie des Matériaux et Environnement (LPCME), Université ZIANE Achour, Djelfa 17000, Algeria
4
UR 4476, Unité de Dynamique et Structure des Matériaux Moléculaires (UDSMM), Université du Littoral Côte d’Opale, 59379 Dunkerque, France
*
Author to whom correspondence should be addressed.
Crystals 2022, 12(11), 1672; https://doi.org/10.3390/cryst12111672
Submission received: 2 November 2022 / Revised: 15 November 2022 / Accepted: 17 November 2022 / Published: 19 November 2022
(This article belongs to the Special Issue Advances in Liquid Crystal Optical Devices)

Abstract

:
This report focuses particularly on liquid crystals display (LCD) panels because they represent a significant amount of all WEEE collected. Technologies involving liquid crystals (LCs) have enjoyed considerable success since the 1970s in all fields of LC displays (LCDs). This currently provokes the problem of waste generated by such equipment. Based on current statistical data, the LC amount represents approximately 1.3 g for a 35-inch diameter LCD panel unit possessing a total weight of 15 kg. In France, a recent study revealed LCD waste to represent an average of 5.6 panels per household. This represents an important quantity of LCs, which are generally destroyed by incineration or washed out with detergents during the recycling processes of end-of-life (EOL) LCDs. Hence, the aim of this study is to show that it is possible to remove LC molecules from EOL-LCD panels with the goal of valorizing them in new sectors. EOL-LCD panels have undergone various stages of dismantling, chemical treatments and characterization. The first stage of manual dismantling enables the elimination of the remaining physical components of the panels to process LC molecules only, sandwiched between the two glass plates. Mechanical treatment by scraping allows us to obtain a concentrate of LCs. The results obtained from chemical and physical techniques show that these molecules retain the characteristics essential for their operation in the field of optical and electro-optical devices. As the use of LCD surfaces continues to rise significantly, the amounts and economic stakes are huge, fully justifying the development of an LC recovery process for used panels. Many potential uses have been identified for these LC molecules: in new flat LCD panels after purification of the LCs concentrate, in PDLC systems, as lubricants or in thermal applications.

1. Introduction

In 2003, the European Waste Electrical and Electronic Equipment (WEEE) Directive (2002/96/EC) was created, with the main objective of reducing the production of WEEE and requiring the disassembly of all liquid crystal displays (LCDs) with an area over 100 cm2 [1]. Because EEE and WEEE may contain hazardous chemicals, they are subject to the provisions of the European RoHS Directive (2002/95/EC) (restriction on the use of certain hazardous substances) [2], which aims to reduce the number of hazardous materials in EEE. In France, these European directives (WEEE and RoHS) were transposed by decree and codified in the Environmental Code in 2005 (2005-829) [3]. Then, they were amended in 2012 (2012-617) and 2014 (2014-928) [4,5]. There are five types of WEEE treatment classified below by order of priority defined by the regulations: preparation for reuse: reuse of the whole equipment; reuse of parts: reuse of parts or sub-assemblies of the equipment; material recycling: recycling of the material; energy recovery: incineration with energy recovery; disposal: disposal without recovery (landfill, incineration without energy recovery) [6].
Technologies involving liquid crystals (LCs) have enjoyed considerable success since the 1970s in all fields of LCDs. However, the success of technologies involving LCs generates large quantities of LCD waste representing a significant quantity of LC mixtures abandoned in end-of-life (EOL)-LCD panels. A study conducted by the “Conseil Supérieur de l’Audiovisuel” (CSA) showed that in 2018, an average waste of 5.6 panels was determined per French household, which is constantly increasing [7].
LCs are organic molecules that exhibit intermediate states between the crystalline solid state characterized by a long-range order and the isotropic liquid, where there is no order [8]. These states are called mesophases [9]. LCs used in LCD panels form a mixture of molecules of polycyclic aromatic hydrocarbons and alkyl, alkoxy, chloro, fluoro or carboxyl chains [10]. Many practical considerations must be met by an LC mixture prior to its use in a display device. The essential behavior of these blends is their sensitivity to an applied electric field. Fluorinated groups bonded to aromatic rings can increase their sensitivity to electric fields [11], i.e., LC molecules switch in response to an electric field in the direction of the passage of light. Conversely, when the electric field is removed, LC molecules are likely to return to their original position due to inherent elastic forces.
LC mixtures destinated for display devices should provide a wide operating temperature range, typically between −30 °C and +80 °C, allowing the device to operate in both summer and winter climatic conditions all over the world. The LC mixture should have high chemical, electrochemical and physicochemical stability. It should be stable in air, moisture and against oxidative conditions. These last properties are achieved by adding to the mixture other compounds such as antioxidants, stabilizers and UV stabilizers. Finally, the LC mixtures must have desired refractive indices, dielectric constants, elastic constants and a low viscosity, which allows seeing fast-moving images. For the latter property, a family of phenylcyclohexanes can be chosen with linked alkoxyl groups.
As shown in Figure 1, a LCD module consists of multiple layers. Considered as a one-dimensional light source, lamps are often placed linearly on the bottom chassis with reflective sheets. A diffuser plate and a diffuser sheet are mounted over the lamps to generate a uniform distribution of light so that backlights can provide a two-dimensional distribution of light. In addition to spreading light from the lamps, the diffuser plate made of polymethylmethacrylate (PMMA) also functions as a support for holding up diffuser sheets. A prism sheet is used to increase the brightness measured normally to the surface after the light is scattered through the diffuser sheet. Since the light passing through the prism sheet is not polarized, a reflective polarizer is added to recycle light lost to absorption by controlling polarization and reflection [12].
The structure of the LCD central module comprising LCs is shown schematically in Figure 2. LC mixtures are sandwiched between two parallel plates (usually glass), exhibiting a layer thickness varying between 3 and 5 µm. The glass plates are coated on one side by a thin layer of ITO (Indium Tin Oxide) which represents a thickness between 0.1 and 0.3 µm [14]. Indeed, to extract only the LCD panel containing LCs from the whole TV apparatus, various components must be successfully removed, generally by manual operations. For instance, the plastic TV cover shell must be removed by unscrewing the front and rear parts. It should be remembered that there are hundreds of LC compounds currently employed in LCDs, and a typical LCD panel could contain as many as 25 different compounds that are mixed together to form a white, opaque liquid that flows easily. Each of these LC compounds possesses different physical and optical characteristics [15,16].
The use of LCD panels in plate panels of TV or monitors currently provokes the problem of waste treatments generated by such material. Processing technologies, including the recovery of LCs, are rare or under development [17,18,19]. One of the main procedures of the processing of waste from LCD panels includes manual dismantling of the modules, during which the backlight tubes containing mercury are separated and directed towards specific pathways for processing tubes and discharge lamps [20,21,22,23]. Following this procedure, LCs are generally rejected or destroyed by incineration or washing detergents [24]. This seems to be justified by the fact that other materials such as plastics, metals and electronic components account for more than 90% by weight of all components in a typical LCD panel, while LCs represent less than 0.1%. The LC amount represents approximately 1.3 g for an LCD panel unit with a 35-inch diameter, possessing a total weight of 15 kg [25]. This quantity must be reviewed in the context of a real dismantling project to better understand the economic potential of recycling used LCs. Indeed, if we consider that a large number of EOL-LCD panels will accumulate in waste disposal centers, the overall amount of LC is no longer negligible. Thus, the aim of this work is to investigate the possibility of removing LC molecules from EOL-LCD panels by a simple method and then check for recovery of their physico-chemical and optical properties.
It should be mentioned that economic issues play an important role in developing the industrial recovery of LCs. An adapted product specification must be established on the basis of extended academic research, aiming toward the valorization of recycled LC mixtures.

2. Materials and Methods

2.1. Materials: EOL-LCD Panels

The EOL-LCD panels that have been permitted to achieve this study were obtained from the ENVIE2E Company based in the north of France. The business fields of ENVIE2E are recovering, sorting, reusing, recycling and upgrading WEEE and other materials. This paper is based on the treatment of 35 EOL-LCD panels older than five years. These were dismantled manually to recycle LC molecules. Industrial LCD recycling facilities, such as ENVIE2E, must ensure the safety of workers. One of the most important issues during dismantling is the presence of mercury in the old tubes used as light sources. The dismantling process is carried out in a controlled atmosphere (fume cupboards) coupled with a filtration system, allowing the capture of volatile species using activated carbon. Authorized companies carry out the regeneration of the activated carbon in order to analyze the captured species that may contribute to environmental pollution. In addition, the operators wear personal protective equipment adapted to their work (safety shoes and glasses, helmet, gloves, etc.).

2.2. Extraction of LCs from EOL-LCD Panels

In order to extract only the LCD panel containing LCs from the whole TV apparatus, various components were successively removed following a specific order by manual operations (Figure 3). The plastic TV cover shell was removed by unscrewing the front and rear parts. During disassembly, there is no danger of damaging the backlight tubes incorporating mercury since they are fixed at the rear plastic plates. The LCs sandwiched between the two ITO-coated glass plates could thus be removed before reaching backlight tubes. The processing of these tubes and polymers and the recovery of other parts will not be discussed in this report.
The sandwiched glass plates were first manually opened using a scalpel or spatula (Figure 3a) to separate them (Figure 3b). This step allows access to the LC mixtures (Figure 3c,d), which show translucent and slightly viscous aspects. To extract all LCs from the glass supports, a plastic squeegee was used on the whole glass surface of the plates to scrape LCs molecules (Figure 3c). This operation was repeated several times to ensure optimal extraction after a visual check (Figure 3d). The thickness of each LCD screen, comprised of the two glass substrates and the LC layer, was measured with a mechanical micrometer. Thicknesses of the LC layer were deduced from the subtraction of the thickness of the glass plates from the total value of the LCD screen, yielding values between 3 and 5 µm.
Thus, the obtained LCs were ready to be analyzed by several physico-chemical and optical techniques.

2.3. Characterization Techniques

To ensure that the physico-chemical and optical characteristics of LCs are maintained despite the age and the treatment applied on EOL-LCD panels, characterization studies were carried out on the extracted products. This report focuses on the results of four individual EOL-LCD panels, but several characterizations realized on other samples provided the same conclusion [26]: A (diagonal size 31 inches), B (27 inches), C (26 inches) and D (32 inches). Each capital letter (A to D) represents a different manufacturer. All samples were treated in the same manner to proceed to the extraction of LC mixtures.

2.3.1. Determination of Molecular Structures by FTIR, 1H NMR and GC-MS

Chemical structures of the LCs molecules were obtained using Fourier transform infrared (FTIR), proton nuclear magnetic resonance (1H NMR) spectroscopies, and gas chromatography coupled with mass spectroscopy (GC-MS). FTIR spectra were recorded in the transmission mode using a Perkin Elmer Frontier model. The number of accumulated scans was 16, with a spectral resolution of 4 cm−1. 1H NMR spectra were recorded using an FT-NMR (300 MHz) Bruker instrument with Tetramethylsilane as the internal standard at room temperature in CDCl3. The recovered LC mixtures were dried at 70 °C in a vacuum oven and analyzed by GC-MS. The GC chromatograms and their associated mass spectra were obtained using a Perkin Elmer Clarus 680 gas chromatograph coupled with a Clarus 600T mass detector (PerkinElmer, Shelton, CT, USA). A fused silica capillary column (Elite-5 (5% Diphenyl) Dimethylpolysiloxane, 30 m × 0.53 mm (internal diameter), film thickness 0.5 μm; temperature of the column 70 °C) was employed. The mass spectrometer was equipped with an electronic ionization (EI) source and a quadripole mass analyzer (QSM). The injector temperature was 300 °C, and a 10 μL syringe was used for injections of 0.2 μL. Helium was the carrier gas, applying a constant flow of 1.5 mL/min. The ion source and interface temperatures were maintained at 180 and 300 °C, respectively. The furnace temperature was held for 15 min at 70 °C, then raised to 150 °C with a rate of 20 °C/min followed by an isotherm of 10 min, then increased to 240 °C followed by an isotherm of 10 min. The retention times (tR) were determined for each separated molecule.

2.3.2. Determination of Thermal and Optical Properties

Thermal and optical properties of LC mixtures extracted from EOL-LCD panels were examined by differential scanning calorimetry (DSC), polarized optical microscopy (POM) and thermo gravimetrical analysis (TGA). DSC experiments were carried out using a Pyris Diamond DSC calorimeter at a heating rate of 10 °C/min under continuous nitrogen flow. The sample weight was approximately 7 mg, and the data were evaluated from the second heating ramps. The thermo-microscopy studies were performed on a POM Olympus BX41 equipped with a digital camera conjugated with a PC. The system comprises a Linkam heating/cooling stage LTS 350 together with a temperature-controlling unit TMS 94. The temperature was increased in a stepwise manner, the typical size of one step being generally 2 °C. Thermogravimetric analysis was conducted on a TA Instruments Q5000 based on a heating rate of 10 °C/min from T = 20 °C to T = 600 °C, under continuous air flow with a sample weight of about 15 mg.

3. Results and Discussions

Since LCD screens contain various amounts of different unknown LC molecules (and others), and these LC mixtures were developed as a function of specific applications, it was not appropriate to investigate original commercial LC mixtures in order to compare their physico-chemical properties with those from the collected EOL-LC mixtures.

3.1. Mass Balance of Extracted LCs

The results from the mass balance of LCs recovered by scraping are presented in Figure 4. High dispersion of data was observed, and limited amounts of less than 1 g per panel for two reasons. The first concerns the status of approved monitors on the dismantling site. Many panels were found in a state of mechanical damage (crack, breakage of the glass panel, LC exposed to atmosphere). This degradation involves lower LC extracting from surfaces than expected. In addition, as the LCs are in the form of flowable gel, logistic and handling operations could cause them to be lost. Secondly, the efficiency of recovery depends on how the surface of the glass plate of the LCD panel was scratched: more or less strong in an area or several times in the same area. Thus, transport operations for EOL-LCDs must take into account their fragility. Similarly, recovery techniques must be implemented with an efficient process. This last point has been investigated in this report [27].
To conduct a detailed characterization of LCs from these EOL-LCD panels, a selection of four undamaged panels with good general status was conducted (Table 1). The results of this selection show that the LCs mass increases with the size of the panel. Not surprisingly, the largest mass was obtained with panel C having a diagonal of 81.2 cm (32 inches), and the lowest amount corresponded to panel D with a diagonal of 58.4 cm (23 inches). Secondly, in theory, a panel exhibiting a diagonal of 32 inches corresponds to a total amount of 1.2 g of LCs if one considers an LC layer thickness corresponding to 5 µm [12]. It appears that the quantity of extracted LCs was lower than the theoretical one but better than in the case of damaged panels. Thus, the extraction yield reached approximately 70–80% of the theoretical value.

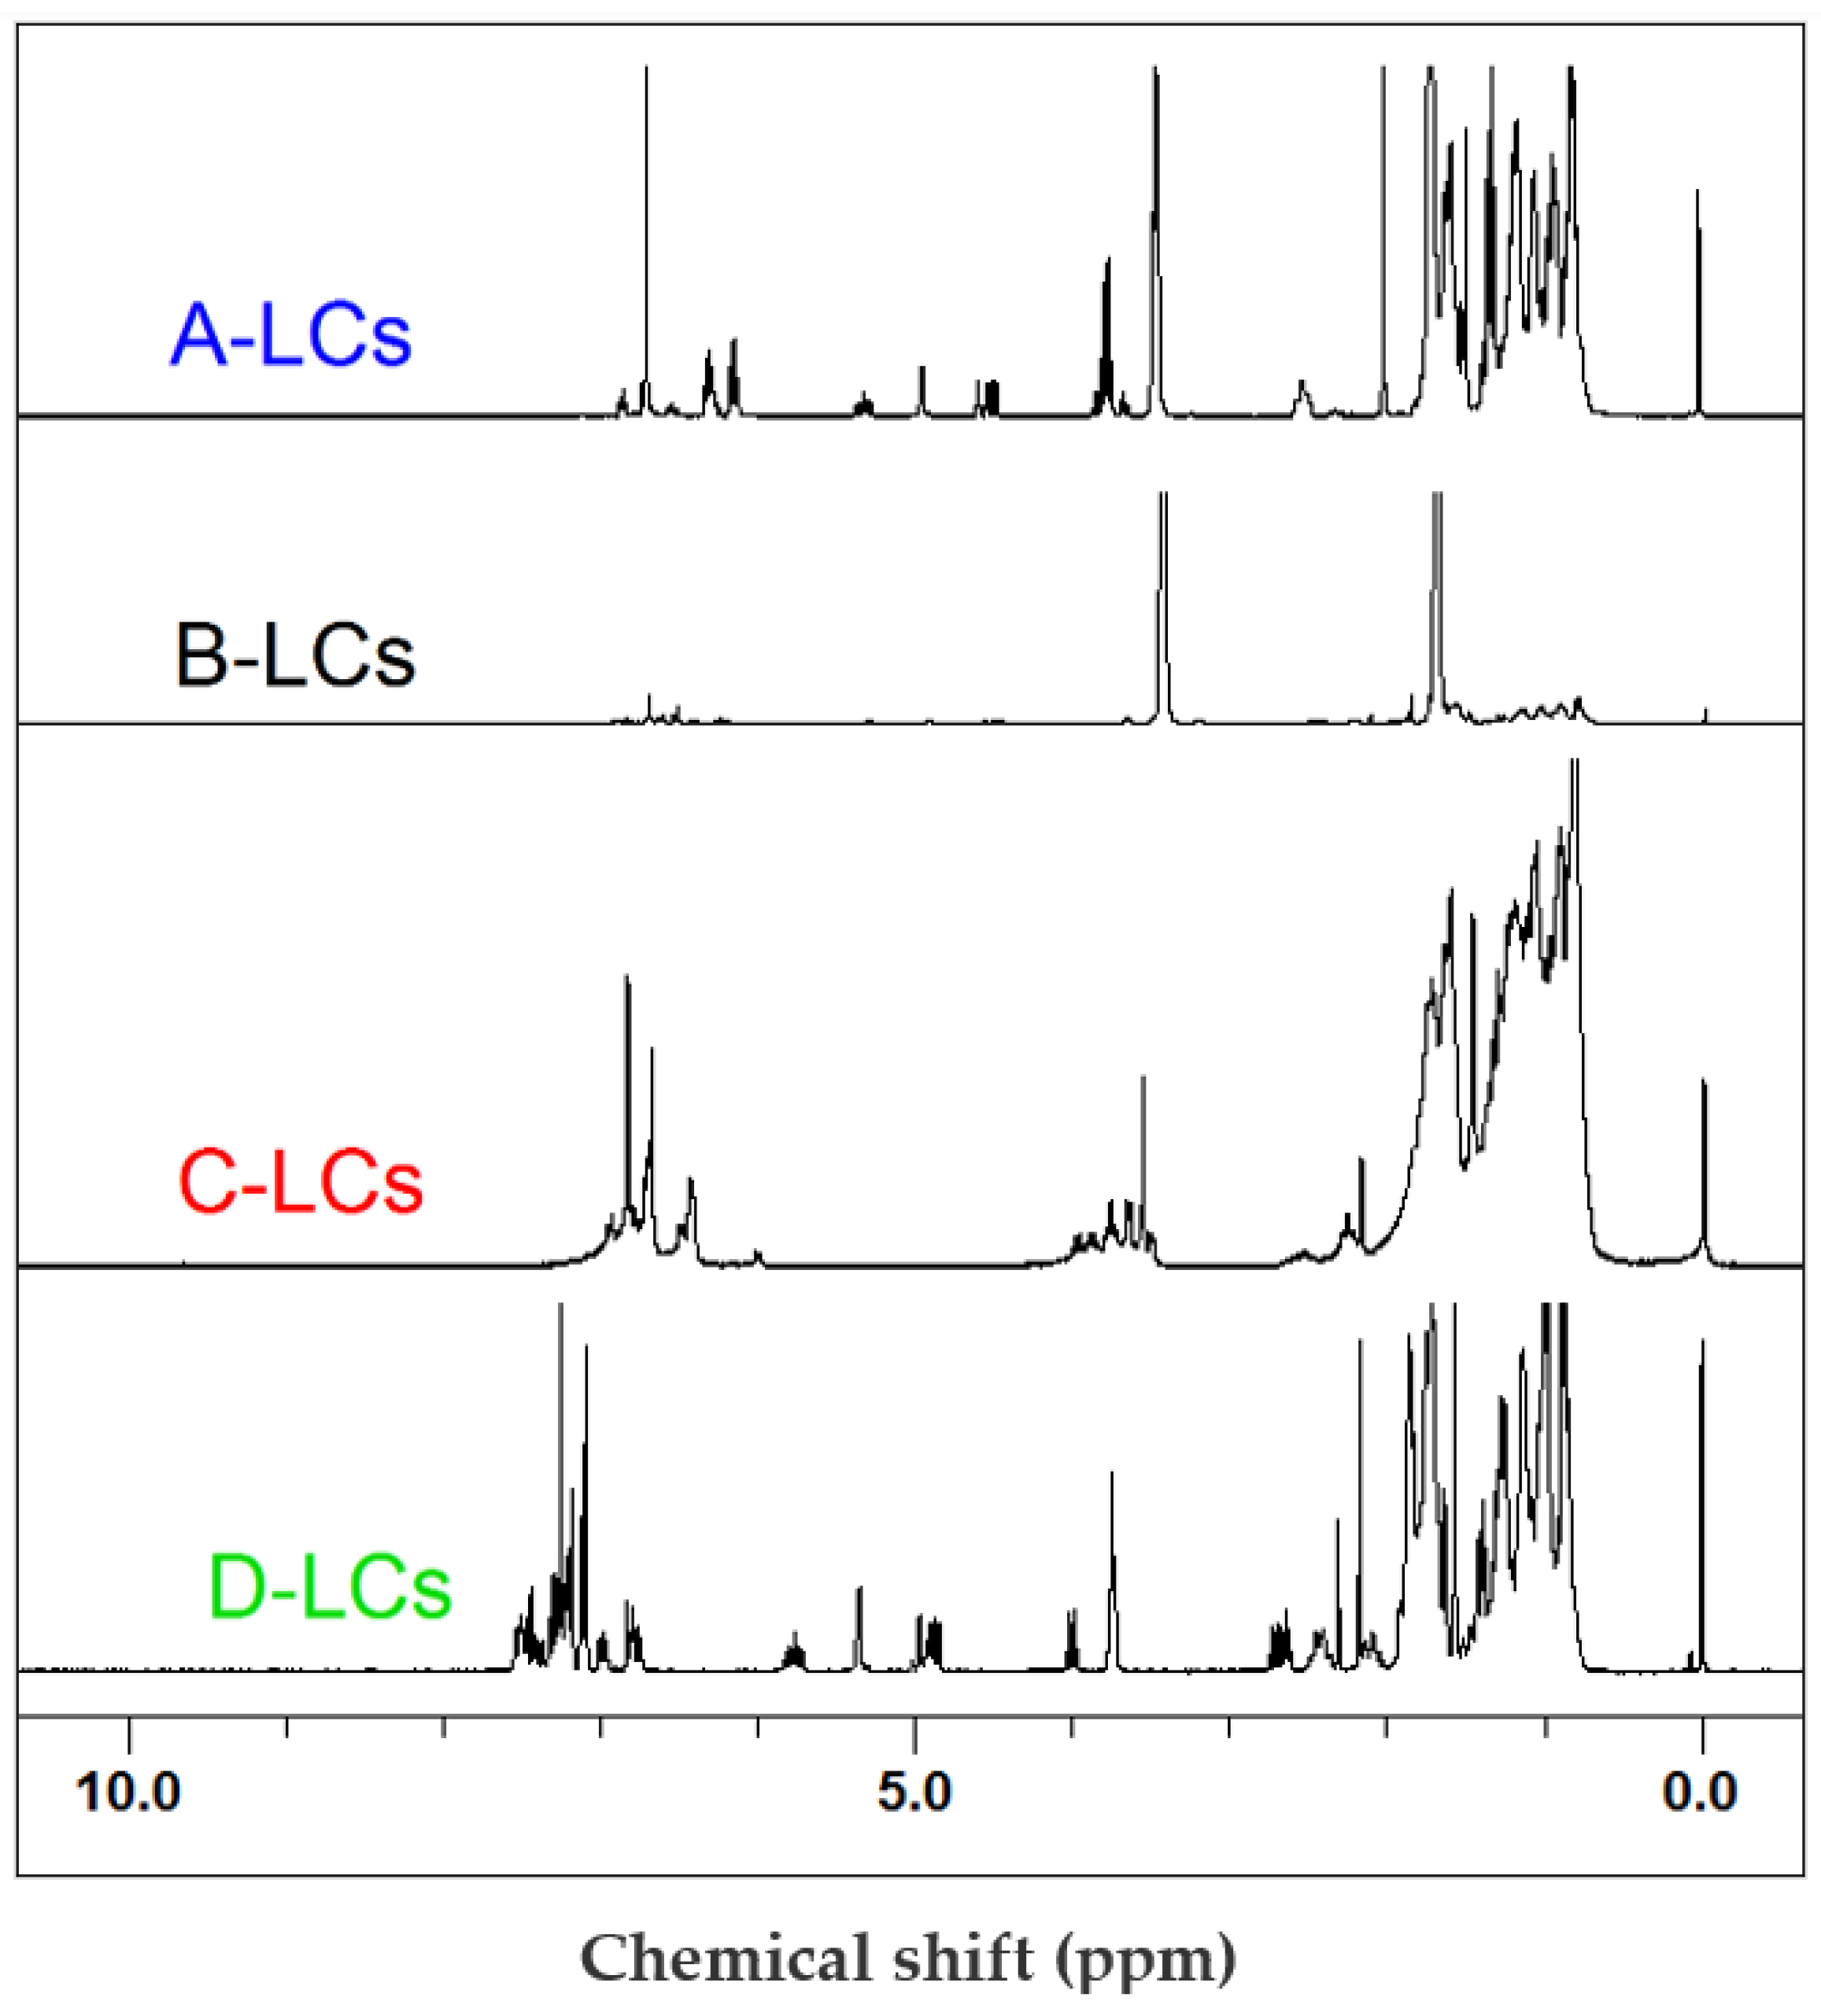
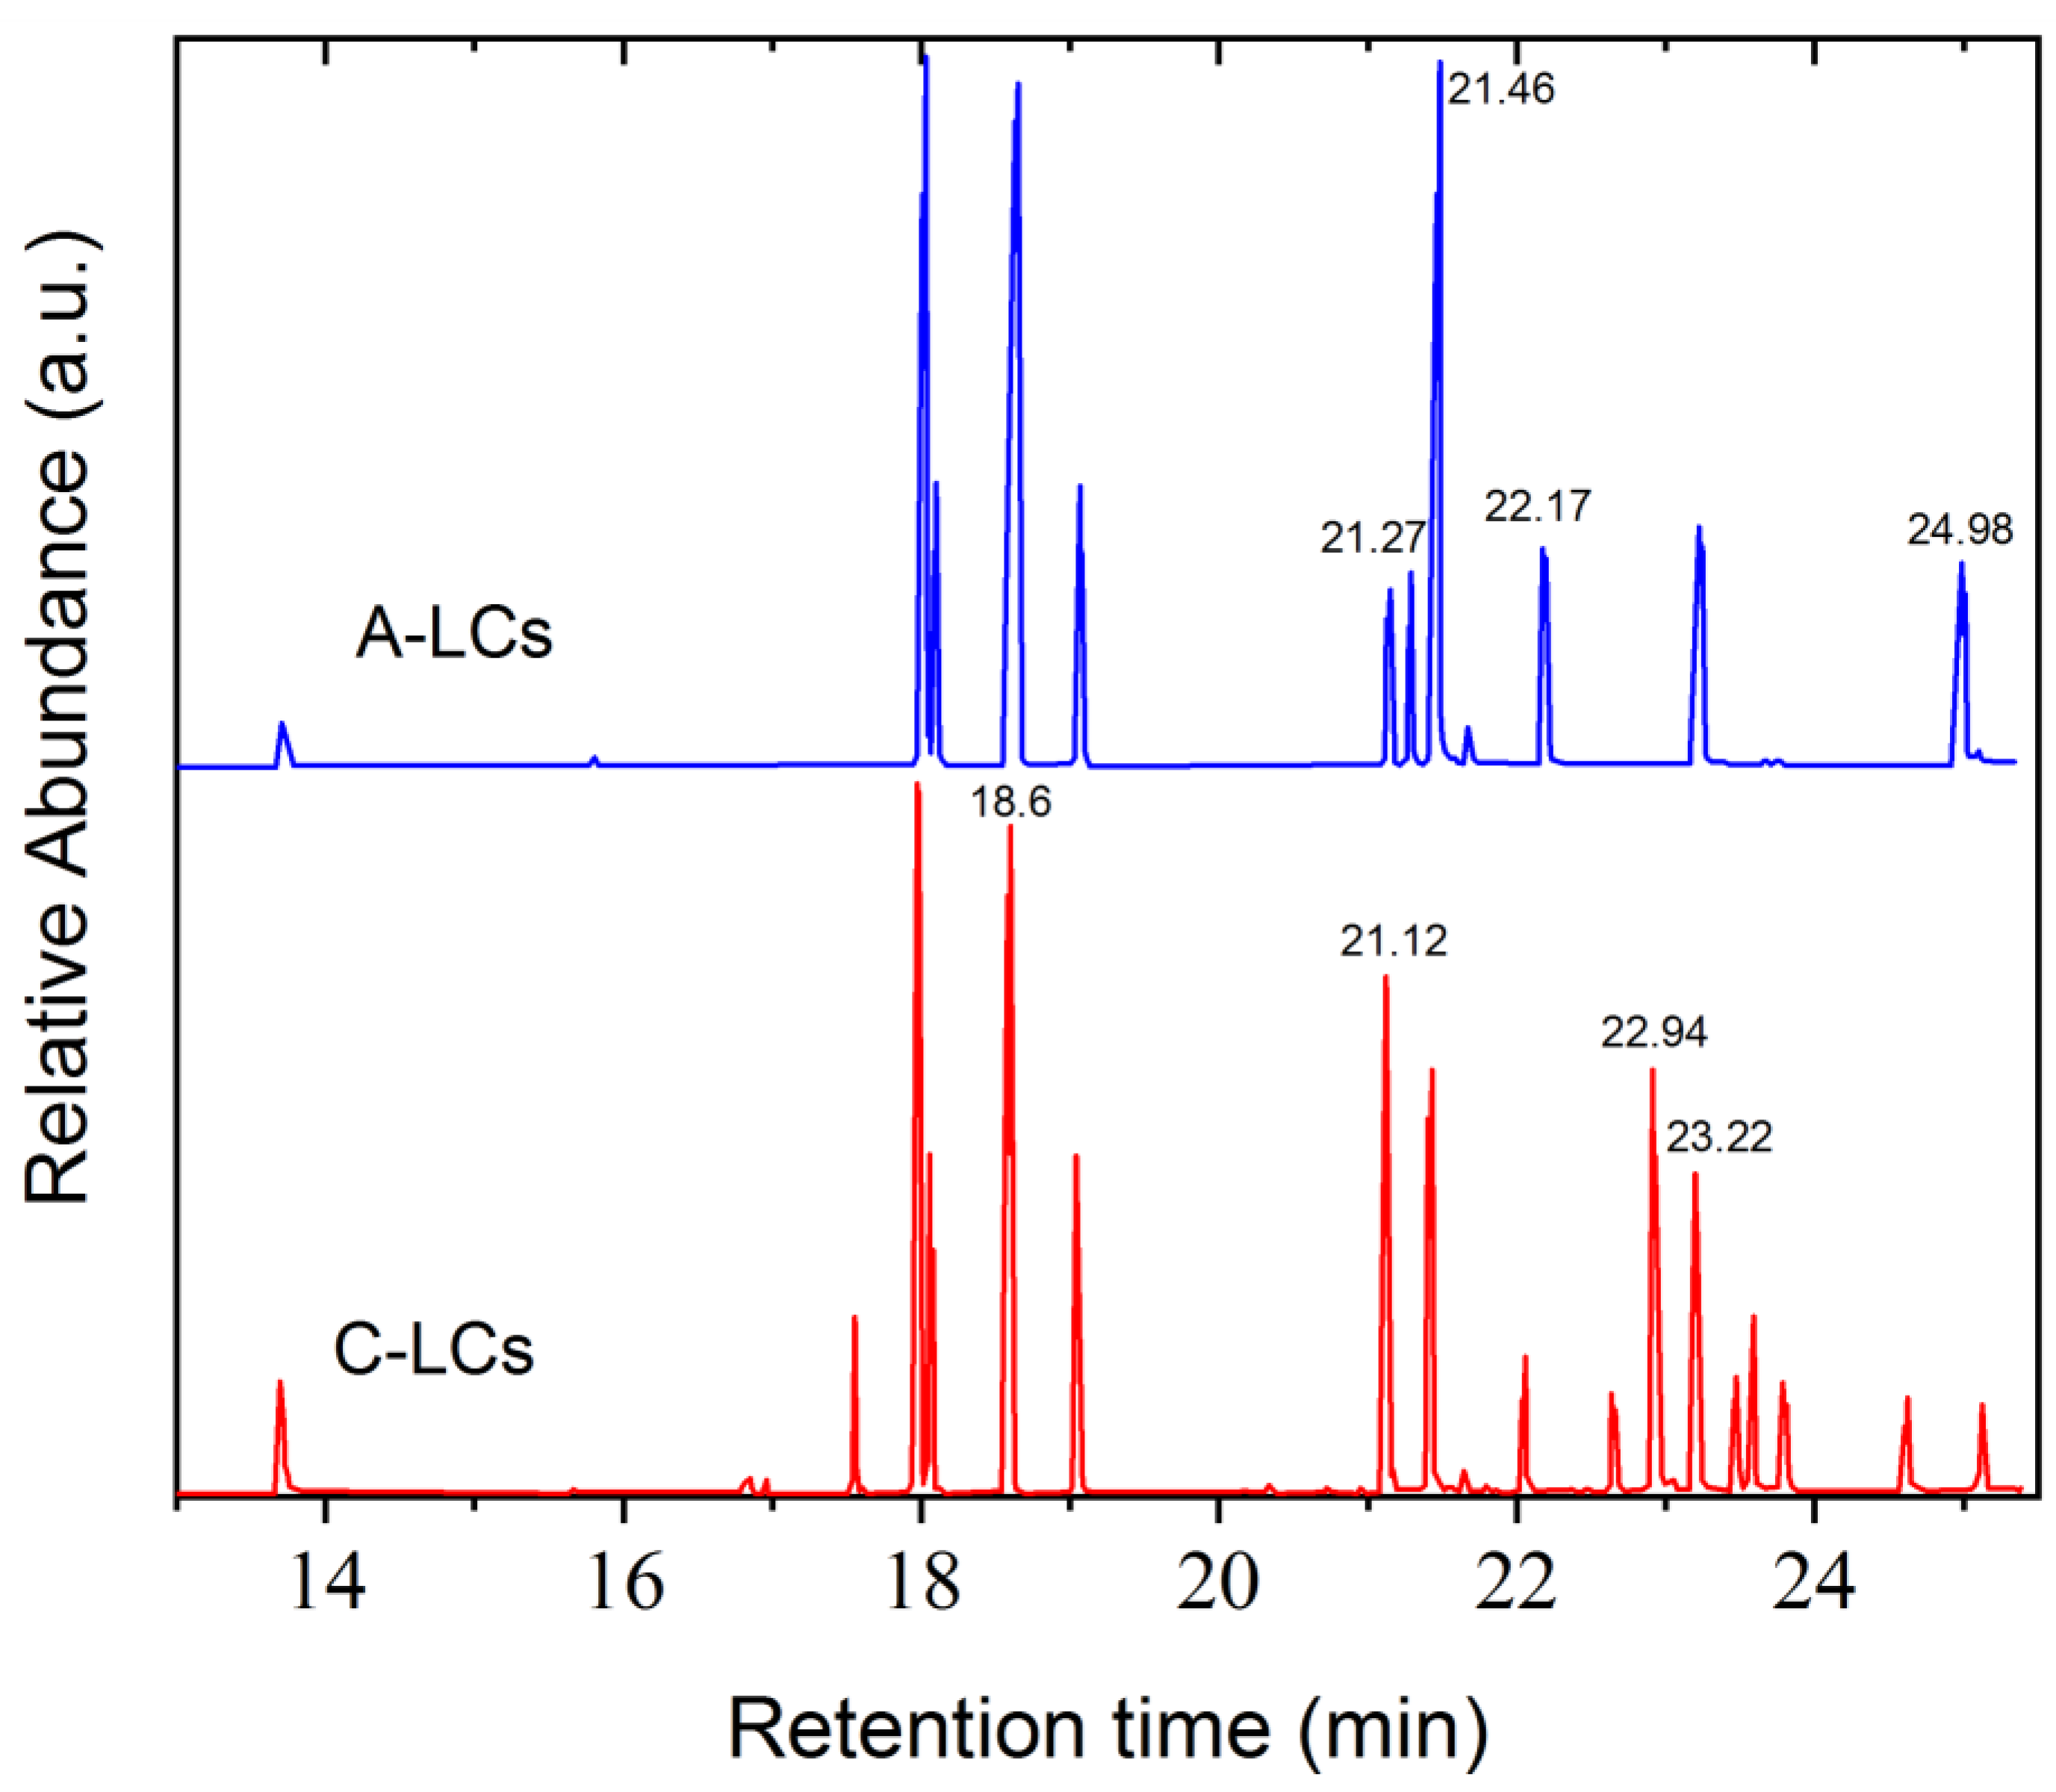
3.2. Chemical Characterization of LCs Mixtures

FTIR spectroscopy provides detailed information regarding the assignment distributions of specific functional groups of LCs extracted from EOL-LCD panels (Figure 5).

3.2.1. Identification of Aromatic Groups and Possible Substitutions

For all LCs molecules stretching vibration bands characteristic of aromatic C–H (small peaks of around 3020 and 3060 cm−1) and C=C (peaks at 1470, 1510 and 1625 cm−1), bonds were detected. Detailed investigation of the 700–800 cm−1 band also provided some information regarding the substitutions on the aromatic cores. In the case of A-LCs, the existence of some bands at 720 and 793 cm−1 indicated that the aromatic cores were, respectively, mono- and para-disubstituted. This was also the case for the D-LCs illustrated by the vibration at 759 cm−1 (mono-substituted) and 789–862 cm−1 (para-disubstituted). The B-LCs contained ortho- (758 cm−1) and para- (790–850 cm−1) disubstituted aromatic products. Finally, C-LCs were characterized by some bands at 734 cm−1 (mono-substituted), 742 cm−1 (ortho-disubstituted) and a pronounced peak at 821 cm−1 (para-disubstituted).

3.2.2. Alkyl and Alkane Groups

The presence of methyl groups was illustrated by some bands around 1255–1295 cm−1 (for all LCs), 1390 cm−1 (A- and B-LCs) and 2943 cm−1 (for all LCs). The existence of methylene groups was indicated by some vibration bands at 2850 and 2916 cm−1 (for all LCs). Alkane chains (RCH2CH3) were characterized by stretching vibrations around 1370–1390 cm−1 and a band at 1450 cm−1.

3.2.3. Aliphatic Group Associated with Specific Chemical Bonds

The products were characterized by strong bands at 1050 cm−1 (B-LCs, C-LCs and D-LCs) and 1070 cm−1 (A-LCs), which correspond to the ether function (R-O-R). Some bands seem to indicate the presence of fluorinated bonds. These appear at 1120–1160 cm−1 (C-F) and 1170–1200 cm−1 (C-F3). Additionally, B-LC-, C-LC- and D-LC-mixtures were characterized by a peak at 1580 cm−1, indicating the presence of an N-H bond. The peak at 1760 cm−1 was easily distinguishable in the case of B-LCs and D-LCs products but weakly pronounced for A-LCs. This band is characteristic of a C=O bond stretching vibration, which indicates the presence of ester groups. This C=O bond is usually associated with another oxygen to build an ester of the formula R-COO-R’. In this structure, the R’ part is often susceptible to carry the dipole moment of the LC molecule. Finally, the A-LC products showed a weak peak at 2221 cm−1, probably corresponding to the presence of a C≡N bond.
The FTIR results corroborated 1H-NMR (Figure 6) and GC-MS (Figure 7) data. Indeed, despite the complexity and the high number of individual molecules in the mixtures used for LCD applications [28], qualitative analysis of spectra allowed us to identify the principal chemical structures of the extracted LCs. Common chemical groups were found for all products. Aromatic (Ar) rings corresponded to chemical shifts in the region of 7.7–6.6 ppm. The other common groups were “R-CH2-O-Ar” (4.2 ppm), “CH3-O-Ar” (3.8 ppm), “CH2-Ar” (2.2 ppm) and aliphatic groups (3–0.7 ppm). However, the “-HC=CH-” group (5.8, 4.8 ppm), observed for A-, B- and D-LCs, was absent in the C-LC sample.
The results of FTIR and 1H NMR analysis are summarized in Table 2. Many LCs generally present several common characteristics. LCs are polarizable molecules consisting of a rigid core unit, flexible ends and polar groups. The flexible alkyl chains reduce the melting point, and the mesogenic rigid cores and polar groups provide the anisotropy necessary for the formation of LC phases. Almost all LC molecules contain two or more phenyl rings linked by –COO, –C=C– and other groups, with various flexible terminal groups and a polar end-group (–CN, –NC and F) [28]. Indeed, the samples consist of chemical groups which correspond to a rigid core (aromatic rings), flexible chains (alkyl, alkane, methylene) or polar groups (presence of O, N, F). The presence of different polar groups in these products extracted from EOL-LCD panels responds to the fact that the design of LC molecules must take into account the relative dipole moment and the position of polar groups within the molecule, the overall molecular polarizability and the presence of any stereogenic centers [29].
Figure 7 shows the GC chromatograms obtained from two representative LC mixtures, A and C. Each peak corresponds to the presence of molecules in the analyzed samples. Applying the mass spectroscopy database, these peaks could be identified. Table 3 gathers some of the main LC components found in the studied mixtures. The chemical structures of these molecules show mainly aromatic rings, polar groups as well as alkyl chains, thus corroborating the typical structure of nematic LCs possessing permanent dipole moments. The presence of fluorine was detected in these LC molecules, as already observed by FTIR and NMR analysis. Other molecules that do not present a typical LC structure were also identified, i.e., 1-Chloro-4-(4-methyl-4-pentenyl) benzene (tR = 18 min), 4-Biphenylol diphenyl phosphate (tR = 19.05 min) and Triphenyl phosphate (tR = 23.9 min).

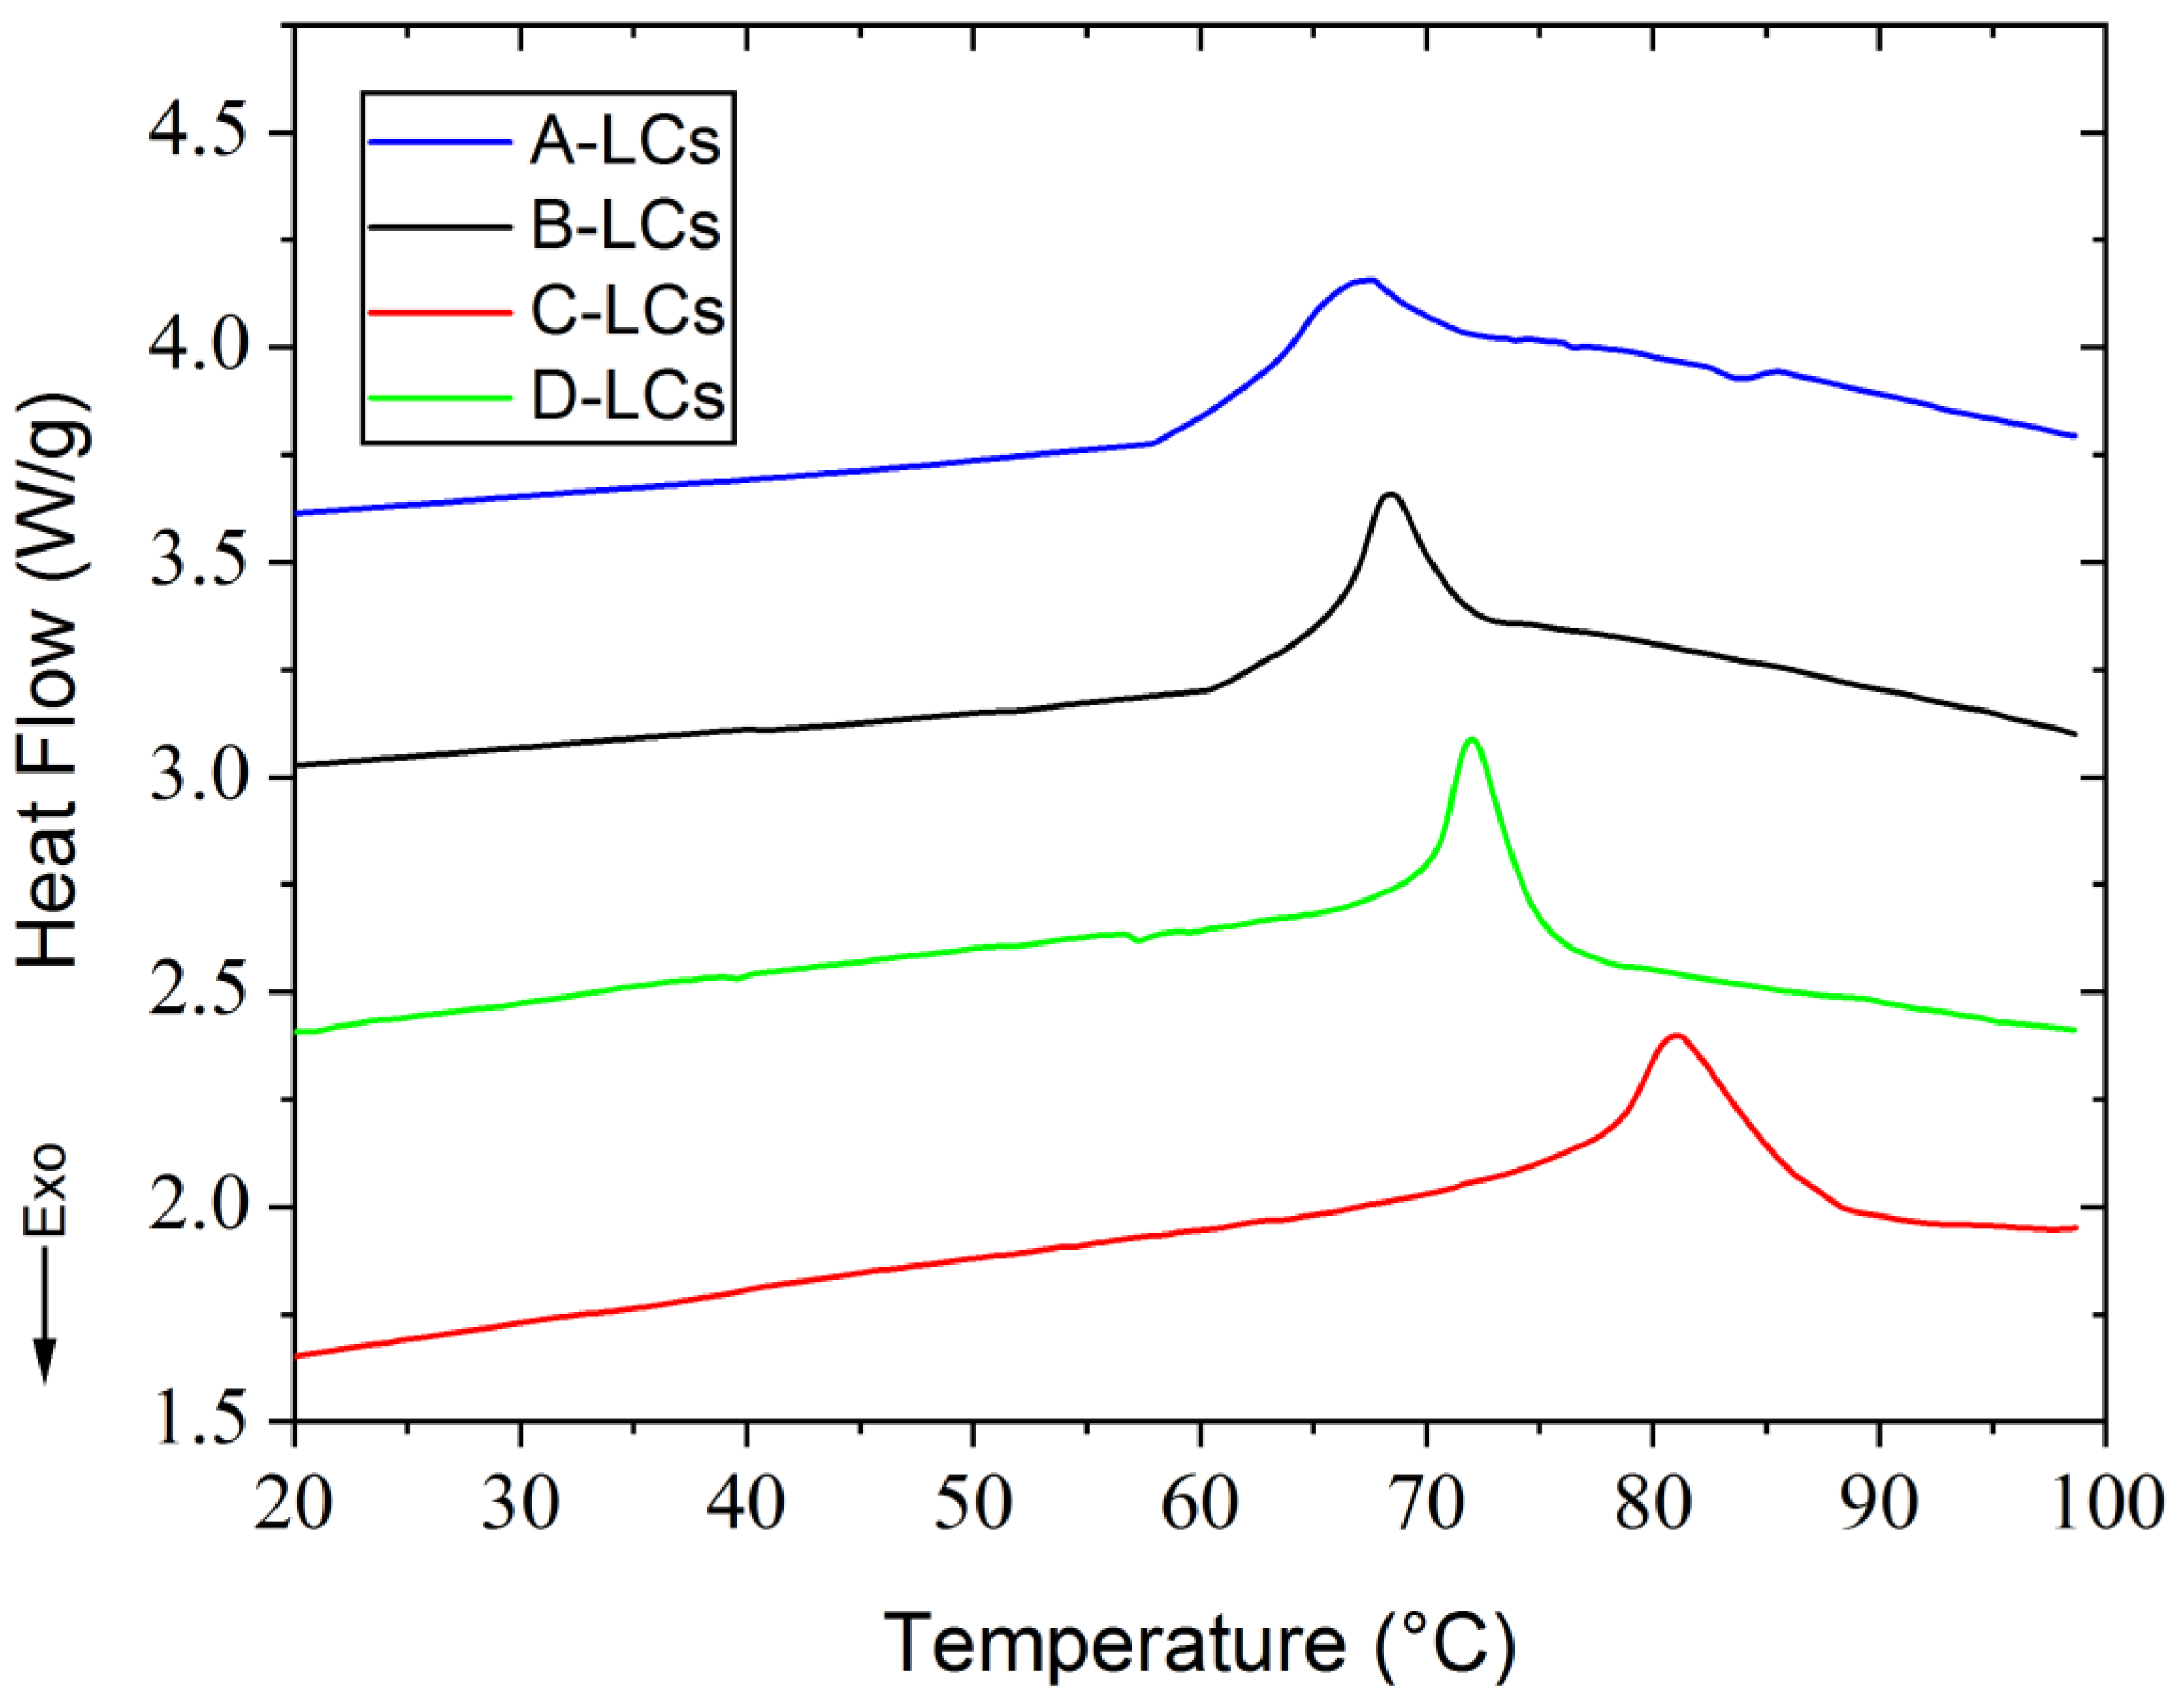
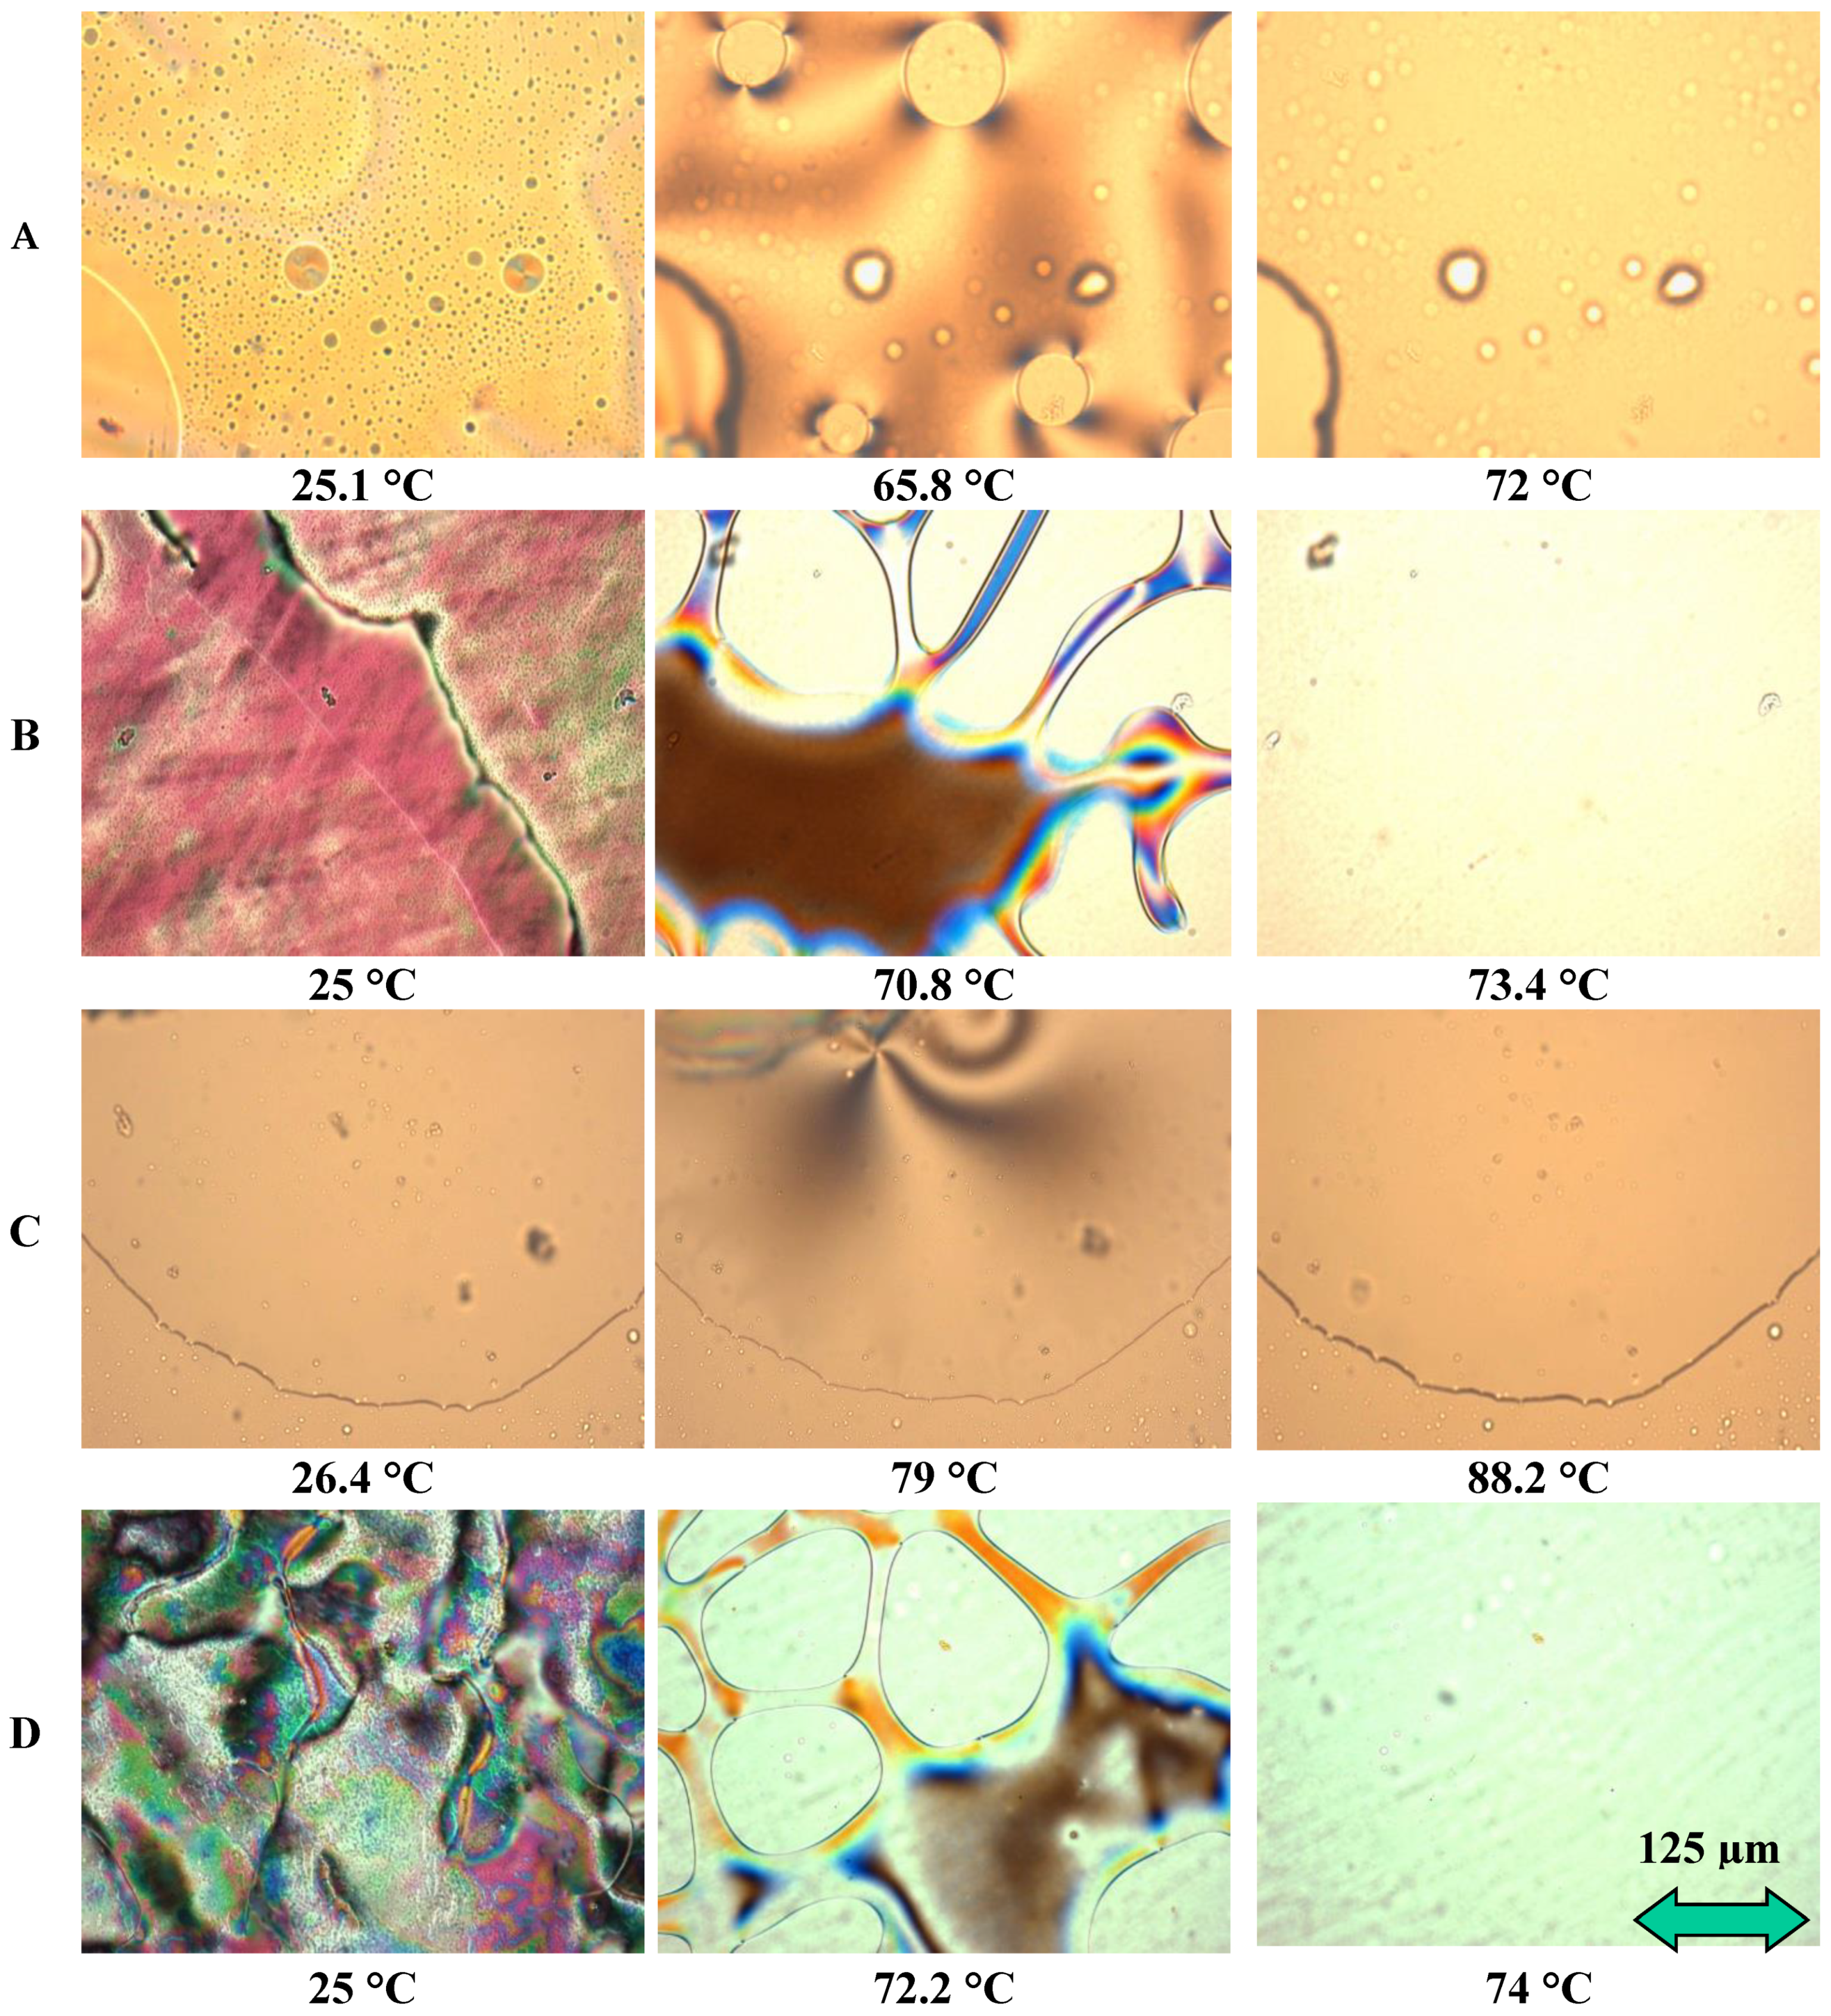
3.3. Mesomorphic Properties

DSC thermograms and some selected POM micrographs showing LC morphologies are presented in Figure 8 and Figure 9, respectively. These were obtained during the first heating ramp. The only thermal phenomenon detected during DSC analysis between 20 °C and 100 °C was the nematic to isotropic transition. Data show that the nematic to isotropic transition temperatures (TNI) increase according to the following order: A (67.5 °C), B (69 °C), D (72 °C) and C (80.8 °C). Distinct changes of TNI were observed in Figure 8, related to a large number of LC molecules with various chemical structures, which are present in EOL-LCD screens. These LCD screens originated from different manufacturers, were fabricated at varied production dates and presented distinct dimensions. Each manufacturer uses a specific original LC mixture according to the type of screen and the technology to be developed. DSC results were found to be reasonably consistent with the findings from POM observations. Upon further heating above TNI, the compounds reach the isotropic state, and the field of view turns into a transparent state. Thus, the extracted samples exhibited stable LC behavior with different mesomorphic temperature ranges.
Figure 9 shows micrographs obtained from three different temperatures for each sample: (1) at room temperature around 25 °C corresponding to the nematic state, (2) at a temperature at the beginning of the transition between nematic and isotropic states (or clearing point) and finally, (3) at a temperature in the isotropic phase. LC morphologies of these samples are different from each other. Thus, in addition to the changes in TNI, the range of clearing points is different according to each sample (see Table 4). Among these four samples, C-LCs exhibited the widest mesomorphic temperature range and the highest clearing point, but its mesophase textures were poorly organized with less developed Schlieren texture. This seems to be consistent with the chemical structures observed for this sample. Indeed, in the C-LC mixture, “-HC=CH-“ and “C=O” (or C≡N) bonds were not detected. The different chemical groups play an important role in influencing the mesomorphic behavior of LCs since they facilitate the formation of mesophases. Some authors indicate, for instance, that the alkoxy terminal groups can increase clearing points or promote the mesophase state of some organic molecules, whereas the absence of this group in the same alkyl chain decreases this mesomorphic state [30]. The chemical composition of these mixtures considerably influences their morphologies obtained by POM.

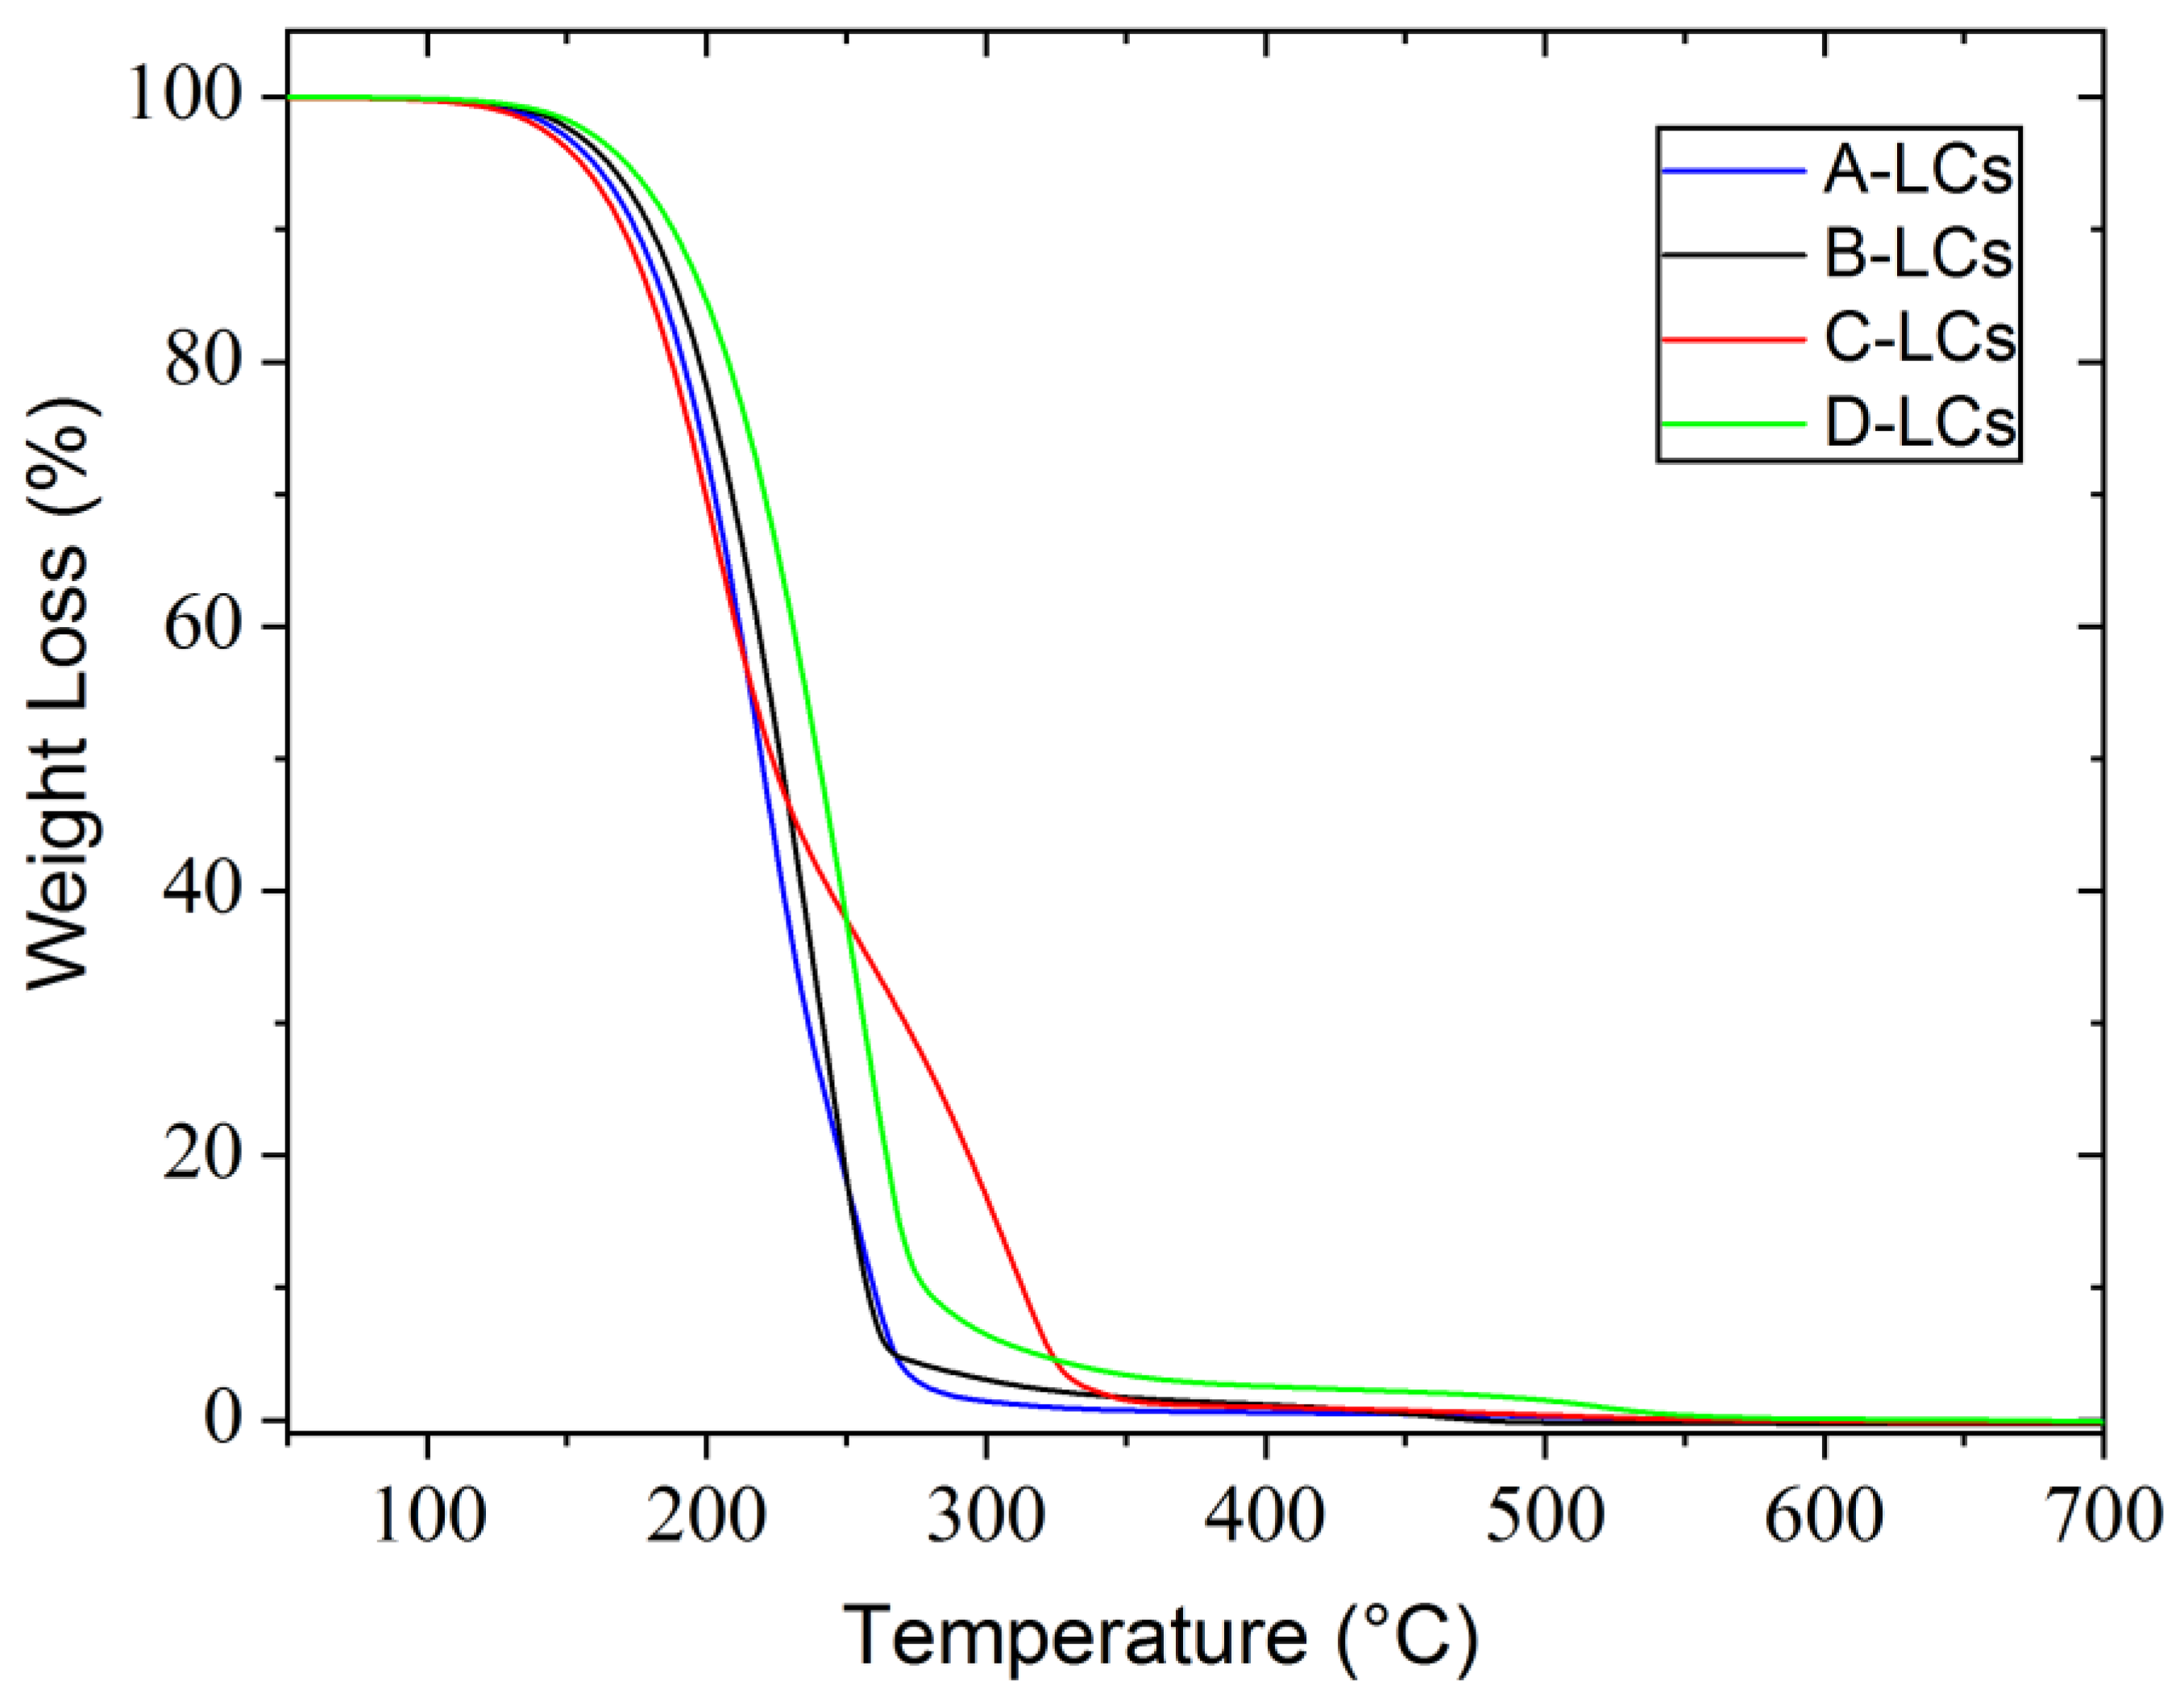
3.4. Thermogravimetric Analysis

Results from TGA analysis of the LC mixtures in an oxidative atmosphere (air) are shown in Figure 10, from which it can be concluded that all compounds have good thermal stability up to 150 °C in the presence of oxygen. Three of these samples, A, B and D, exhibit the same thermal behavior with only one degradation step around 150 °C. Sample C shows two degradation steps, the first at 150 °C identical to the previous three cases and the second at 250 °C characterized by a low slip.

3.5. Economic Interest of Extracted LCs

An economic balance was established to estimate the financial profitability of the recovery of LCs extracted from EOL-LCD panels. This calculation was based on 2500 tons of panels per year or 680 panels per day for 220 working days per year. This number corresponds to a rate of 97 panels per hour (one panel in 37 s) for a working week of five days and seven hours of daily activity. The calculation also considered the panel size, which is required for the estimation of LCs quantities to be extracted. The most representative size of LCD panels in the current EOF-LCD waste stream is 35 inches.

3.5.1. Evaluation of the Amount of Liquid Crystals

The weight of the LC residues depends on the space between the two plates of glass or the thickness (T) of LCs in the layers. This thickness can vary between 3 µm and 5 µm. LCs are distributed over the entire inner face of the glass plate (active area, S). Finally, the specific gravity (d) of the LCs varies from 0.97 to 1 g/cm3. Hence, the following simple formula provides the theoretical mass of LCs:
Mass of extracted LCs (g) = T × S × d.
The expected quantities of LCs are provided in Table 5. Applying a 60% recovery rate for a manual process, 678 g of LC material can be obtained considering 680 panels of 35-inch diameter per day. The recovery techniques must be implemented as an efficient process.

3.5.2. Economic Benefits and Reuse Fields

The average price of LC mixtures sold for LCD applications varies between EUR 10 per gram and approximately EUR 100 per gram in the current market. As the use of LCDs continues to rise significantly, the economic stakes are huge, fully justifying the development of a LC recovery process. The LCs extracted from EOL-LCD panels have many potential uses:
(a)
LCD flat panels
The extracted molecule LCs can be recycled in the production of LCD flat panels if their original electro-optical properties are maintained. It is conceivable in this case to separate and purify the LC molecules in order to increase the recovery profitability. For example, the Industrial Technology Research Institute (ITRI) has recovered and reused 100 tons of LC in order to assist Taiwanese LCD developers [18].
(b)
Their use in PDLC systems
Purified LC molecules from EOL-LCD panels can be integrated into PDLC systems (Polymer Dispersed Liquid Crystals). By making a suitable choice of components of the mixture, it is possible to obtain a transparent film when the system is subjected to a sufficient electric voltage (“on” state) and opaque in the absence of voltage (“off” state). These materials are of interest for their many applications, especially in the field of electroactive glazing and display devices [31,32,33,34].
(c)
LCs recycled as lubricants
Recent studies conducted at the Fraunhofer Institute for Mechanics of Materials (IMM) in Freiburg, Germany, have provided surprising results. While the friction force remains constant with oil, when using an LC layer, the friction forces start to decrease to almost zero after a certain time [35,36]. This application opens new perspectives for using LCs, whose use was mainly oriented in the electronics and telecommunications fields. Moreover, it would appear that the use of lower-quality LCs is as effective as using pure LCs in LCD panels.
(d)
Recycled liquid crystals and thermal effects (thermochromic molecules)
The majority of LC applications utilize their sensitivity to temperature. Extracted LCs could also be used in temperature indicators (food packaging, medical sector), document security domains (passports, banknotes, designer clothes labels), battery testers and other voltage measuring devices, medical thermography, detection of radiation and thermal mapping.

4. Conclusions

EOL-LCD panels contain several valuable materials such as plastics, metals and electronics that account for more than 90% by weight of all components of LCD panels. Even if LC molecules represent less than 0.1% of all components by weight, their extraction and the possibility of introducing them in new processes have gained real technological and ecological interest. Indeed, this work presents the possibility of removing LC molecules from EOL-LCDs by a simple mechanical method without the use of organic solvents. The results show that all extracted LCs retain good optical, chemical and physical properties despite the aging effects of the panels. The residue of LCs obtained from mechanical extraction seems to be a good candidate material for further optical and electro-optical applications. A high degree of purity of the extracted LC molecules was observed, principally by NMR analysis, revealing the presence of chemical groups typical of nematic LC structures. Moreover, POM and DSC studies also corroborate the findings of NMR. In particular, only one nematic isotropic phase transition was found, indicating the existence of a homogeneous LC phase.
One of the aims of this work was to enhance the yield of collected LC molecules from used panels, purifying these products and looking forward to finding some interesting applications. These LC molecules might be found in new flat LCD panels after the purification of LC concentrate, in polymer/LC systems, in thermal applications, i.e., as temperature indicators, or they are used as lubricant to decrease friction forces. In order to bridge the gap between academic studies and industrial applications, continuous research and development work must be performed for all cases mentioned here. Studies will be undertaken in our laboratory to further investigate the challenging issue of reusing recycled LCs as mixtures.

Author Contributions

Conceptualization, U.M.; methodology, I.M., G.-J.F.T. and U.M.; validation, Z.B. and F.D.; investigation, I.M., G.-J.F.T., A.B. and Y.D.; data curation, I.M. and G.-J.F.T.; writing—original draft preparation, I.M., U.M., A.B., P.S. and C.F.; writing—review and editing. All authors have read and agreed to the published version of the manuscript.

Funding

This research was funded by the French Agency for Environment and Energy (ADEME), the University of Lille, the Région Hauts-de-France (FEDER) and the ENVIE2E Company. The APC was funded by MDPI and by the University of Lille/France.

Institutional Review Board Statement

Not applicable.

Informed Consent Statement

Not applicable.

Data Availability Statement

The dataset presented in this study is available in this article.

Acknowledgments

The authors acknowledge financial support from the French Agency for Environment and Energy (ADEME), the University of Lille, the Région Hauts-de-France (FEDER), the ENVIE2E Company, and MDPI.

Conflicts of Interest

All authors declare no conflict of interest.

Sample Availability

Samples of the compounds are currently under use for other applications.

References

  1. Directive 2002/96/EC of the European Parliament and of the council of 27 January 2003 on waste electrical and electronic equipment (WEEE). Off. J. Eur. Union 2003, L37/24, 12–25.
  2. Directive 2002/95/EC of the European Parliament and of the council of 27 January 2003 on the restriction of the use of certain hazardous substances in electrical and electronic equipment. Off. J. Eur. Union 2003, L174/88, 19–23.
  3. Décret n 2005-829 du 20 juillet 2005 relatif à la composition des équipements électriques et électroniques et à l’élimination des déchets issus de ces équipements. J. Off. République Française 2005, 169, 8.
  4. Décret n 2012-617 du 2 mai 2012 relatif à la gestion des déchets de piles et accumulateurs et d’équipements électriques et électroniques. J. Off. République Française 2012, 105, 19–72.
  5. Décret n 2014-928 du 19 août 2014 relatif aux déchets d’équipements électriques et électroniques et aux équipements électriques et électroniques usagés. J. Off. République Française 2014, 193, 10–56.
  6. European Commission. Circular Economy Action Plan. Available online: https://ec.europa.eu/environment/strategy/circular-economy-action-plan_en (accessed on 19 April 2021).
  7. Conseil Supérieur de L’audiovisuel. L’équipement Audiovisuel des Foyers au 1er Semestre 2018. Available online: https://www.csa.fr/Informer/Collections-du-CSA/Panorama-Toutes-les-etudes-liees-a-l-ecosysteme-audiovisuel/Les-observatoires-de-l-equipement-audiovisuel/L-equipement-audiovisuel-des-foyers-au-1er-semestre-2018 (accessed on 19 April 2021).
  8. Singh, S. Liquid Crystals Fundamentals, 1st ed.; World Scientific Publishing Co. Pte. Ltd.: London, UK, 2002; ISBN 9810242506. [Google Scholar]
  9. Brown, C.V. Physical Properties of Nematic Liquid Crystals. In Handbook of Visual Display Technology; Chen, J., Cranton, W., Fihn, M., Eds.; Springer: Berlin/Heidelberg, Germany, 2012; Volume 1–4, pp. 1343–1361. ISBN 9783540795674. [Google Scholar]
  10. Collings, P.J.; Hird, M. Introduction to Liquid Crystals: Chemistry and Physics, 1st ed.; Taylor & Francis Ltd.: London, UK, 2017; ISBN 9781351989244. [Google Scholar]
  11. Yang, D.K.; Wu, S.T. Fundamentals of Liquid Crystal Devices, 1st ed.; John Wiley & Sons Ltd.: Chichester, UK, 2014; ISBN 9781118751992. [Google Scholar]
  12. Goodship, V.; Stevels, A.; Huisman, J. Waste Electrical and Electronic Equipment (WEEE) Handbook, 2nd ed.; Woodhead Publishing (Elsevier): Cambridge, UK, 2019; ISBN 9780081021583. [Google Scholar]
  13. Xenarc Tecnhologies. How The Technology of LCD Displays Works. Available online: https://www.xenarc.com/lcd-technology.html (accessed on 18 October 2021).
  14. Ueberschaar, M.; Schlummer, M.; Jalalpoor, D.; Kaup, N.; Rotter, V.S. Potential and recycling strategies for LCD panels from WEEE. Recycling 2017, 2, 7. [Google Scholar] [CrossRef] [Green Version]
  15. Kawamoto, H. The history of liquid-crystal display and its industry. In Proceedings of the 2012 Third IEEE HISTory of ELectro-technology CONference (HISTELCON), Pavia, Italy, 5–7 September 2012; pp. 1–6. [Google Scholar]
  16. Amato, A.; Beolchini, F. End of life liquid crystal displays recycling: A patent review. J. Environ. Manage. 2018, 225, 1–9. [Google Scholar] [CrossRef] [PubMed]
  17. Hunt, A.J.; Clark, J.H.; Breeden, S.W.; Matharu, A.S.; Ellis, C.; Goodby, J.W.; Bottomley, J.A.; Cowling, S.J. Extraction of liquid crystals from flat panel display devices using both liquid and supercritical carbon dioxide. In Proceedings of the 11th International Supercritical Conference Proceedings, Barcelona, Spain, 4–7 May 2008; Volume 7, pp. 343–354. [Google Scholar]
  18. ITRI. LCD Waste Recycling System-Circular Economy-Sustainable Environment-Innovations and Applications-Industrial Technology Research Institute. Available online: https://www.itri.org.tw/english/ListStyle.aspx?DisplayStyle=01_content&SiteID=1&MmmID=1037333532432522160&MGID=1037350654202216363 (accessed on 30 March 2021).
  19. Izhar, S.; Yoshida, H.; Nishio, E.; Utsumi, Y.; Kakimori, N. Removal and recovery attempt of liquid crystal from waste LCD panels using subcritical water. Waste Manag. 2019, 92, 15–20. [Google Scholar] [CrossRef] [PubMed]
  20. Fontana, D.; Forte, F.; De Carolis, R.; Grosso, M. Materials recovery from waste liquid crystal displays: A focus on indium. Waste Manag. 2015, 45, 325–333. [Google Scholar] [CrossRef] [PubMed] [Green Version]
  21. Yoshida, H.; Izhar, S.; Nishio, E.; Utsumi, Y.; Kakimori, N.; Asghari, F.S. Recovery of indium from TFT and CF glasses of LCD wastes using NaOH-enhanced sub-critical water. J. Supercrit. Fluids 2015, 104, 40–48. [Google Scholar] [CrossRef]
  22. Souada, M.; Louage, C.; Doisy, J.Y.; Meunier, L.; Benderrag, A.; Ouddane, B.; Bellayer, S.; Nuns, N.; Traisnel, M.; Maschke, U. Extraction of indium-tin oxide from end-of-life LCD panels using ultrasound assisted acid leaching. Ultrason. Sonochem. 2018, 40, 929–936. [Google Scholar] [CrossRef] [PubMed]
  23. Amato, A.; Becci, A.; Mariani, P.; Carducci, F.; Ruello, M.L.; Monosi, S.; Giosuè, C.; Beolchini, F. End-of-life liquid crystal display recovery: Toward a zero-waste approach. Appl. Sci. 2019, 9, 2985. [Google Scholar] [CrossRef] [Green Version]
  24. Zhang, K.; Li, B.; Wu, Y.; Wang, W.; Li, R.; Zhang, Y.N.; Zuo, T. Recycling of indium from waste LCD: A promising non-crushing leaching with the aid of ultrasonic wave. Waste Manag. 2017, 64, 236–243. [Google Scholar] [CrossRef] [PubMed]
  25. Matharu, A.S.; Wu, Y. Liquid Crystal Displays: From Devices to Recycling. In Issues in Environmental Science and Technology; Hester, R.E., Harrison, R.M., Eds.; Royal Society of Chemistry: Cambridge, UK, 2009; pp. 180–211. ISBN 978-0-85404-112-1. [Google Scholar]
  26. Barrera, A.; Binet, C.; Dubois, F.; Hébert, P.A.; Supiot, P.; Foissac, C.; Maschke, U. Dielectric spectroscopy analysis of liquid crystals recovered from end-of-life liquid crystal displays. Molecules 2021, 26, 2873. [Google Scholar] [CrossRef] [PubMed]
  27. Maschke, U.; Moundoungou, I.; Fossi-Tabieguia, G.J. Method for Extracting the Liquid Crystals Contained in an Element that Comprises a First Support and a Second Support-Associated Device. Patent No. EP3111276 (A1), 1 April 2017. [Google Scholar]
  28. Bezborodov, V.S.; Petrov, V.F.; Lapanik, V.I. Liquid crystalline oxygen containing heterocyclic derivatives. Liq. Cryst. 2006, 20, 785–796. [Google Scholar] [CrossRef]
  29. Pakiari, A.H.; Aazami, S.M.; Ghanadzadeh, A. Electronic interactions of typical liquid crystal molecules with typical contacted species generated from the surface of different materials. J. Mol. Liq. 2008, 139, 8–13. [Google Scholar] [CrossRef]
  30. Mandle, R.J.; Bevis, E.; Goodby, J.W. Phase Structures of Nematic Liquid Crystals. In Handbook of Liquid Crystals: Physical Properties and Phase Behaviour of Liquid Crystals; Wiley-VCH Verlag GmbH & Co.: Weinheim, Germany, 2014; pp. 1–27. [Google Scholar]
  31. Bouchakour, M.; Derouiche, Y.; Bouberka, Z.; Beyens, C.; Supiot, P.; Dubois, F.; Riahi, F.; Maschke, U. Electron Beam Curing of Monomer/Liquid Crystal Blends. In Polymer-Modified Liquid Crystals; Dierking, I., Ed.; Royal Society of Chemistry: Cambridge, UK, 2019; pp. 45–60. ISBN 9781782629825. [Google Scholar]
  32. Bouchakour, M.; Derouiche, Y.; Bouberka, Z.; Beyens, C.; Mechernène, L.; Riahi, F.; Maschke, U. Optical properties of electron beam- and UV-cured polypropyleneglycoldiacrylate/liquid crystal E7 systems. Liq. Cryst. 2015, 42, 1527–1536. [Google Scholar] [CrossRef]
  33. Jain, A.K.; Deshmukh, R.R. An Overview of Polymer-Dispersed Liquid Crystals Composite Films and Their Applications. In Liquid Crystals and Display Technology; IntechOpen: London, UK, 2020; pp. 11–78. ISBN 978-1-78985-368-1. [Google Scholar]
  34. Saeed, M.H.; Zhang, S.; Cao, Y.; Zhou, L.; Hu, J.; Muhammad, I.; Xiao, J.; Zhang, L.; Yang, H. Recent advances in the polymer dispersed liquid crystal composite and its applications. Molecules 2020, 25, 5510. [Google Scholar] [CrossRef] [PubMed]
  35. Sengupta, A.; Schulz, B.; Ouskova, E.; Bahr, C. Functionalization of microfluidic devices for investigation of liquid crystal flows. Microfluid Nanofluid 2012, 13, 941–955. [Google Scholar] [CrossRef]
  36. Yang, J.; Yuan, Y.; Li, K.; Amann, T.; Wang, C.; Yuan, C.; Neville, A. Ultralow friction of 5CB liquid crystal on steel surfaces using a 1,3-diketone additive. Wear 2021, 480, 203934. [Google Scholar] [CrossRef]
Figure 1. Structure of an LCD-TV module (from [13]).
Crystals 12 01672 g001
Figure 2. Schematic localization of LCs in the LCD panels.
Crystals 12 01672 g002
Figure 3. The opening stages of an LCD panel giving access to LCs. (a,b) Manual opening of the sandwiched glass plates using a scalpel. (c) Separation of the two glass plates, on the left-hand side, front of the panel consisting of color filters and black matrix; on the right-hand side, back side. (d) Collected LCs molecules with translucent and slightly viscous aspects.
Crystals 12 01672 g003
Figure 4. Weight of LCs mixtures extracted manually from 31 EOL-LCD panels.
Crystals 12 01672 g004
Figure 5. FTIR results from LC mixtures of LCDs A, B, C and D.
Crystals 12 01672 g005
Figure 6. 1H-NMR results from LC mixtures of EOL-LCD A, B, C and D.
Crystals 12 01672 g006
Figure 7. GC results from LC mixtures of EOL-LCD A and C.
Crystals 12 01672 g007
Figure 8. DSC results from LC mixtures of EOL-LCDs A, B, C and D.
Crystals 12 01672 g008
Figure 9. POM results from LC mixtures of EOL-LCDs A, B, C and D.
Crystals 12 01672 g009
Figure 10. TGA results from LC mixtures of EOL-LCDs A, B, C and D.
Crystals 12 01672 g010
Table 1. Amount of LCs mixtures extracted from selected EOL-LCD panels A, B, C and D.
D-LCsB-LCsA-LCsC-LCs
Diameter (inch)
of the LCD panel
23263232
Mass (mg)
of recovered LC
347.6575.4754.8873.5
Table 2. Correspondence between general LC characteristics and results from FTIR and 1H NMR analysis of EOL-LCDs A, B, C and D.
LC
Characteristics
ABCD
Rigid coreAromatic rings
Mono-, para-substituted
Aromatic rings
Para-, ortho-substituted
Aromatic rings
Mono-, para-, ortho-substituted
Aromatic rings
Mono-, para-substituted
Flexible chainsCH3-…
…-CH2-…
R…CH2…CH3
-HC=CH-
CH3-…
…-CH2-…
R…CH2…CH3
-HC=CH-
CH3-…
…-CH2-…
R…CH2…CH3
CH3-…
…-CH2-…
R…CH2…CH3
-HC=CH-
Polar groupsC≡N, C-O,
C-F/C-F3,
C=O
C-O,
C-F/C-F3,
C=O
C-O,
C-F/C-F3,
C-O,
C-F/C-F3,
C=O
Table 3. Assignment of some peaks corresponding to LC molecules of GC chromatograms obtained from LC mixtures A and C.
Retention Time (min)Assignment
A-LCs
21.27Crystals 12 01672 i001
4-ethyl-4′-(4-(trifluoromethoxy) phenyl)-1,1′-bi(cyclohexane)
21.46Crystals 12 01672 i002
4- butoxy-2,3-dicyanophenyl 4-((1r,4r)-4-ethylcyclohexyl) benzoate
22.17Crystals 12 01672 i003
4′-propyl-bicyclohexyl-4-carboxylic acid 4-fluoro-phenyl ester
24.98Crystals 12 01672 i004
4′-cyano-(1,1′-biphenyl)-4-y1 4-(-4-pentylcyclohexyl) benzoate
C-LCs
18.60Crystals 12 01672 i005
4-(4-Fluoro-phenyl)-4′-propyl-bicyclohexyl
21.12Crystals 12 01672 i006
1-((1r,4r)-4-ethylcyclohexyl)-4-((E)-4-propylstyryl) benzene
22.94Crystals 12 01672 i007
(1s, 1r’, 4R, 4′R)-4-propyl-4′-(p-tolyl)-1,1′-bi(cyclohexane)
23.22Crystals 12 01672 i008
4-(3,4-difluoro-phenyl)-4′-pentyl-1,1′-bi(cyclohexane)
Table 4. Mesomorphic and thermal properties of LCs extracted from LC mixtures of EOL-LCDs A, B, C and D.
SampleTNI (°C)Clearing Point Range
T (°C) [ΔT]
A67.565.8–72 [6.2 °C]
B6970.8–73.4 [2.6 °C]
C80.879–88.2 [9.2 °C]
D7272.2–74 [1.8 °C]
Table 5. Evaluation of mass of extracted LC from EOL-LCD (panels of 35-inch diameter).
LC Interlayer Thickness3 µm4 µm5 µm
Specific gravity1 g/cm31 g/cm31 g/cm3
Theoretical mass (one panel)1.01 g1.35 g1.69 g
« Real » mass (one panel, for 60% of recovery rate)0.61 g0.81 g1.01 g
Total per day (680 panels)415 g551 g678 g
Publisher’s Note: MDPI stays neutral with regard to jurisdictional claims in published maps and institutional affiliations.

