
Biological Mineralization of Hydrophilic Intraocular Lenses
 ,
,
Abstract
:1. Introduction
2. Materials and Methods
2.1. Mineralization Experiments
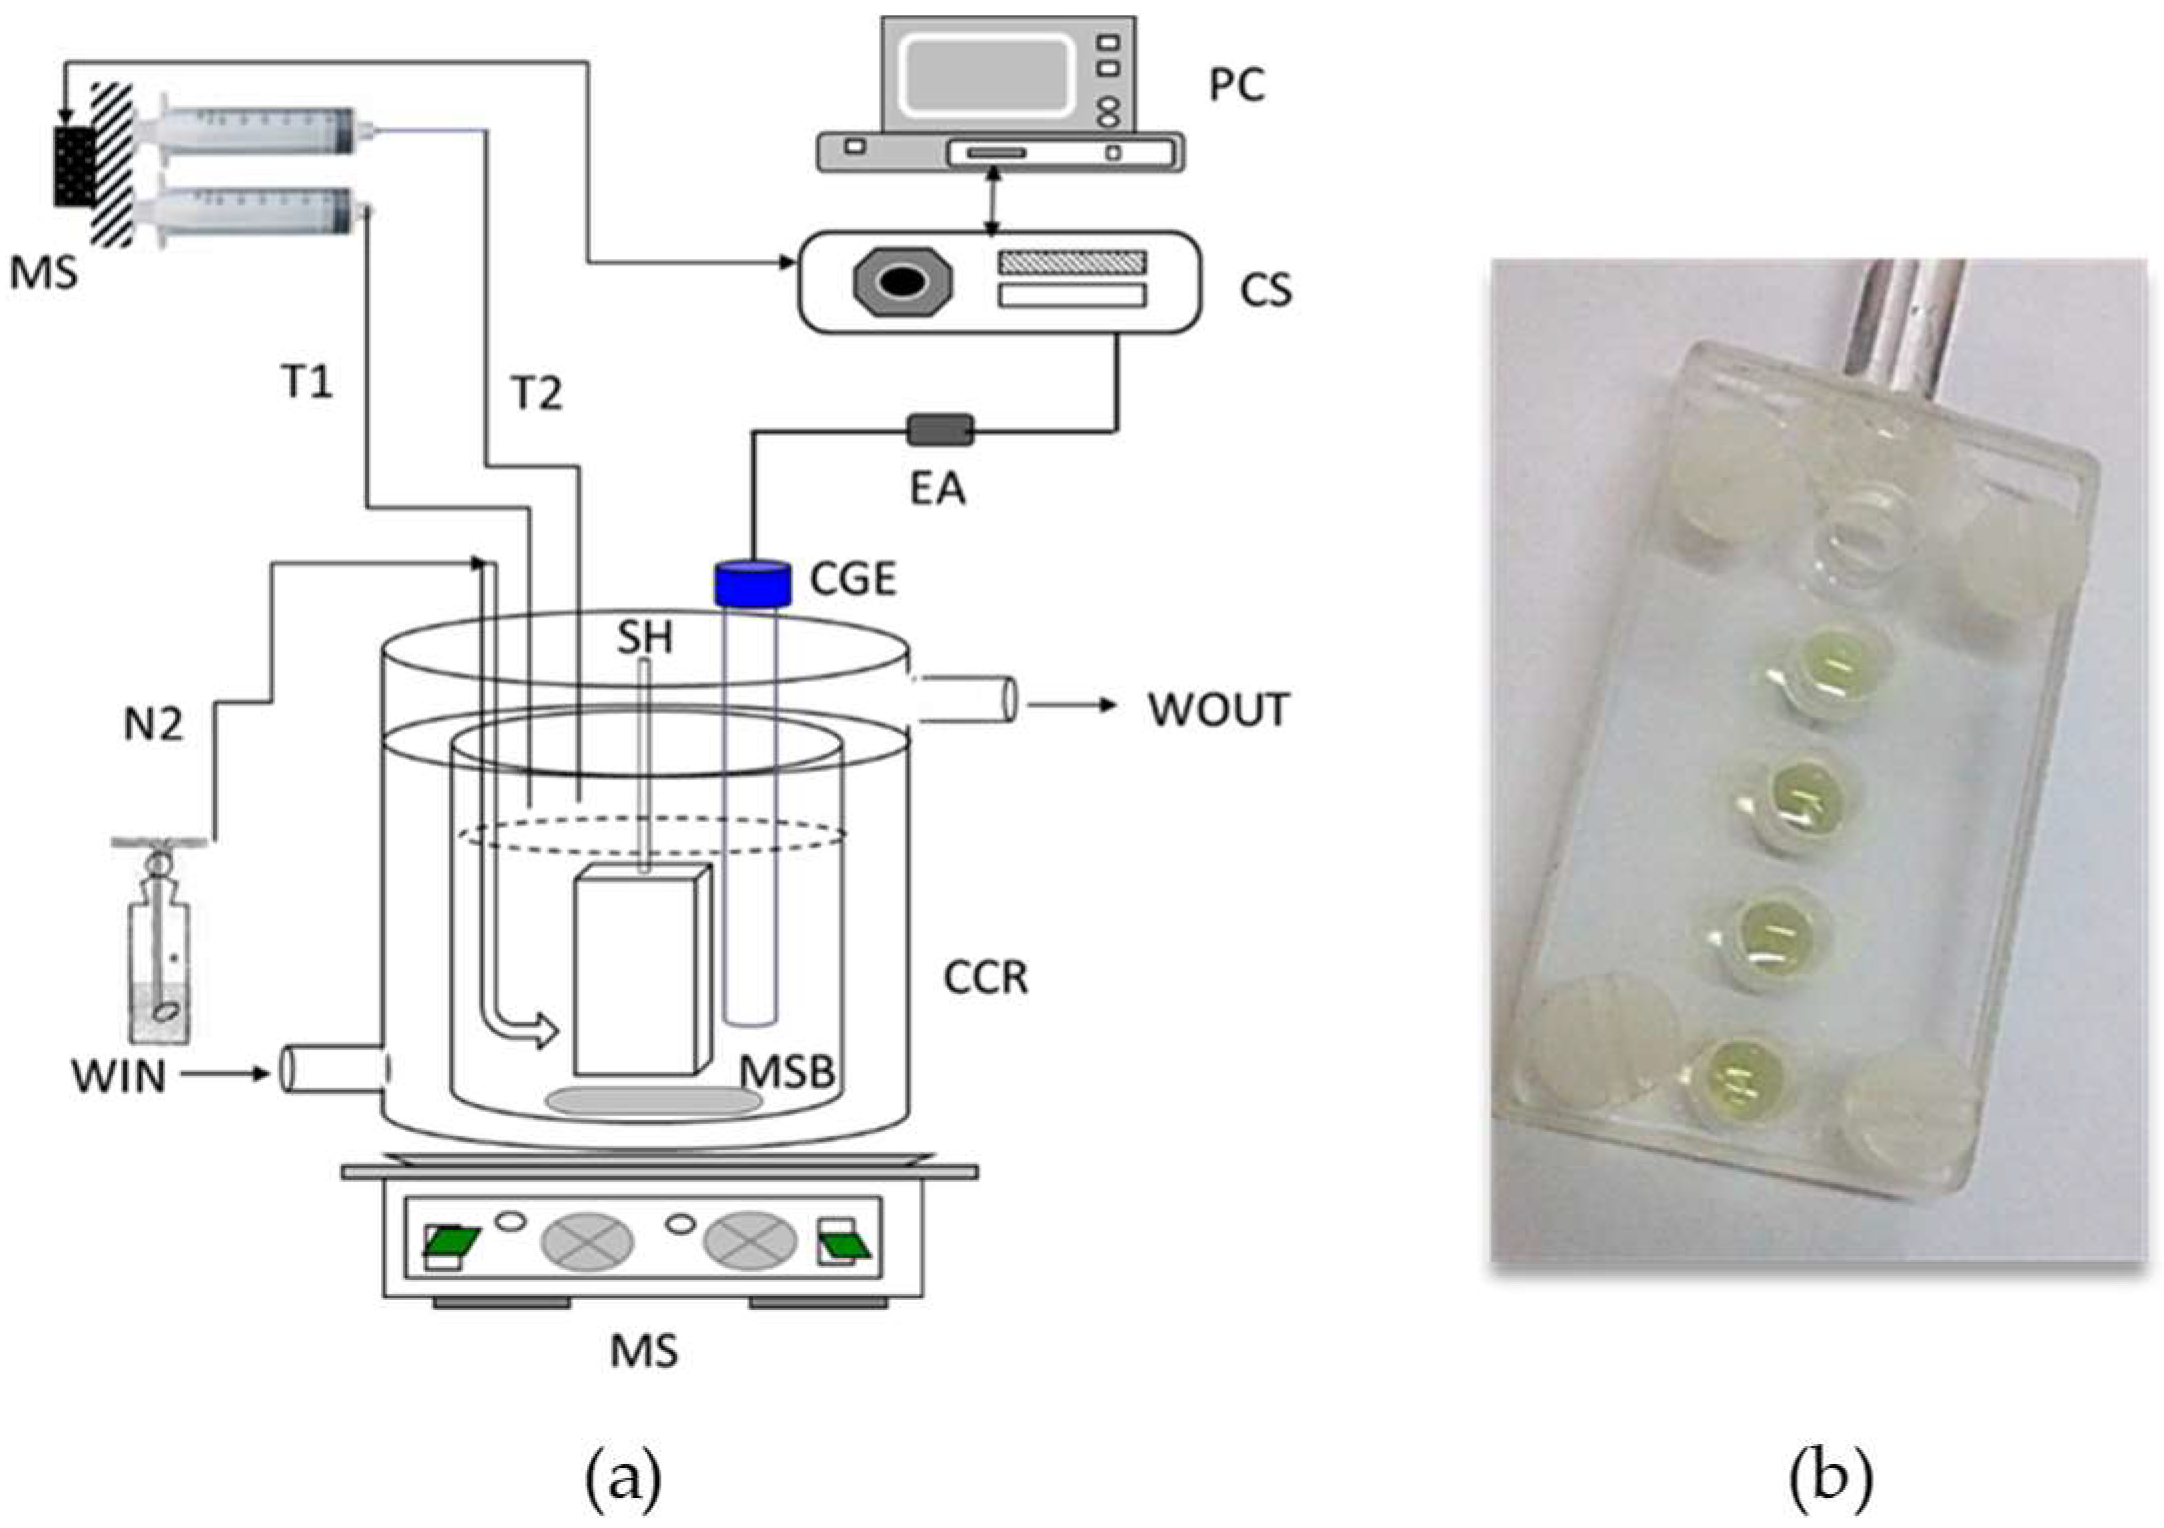
2.1.1. Constant Composition Reactor (CCR)
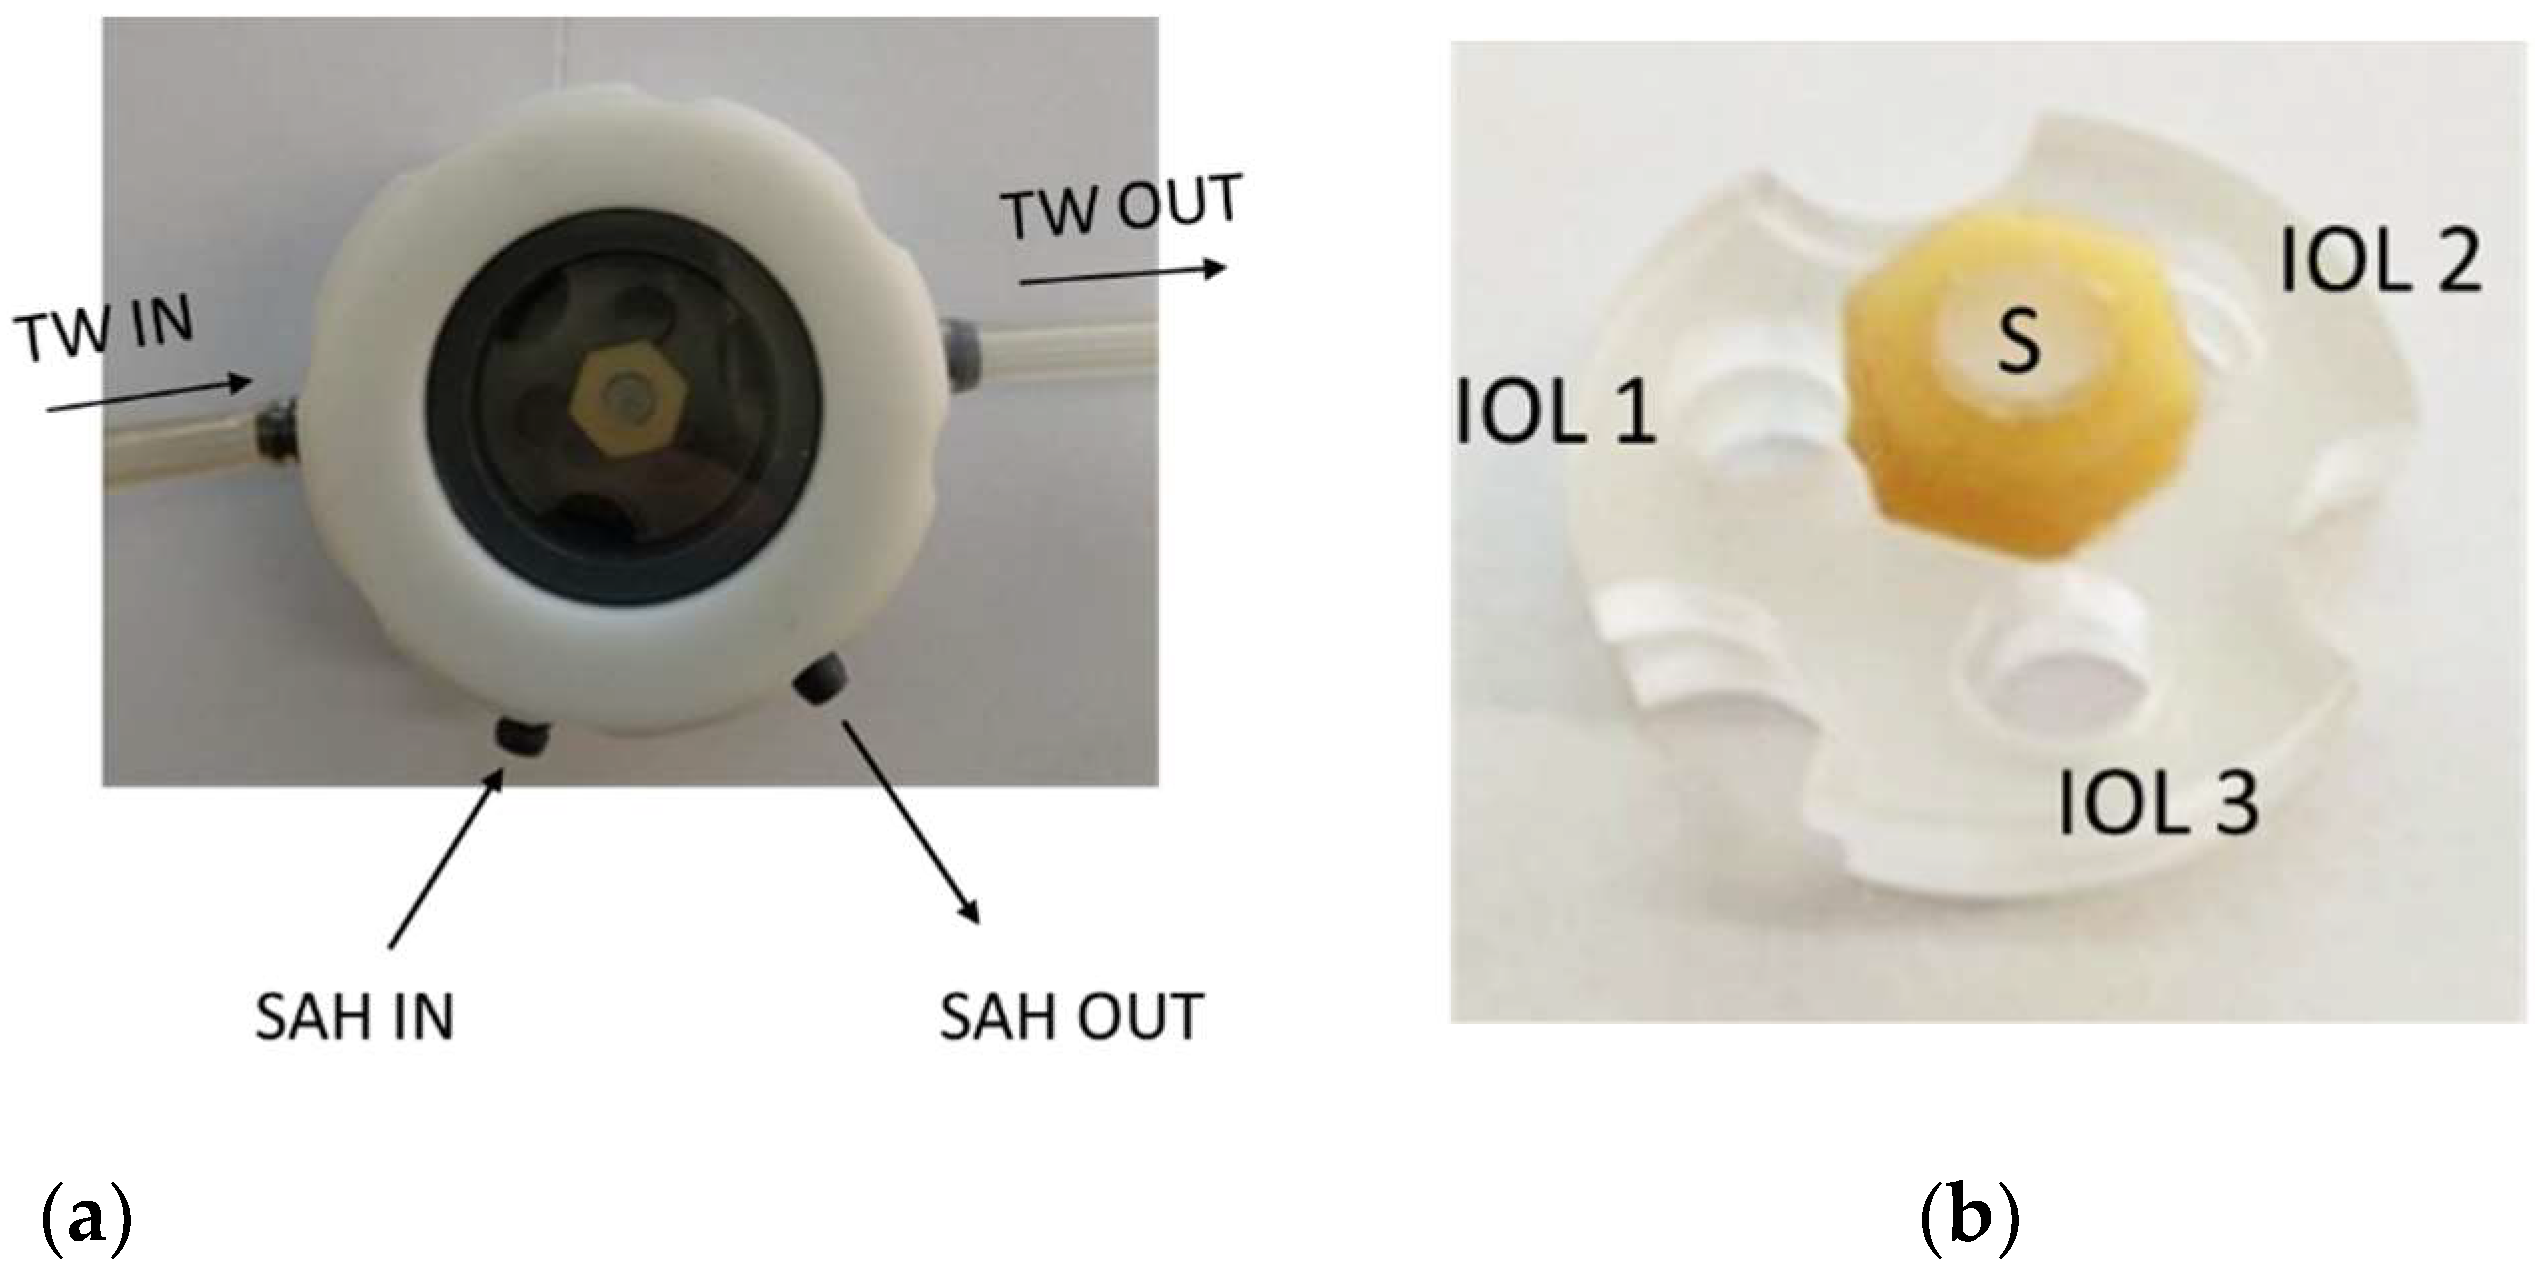
2.1.2. Eye Chamber Simulating Reactor (ECSR)
2.2. Solids Characterization
3. Results
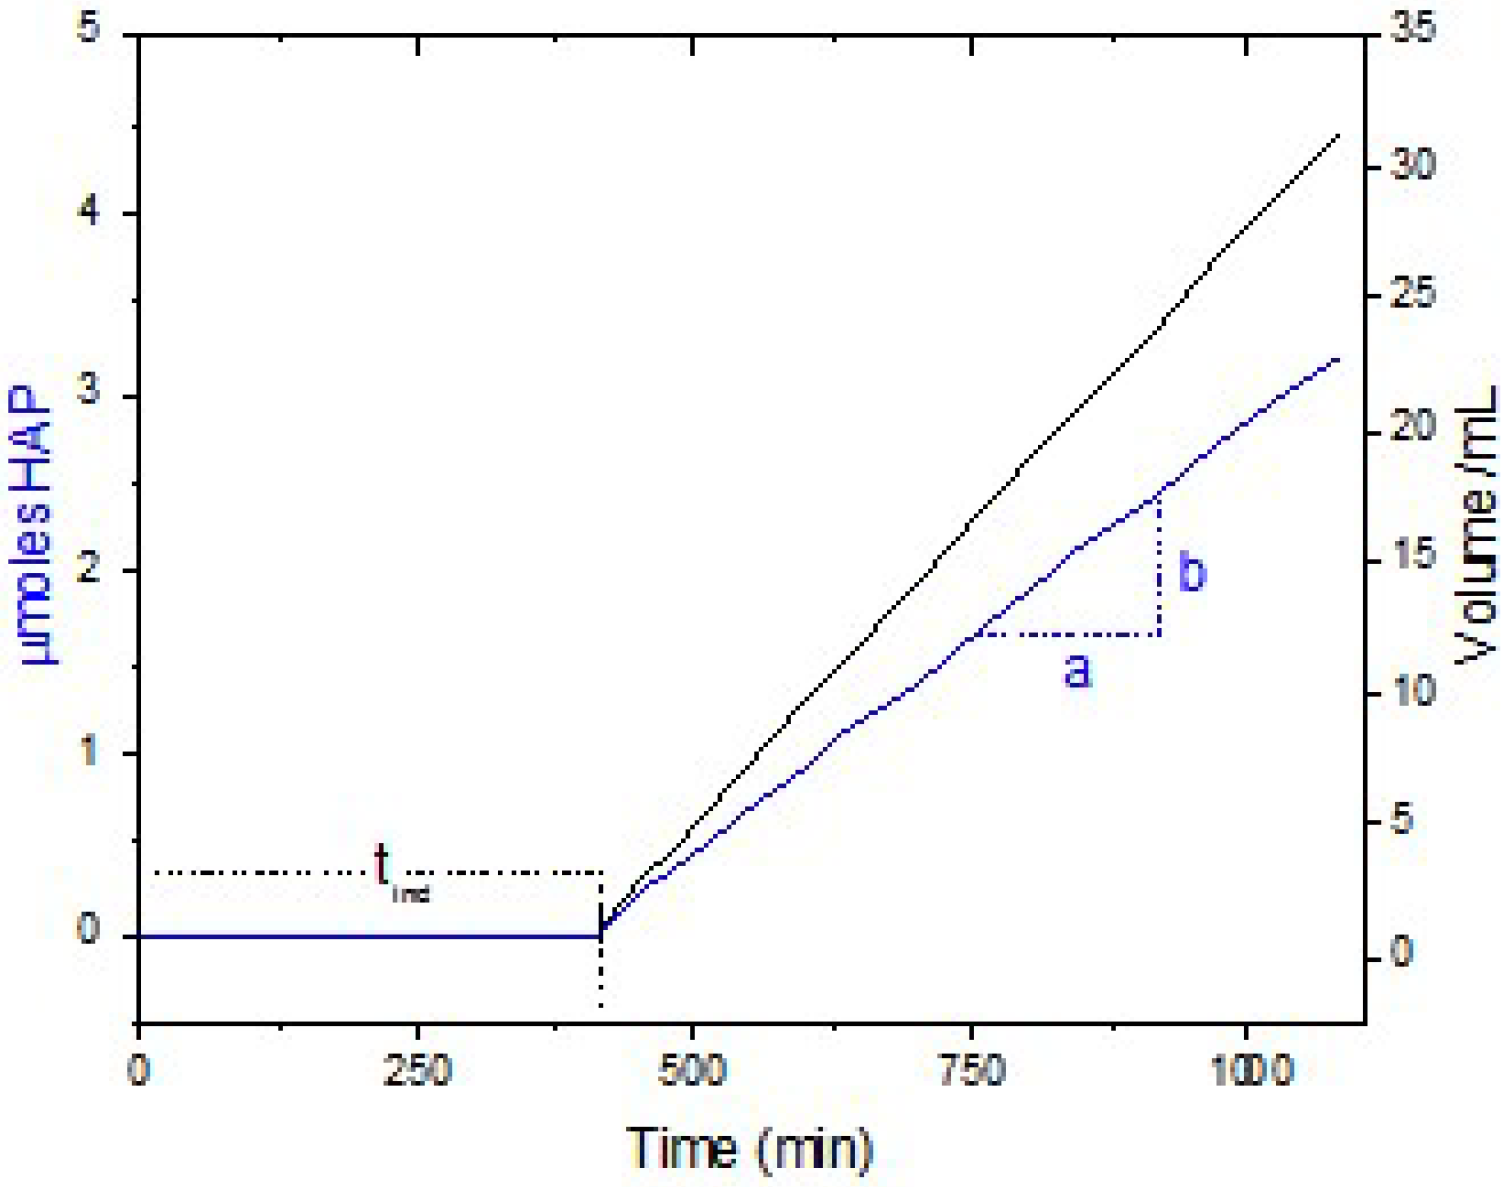
3.1. IOL Calcification in the CCR-Measurement of Kinetics
3.2. IOL Calcification in the ECSR
4. Discussion
5. Conclusions
Supplementary Materials
Author Contributions
Funding
Data Availability Statement
Acknowledgments
Conflicts of Interest
References
- Lerman, S. The ocular lens. In Radiant Energy in the Eye; Lerman, S., Ed.; Macmillan: New York, NY, USA, 1980; pp. 73–93. [Google Scholar]
- Apple, D.J.; Sims, J. Harold Ridley and the invention of the intraocular lens. Surv. Ophthalmol. 1996, 40, 279–292. [Google Scholar] [CrossRef]
- Suh, Y.; Oh, C.; Kim, H.M. Comparison of the long-term clinical results of hydrophilic and hydrophobic acrylic intraocular lenses. Korean J. Ophthalmol. 2005, 19, 29–33. [Google Scholar] [CrossRef] [Green Version]
- Jensen, M.K.; Crandall, A.S.; Mamalis, N.; Olson, R.J. Crystallization on intraocular lens surfaces associated with the use of Healon GV. Arch. Ophthalmol. 1994, 112, 1037–1042. [Google Scholar] [CrossRef] [PubMed]
- Ursell, P.G.; Spalton, D.J.; Pande, M.V.; Hollick, E.J.; Barman, S.; Boyce, J.; Tilling, K. Relationship between intraocular lens biomaterials and posterior capsule opacification. J. Cataract Refract. Surg. 1998, 24, 352–360. [Google Scholar] [CrossRef]
- Bompastor-Ramos, P.; Póvoa, J.; Lobo, C.; Rodriguez, A.E.; Alió, J.L.; Werner, L.; Murta, J.N. Late postoperative opacification of ahydrophilic-hydrophobic acrylic intraocular lens. J. Cataract Refract Surg. 2016, 42, 1324–1331. [Google Scholar] [CrossRef] [PubMed]
- Guan, X.; Tang, R.; Nancollas, G.H. The potential calcification of octacalcium phosphate on intraocular lens surfaces. J. Biomed. Mater. Res. A 2004, 71, 488–496. [Google Scholar] [CrossRef] [PubMed]
- Rezaei-Kanavi, M.; Javadi, M.A.; Mirbabaei-Ghafghazi, F. Intraocular lens calcification; A clinicopathologic report. J. Ophthalmic Vis. Res. 2009, 4, 122–124. [Google Scholar]
- Izak, A.; Werner, L.; Pandey, S.; Apple, D.J. Calcification of modern foldable hydrogel intraocular lens designs. Eye 2003, 17, 393–406. [Google Scholar] [CrossRef]
- Koutsoukos, P.G.; Amjad, Z.; Tomson, M.B.; Nancollas, G.H. Crystallization of calcium phosphates. A constant composition study. J. Amer. Che. Soc. 1980, 102, 1553–1557. [Google Scholar] [CrossRef]
- Dalas, E.; Kallitsis, J.; Koutsoukos, P.G. The growth of sparingly soluble salts on polymeric substrates. Colloids Surf. 1991, 53, 197–208. [Google Scholar] [CrossRef]
- Gurabardhi, M.; Häberle, H.; Aurich, H.; Werner, L.; Pham, D.T. Serial intraocular lens opacifications of different designs from the same manufacturer: Clinical and light microscopic results of 71 explant cases. J. Cataract Refract. Surg. 2018, 44, 1326–1332. [Google Scholar] [CrossRef]
- Nagul, E.A. The molybdenum blue reaction for the determination of orthophosphate revisited: Opening the black box. Anal. Chim. Acta 2015, 890, 60–82. [Google Scholar] [CrossRef] [PubMed] [Green Version]
- Bates, R.G. Revised Standard Values for pH Measurements from 0 to 95 °C. J. Res. N Bur. Stan. A-Phys. Chem. 1962, 66A, 179–184. [Google Scholar] [CrossRef]
- Drimtzias, E.G.; Rokidi, S.G.; Gartaganis, S.P.; Koutsoukos, P.G. Experimental investigation on mechanism of hydrophilic acrylic intraocular lens calcification. Am. J. Ophthalmol. 2011, 152, 824–833.e1. [Google Scholar] [CrossRef]
- Kinsey, V.E. Comparative chemistry of aqueous humor in posterior and anterior chambers of rabbit eye. Its physiologic significance. A.M.A. Arch. Opthalm. 1953, 50, 401–417. [Google Scholar]
- Christoffersen, J.; Christoffersen, M.R.; Kibalczyc, W.; Andersen, F.A. A contribution to the understanding of the formation of calcium phosphates. J.Cryst. Growth 1989, 94, 767–777. [Google Scholar] [CrossRef]
- Ding, H.; Pan, H.; Xu, X.; Tang, R. Towards a Detailed Understanding of Magnesium ions on Hydrox-yapatite Crystallization Inhibition. Cryst. Growth Des. 2014, 14, 763–769. [Google Scholar] [CrossRef]
- Skartsila, K.; Spanos, N. Physicochemical characterization of variously packed porous plugs of hydroxyapatite: Streaming potential coupled with conductivity measurements. Langmuir 2006, 22, 1903–1910. [Google Scholar] [CrossRef]
- Spanos, N.; Misirlis, D.Y.; Kanellopoulou, D.G.; Koutsoukos, P.G. Seeded growth of hydroxyapatite in simulated body fluid. J Mater Sci. 2003, 41, 1805–1812. [Google Scholar] [CrossRef]
- Tao, J.H.; Fijneman, A.; Wan, J.Q.; Prajapati, S.; Mukherjee, K.; Fernandez-Martinez, A.; Moradian-Oldak, J.; De Yoreo, J.J. Control of calcium phosphate nucleation and transformation through interactions of enamelin and amelogenin exhibits the “goldilocks effect”. Cryst. Growth Des. 2018, 18, 7391–7400. [Google Scholar] [CrossRef]
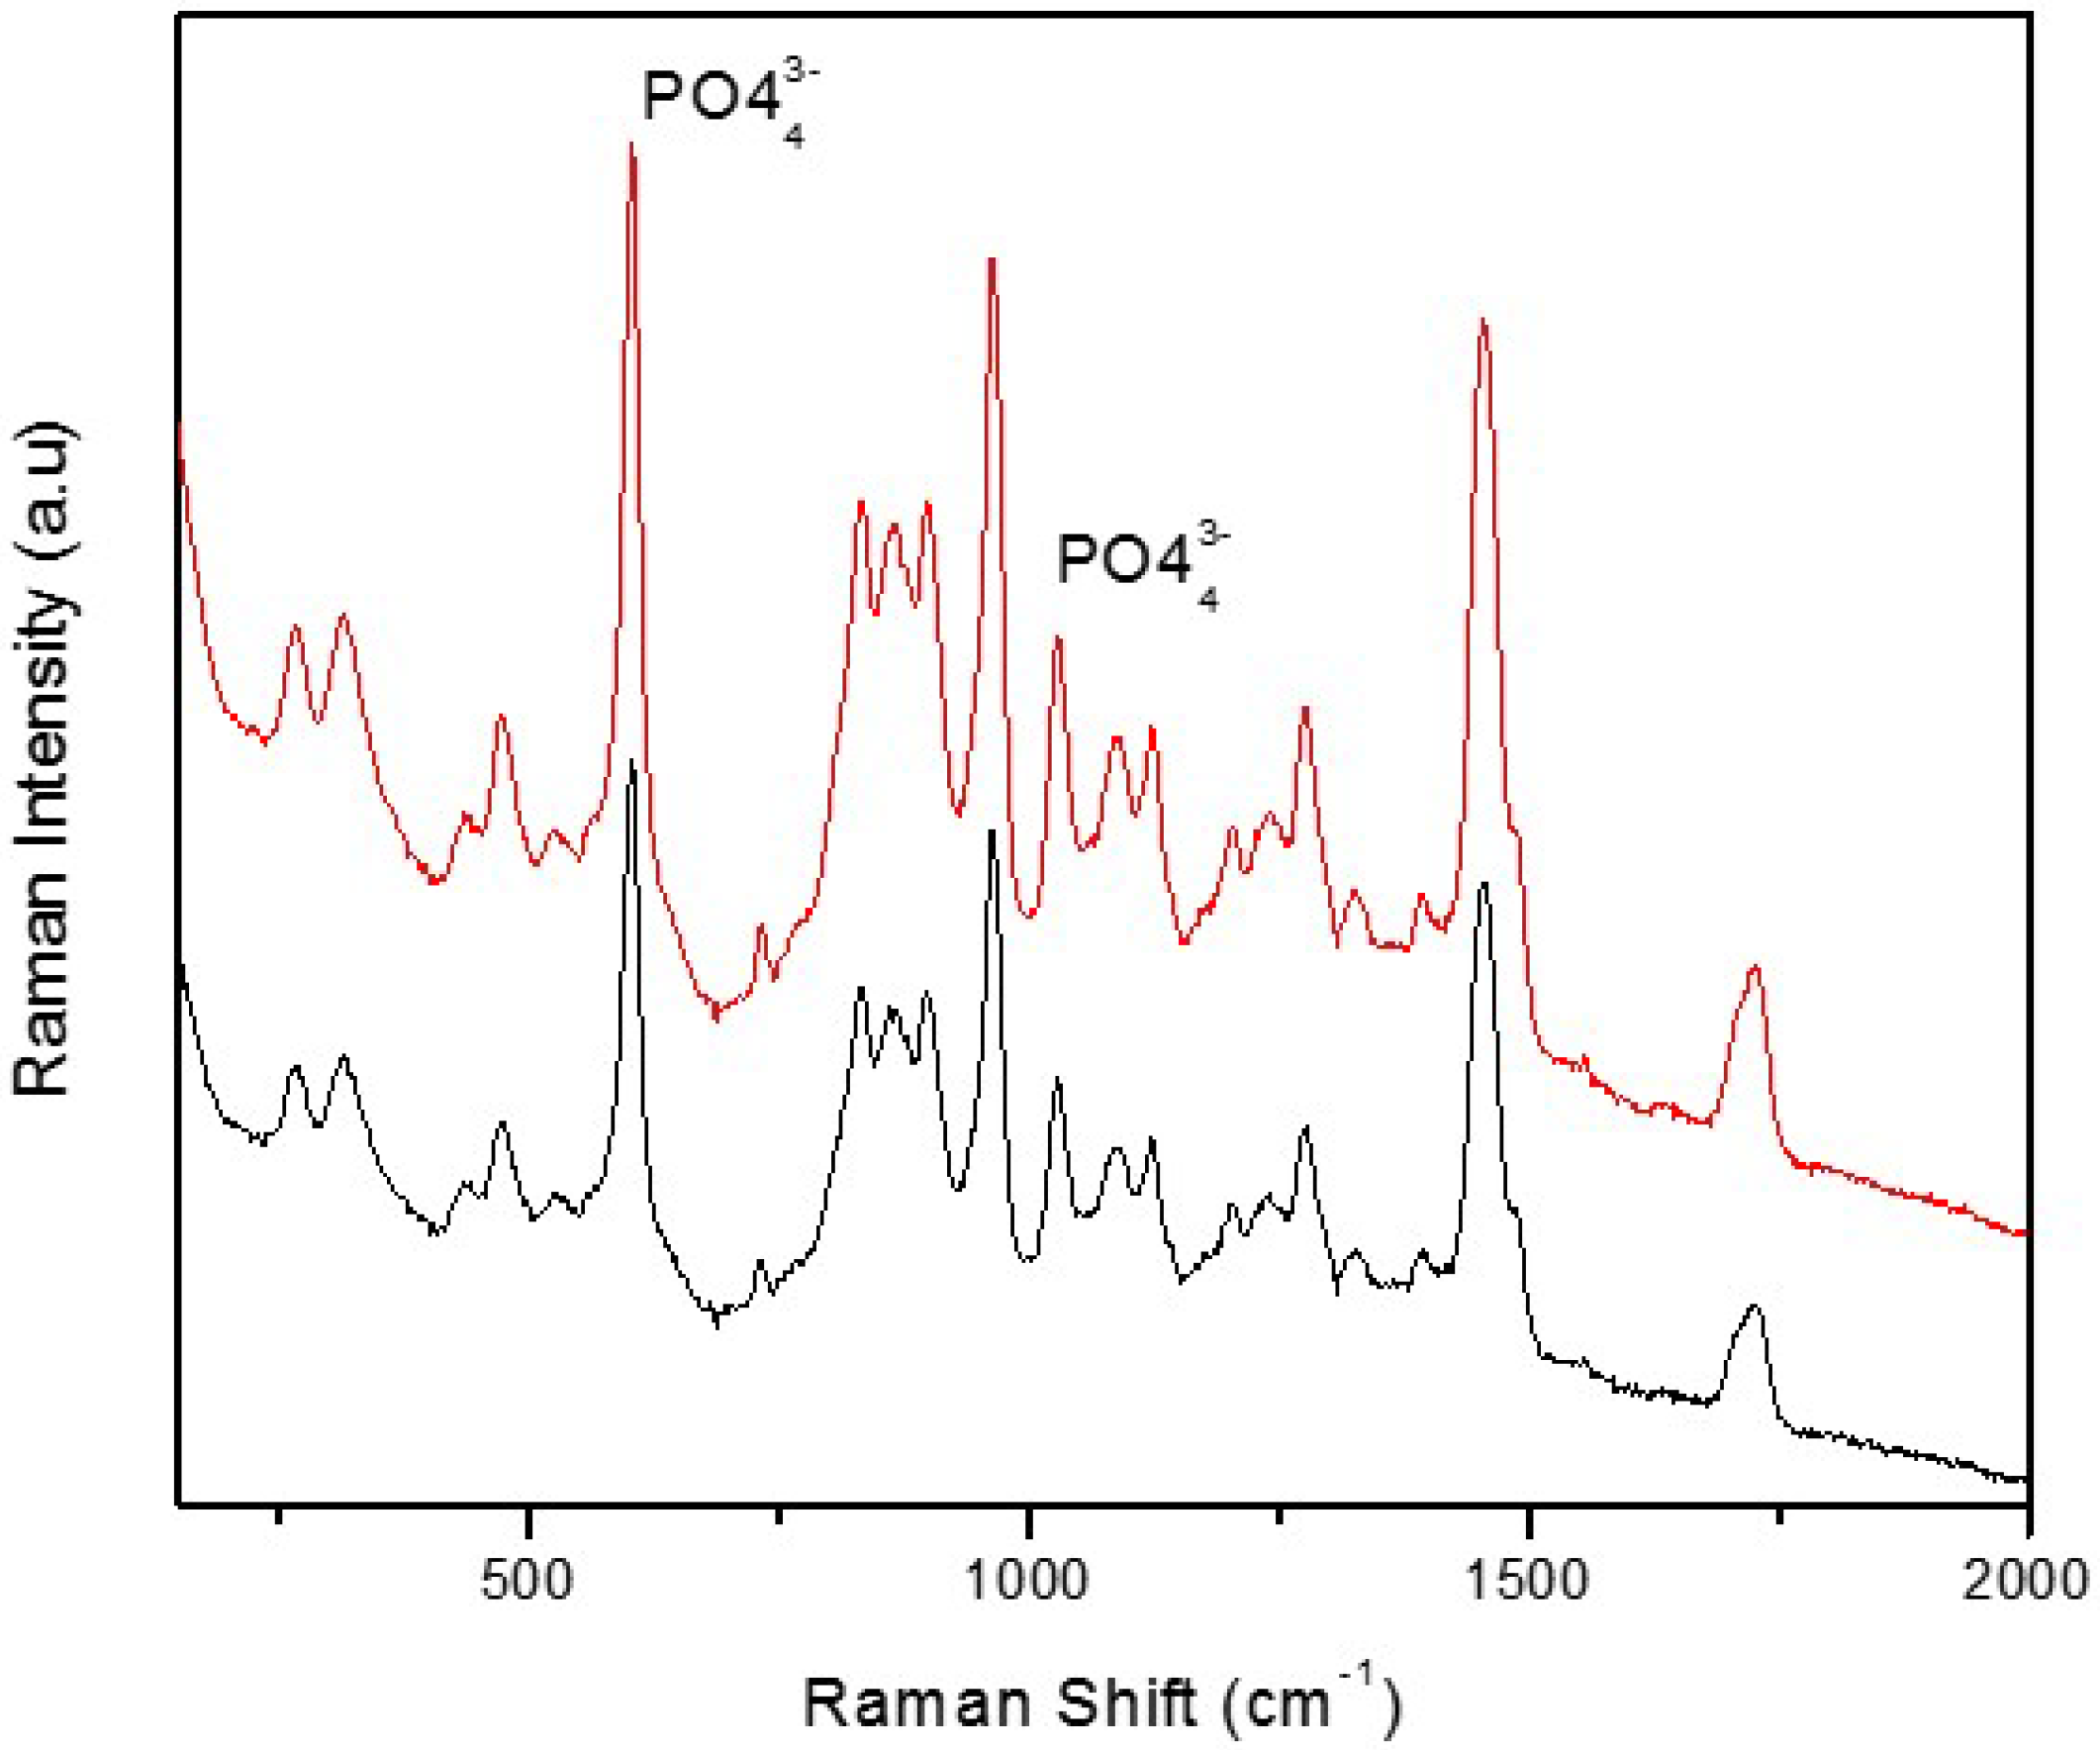
- Fowler, B.O.; Markovic, M.; Brown, W.E. Octacalcium phosphate. 3. Infrared and Raman vibrational spectra. Chem. Mater. 1993, 5, 1417–1423. [Google Scholar] [CrossRef]
- De Yoreo, J.J.; Vekilov, P. Principles of crystal nucleation and growth. Rev. Mineral. Geochem. 2003, 54, 57–93. [Google Scholar] [CrossRef]
- Nielsen, A.E. Nucleation in aqueous solutions. In Crystal Growth; Peiser, S., Ed.; Pergamon: Oxford, UK, 1967; pp. 419–426. [Google Scholar]
- Ibarra-Montaño, E.L.; Rodríguez-Laguna, N.; Sánchez-Hernández, A.; Rojas-Hernández, A. Determination of pKa Values for Acrylic, Methacrylic and Itaconic Acids by 1H and 13C NMR in Deuterated Water. J. Appl. Sol. Chem. Model. 2015, 4, 7–18. [Google Scholar] [CrossRef] [Green Version]
- Gartaganis, S.P.; Kanellopoulou, D.G.; Mela, E.K.; Panteli, V.S.; Koutsoukos, P.G. Opacification of hydrophilic acrylic intraocular lens attributable to calcification: Investigation on mechanism. Am. J. Ophthalmol. 2008, 146, 395–403. [Google Scholar] [CrossRef]
- Gartaganis, S.P.; Prahs, P.; Lazari, E.D.; Gartaganis, P.S.; Helbig, H.; Koutsoukos, P.G. Calcification of Hydrophilic Acrylic Intraocular Lenses With a Hydrophobic Surface: Laboratory Analysis of 6 Cases. Am. J. Ophthalmol. 2016, 168, 68–77. [Google Scholar] [CrossRef] [PubMed]
- Schrittenlocher, S.; Schaub, F.; Hos, D.; Siebelmann, S.; Cursiefen, C.; Bachmann, B. Evolution of Consecutive Descemet Membrane Endothelial Keratoplasty Outcomes Throughout a 5-Year Period Performed by Two Experienced Surgeons. Am. J. Ophthalmol. 2018, 190, 171–178. [Google Scholar] [CrossRef] [PubMed]
- Belin, P.J.; Kim, J.H.; Sheikh, A.; Winokur, J.; Rhee, D.; Deramo, V. Incidence and Risk of Scleral-Fixated Akreos (AO60) Lens Opacification: A Case Series. J. Vitr. Retinal. Dis. 2021, 5, 157–162. [Google Scholar] [CrossRef]
- Fernández-Buenaga, R.; Alió, J.L. Intraocular Lens Explantation After Cataract Surgery: Indications, Results, and Explantation Techniques. Asia Pac. J. Ophthalmol. 2017, 6, 372–380. [Google Scholar] [CrossRef] [PubMed]


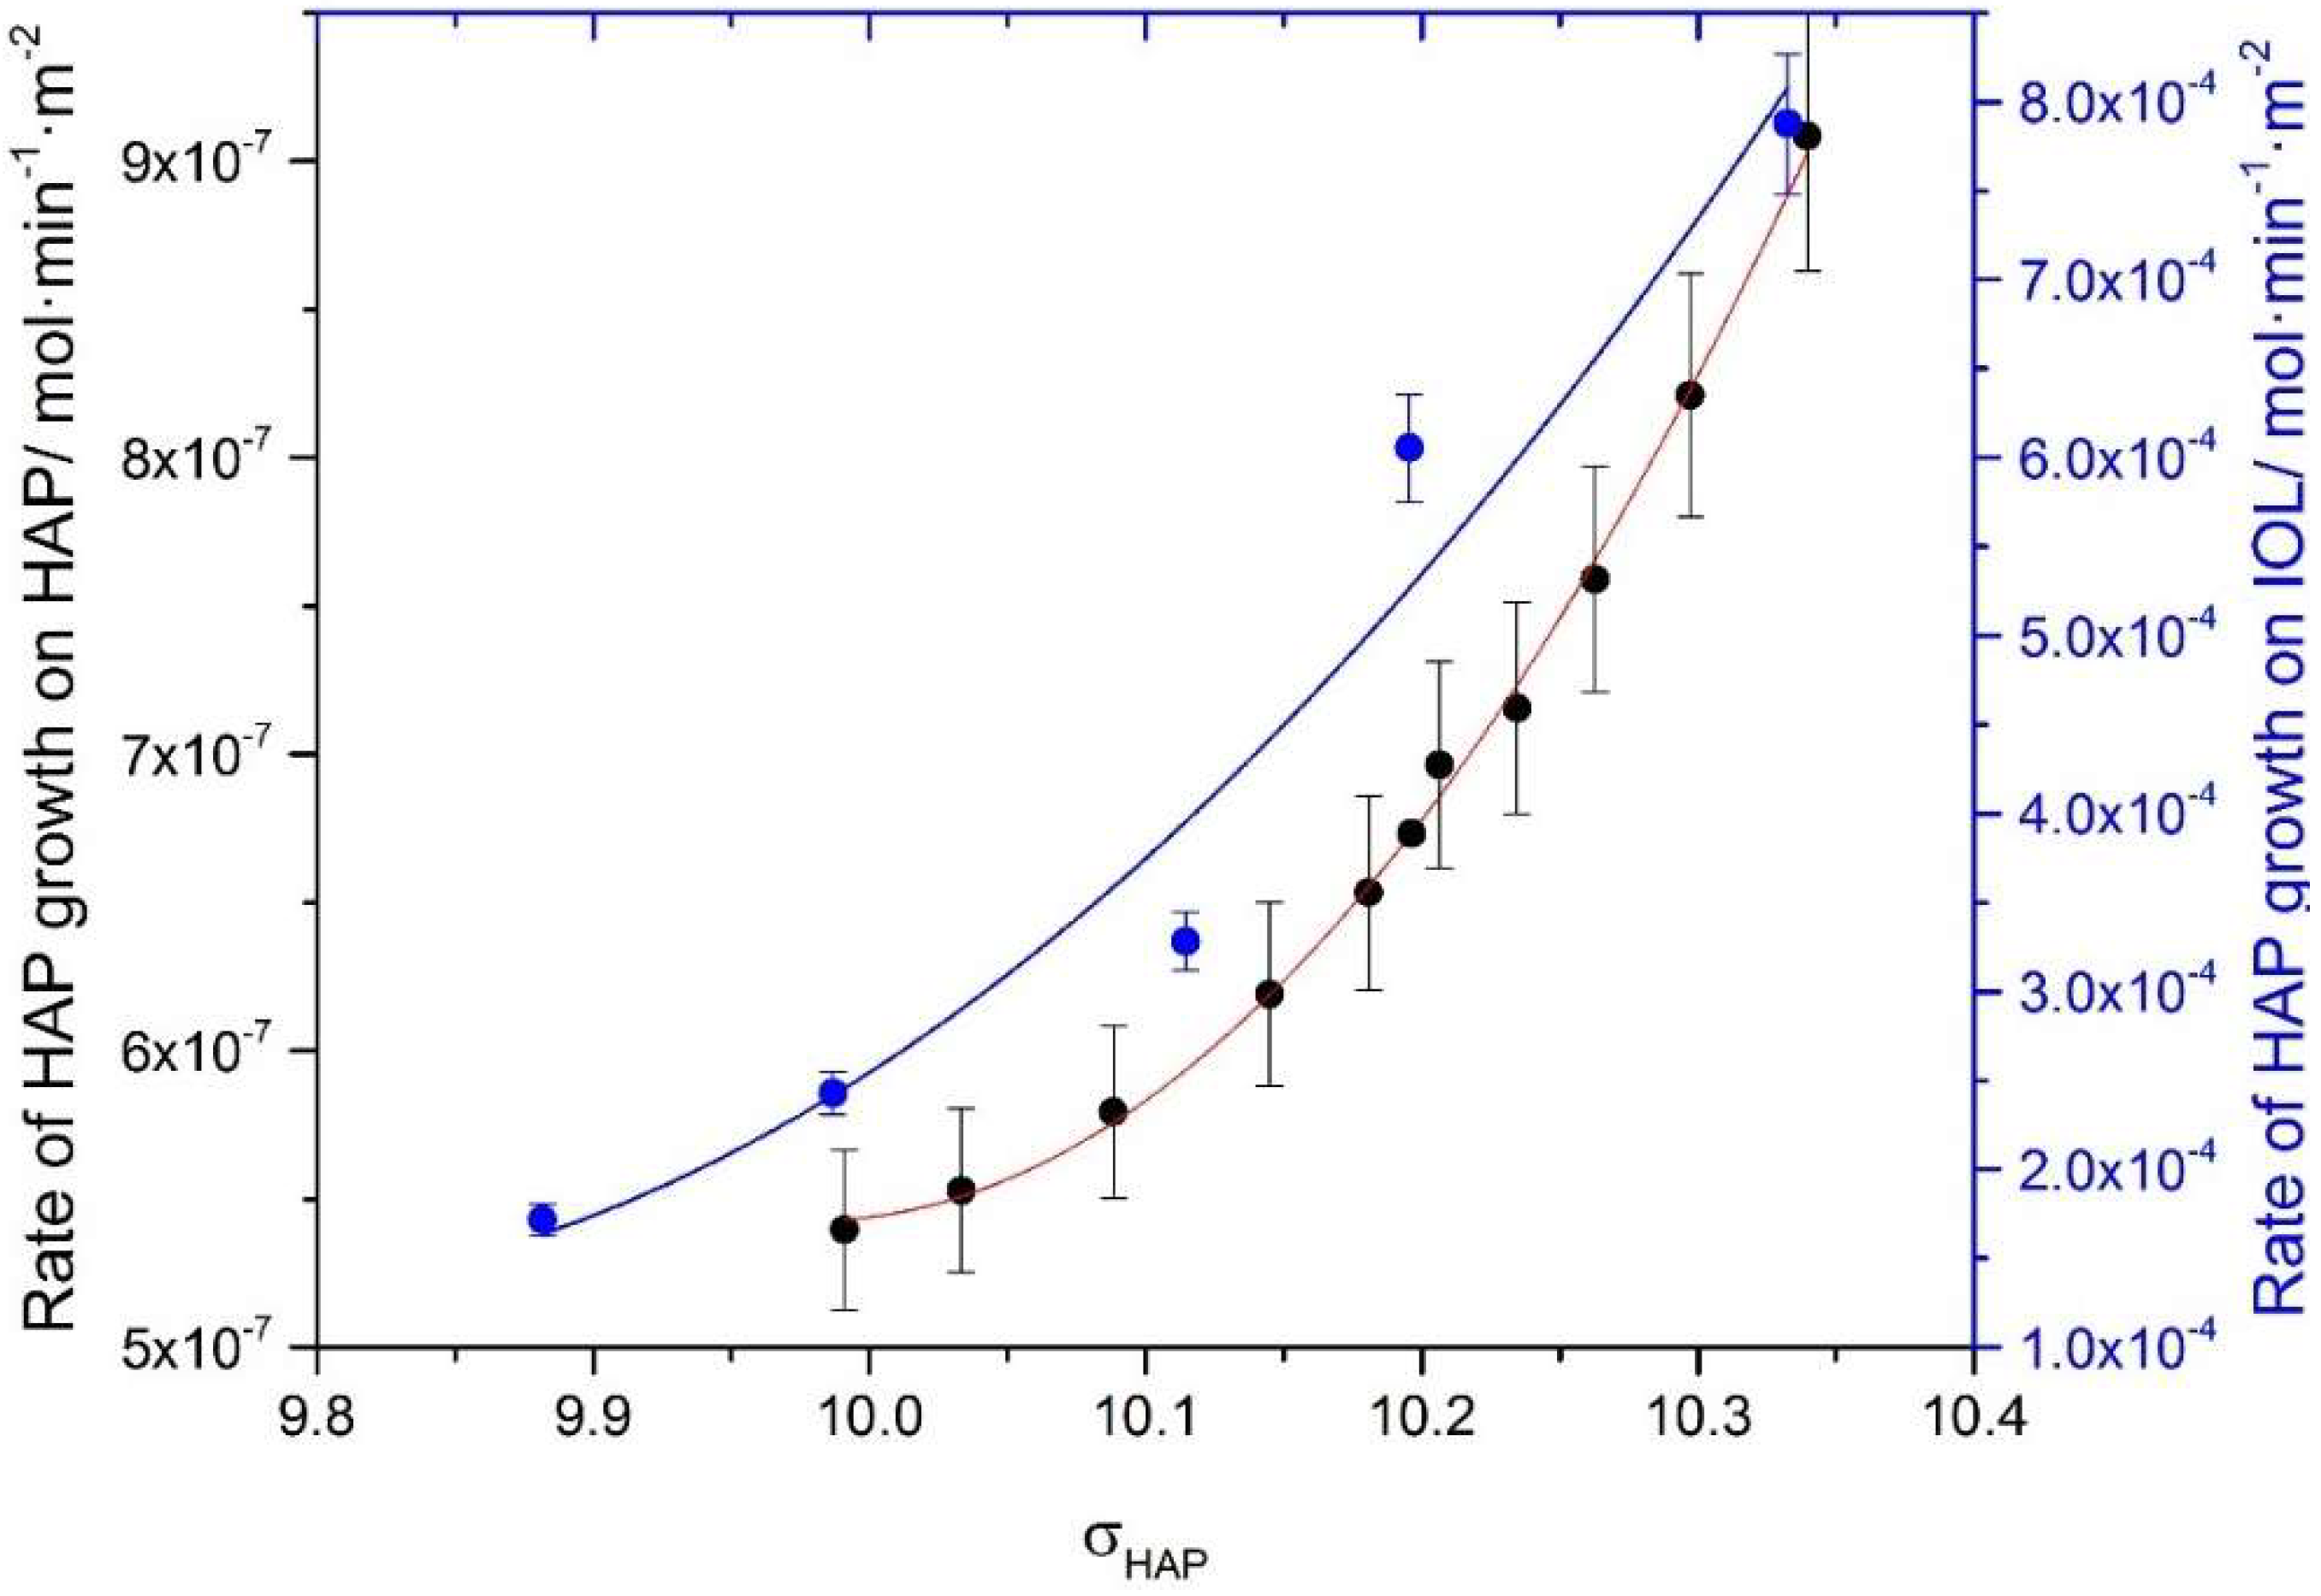
 ) HAP seeds. Rates expressed per unit surface area measured by BET nitrogen adsorption method (
 ) rates expressed per unit geometric surface area of the hydrophilic IOLs in contact with the supersaturated solutions.
) HAP seeds. Rates expressed per unit surface area measured by BET nitrogen adsorption method () rates expressed per unit geometric surface area of the hydrophilic IOLs in contact with the supersaturated solutions.
) rates expressed per unit geometric surface area of the hydrophilic IOLs in contact with the supersaturated solutions.
) HAP seeds. Rates expressed per unit surface area measured by BET nitrogen adsorption method () rates expressed per unit geometric surface area of the hydrophilic IOLs in contact with the supersaturated solutions.


| Component | Formula | Concentration/mM |
|---|---|---|
| Disodium hydrogen phosphate | Na2HPO4 | 0.6 |
| Magnesium Chloride | MgCl2 | 1.0 |
| Sodium bicarbonate | NaHCO3 | 33.6 |
| Calcium Chloride | CaCl2 | 1.7 |
| Potassium Chloride | KCl | 5.3 |
| Sodium Chloride | NaCl | 150.0 |
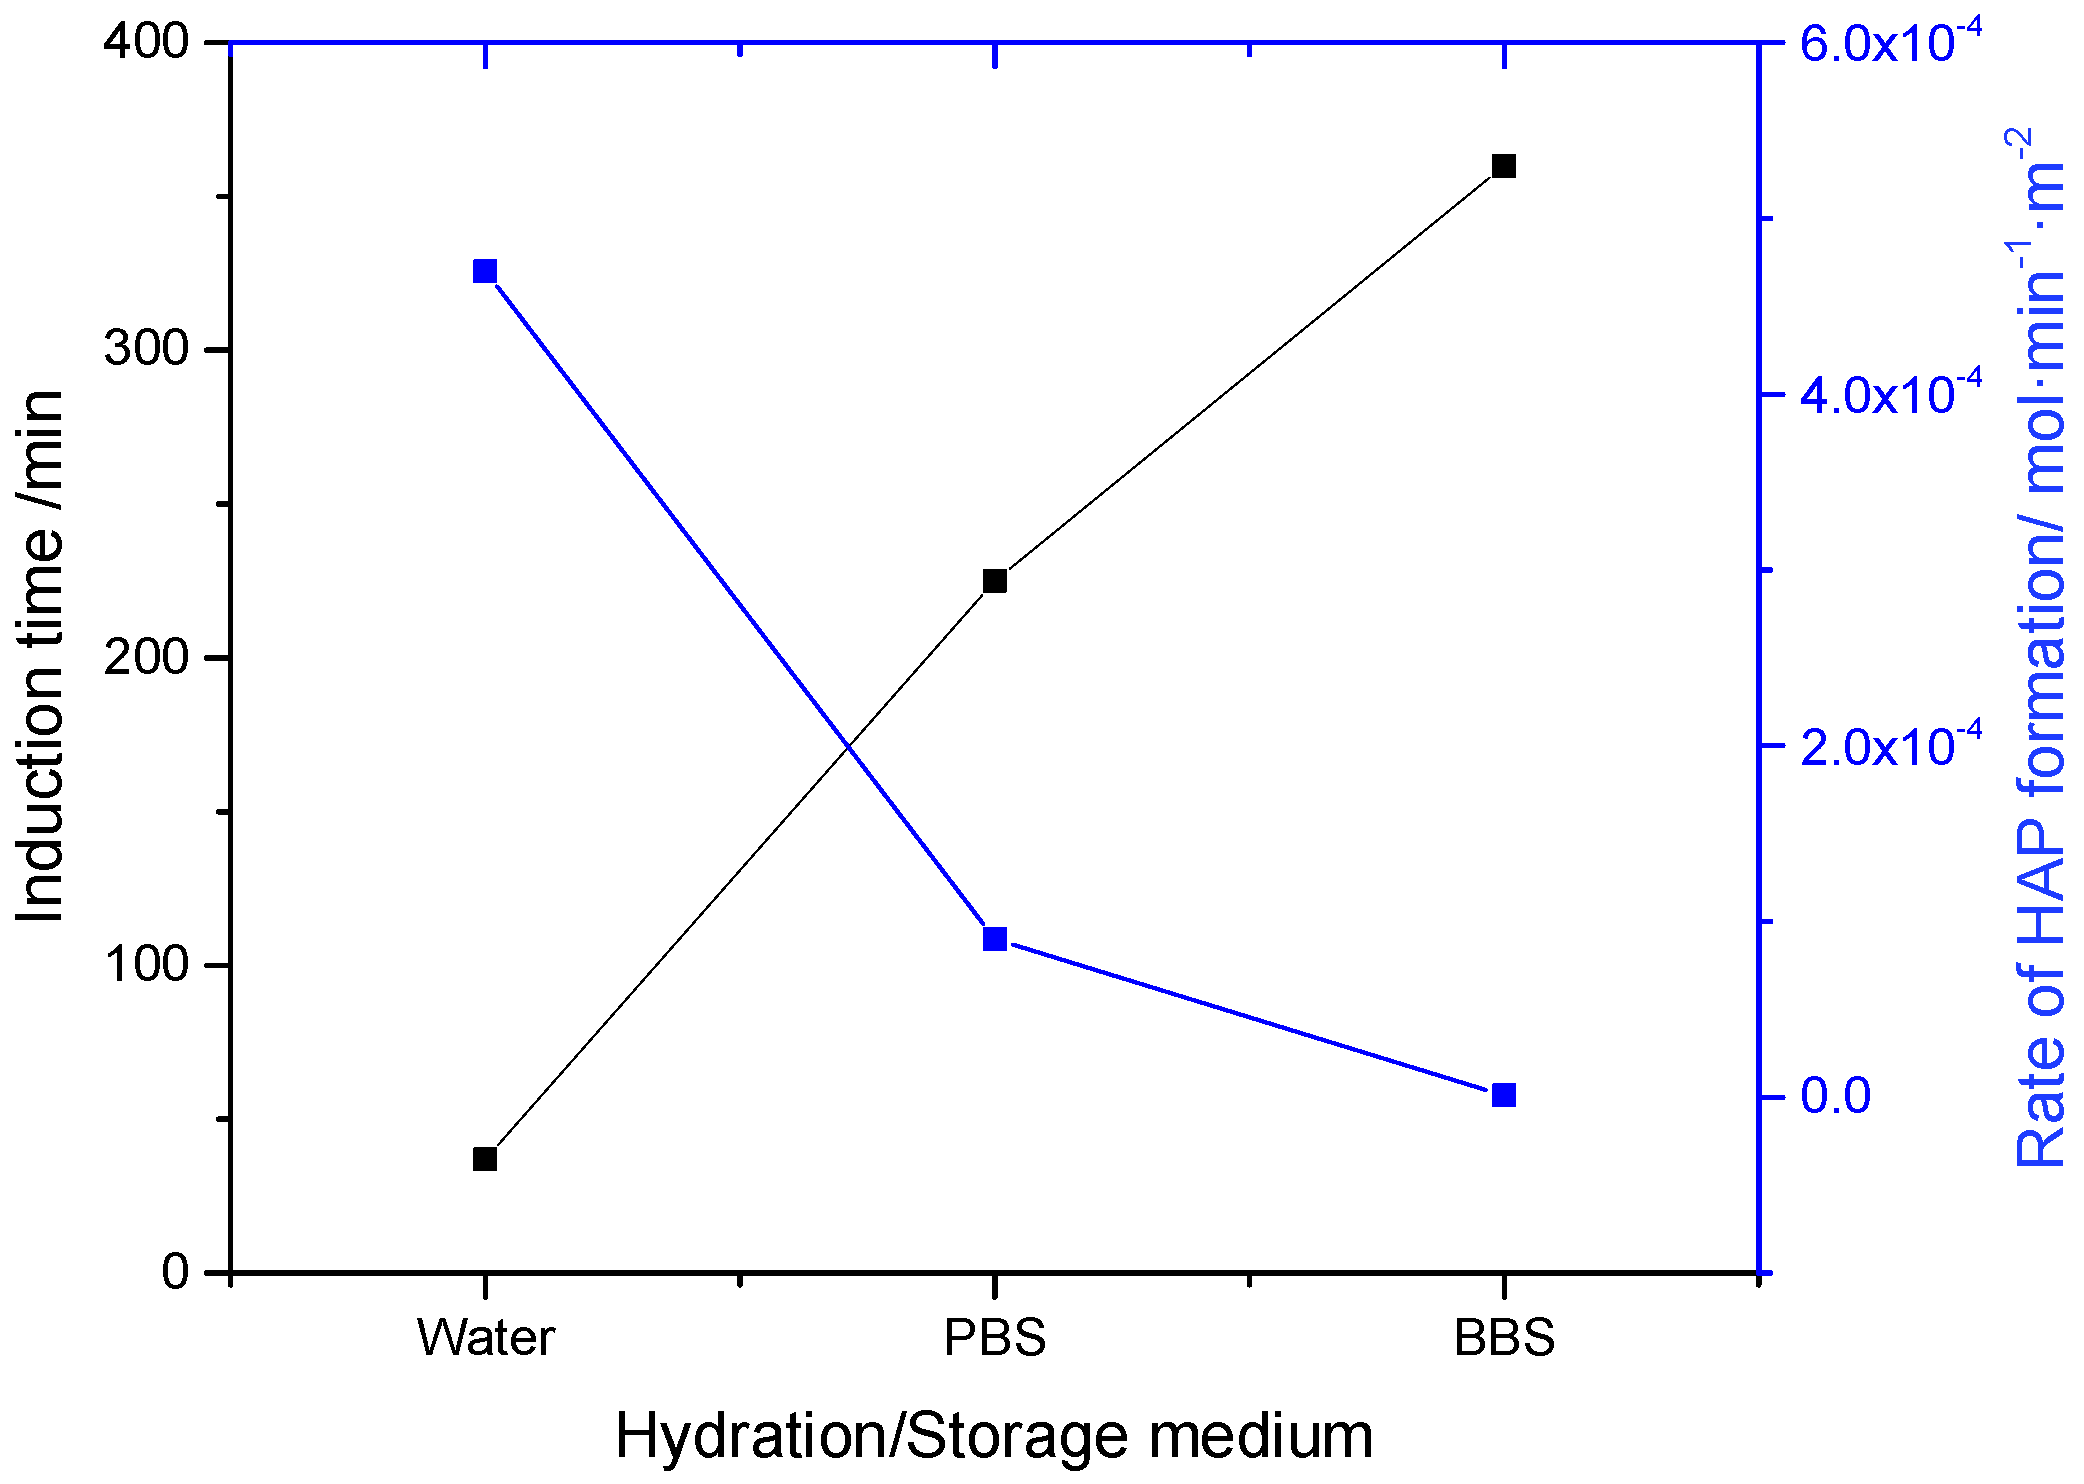
| Hydration/Storage Solution | Induction Time, tind (min) | Surface Energy, γs (mJ·m−2) | Precipitation Rate *, Rp /×10−4 molHAP·min−1·m−2 |
|---|---|---|---|
| Water | 37 | 39 | 4.70 |
| PBS | 225 | 42 | 0.90 |
| BBS | 360 | 50 | 0.01 |
Publisher’s Note: MDPI stays neutral with regard to jurisdictional claims in published maps and institutional affiliations. |
© 2022 by the authors. Licensee MDPI, Basel, Switzerland. This article is an open access article distributed under the terms and conditions of the Creative Commons Attribution (CC BY) license (https://creativecommons.org/licenses/by/4.0/).
Share and Cite
Koutsoukos, P.G.; Natsi, P.D.; Gartaganis, S.P.; Gartaganis, P.S. Biological Mineralization of Hydrophilic Intraocular Lenses. Crystals 2022, 12, 1418. https://doi.org/10.3390/cryst12101418
Koutsoukos PG, Natsi PD, Gartaganis SP, Gartaganis PS. Biological Mineralization of Hydrophilic Intraocular Lenses. Crystals. 2022; 12(10):1418. https://doi.org/10.3390/cryst12101418
Chicago/Turabian StyleKoutsoukos, Petros G., Panagiota D. Natsi, Sotirios P. Gartaganis, and Panos S. Gartaganis. 2022. "Biological Mineralization of Hydrophilic Intraocular Lenses" Crystals 12, no. 10: 1418. https://doi.org/10.3390/cryst12101418