

Graphene Based FET Biosensor for Organic-Phosphorous Sample Detection and the Enzymatic Analysis
Abstract
:1. Introduction
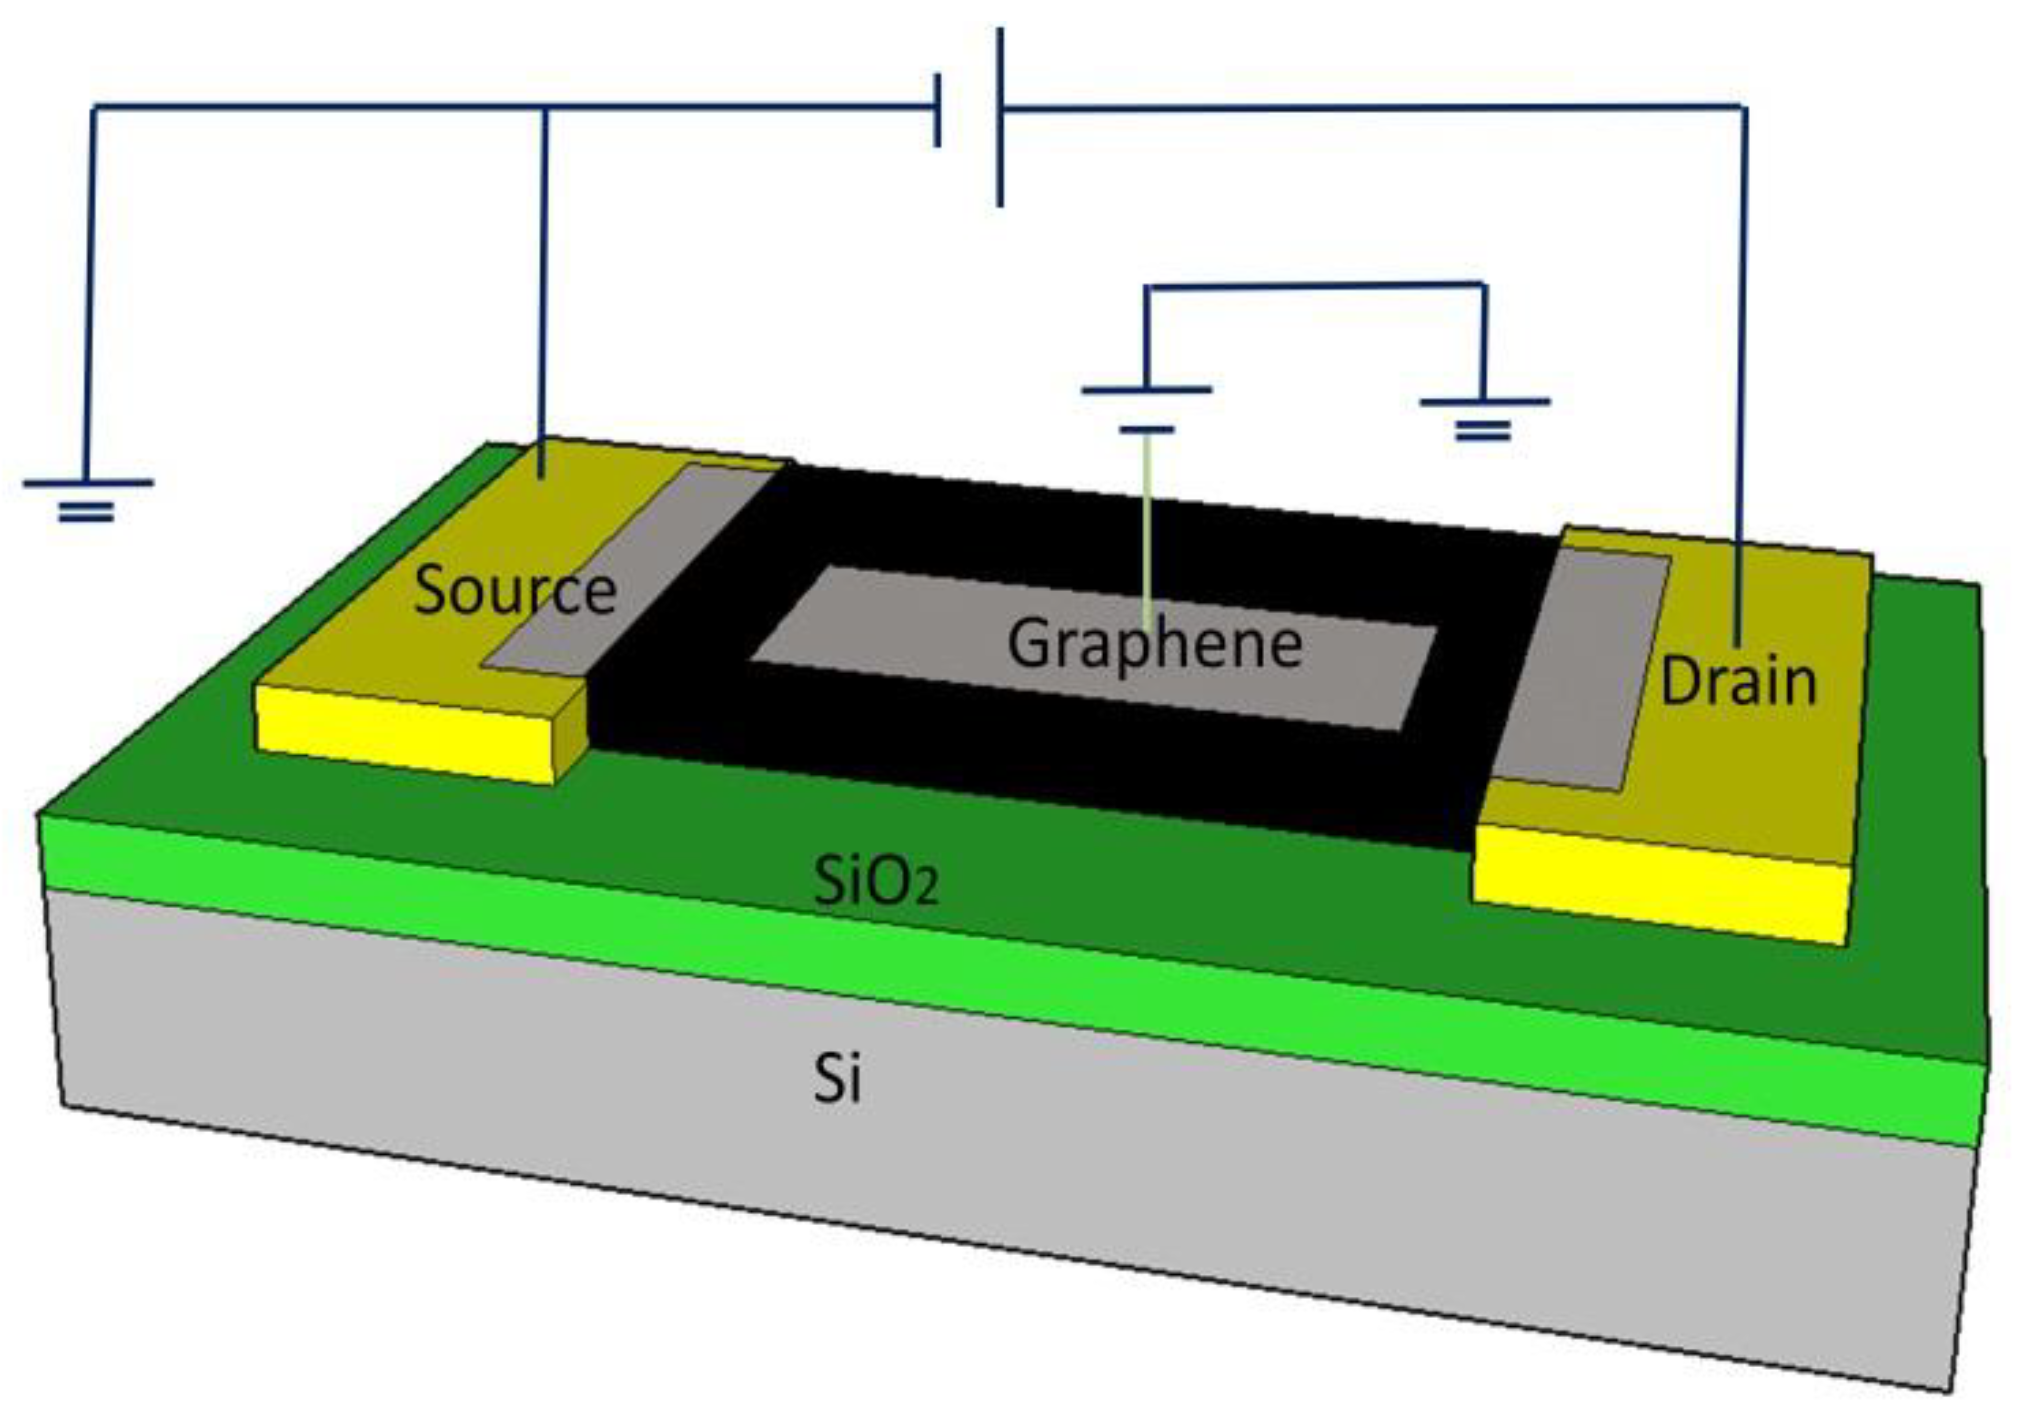
2. Sensor Design
3. Fabrication and Functionalization
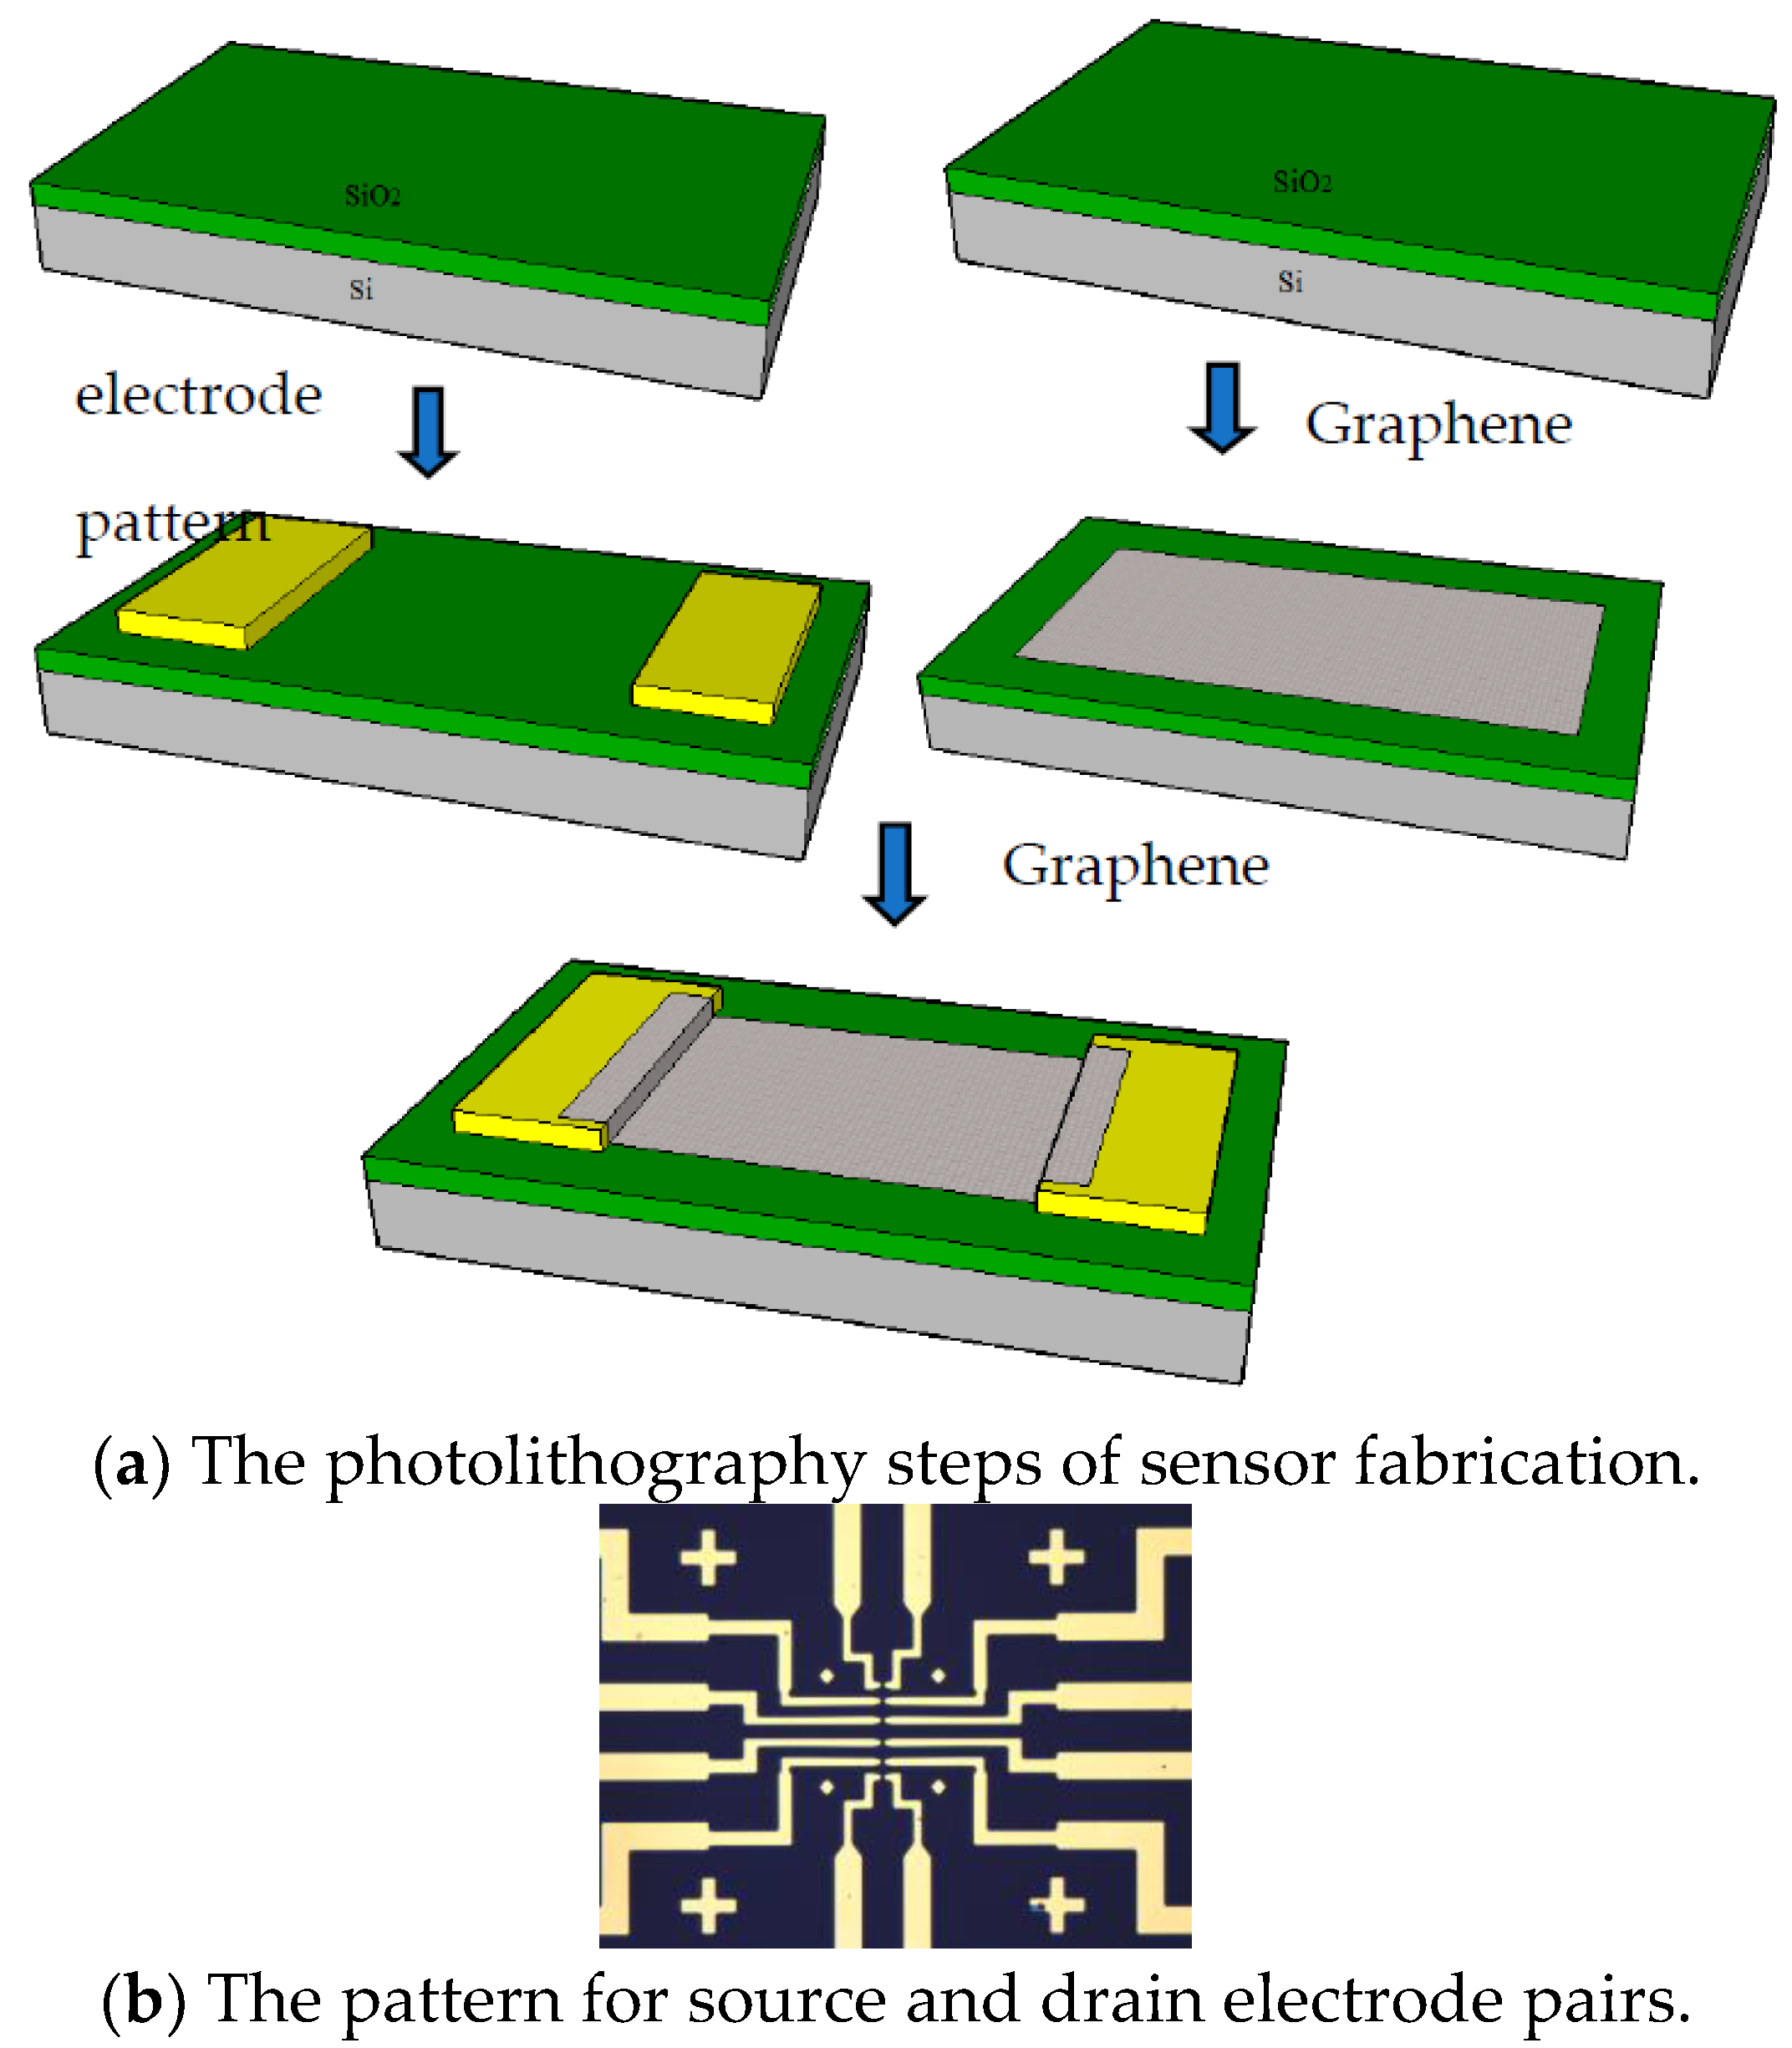
3.1. Fabrication of the Biosensor
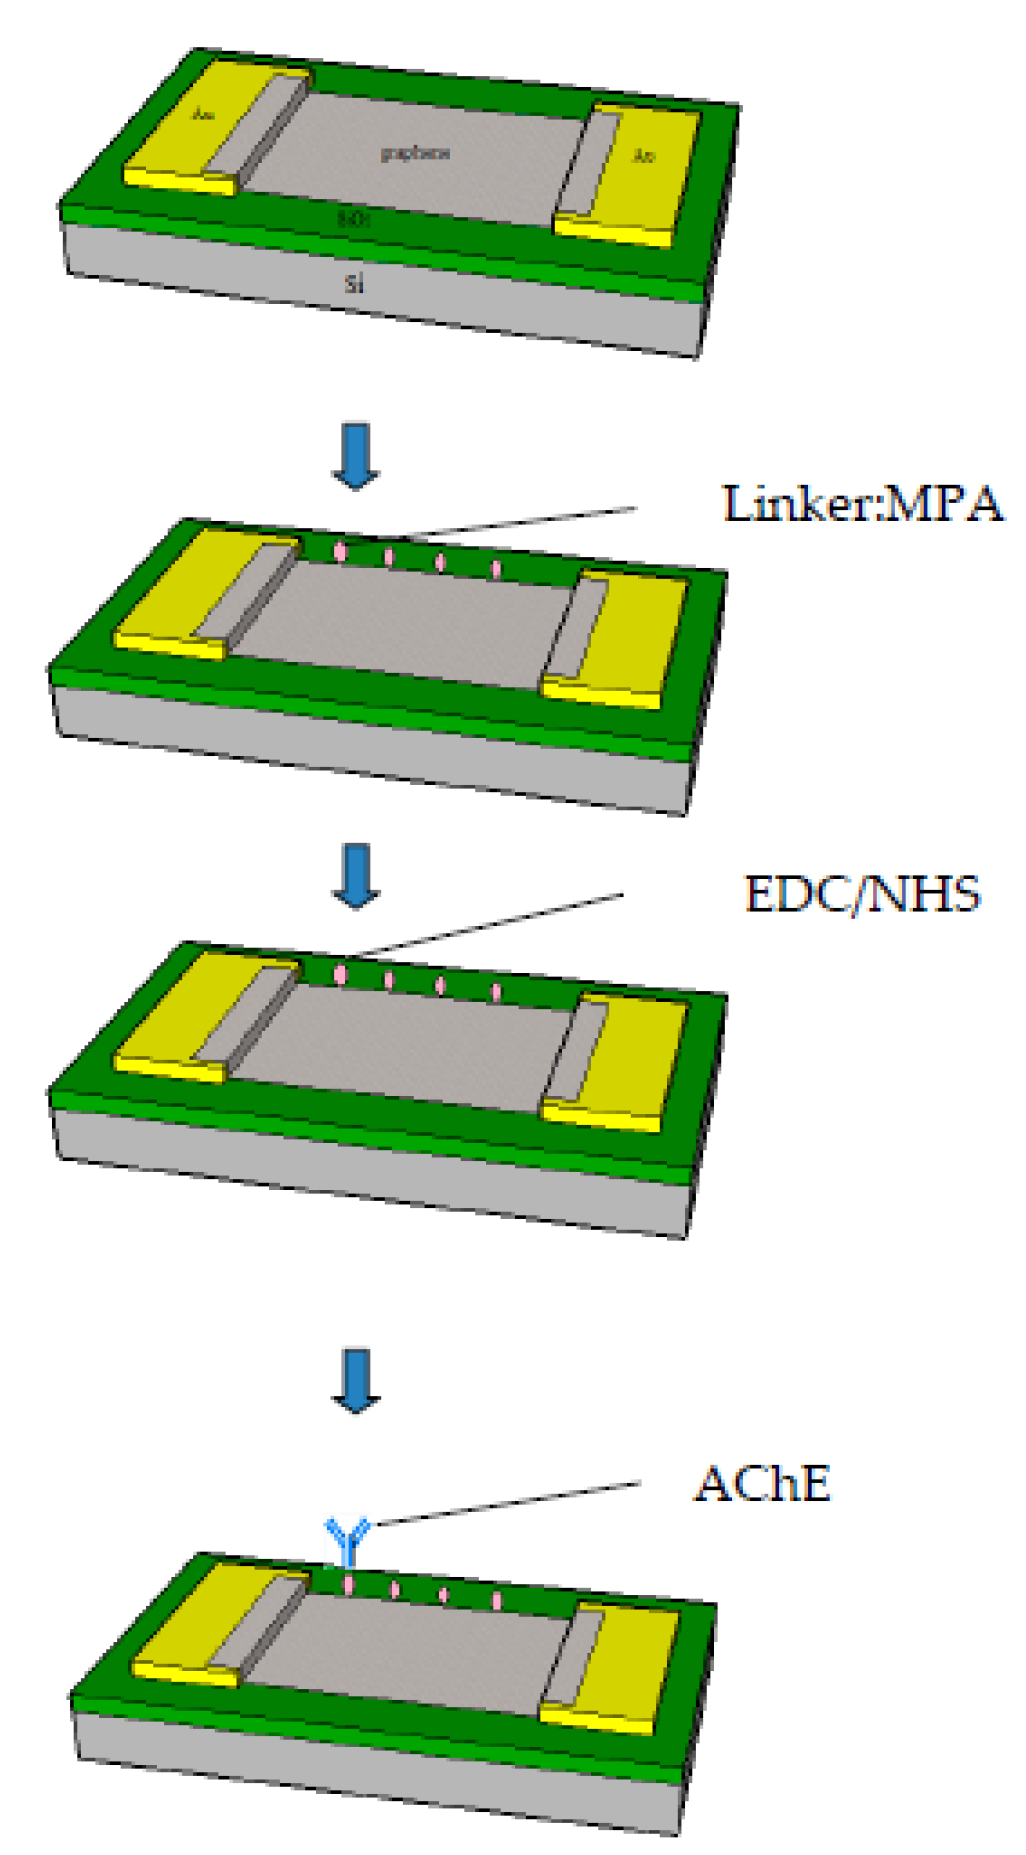
3.2. Functionalization of the Biosensor
4. Experiment and Data
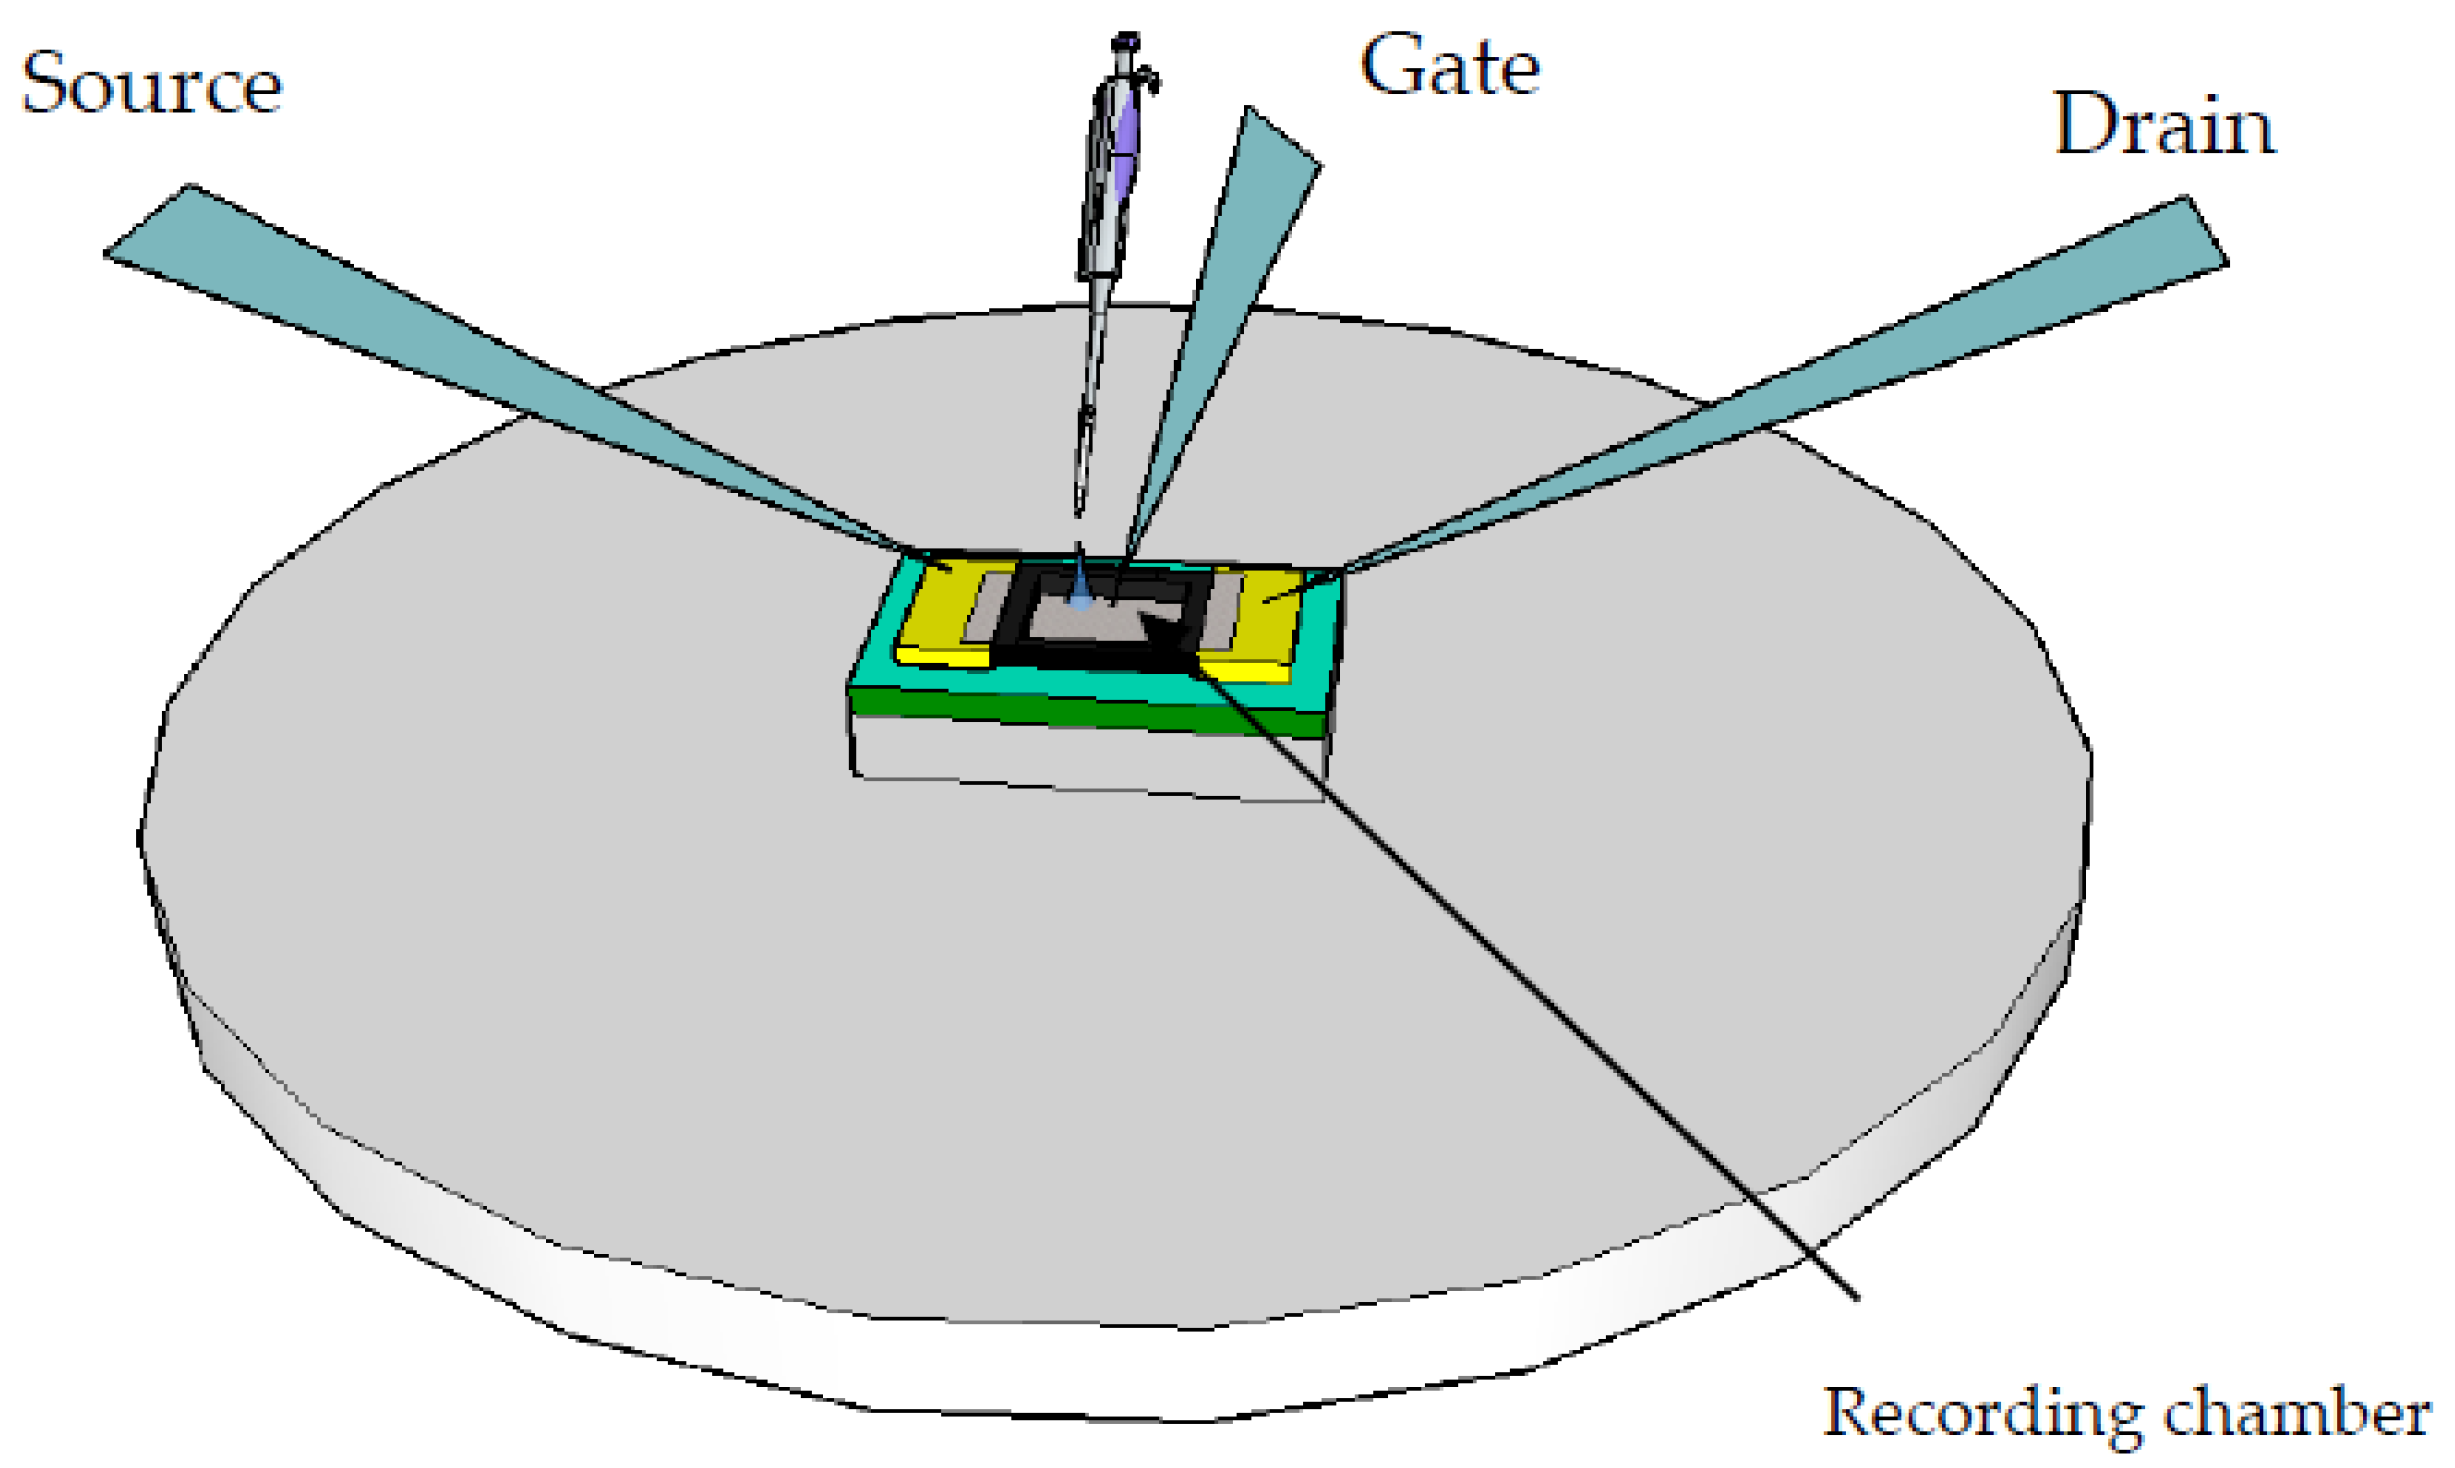
4.1. Experimental Setup
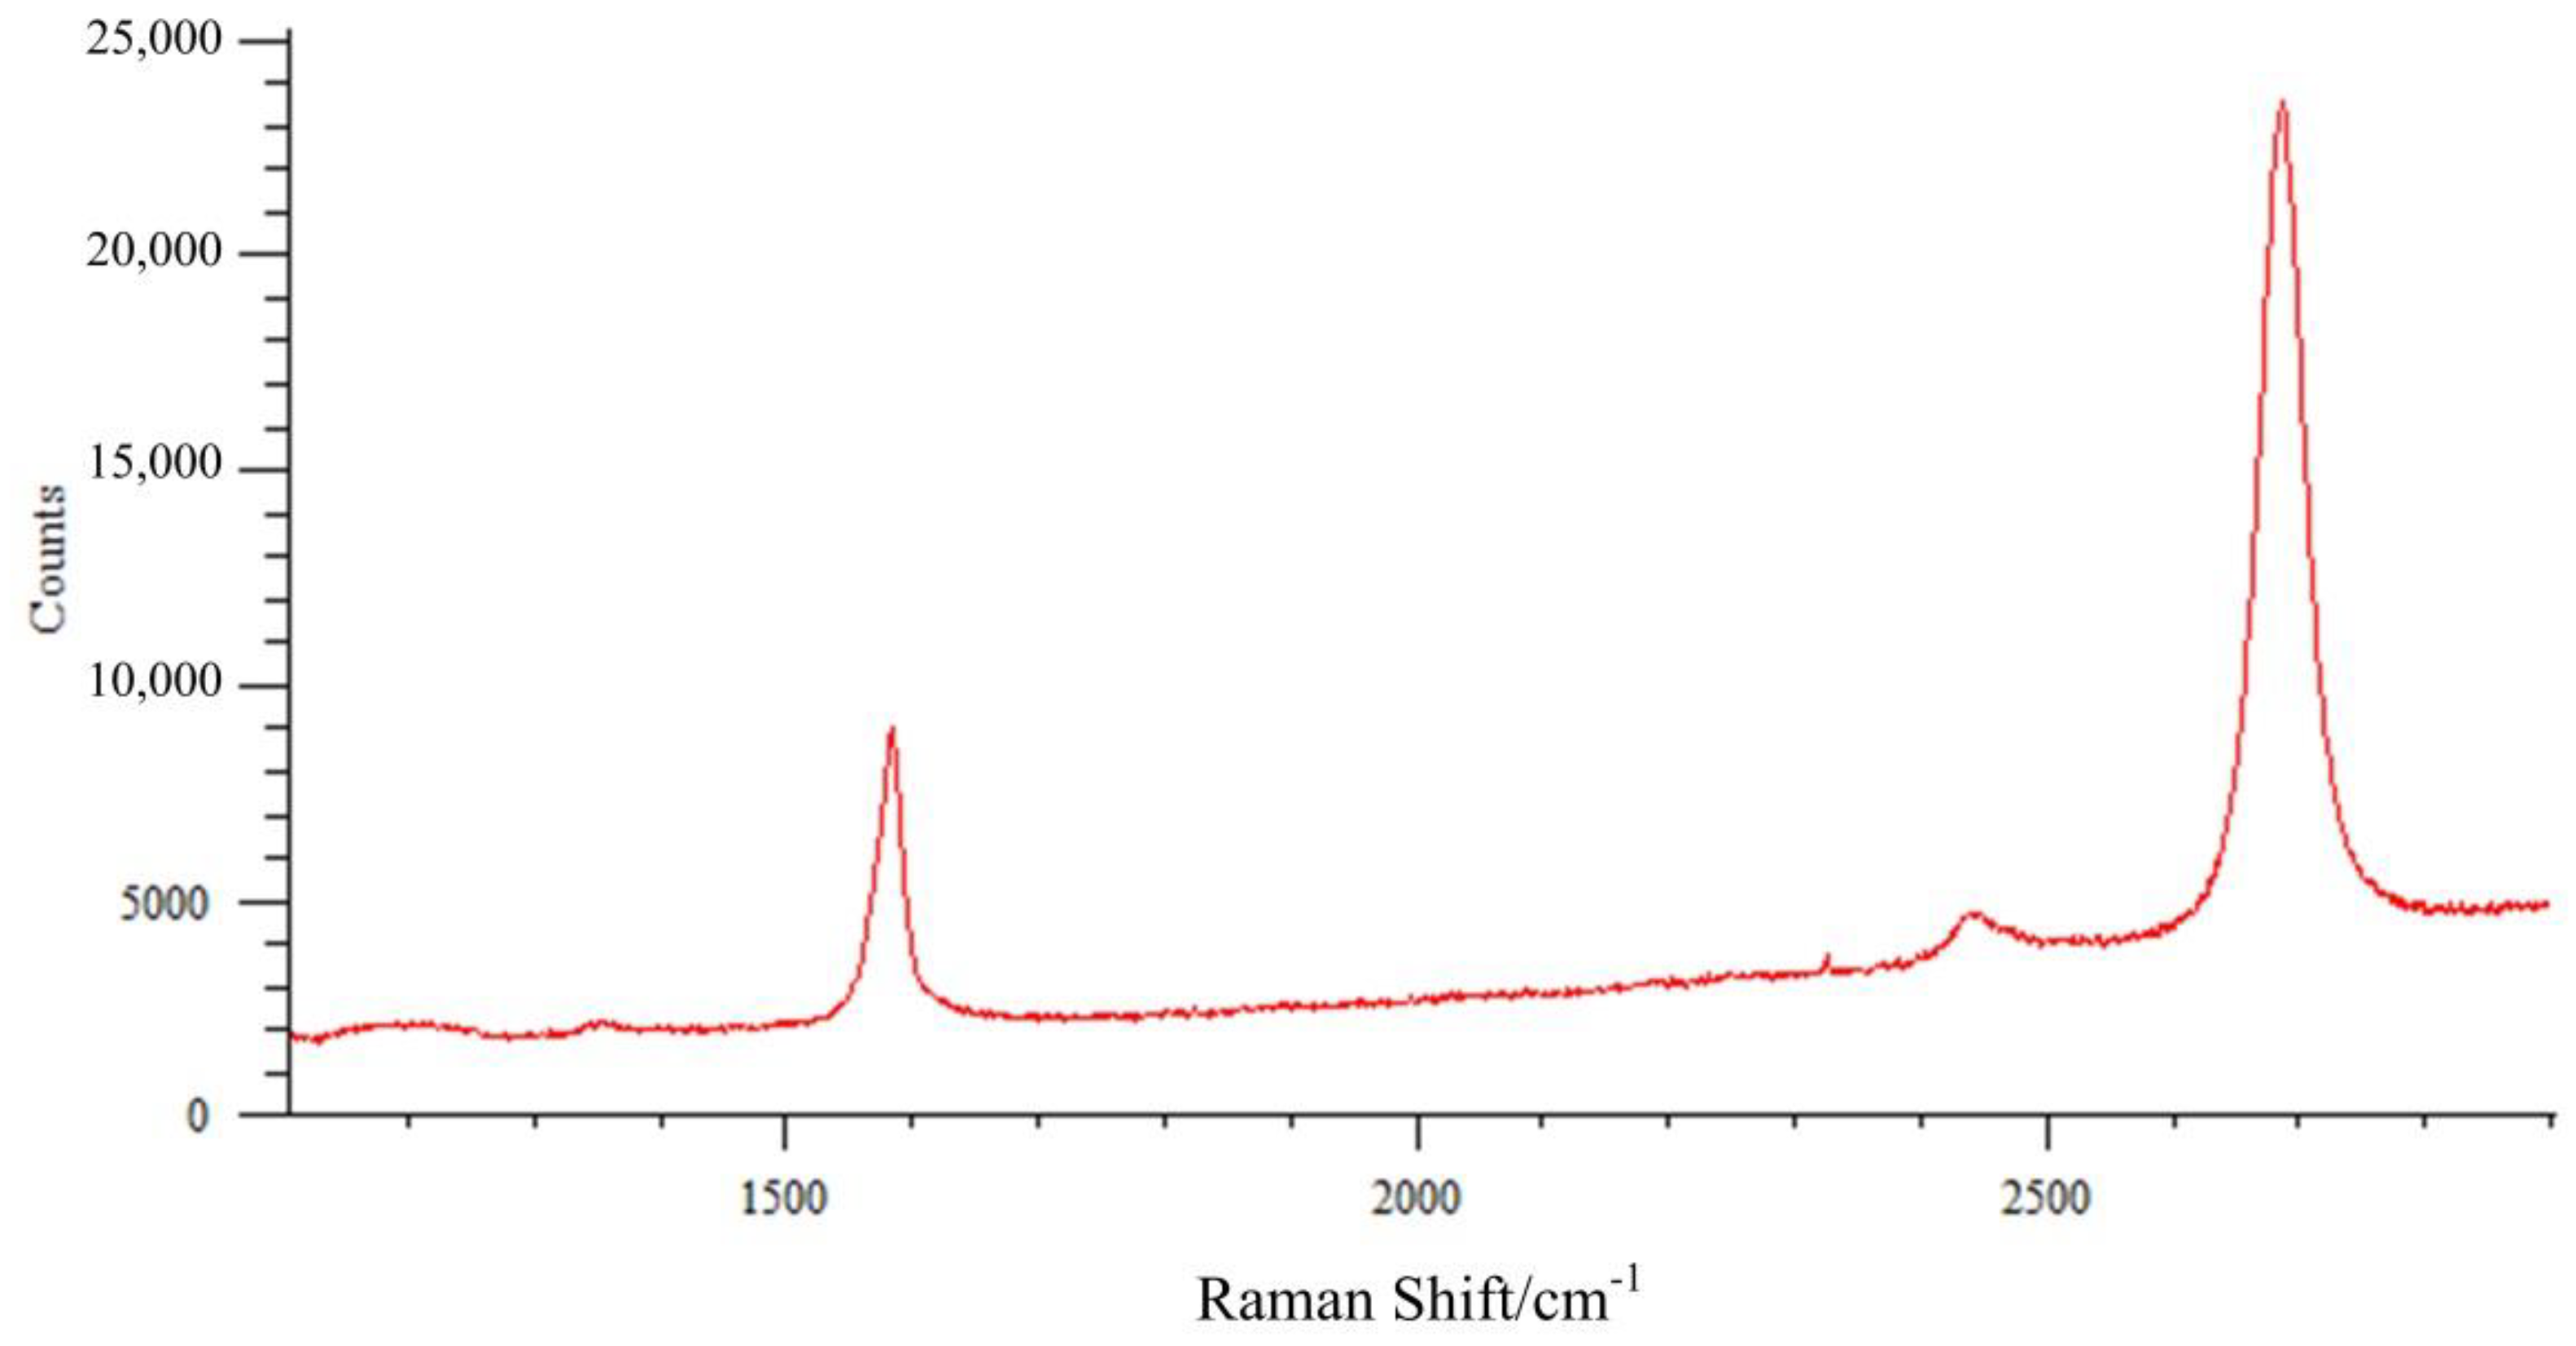
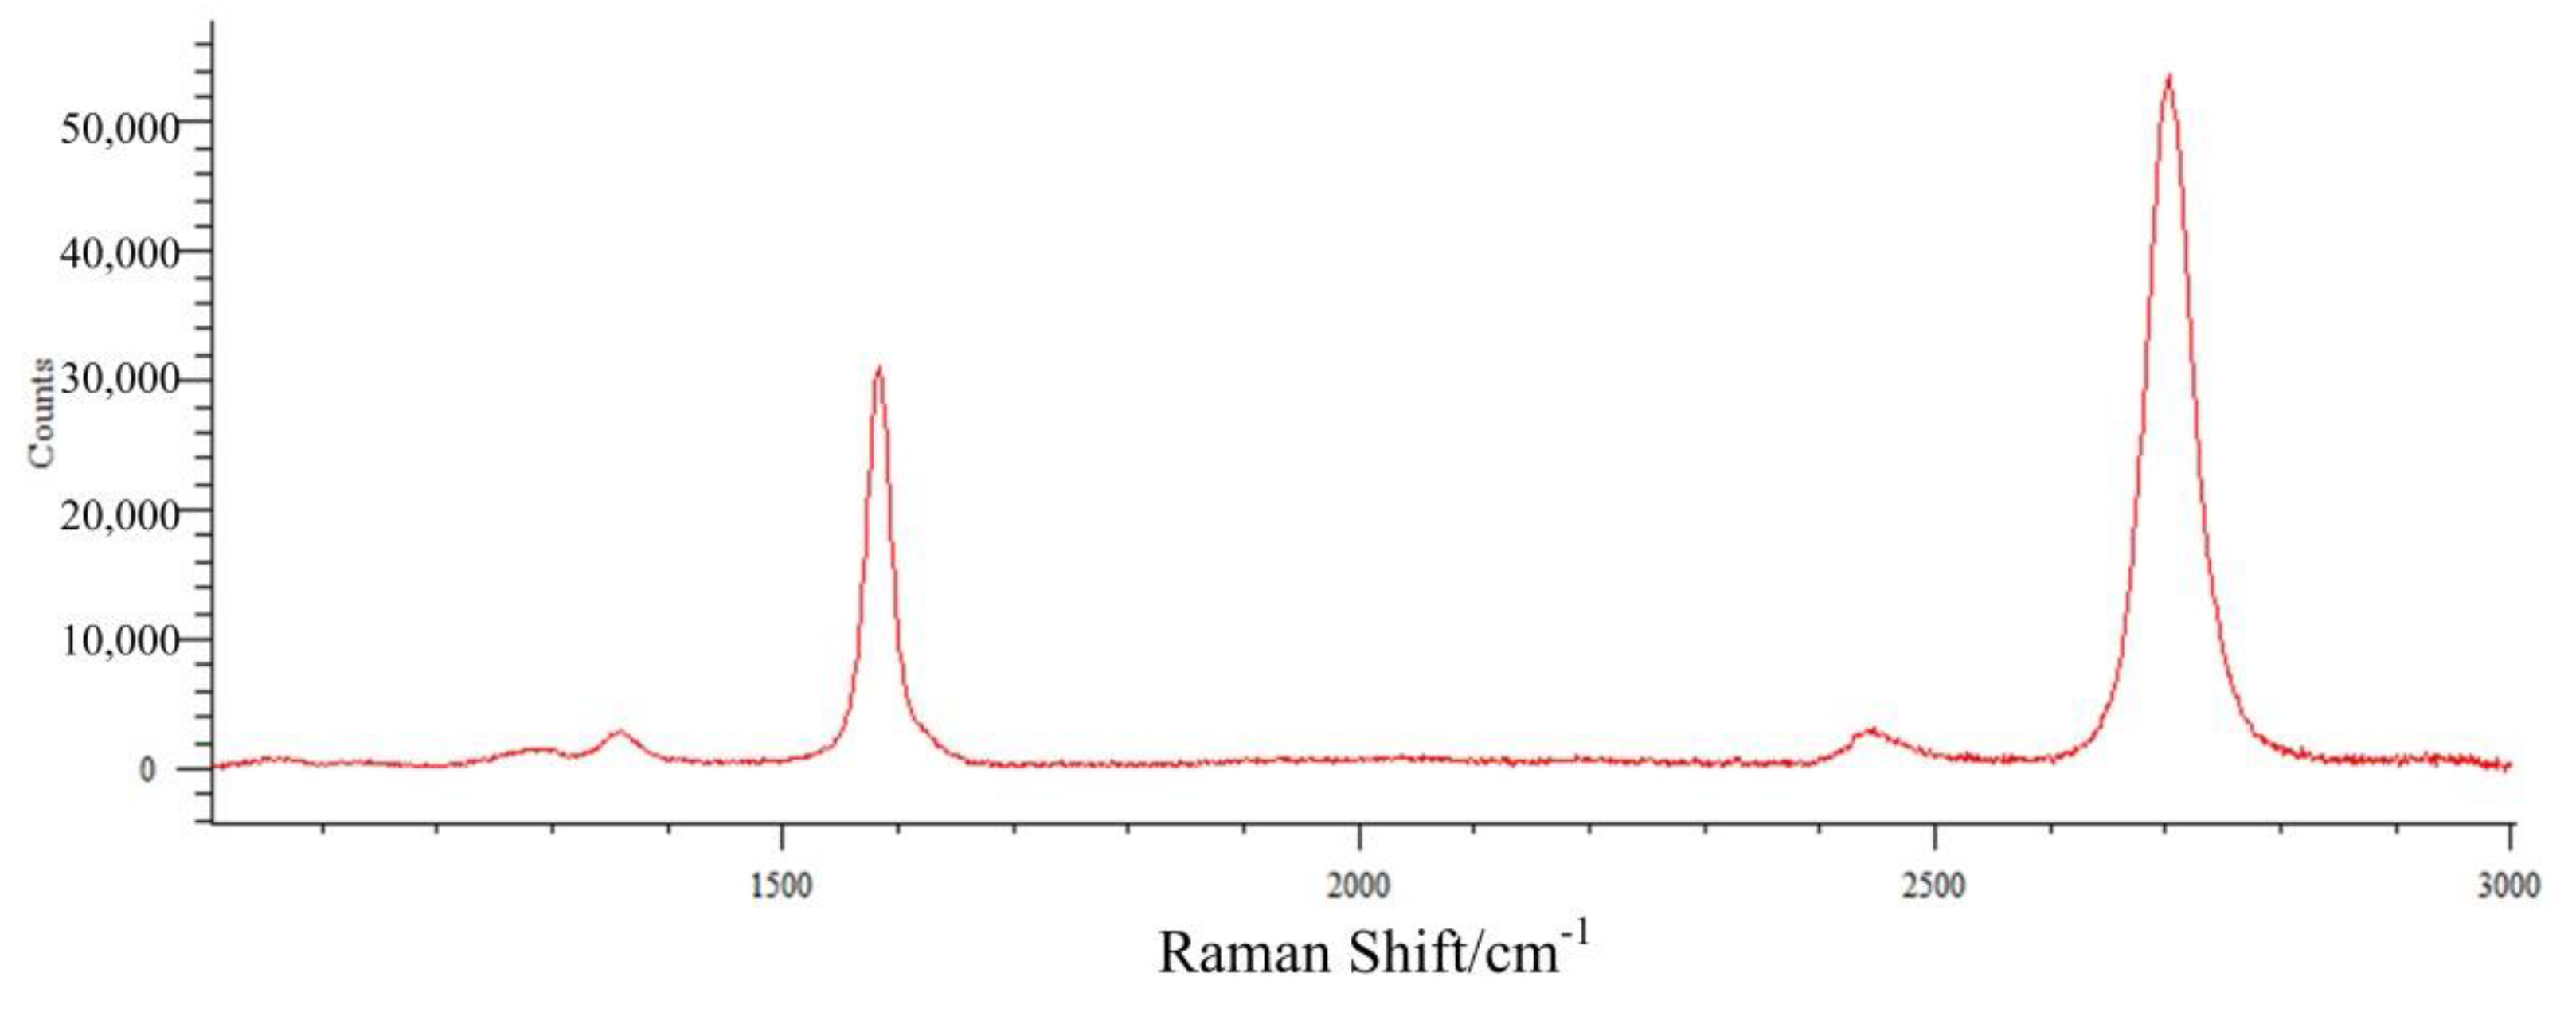
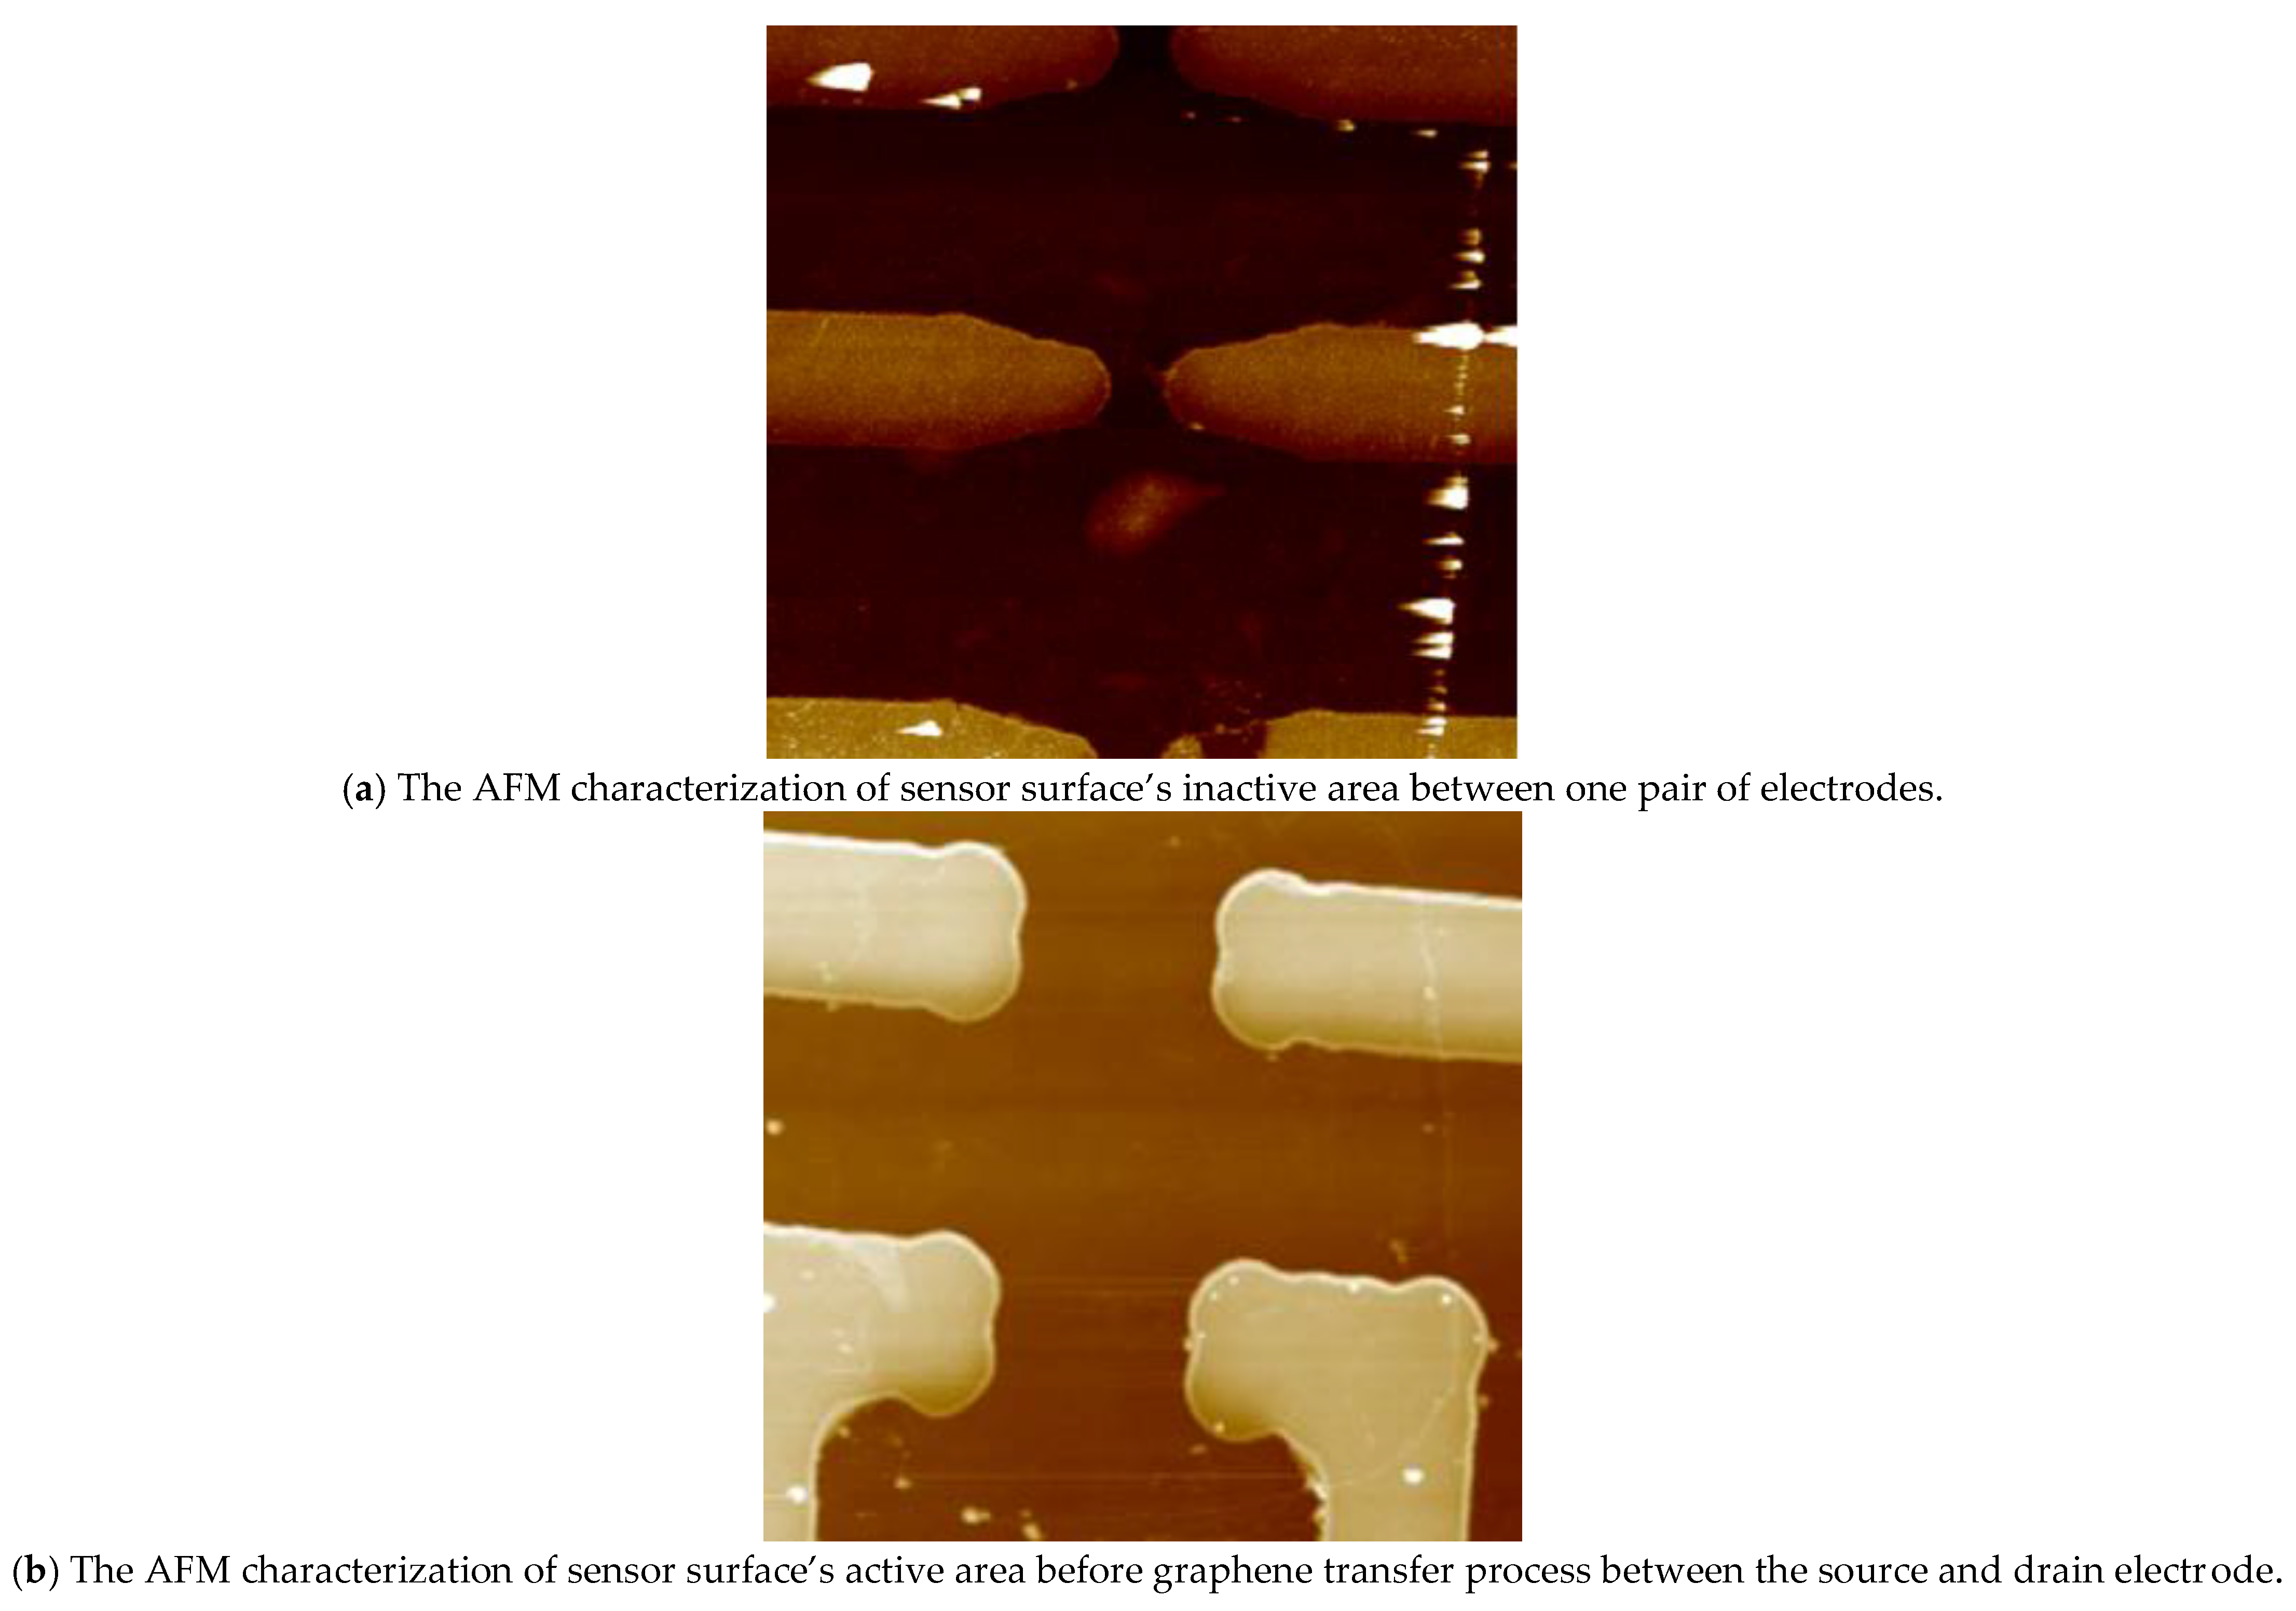
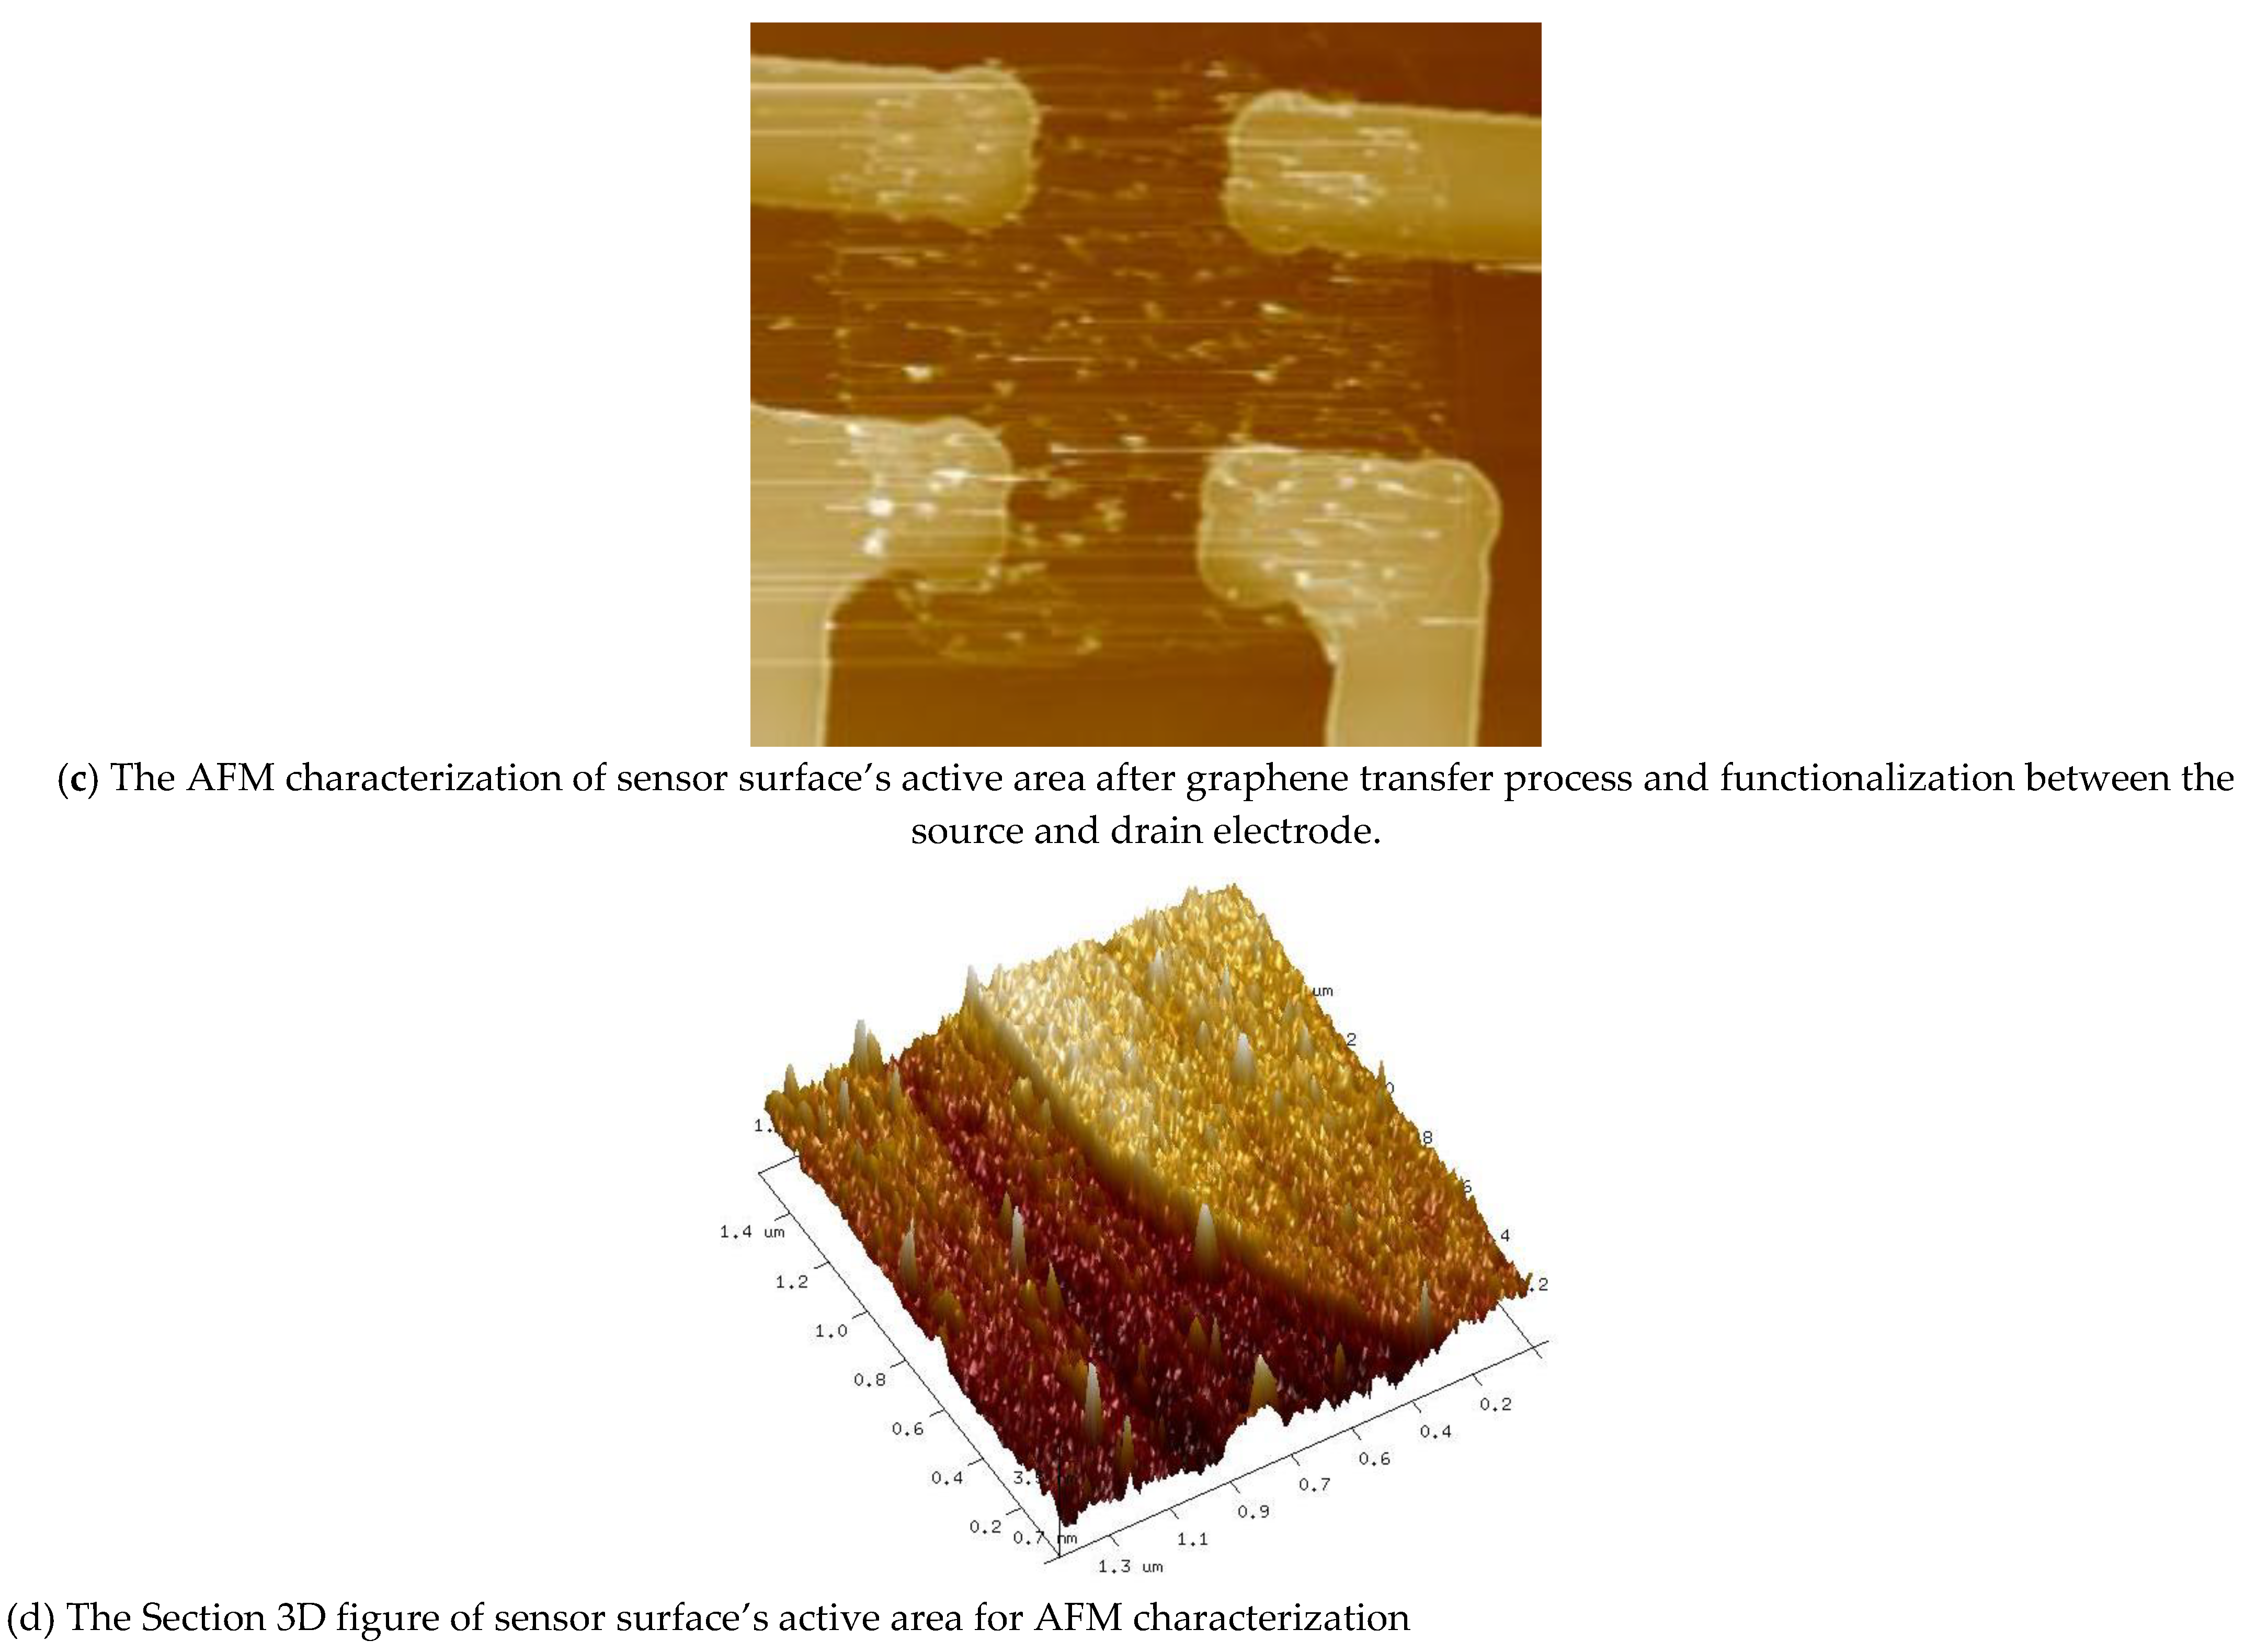
4.2. Sensor Surface Characterization
5. Sensor Signal Analysis
6. Conclusions
Author Contributions
Funding
Informed Consent Statement
Data Availability Statement
Acknowledgments
Conflicts of Interest
References
- Kumar, J.S.; Murmu, N.C.; Kuila, T. Recent trends in the graphene-based sensors for the detection of hydrogen peroxide. AIMS Mater. Sci. 2018, 5, 422–466. [Google Scholar] [CrossRef]
- Li, T.; Wang, B.; Du, G.; Zhang, B.; Zeng, Z.M. Electrical Performance of Multilayer MoS2 Transistors on High-k Al2O3 Coated Si Substrates. AIP Adv. 2015, 5, 057102. [Google Scholar] [CrossRef]
- Samnakay, R.; Jiang, C.; Rumyantsev, S.L.; Shur, M.S.; Balandin, A.A. Selective chemical vapor sensing with few-layer MoS2 thin-film transistors: Comparison with graphene devices. Appl. Phys. Lett. 2015, 106, 023115. [Google Scholar] [CrossRef]
- Gautam, M.; Jayatissa, A.H. Ammonia gas sensing behavior of graphene surface decorated with gold nanoparticles. Solid-State Electron. 2012, 78, 159–165. [Google Scholar] [CrossRef]
- Sudibya, H.G.; He, Q.; Zhang, H.; Chen, P. Electrical Detection of Metal Ions Using Field-Effect Transistors Based on Micro patterned Reduced Graphene Oxide Films. ACS Nano 2011, 5, 1990–1994. [Google Scholar] [CrossRef]
- Lerner, M.B.; Matsunaga, F.; Han, G.H.; Hong, S.J.; Xi, J.; Crook, A.; Perez-Aguilar, J.M.; Park, Y.W.; Saven, J.S.; Liu, R.; et al. Scalable Production of Highly Sensitive Nano-sensors Based on Graphene Functionalized with a Designed G Protein-Coupled Receptor. Nano Lett. 2014, 14, 2709–2714. [Google Scholar] [CrossRef]
- Lü, M.; Li, J.; Yang, X.; Zhang, C.; Yang, J.; Hu, H.; Wang, X. Applications of graphene-based materials in environmental protection and detection. Chin. Sci. Bull. 2013, 58, 2698–2710. [Google Scholar] [CrossRef]
- Cadore, A.; Mania, E.; Alencar, A.; Rezende, N.; de Oliveira, S.; Watanabe, K.; Taniguchi, T.; Chacham, H.; Campos, L.; Lacerda, R. Enhancing the response of NH3 graphene-sensors by using devices with different graphene-substrate distances. Sensors Actuators B Chem. 2018, 266, 438–446. [Google Scholar] [CrossRef]
- Hess, L.H.; Hauf, M.V.; Seifert, M.; Speck, F.; Seyller, T.; Stutzmann, M.; Sharp, I.D.; Garrido, J.A. High-transconductance graphene solution-gated field effect transistors. Appl. Phys. Lett. 2011, 99, 033503. [Google Scholar] [CrossRef]
- Rabchinskii, M.K.; Sysoev, V.V.; Glukhova, O.E.; Brzhezinskaya, M.; Stolyarova, D.Y.; Varezhnikov, A.S.; Solomatin, M.A.; Barkov, P.V.; Kirilenko, D.A.; Pavlov, S.I.; et al. Guiding Graphene Derivatization for the On-Chip Multisensor Arrays: From the Synthesis to the Theoretical Background. Adv. Mater. Technol. 2022, 7, 2101250. [Google Scholar] [CrossRef]
- Chen, C.-H.; Chiang, C.-Y. Determination of the Highly Sensitive Carboxyl-Graphene Oxide-Based Planar Optical Waveguide Localized Surface Plasmon Resonance Biosensor. Nanomaterials 2022, 12, 2146. [Google Scholar] [CrossRef] [PubMed]
- Wu, Z.; Li, F.; Li, X.; Yang, Y.; Huang, X.; Li, H. Direct Synthesis of MoS2 Nanosheets in Reduced Graphene Oxide Nanoscroll for Enhanced Photodetection. Nanomaterials 2022, 12, 1581. [Google Scholar] [CrossRef] [PubMed]
- Bhatt, V.D.; Joshi, S.; Becherer, M.; Lugli, P. Flexible, Low-Cost Sensor Based on Electrolyte Gated Carbon Nanotube Field Effect Transistor for Organo-Phosphate Detection. Sensors 2017, 17, 1147. [Google Scholar] [CrossRef]
- Tuneli, A.; Bag, H.; Turker, A.R. Spectrophotometric Determination of Some Pesticides in Water Samples after Pre-concentration with Saccharomyces Cerevisiae Immobilized on Sepiolite. Fresenius J. Anal. Chem. 2001, 371, 1134–1138. [Google Scholar] [CrossRef] [PubMed]
- Vallvey, L.F.C.; Deheidel, M.K.A.; Avidad, R. Determination of carbaryl in foods by solid-phase room-temperature phosphorimetry. Anal. Bioanal. Chem. 1998, 362, 307–312. [Google Scholar] [CrossRef]
- Yao, W.; Gao, Z.; Cheng, Y. Quartz crystal microbalance for the detection of carbaryl using molecularly imprinted polymers as recognition element. J. Sep. Sci. 2009, 32, 3334–3339. [Google Scholar] [CrossRef]
- Shang, Y.; Zhang, H.; Wang, X.; Wu, J. An Optical Olfactory Sensor Based on Porous Silicon Infiltrated with Room-Temperature Ionic Liquid Arrays. Chem.—A Eur. J. 2011, 17, 13400–13404. [Google Scholar] [CrossRef]
- Chansi; Chaudhary, S.; Mani, A.; Bharadwaj, L.M.; Basu, T. A mobile app integrated portable Electrochemical sensor for rapid detection of Organophosphate pesticides in vegetable extract. Mater. Lett. 2022, 309, 131319. [Google Scholar] [CrossRef]
- Rodrigues, A.; Barbieri, M.; Chino, M.; Manco, G.; Febbraio, F. A 3D Printable Adapter for Solid-state Fluorescence Measurements: The Case of an Immobilized Enzymatic Bioreceptor for Organophosphate Pesticides Detection. Anal. Bioanal. Chem. 2022, 414, 1999–2008. [Google Scholar] [CrossRef]
- Mogha, N.K.; Sahu, V.; Sharma, M.; Sharma, R.K.; Masram, D.T. Biocompatible ZrO2- reduced graphene oxide immobilized AChE biosensor for chlorpyrifos detection. Mater. Des. 2016, 111, 312–320. [Google Scholar] [CrossRef]
- Cui, H.F.; Wu, W.W.; Li, M.M.; Song, X.; Lv, Y.; Zhang, T.T. A Highly Stable Acetylcholinesterase Biosensor Based on Chitosan-TiO2- Graphene Nanocomposites for Detection of Organophosphate pesticides. Biosens. Bioelectron. 2018, 99, 223–229. [Google Scholar] [CrossRef] [PubMed]
- Mehta, J.; Vinayak, P.; Tuteja, S.K.; Chhabra, V.A.; Bhardwaj, N.; Paul, A.K.; Kim, K.-H.; Deep, A. Graphene modified screen printed immunosensor for highly sensitive detection of parathion. Biosens. Bioelectron. 2016, 83, 339–346. [Google Scholar] [CrossRef] [PubMed]
- Brzhezinskaya, M.; Kapitanova, O.; Kononenko, O.; Koveshnikov, S.; Korepanov, V.; Roshchupkin, D. Large-scalable graphene oxide films with resistive switching for non-volatile memory applications. J. Alloys Compd. 2020, 849, 156699. [Google Scholar] [CrossRef]
- Brzhezinskaya, M.; Kononenko, O.; Matveev, V.; Zotov, A.; Khodos, I.I.; Levashov, V.; Volkov, V.; Bozhko, S.I.; Chekmazov, S.V.; Roshchupkin, D. Engineering of Numerous Moiré Superlattices in Twisted Multilayer Graphene for Twistronics and Straintronics Applications. ACS Nano 2021, 15, 12358–12366. [Google Scholar] [CrossRef] [PubMed]
- Hasani, A.; Dehsari, H.S.; Lafmejani, M.A.; Salehi, A.; Taromi, F.A.; Asadi, K.; Kim, S.Y. Ammonia-Sensing Using a Composite of Graphene Oxide and Conducting Polymer. Phys. Status solidi (RRL)–Rapid Res. Lett. 2018, 12, 1800037. [Google Scholar] [CrossRef]
- Karimi, H.; Ahmadi, M.T.; Khosrowabadi, E.; Rahmani, R.; Saeidimanesh, M.; Ismail, R.; Naghib, S.D.; Akbari, E. Analytical prediction of liquid-gated graphene nanoscroll biosensor performance. RSC Adv. 2014, 4, 16153–16162. [Google Scholar] [CrossRef]
- Petrone, N.; Meric, I.; Chari, T.; Shepard, K.L.; Hone, J. Graphene Field-Effect Transistors for Radio-Frequency Flexible Electronics. IEEE J. Electron Devices Soc. 2014, 3, 44–48. [Google Scholar] [CrossRef]
- Petrone, N.; Meric, I.; Hone, J.; Shepard, K.L. Graphene Field-Effect Transistors with Gigahertz-Frequency Power Gain on Flexible Substrates. Nano Lett. 2012, 13, 121–125. [Google Scholar] [CrossRef] [PubMed]
- Chu, K.L.; Wang, Z.B.; Zhou, J.J.; Jiang, H. Transport Properties in Monolayer-bilayer-monolayer Graphene Planar Junctions. Chin. Phys. B 2017, 26, 267202. [Google Scholar] [CrossRef]
- Zhou, N.; Li, C.; Mo, R.; Zhang, P.; He, L.; Nie, F.; Su, W.; Liu, S.; Gao, J.; Shao, H.; et al. A Graphene/Enzyme-Based Electrochemical Sensor for Sensitive Detection of Organophosphorus Pesticides. Surf. Rev. Lett. 2015, 23, 1550103. [Google Scholar] [CrossRef]
- Barik, A.M.; Deka, R.; Dutta, J.C. Carbon Nanotube-Based Dual-Gated Junction-less Field-Effect Transistor for Acetylcholine Detection. IEEE Sens. J. 2016, 16, 280–286. [Google Scholar] [CrossRef]
- Kim, B.; Song, H.S.; Jin, H.J.; Park, E.J.; Lee, S.H.; Lee, B.Y.; Park, T.H.; Hong, S. Highly selective and sensitive detection of neurotransmitters using receptor-modified single-walled carbon nanotube sensors. Nanotechnology 2013, 24, 285501. [Google Scholar] [CrossRef] [PubMed]
- Zhang, Y.; Arugula, M.A.; Wales, M.; Wild, J.; Simonian, A.L. A novel layer-by-layer assembled multi-enzyme/CNT biosensor for discriminative detection between organophosphorus and non-organophosphrus pesticides. Biosens. Bioelectron. 2015, 67, 287–295. [Google Scholar] [CrossRef]
- Aduini, F.; Amine, A.; Moscone, D.; Palleschi, G. Biosensors Based on Cholinesterase Inhibition for Insecticides, Nerve agents and Aflatoxin B1 Detection (review). Microchim. Acta 2010, 170, 192–214. [Google Scholar]
- Arduini, F.; Guidone, S.; Amine, A.; Palleschi, G.; Moscone, D. Acetylcholinesterase biosensor based on self-assembled monolayer-modified gold-screen printed electrodes for organophosphorus insecticide detection. Sens. Actuators B Chem. 2013, 179, 201–208. [Google Scholar] [CrossRef]


Publisher’s Note: MDPI stays neutral with regard to jurisdictional claims in published maps and institutional affiliations. |
© 2022 by the authors. Licensee MDPI, Basel, Switzerland. This article is an open access article distributed under the terms and conditions of the Creative Commons Attribution (CC BY) license (https://creativecommons.org/licenses/by/4.0/).
Share and Cite
Zhu, J.; Feng, M.; Lian, G. Graphene Based FET Biosensor for Organic-Phosphorous Sample Detection and the Enzymatic Analysis. Crystals 2022, 12, 1327. https://doi.org/10.3390/cryst12101327
Zhu J, Feng M, Lian G. Graphene Based FET Biosensor for Organic-Phosphorous Sample Detection and the Enzymatic Analysis. Crystals. 2022; 12(10):1327. https://doi.org/10.3390/cryst12101327
Chicago/Turabian StyleZhu, Jieyi, Meiyan Feng, and Guofu Lian. 2022. "Graphene Based FET Biosensor for Organic-Phosphorous Sample Detection and the Enzymatic Analysis" Crystals 12, no. 10: 1327. https://doi.org/10.3390/cryst12101327