Article

Analysis of Activation Process of Carbon Black Based on Structural Parameters Obtained by XRD Analysis

1
Advanced Material Research Center, Kumoh National Institute of Technology, 61 Daehak-ro, Gumi, Gyeongbuk 39177, Korea
2
School of Materials Science and Engineering, Kumoh National Institute of Technology, 61 Daehak-ro, Gumi, Gyeongbuk 39177, Korea
*
Authors to whom correspondence should be addressed.
Crystals 2021, 11(2), 153; https://doi.org/10.3390/cryst11020153
Submission received: 7 January 2021 / Revised: 30 January 2021 / Accepted: 31 January 2021 / Published: 2 February 2021

Abstract

:
In the present study, carbon black activated by CO2 gas was examined through XRD analysis, especially with regard to changes in its structural parameters. Based on the results, its activation process was thoroughly analyzed. The activation process was controlled by isothermally activating the carbon black inside a reaction tube through which CO2 gas flowed. With this approach, the degree of activation was varied as desired. At an early stage of the activation process, the amorphous fraction on the carbon black surface was preferentially activated, and later the less-developed crystalline carbon (LDCC) region inside the carbon black particles started to be activated. The latter process was attributable to the formation of pores inside the carbon black particles. As the activation process proceeded further, the more-developed crystalline carbon (MDCC) region started to be activated, thereby causing the pores inside the carbon black particles to grow larger. At the last stage of the activation process, La was found to be decreased to about 40 Å. This implied that the edges of the graphite crystals had been activated, thus causing the internal pores to grow and coalesce into larger pores. Activated conductive Super-P with enhanced pore properties is expected to have wide applications.

1. Introduction

Carbon-based materials, such as coal, charcoal, carbon black, carbon fiber, and graphite, have various structures ranging from amorphous to crystalline, with a high degree of graphitization and crystallinity. The structure of these carbon materials is determined and affected not only by their starting materials but also by heat treatment processes [1,2]. Heat treatment may lead to structural changes, and this knowledge helps us better understand a wide range of heat treatment processes, such as carbonization, graphitizing, stabilization, and activation.
Many researchers have attempted to analyze the structural change of carbon materials during heat treatment using various analytical tools, such as XRD, Raman, and HRTEM [3,4,5,6,7,8]. Among them, XRD has been most widely employed for quantitative analysis. This technique allows researchers to calculate the structural parameters (interplanar distance and crystallite size) of carbon materials directly from their X-ray diffraction patterns, which primarily determine their structure. The interplanar distance is calculated based on the angles of diffraction peaks, and the crystallite sizes Lc and La can be determined using the angles and full width at half maximum (FWHM) of diffraction peaks.
Previous structural analyses of carbon materials using XRD methods can be categorized according to the type of carbon material used, including highly graphitizable and less graphitizable carbon materials. Many studies reported on structural parameters of highly graphitizable carbon materials, as follows: d002 ranges from 3.36 to 3.44 Å, while Lc and La are of some hundreds of Å [9,10,11]. Other structural analyses of less graphitizable carbon materials reported that d002 ranged from 3.5 to 5.0 Å, larger than that of highly graphitizable carbon materials, and that Lc and La were very small [1,2]. This structural distinction was reportedly attributed to the use of different starting materials or heat treatment processes.
Meanwhile, conductive carbon black has been widely used in an extensive range of fields, for example, as conductive additives for high-performance secondary batteries and as catalyst support for fuel cells [12,13,14,15]. It has been reported that conductive carbon black is activated by nitric acid and oxygen-containing gases, and this activation process leads to an increase in specific surface area and the formation of internal pores [16,17,18,19,20,21,22,23,24]. Some efforts have been made to analyze the structural parameters and pore structures of carbon black in activated state using XRD and TEM analysis; however, only a handful of attempts have been made to analyze the activation process of carbon black on a phase-by-phase basis [25,26,27].
The authors of the present study previously conducted a study in which carbon black was activated using CO2 gas; this involved a relatively slow reaction, during which changes in its specific surface area and internal pore development were analyzed using a BET device in a phase-by-phase manner [28]. It was observed that at the early and intermediate stages of the process, micropores (2 nm or smaller) on the surface started to grow into the depth of the material, thereby causing pores of 2–5 nm to form inside the primary particles of the carbon black. The TEM results confirmed that these pores were gourd-shaped. At the intermediate stage of the activation process, pores with diameters of 2–5 nm significantly increased in volume. At the intermediate and later stages of activation, pores with a diameter of 5 nm or greater were formed, and the total volume of pores markedly increased. This was considered to be because the pores present inside the primary particles of the carbon black grew and coalesced into larger ones. As the activation process continued further, the burn-off (BO) reached 83.2%, thus causing the large internal pores to coalesce into even larger pores.
Likewise, in our previous study, the development of pores inside the carbon black during the activation process was examined and analyzed using BET and TEM methods [28]. In the present study, changes in the respective volume and size fractions of the less-developed crystalline carbon (LDCC) and more-developed crystalline carbon (MDCC) regions, which constituted carbon black particles, were measured using XRD methods to obtain an analytical interpretation of the activation process of carbon black.

2. Experimental Procedures

2.1. Raw Materials

In the present study, Super-P, a carbon black produced by IMERYS Graphite & Carbon (Bironico, Ticino, Switzerland), was used as a raw material. Table 1 summarizes the physical properties of Super-P. Super-P is a conductive carbon black with a particle size of up to 40 nm and a specific surface area of 62 m2/g; it is widely used as a conductive material and support for secondary batteries and fuel cells.

2.2. Activation Reaction

The activation reaction was performed by isothermally activating raw carbon black in a horizontal tube furnace. CO2 gas was used as reactive gas and was allowed to flow at a constant rate of 100 mL/min. When the inside temperature of the reaction tube through which CO2 gas flowed reached 1000 °C, the raw carbon black was injected into the tube using an alumina boat and kept inside the tube for a certain period of time to be activated. The degree of activation, i.e., the burn-off ratio (BO), was calculated by measuring the weight of the carbon black before and after the activation reaction. Table 2 presents BET analysis results regarding total volume of pores and micropores, and the volume ratio of micropores reported in a previous study [28].

2.3. Analysis of Structural Parameters through XRD Measurement

The activated carbon black was analyzed using an X-ray diffractometer (XRD, D-MAX/2500-PC, Rigaku, Akishima-shi, Tokyo, Japan), especially with respect to its structural parameters. The X-ray generator was 18 kw and the detector was a two-dimensional semiconductor X-ray detector. XRD diffraction peaks were obtained in 2θ continuous scanning mode within a scanning range of 10–60° and at a scanning speed of 1°/min. The obtained results were then subjected to 2θ calibration using the annealed silicon standard specimen. The wavelength of the X-ray target source (Cu-Kα1) was 1.5406 Å.
When calculating the degree of crystallinity through X-ray diffraction analysis, the diffraction intensity ratio Icrystalline/Iamorphous is proportional to the respective mass ratios under the condition that the crystalline and amorphous portions have the same chemical composition. Here, Icrystalline is the diffraction intensity that corresponds to the crystalline portion, while Iamorphous corresponds to the amorphous portion [29]. In the present study, the relative fractions of the crystalline and amorphous portions were calculated based on the maximum intensity of the 002 peak. The crystalline and amorphous fractions were calculated using the equations shown below.
Crystalline carbon fraction (%) = (Icrystalline/Itotal) × 100
Amorphous carbon fraction (%) = (Iamorphous/Itotal) × 100
The 002 peaks of the X-ray diffraction patterns were analyzed to determine the structural parameters. The structural parameters (d002, Lc) were calculated by deconvoluting an asymmetric 002 peak into a peak near 20° and a peak near 26° [30,31,32,33,34].
In calculating d002 and Lc based on the analysis of the 002 peak, the background was removed by drawing a straight line that connected the lowest point of the peak observed between 10° and 15° and the region near 15° [29,34]. With the background removed, all 002 peaks showed a certain degree of asymmetry. According to X-ray diffraction theory, an asymmetric peak indicates that the corresponding specimen contains defects [35].
The crystalline portion of the carbon black used in the present study that contributed to the formation of the 002 peak was assumed to be a mixed combination of crystalline regions with more defects and fewer defects. These regions were defined as the less-developed crystalline carbon (LDCC) and more-developed crystalline carbon (MDCC) regions [29,34].
As shown in Figure 1, the 002 peak with the background removed was subjected to smoothing and then deconvoluted by Gaussian fitting into the LDCC and MDCC fractions. The correlation coefficients during the peak deconvolution process were all 0.99 or higher.
The 10l peak near 43° was analyzed as follows. The background was first removed in the range between 35–60°; then, Gaussian fitting was applied to remove the 102 peak near 52°. Following that, the 2θ and full width at half maximum (FWHM) of the peak were determined.
2θ and FWHM were measured for each peak and, based on the results, the respective interplanar distances were calculated using the Bragg equation.
2d sinθ = nλ
n: positive integer
λ: wavelength
The crystallite sizes Lc and La were calculated using the Scherrer equation [36].
L= Kλ/βcosθ
L: mean size of ordered domains
K: shape parameter
λ: X-ray wavelength
β: FWHM (in radians)
In the equation above, K is a constant, λ is the wavelength of the used X-ray target source (1.5406 Å, Cu-Kα1), and β is the FWHM in radians. Device error occurring when measuring the FWHM of peaks was compensated for using the Warren equation (B2 = Bmeas2Binstr2) [37]. Bmeas is the FWHM of the measured carbon black, and Binstr is the FWHM of the annealed silicon as a reference sample. Lc was calculated based on the 002 peak, and La was calculated from the 10l peak. In the Scherrer equation, the constant K was set to 0.89 and 1.84 for Lc and La, respectively [36].

3. Results and Discussion

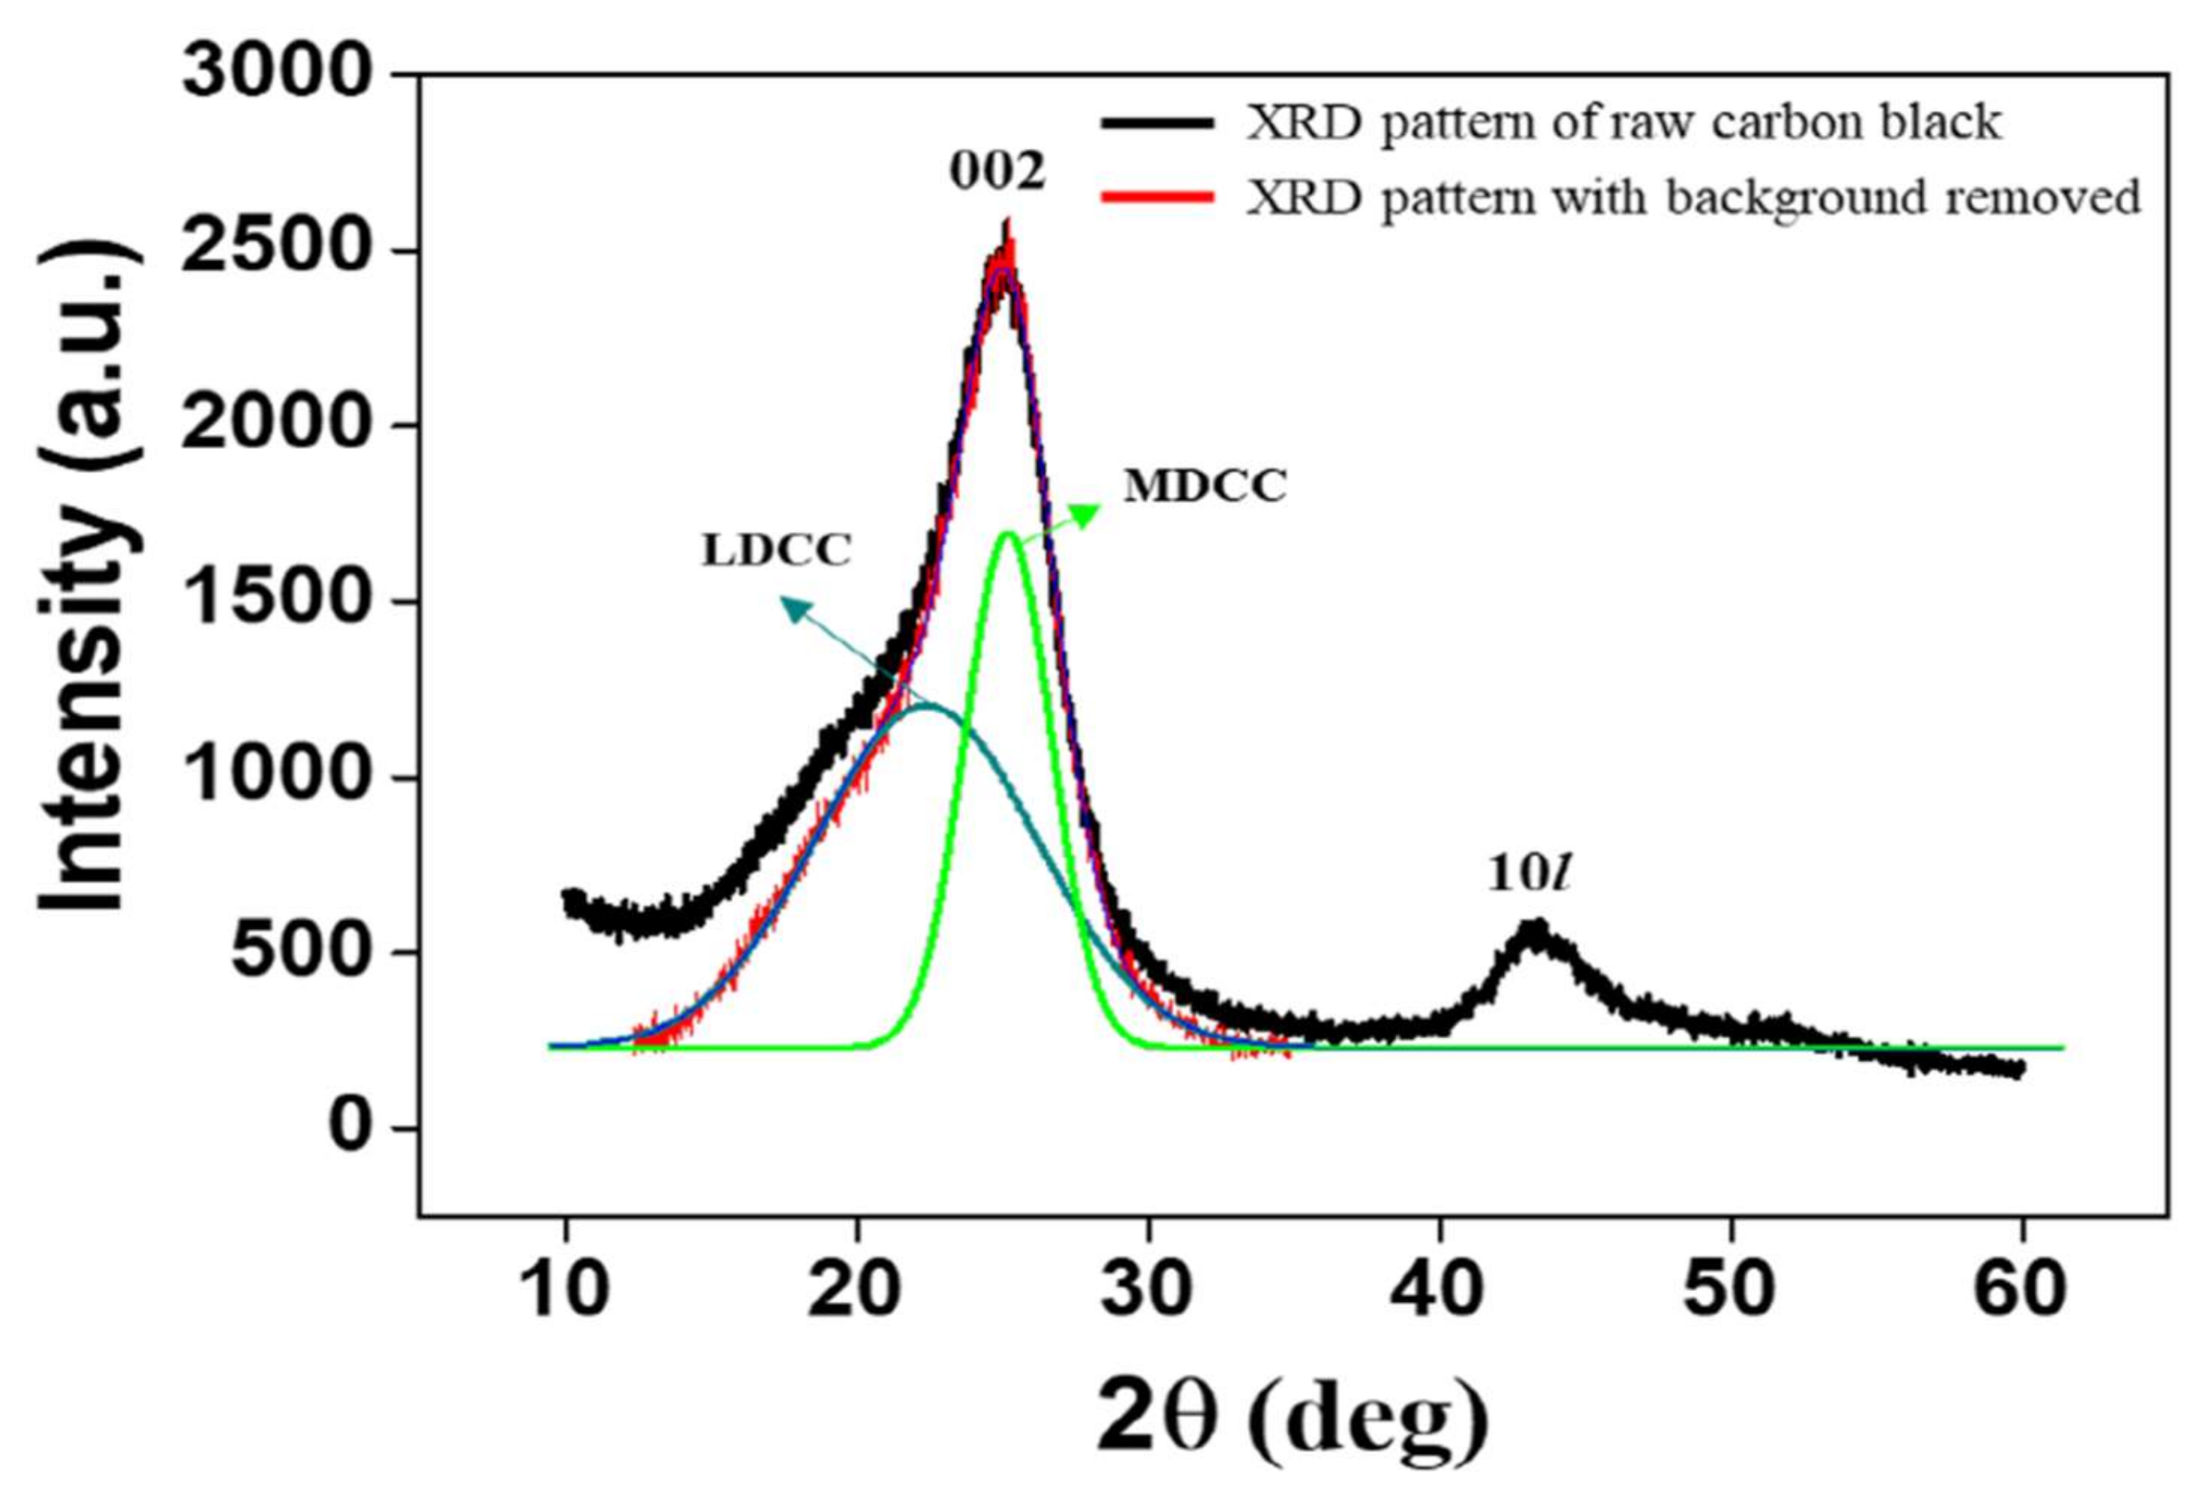
3.1. Shape of X-ray Diffraction Peaks

Figure 1 shows the X-ray diffraction pattern of the raw carbon black. This pattern had a very high baseline and a wide peak width. The diffraction angle (2θ) of the 002 peak of crystalline graphite is known to be 26.56°, but the 002 peak in this figure was located near 25.1°. This indicated that its micro-crystallites differ from those of graphite. The broad 10l peak appeared to be a single peak because 100 and 101 peaks, which constituted the 10l peak, had not been clearly separated. This implied that each carbon atom layer in the structure was incompletely stacked. These results confirm that the carbon black was primarily composed of turbostratic structures.
Figure 2 shows how the X-ray diffraction pattern of the activated carbon black changes depending on the degree of activation. Obvious changes in the 002 peak showed that the structure of the carbon black was significantly affected by the activation process. The left portion of the 002 peak was increasingly affected as the activation process continued, thereby leading to an increase in the degree of asymmetry. This also meant that the sample’s micro-crystallites increasingly differed from those of graphite.
However, there was no significant change in the shape of the 10l peak as the activation process proceeded, as shown in Figure 2.

3.2. Interplanar Distance and Crystallite Size of Raw Carbon Black

Table 3 presents the structural parameters obtained from the X-ray diffraction patterns. The structural parameters of the raw carbon black were as follows. The Lc values were 10.80 Å and 28.03 Å for LDCC and MDCC, respectively. La was estimated based on the 10l peak to be 48.41 Å. These calculations were conducted based on the following idea: if it is assumed that the crystal is composed of perfect graphite lattice layers in each of which hexagonal aromatic carbon rings are linked to each other, then each graphite lattice layer is supposed to contain 18–20 aromatic carbon rings. The number of aromatic lattice layers was calculated by dividing the interplanar distance from the crystallite size Lc of LDCC and MDCC. This implied that LDCC was composed of about 2.7 of these aromatic lattice layers, while MDCC consisted of about 7.9 of these layers.
As shown in Table 3, d002 for the LDCC was 3.96 Å, while d002 for the MDCC was 3.54 Å, both of which were larger than that of graphite crystal at 3.354 Å. Also, the crystallite size was larger in the MDCC than in the LDCC. The raw carbon black was composed of very small crystals and thus contained more active sites for activation. Therefore, it was deemed that the activation process promoted the formation of pores and increased the specific surface area of the raw carbon black. This result was consistent with our previous study that reported that the specific surface area increased as the activation process proceeded, as shown in Table 2 [28].

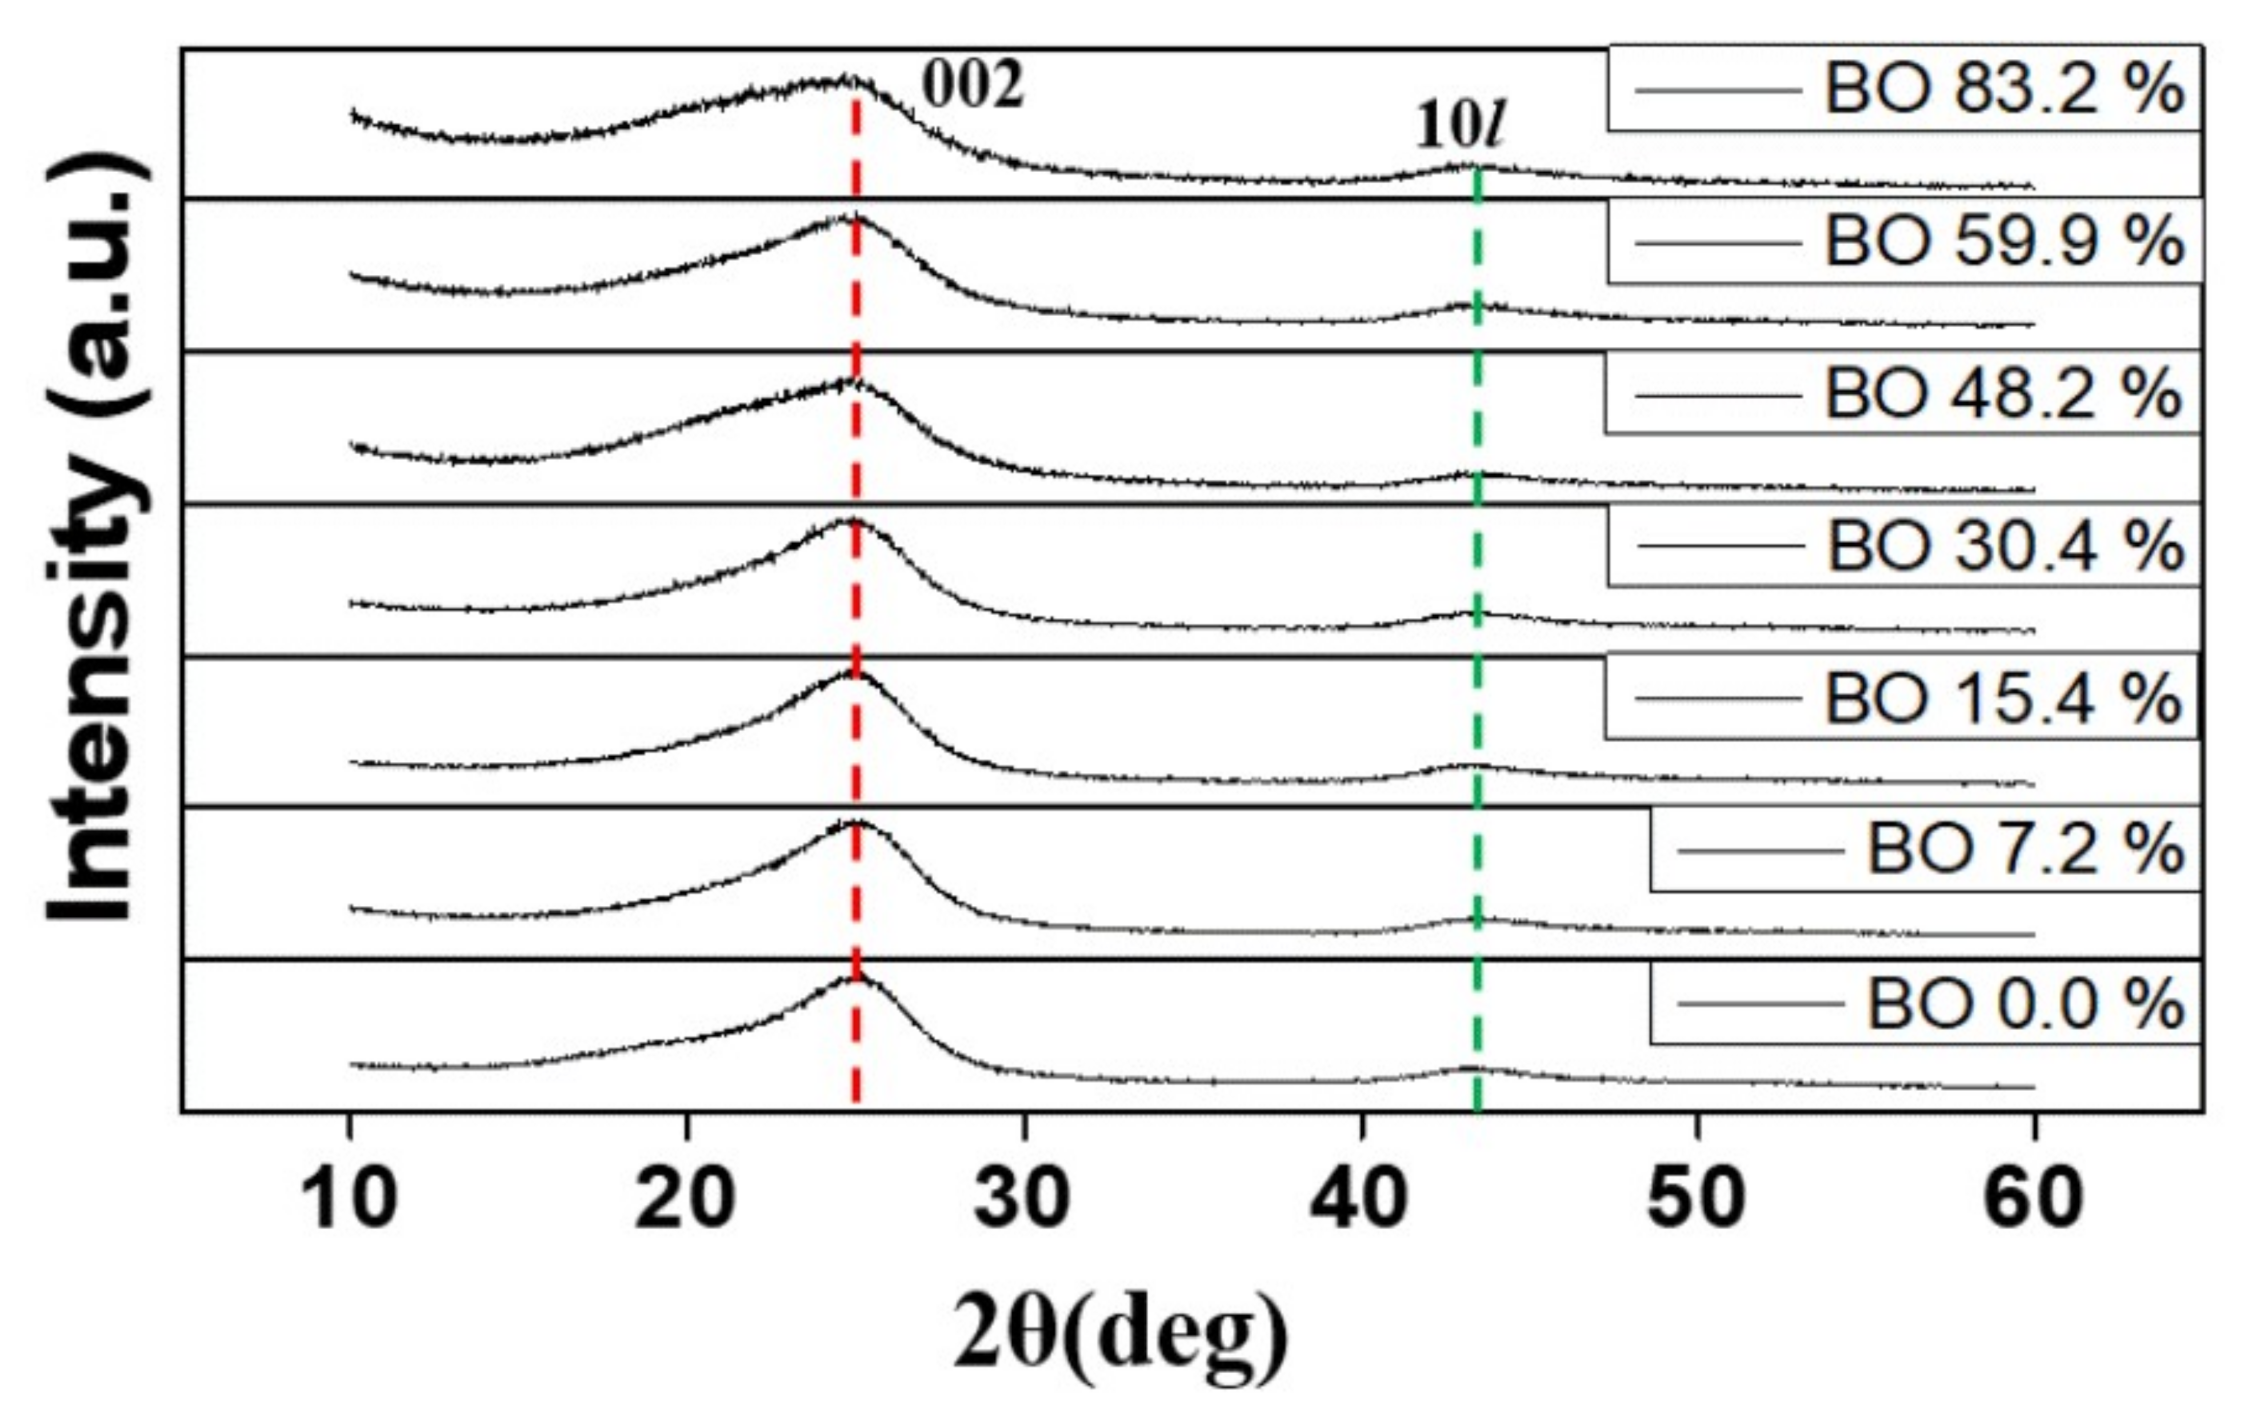
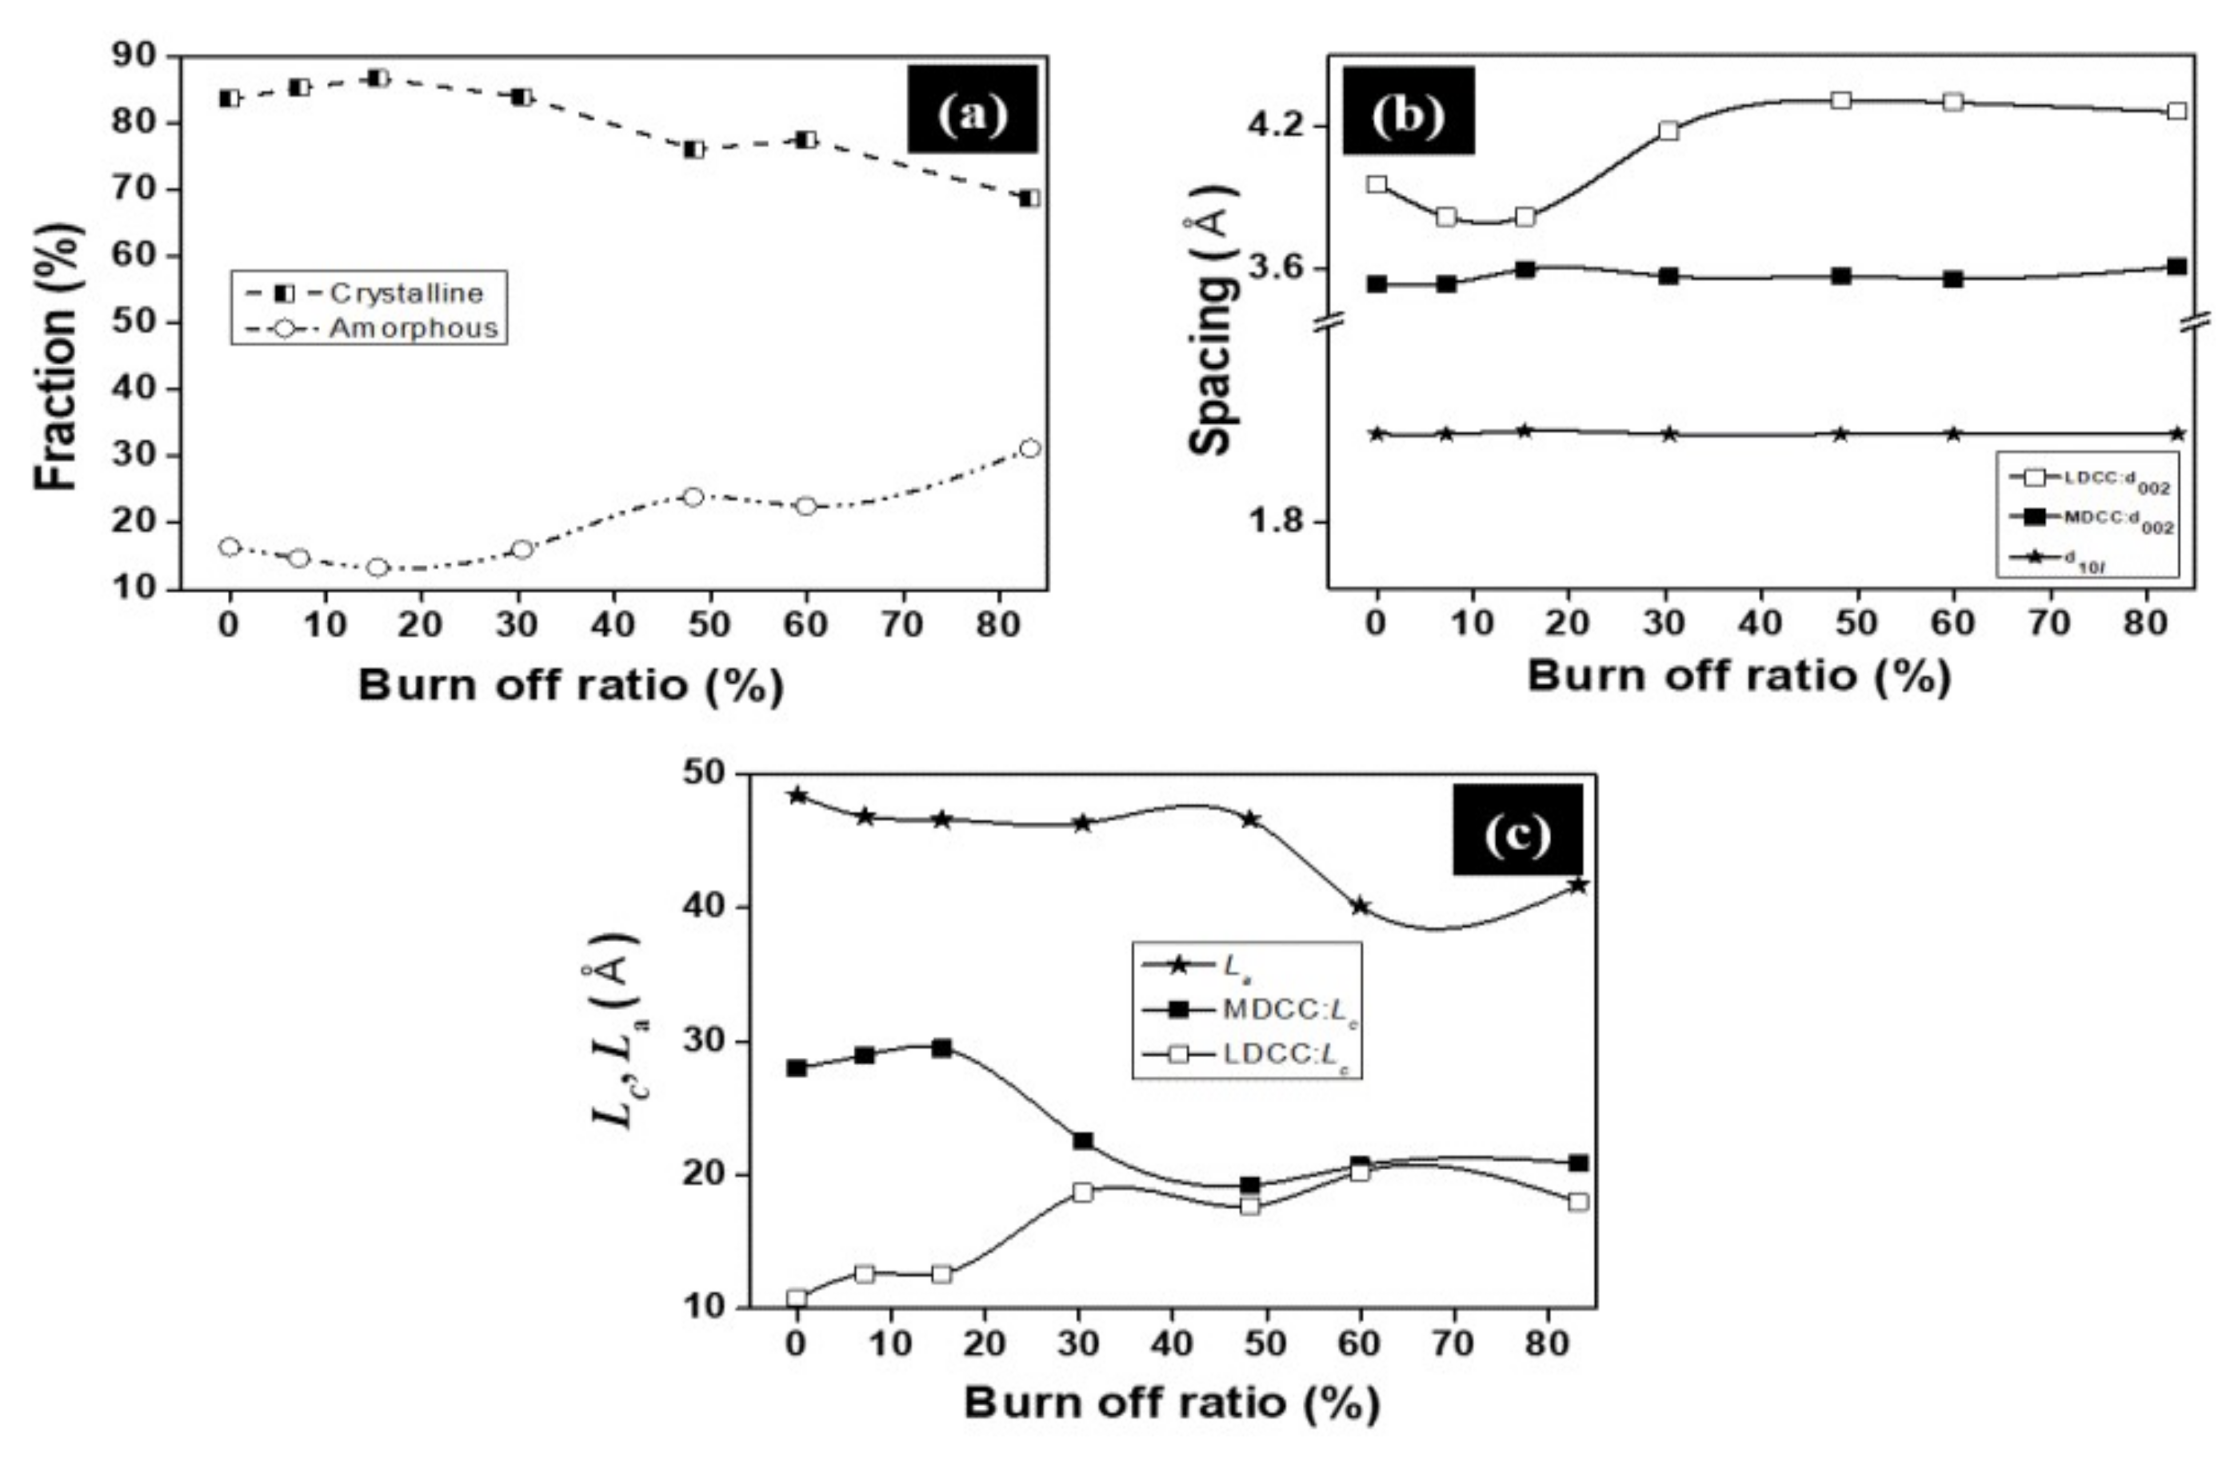
3.3. Changes in Structural Parameters Resulting from Activation Process

Figure 3 shows how structural parameters determined based on the XRD results change depending on the degree of activation. To be more specific, Figure 3a presents the respective fractions of the amorphous and crystalline regions. The portion of the amorphous region decreased until BO reached 15.4% and then started to increase as the activation process proceeded. This was considered to be because the amorphous region of the carbon black present at the early stage of the activation process was preferentially removed as the process continued. If this holds true over the entire course of the activation process, the portion of the amorphous region must continue to decrease until the end. In reality, however, when BO exceeded 30.4%, the amorphous fraction started to increase, while the crystalline fraction decreased accordingly.
Sorokina et al. [38] reported that, when anodized with 98% HNO3 for 24 h, natural flaked graphite became amorphous as overoxidation occurred. They concluded that the overoxidation process caused the graphite structure to decompose. The decrease in the crystalline region and the increase in the amorphous region observed in the present study were also attributable to the activation of the crystal structure of the crystalline portion, which led to the occurrence of amorphization.
Figure 3b shows the effect of the degree of activation on the interplanar distance. As the activation process proceeded, d002 for the LDCC continued to decrease to 3.82 Å until BO reached 15.4% and then started to increase and reached 4.26 Å when BO was 83.2%. d002 for the MDCC was 3.54 Å when BO was 0% and slightly increased to 3.61 Å when BO was 83.2%. In contrast, d10l remained around at 2.07 Å over the entire range of BO. Its variation was very limited compared to d002.
Figure 3c shows the effect of the degree of activation on the crystallite size. Lc for the LDCC and MDCC and La all changed in different modes as BO increased. As the process proceeded, Lc for the LDCC slightly increased to 12.64 Å until BO reached 15.4% but then sharply increased to 18.68 Å as BO increased to 30.4%. Afterward, however, there was little change in the value. Lc for the MDCC slightly increased to 29.47 Å until BO reached 15.4% but then sharply decreased to 22.58 Å as BO increased to 30.4%. As the activation process proceeded further, it started to converge to Lc for the LDCC. The sudden decrease in Lc for the MDCC and the sharp increase in Lc for the LDCC observed when BO was 30.4% were attributable to the fact that the crystallinity of the MDCC region was lowered as it was activated, and thus part of it was converted into the LDCC region. La was 48.41 Å when BO was 0%, slightly decreased to 46.62 Å until BO reached 48.2%, and then rapidly decreased to 40.13 Å as BO increased to 59.9%.

3.4. Stage-by-Stage Analysis of Activation Process Based on Changes in Structural Parameters

It is well-known that the activation of carbon materials is initiated from the amorphous region and the edges of graphite crystals [39,40]. If the carbon atoms present in the amorphous region, among all the constituents of a carbon black, are preferentially activated, the overall crystallinity of the carbon black is supposed to increase as the reaction proceeds. Therefore, it is expected that d002 will decrease, and Lc will increase as the reaction continues. Furthermore, if the carbon atoms that reside at the edge of graphite crystals start to be removed after all the amorphous region has been activated, it is expected that d002 will remain the same, while La will continue to decrease.
In our previous study, the pore development process (based on the BET results) during the activation process was analyzed on a stage-by-stage basis [28]. In the present study, changes in the structural parameters (based on the XRD results) during the activation process were analyzed within the same stage classification as used in the previous study.
At an early stage of activation, the BET analysis results reported in the previous study showed that the volume of micropores was 0.010 cm3/g when BO was 0% (raw carbon black); this number doubled to 0.021 cm3/g when BO reached 15.4% (when activated) [28]. In the study, it was concluded that this phenomenon indicated the formation of micropores on the surface of the carbon black, and this process was an attempt to initiate the formation of internal pores.
As shown in Figure 3, the portion of the amorphous region continued to decrease until BO reached 15.4%. The decrease in the amorphous fraction observed here was consistent with the fact that the activation process preferentially occurs in the amorphous region. Meanwhile, Lc increased for both LDCC and MDCC, but La decreased slightly. This observation also indicated that the edge portion of graphite crystals was preferentially activated during the activation process.
Accordingly, in the early stage of activation, the amorphous region is preferentially activated, and then micropores are formed on its surface; also, pore passages are created around the edges of graphite crystals, through which carbon dioxide can diffuse into the inside of the carbon black.
Figure 3a,b show that d002 for the LDCC decreased, and Lc increased as BO increased from 0 to 15.4%. This implied that the amorphous region was more pronounced in the activated carbon black than in the raw carbon black. The reason for the decrease in d002 for the LDCC and the increase in the crystallite size was that some portion of the carbon black that had not been fully carbonized during its manufacturing process could be heat-treated at high temperatures (1000 °C) and fully carbonized thanks to the activation of the amorphous region occurring during the early stage of activation [41,42].
This interpretation could be confirmed by referring to the changes in the crystallinity of the raw carbon black when it was carbonized in a nitrogen atmosphere at 1000 °C, as shown in Table 4. The crystalline fraction of the raw carbon black increased from 83.6% to 87.4% when it was carbonized at 1000 °C. Also, d002 for the LDCC decreased from 3.96 Å to 3.84 Å, while Lc for the LDCC increased by about 2 Å. It was deemed that the same reaction also occurred in the early stage of the activation process.
At the early and intermediate stage of activation: As BO increased to 30.4%, pores started to grow deeper, and thus the volume fraction of micropores increased to about 13%. In the adsorption isotherms, a hysteresis observed in the relative partial pressure range between 0.4 and 0.8 was interpreted as indicating the formation of pores inside the carbon black. This interpretation was further confirmed by TEM images.
According to the XRD analysis results, as BO increased to 30.4% following the early stage of activation, d002 for the LDCC increased to 4.18 Å and Lc also increased to 18.38 Å. However, Lc for the MDCC decreased to 22.58 Å. Also, it was found that the crystalline fraction decreased while the amorphous fraction increased. This indicated that the activation started to occur in the crystalline region, and the LDCC region as part of the crystalline portion, in particular, was preferentially activated, thus causing d002 for the LDCC to increase. The corresponding portion eventually became amorphous, and this is why the amorphous fraction increased in the process.
Donnet and other researchers [43,44,45,46] have reported that carbon black is composed of an amorphous core and layers that surround the core in which carbon atoms are relatively well arranged. Similarly, it can be deemed that this LDCC region exists inside carbon blacks. The mechanism that describes the formation of pores inside the carbon black can be better accounted for based on this idea that the LDCC region with a low degree of crystallinity could be preferentially activated through the pore passages that had been formed on the surface from the early stage of activation.
At the intermediate stage of activation: The volume fraction of micropores decreased from about 13% to 6.9%. This was interpreted as the growth of micropores into ones with a size of 2–5 nm.
As BO increased from 30.4 to 48.2%, the crystalline fraction continued to decrease, d002 for the LDCC increased to 4.31 Å, and Lc decreased to 17.67 Å. d002 for the MDCC remained the same, but Lc decreased by 3.3 Å to 19.22 Å. These results confirmed that in this stage, the LDCC and MDCC regions in the crystalline portion of the carbon black were activated. This continuous activation inside the carbon black was considered to have caused internal pores to grow into ones with a size of 2–5 nm.
At intermediate and later stages of activation, the pores formed inside the primary particles of the carbon black grew and coalesced into 5 nm or larger pores.
As BO increased from 48.2 to 59.9%, most of the structural parameters remained the same, except that La decreased from 46.62 Å to 40.13 Å. This indicated that in this stage, the activation occurred predominantly at the edge of graphite crystals. Accordingly, it was deemed that pores started to be formed inside the carbon black and then coalesced into very larger pores during this stage.
At the later stage of activation, as BO increased from 59.9 to 83.2%, Lc for the LDCC decreased, causing the crystalline fraction to continue to decrease. However, as BO increased to 83.2%, Lc for the MDCC and La slightly increased.
Kamegawa et al. [47] previously reported that the (002) interplanar distance and Lc of the carbon black that had been activated with nitric acid tended to increase as BO increased. They attributed this phenomenon to the rearrangement of the graphite lattice layers. Sharma et al. [48] observed the lattice structure of the coal char that was activated with CO2 gas using HRTEM and reported that the number of stacked layers was increased in the 92% activated coal char. They attributed this increase to the movement of the carbon atoms.
In our previous study, it was reported that when BO was 83.2%, an excessive mass loss occurred, thereby causing the primary particles of the carbon black to decrease in size and become non-spherical [28]. The reason that such an excessive activation led to a decrease in the particle size and an increase in the degree of crystallinity was considered to be due to the movement of the carbon atoms and the rearrangement of the lattice layers, as reported by Kamegawa [47] and Sharma [48].

4. Conclusions

In the present study, changes in the structural parameters of activated carbon black were examined using XRD analysis. Based on the results, the corresponding activation process was divided as follows.
At the early stage of activation, the amorphous region on the surface of the carbon black was preferentially activated, thereby causing micropores to form on the surface. It was also determined that pore passages were created around the edge of graphite crystals, through which carbon dioxide could diffuse into the inside of the carbon black. Following that, the LDCC region inside the carbon black was preferentially activated, causing the formation of large pores inside the carbon black.
In the intermediate stage of activation, the LDCC and MDCC regions of the crystalline portion were activated, and this led to the formation of large internal pores of 2–5 nm.
In the later stage of activation, La was found to decrease sharply, and this was considered to indicate that activation occurred predominantly at the edges of graphite crystals during this stage. This process was thought to cause the pores inside the carbon black to grow and coalesce into even larger pores. It was also found that when BO increased to 83.2%, the crystallite size increased slightly. This was considered to be because the carbon atoms moved and were rearranged to ensure that all the primary particles of the carbon black could have a single shape.
Activated conductive Super-P with enhanced pore properties is expected to have wide applications such as cathode materials for lithium ion batteries, catalyst supports for fuel cells, and capacitor electrode materials.

Author Contributions

Conceptualization, S.-M.L. and J.-S.R.; methodology, S.-M.L. and J.-S.R.; validation, S.-M.L., S.-H.L. and J.-S.R.; data curation, S.-M.L.; writing—original draft preparation, S.-M.L.; writing—review and editing, S.-M.L., S.-H.L. and J.-S.R.; funding acquisition, S.-M.L. and J.-S.R. All authors have read and agreed to the published version of the manuscript.

Funding

This research was funded by the Basic Science Research Program through the National Research Foundation of Korea (NRF), grant number 2020R1I1A1A01072407 and the Basic Science Research Program through the National Research Foundation of Korea (NRF), grant number 2020R1I1A1A01072407.

Institutional Review Board Statement

Not applicable.

Informed Consent Statement

Not applicable.

Data Availability Statement

Data available on request due to restrictions eg privacy or ethical.

Acknowledgments

This research was supported by the Basic Science Research Program through the National Research Foundation of Korea (NRF) funded by the Ministry of Education (2018R1A6A1A03025761). This research was supported by the Basic Science Research Program through the National Research Foundation of Korea (NRF) funded by the Ministry of Education (2020R1I1A1A01072407).

Conflicts of Interest

The authors declare no conflict of interest.

References

  1. Kovalevski, V.V.; Buseck, P.R.; Cowley, J.M. Comparison of carbon in shungite rocks to other natural carbons: An X-ray and TEM study. Carbon 2001, 39, 243–256. [Google Scholar] [CrossRef]
  2. Yoshizawa, N.; Yamada, Y.; Shiraishi, M. TEM lattice images and their evaluation by image analysis for activated carbons with disordered microtexture. J. Mater. Sci. 1998, 33, 199–206. [Google Scholar] [CrossRef]
  3. Marsh, H. Adsorption methods to study microporosity in coals and carbons—A critique. Carbon 1989, 25, 49–58. [Google Scholar] [CrossRef]
  4. Mittelmeijer-Hazeleger, M.C.; Martín-Martínezz, J.M. Microporosity development by CO2 activation of an anthracite studied by physical adsorption of gases, mercury porosimetry, and scanning electron microscopy. Carbon 1992, 30, 695–709. [Google Scholar] [CrossRef]
  5. Houska, C.R.; Warren, B.E. X-Ray Study of the Graphitization of Carbon Black. J. Appl. Phys. 1954, 25, 1503–1509. [Google Scholar]
  6. Iwashita, N.; Park, C.R.; Fujimoto, H.; Shiraishi, M.; Inagaki, M. Specification for a standard procedure of X-ray diffraction measurements on carbon materials. Carbon 2004, 42, 701–714. [Google Scholar] [CrossRef]
  7. Gao, A.; Su, C.; Luo, S.; Tong, Y.; Xu, L. Densification mechanism of polyacrylonitrile-based carbon fiber during heat treatment. J. Phys. Chem. Solids 2011, 72, 1159–1164. [Google Scholar] [CrossRef]
  8. Zhou, G.; Liu, Y.; He, L.; Guo, Q.; Ye, H. Microstructure difference between core and skin of T700 carbon fibers in heat-treated carbon/carbon composites. Carbon 2011, 49, 2883–2892. [Google Scholar] [CrossRef]
  9. Li, Z.Q.; Lu, C.J.; Xia, Z.P.; Zhou, Y.; Luo, Z. X-ray diffraction patterns of graphite and turbostratic carbon. Carbon 2007, 45, 1686–1695. [Google Scholar] [CrossRef]
  10. Montes-Morán, M.A.; Young, R.J. Raman spectroscopy study of HM carbon fibres: Effect of plasma treatment on the interfacial properties of single fibre/epoxy composites-Part I: Fibre characterization. Carbon 2002, 40, 845–855. [Google Scholar] [CrossRef]
  11. Yoon, S.H.; Korai, Y.; Mochia, I.; Yokogawa, K.; Fukuyama, S.; Yoshimura, M. Axial nano-scale microstructures in graphitized fibers inherited from liquid crystal mesophase pitch. Carbon 1996, 34, 83–88. [Google Scholar] [CrossRef]
  12. Dalas, E.; Vitoratos, E.; Sakkopoulos, S.; Malkaj, P. Polyaniline/zeolite as the cathode in a novel gel electrolyte primary dry cell. J. Power Sources 2018, 128, 319–325. [Google Scholar] [CrossRef]
  13. Yoon, H.J.; Choe, J.H.; Jin, H.J. Dispersion stability of polyelectrolyte-wrapped carbon black particles in a highly fluorinated solvent. Carbon Lett. 2018, 26, 25–30. [Google Scholar]
  14. Wutthiprom, J.; Phattharasupakun, N.; Sawangphruk, M. Turning Carbon Black to Hollow Carbon Nanospheres for Enhancing Charge Storage Capacities of LiMn2O4, LiCoO2, LiNiMnCoO2, and LiFePO4 Lithium-Ion Batteries. ACS Omega 2017, 2, 3730–3738. [Google Scholar] [CrossRef] [PubMed] [Green Version]
  15. Li, G.C.; Hu, J.J.; Li, G.R.; Ye, S.H.; Gao, X.P. Sulfur/activated-conductive carbon black composites as cathode materials for lithium/sulfur battery. J. Power Sources 2013, 240, 598–605. [Google Scholar] [CrossRef]
  16. Park, S.M.; Yasuda, E.; Park, Y.D. The influence of graphitic structure on oxidation reaction of carbon materials. J. Korean Ceram. Soc. 1996, 33, 816–822. [Google Scholar]
  17. Walker, P.L., Jr.; Rusinko, F., Jr.; Austin, L.G. Advances in Catalysis: Gas Reactions of Carbon; Academic Press: Cambridge, MA, USA, 1959; Volume 11, pp. 133–217. [Google Scholar]
  18. Kinoshita, K. Carbon: Electrochemical and physicochemical properties. Electrochim. Acta 1989, 34, 593–594. [Google Scholar]
  19. Heidenreich, R.D.; Hess, W.M.; Ban, L.L. A test object and criteria for high resolution electron microscopy. J. Appl. Crystallogr. 1968, 1, 1–19. [Google Scholar] [CrossRef]
  20. Oberlin, A. Application of dark-field electron microscopy to carbon study. Carbon 1979, 17, 7–20. [Google Scholar] [CrossRef]
  21. Schaeffer, W.D.; Smith, W.R.; Polley, M.H. Structure and Properties of carbon black. Ind. Eng. Chem. 1953, 45, 1721–1725. [Google Scholar] [CrossRef]
  22. Heer, W.A.D.; Ugarte, D. Carbon onions produced by heat treatment of carbon soot and their relation to the 217.5 nm interstellar absorption feature. Chem. Phys. Lett. 1993, 207, 480–486. [Google Scholar] [CrossRef]
  23. Lian, W.; Song, H.; Chen, X.; Li, L.; Huo, J.; Zhao, M.; Wang, G. The transformation of acetylene black into onion-like hollow carbon nanoparticles at 1000 °C using an iron catalyst. Carbon 2008, 46, 525–530. [Google Scholar] [CrossRef]
  24. Funken, K.H.; Pfert, E.L.; Hermes, M.; Hne, K.B.; Pohlmann, B. Oxidation rates of carbon black particles exposed to concentrated sunlight. Sol. Energy 1999, 65, 15–19. [Google Scholar] [CrossRef]
  25. Smith, W.R.; Polley, M.H. The Oxidation of Graphitized Carbon Black. J. Phys. Chem. 1956, 60, 689–691. [Google Scholar] [CrossRef]
  26. Jurkiewicz, K.; Pawlyta, M.; Burian, A. Structure of Carbon Materials Explored by Local Transmission Electron Microscopy and Global Powder Diffraction Probes. J. Carbon Res. 2018, 4, 68. [Google Scholar] [CrossRef] [Green Version]
  27. Meng, Z.; Yang, D.; Yan, Y. Study of carbon black oxidation behavior under different heating rates. J. Therm. Anal. Calorim. 2014, 118, 551–559. [Google Scholar] [CrossRef]
  28. Lee, S.M.; Roh, J.S. Pore development process according to burn-off of activated carbon black with CO2 gas. Fuller. Nanotub. Carbon Nanostruct. 2020, 28, 808–814. [Google Scholar] [CrossRef]
  29. Kang, D.S.; Lee, S.M.; Lee, S.H.; Roh, J.S. X-ray diffraction analysis of the crystallinity of phenolic resin-derived carbon as a function of the heating rate during the carbonization process. Carbon Lett. 2018, 27, 108–111. [Google Scholar]
  30. Lu, L.; Sahajwalla, V.; Kong, C.; Harris, D. Quantitative X-ray diffraction analysis and its application to various coals. Carbon 2001, 39, 1821–1833. [Google Scholar] [CrossRef]
  31. Manoj, B.; Kunjomana, A.G. Study of stacking structure of amorphous carbon by X-ray diffraction technique. Int. J. Electrochem. Sci. 2012, 7, 3127–3134. [Google Scholar]
  32. Aladekomo, J.B.; Bragg, R.H. Structural transformations induced in graphite by grinding: Analysis of 002 X-ray diffraction line profiles. Carbon 1990, 28, 897–906. [Google Scholar] [CrossRef]
  33. Shen, T.D.; Ge, W.Q.; Wang, K.Y.; Quan, M.X.; Wang, J.T.; Wei, W.D.; Koch, C.C. Structural disorder and phase transformation in graphite produced by ball milling. Nanostruct. Mater. 1996, 7, 393–399. [Google Scholar] [CrossRef]
  34. Lee, S.H.; Kang, D.S.; Lee, S.M.; Roh, J.S. X-ray diffraction analysis of the effect of ball milling time on crystallinity of milled polyacrylonitrile-based carbon fiber. Carbon Lett. 2018, 26, 11–17. [Google Scholar]
  35. Schossberger, F. Amorphous solids, small particles and thin surface films. Adv. X-ray Anal. 1957, 1, 73–99. [Google Scholar] [CrossRef]
  36. Biscoe, J.; Warren, B.E. An X-ray study of carbon black. J. Appl. Phys. 1942, 13, 364–371. [Google Scholar] [CrossRef]
  37. Kercher, A.K.; Nagle, D.C. Microstructural evolution during charcoal carbonization by X-ray diffraction analysis. Carbon 2003, 41, 15–27. [Google Scholar] [CrossRef]
  38. Sorokina, N.E.; Maksimova, N.V.; Avdeev, V.V. Anodic Oxidation of Graphite in 10 to 98% HNO3. Inorg. Mater. 2001, 37, 360–365. [Google Scholar] [CrossRef]
  39. Kaneko, K.; Ishii, C.; Ruike, M.; Kuwabara, H. Origin of superhigh surface area and microcrystalline graphitic structures of activated carbons. Carbon 1992, 30, 1075–1088. [Google Scholar] [CrossRef]
  40. Tan, P.H.; Hu, C.Y.; Li, F.; Bai, S.; Hou, P.X.; Cheng, H.M. Intensity and profile manifestation of resonant Raman behavior of carbon nanotubes. Carbon 2002, 40, 1131–1134. [Google Scholar] [CrossRef]
  41. Lee, H.M.; An, K.H.; Park, S.J.; Kim, B.J. Mesopore-rich activated carbons for electrical double-layer capacitors by optimal activation condition. Nanomaterials 2019, 9, 608. [Google Scholar] [CrossRef] [Green Version]
  42. Roh, J.S. Microstructural changes during activation process of isotopic carbon fibers using CO2 gas(I)-XRD study. Korean J. Mater. Res. 2003, 13, 742–748. [Google Scholar]
  43. Donnet, J.B.; Schultz, J.; Eckhardt, A. Etude de la microstructure D’UN noir de. Carbon 1968, 6, 781–788. [Google Scholar] [CrossRef]
  44. Zhu, W.; Miser, D.E.; Chan, W.G.; Hajaligol, M.R. HRTEM investigation of some commercially available furnace carbon blacks. Carbon 2004, 42, 1841–1845. [Google Scholar] [CrossRef]
  45. Morozov, I.; Lauke, B.; Heinrich, G. A new structural model of carbon black framework in rubbers. Comput. Mater. Sci. 2010, 47, 817–825. [Google Scholar] [CrossRef]
  46. Pichler, T.; Knupfer, M.; Golden, M.S.; Fink, J.; Cabioc’h, T. Electronic structure and optical properties of concentric-shell fullerenes from electron-energy-loss spectroscopy in transmission. Phys. Rev. B 2001, 63, 1–5. [Google Scholar] [CrossRef] [Green Version]
  47. Kamegawa, K.; Nishikubo, K.; Yoshida, H. Oxidative degradation of carbon blacks with nitric acid (I)—Changes in pore and crystallographic structures. Carbon 1998, 36, 433–441. [Google Scholar] [CrossRef]
  48. Sharma, A.; Kyotani, T.; Tomita, A. A new quantitative approach for microstructural analysis of coal char using HRTEM images. Fuel 1999, 78, 1203–1212. [Google Scholar] [CrossRef]
Figure 1. XRD pattern of raw carbon black and fitting of XRD patterns of carbon black using two Gaussian peaks (LDCC: less-developed crystalline carbon, MDCC: more-developed crystalline carbon).
Crystals 11 00153 g001
Figure 2. XRD patterns of activated carbon blacks according to burn-off (BO).
Crystals 11 00153 g002
Figure 3. Changes in structural parameters of activated carbon blacks. (a) Changes in amorphous and crystalline fractions, (b) Changes in the interplanar distance, and (c) Changes in crystallite size (Lc, La).
Crystals 11 00153 g003
Table 1. Manufacturer’s specifications of raw carbon blacks (Super-P).
ItemsSpecifications
Average Particle Size~40 nm by TEM
Ash content (600 °C)0.05%
Density0.16 g/cm3
pH10
Grit content > 45 microns5 ppm
Grit content > 20 microns25 ppm
BET Nitrogen surface area62 m2/g
Sulphur Content0.02%
CAS Number1333-86-4
Tap density (measured in this study)0.06 g/cm3
Table 2. Specific surface area and pore volume of activated carbon blacks obtained from BET [28].
Burn-off Ratio (%)Specific Surface Area (m²/g)Total Pore Volume (cm³/g)Micro Pore Volume (cm³/g)Vmicro pore/VTotal Pore (%)
0.061.40.1650.0106.1
7.2102.30.1760.02413.6
15.4184.20.2070.02110.1
30.4334.60.2730.03713.6
48.2590.50.6330.0447
59.9788.10.7660.0607.8
83.21107.61.3280.0554.1
Table 3. Structural parameters of activated carbon blacks obtained from XRD.
BO (%)Amorphous Fraction (%)Crystalline Fraction (%)LDCCMDCC10l
d002 (Å)Lc (Å)d002 (Å)Lc (Å)d10l (Å)La (Å)
0.016.483.63.9610.803.5428.032.0748.41
7.214.785.33.8212.623.5428.962.0746.82
15.413.386.73.8212.643.6029.472.0846.60
30.416.084.04.1818.683.5722.582.0746.31
48.223.976.14.3117.673.5719.222.0746.62
59.922.577.54.3020.223.5620.722.0740.13
83.231.268.84.2617.983.6120.922.0741.70
Table 4. Structural parameters of carbon black carbonized at 1000 °C obtained from XRD.
Super-PAmorphous
Fraction (%)
Crystalline
Fraction (%)
LDCCMDCC10l
d002 (Å)Lc (Å)d002 (Å)Lc (Å)d10l (Å)La (Å)
Raw16.483.63.9610.83.5428.032.0748.41
1000 °C
Carbonization
12.687.43.8412.113.5229.842.0752.6
Publisher’s Note: MDPI stays neutral with regard to jurisdictional claims in published maps and institutional affiliations.

