Article

Detection of Reproductive Hormones in Females by Using 1D Photonic Crystal-Based Simple Reconfigurable Biosensing Design

1
TH-PPM Group, Physics Department, Faculty of Science, Beni-Suef University, Beni Suef 62521, Egypt
2
Department of Physics and Material Science & Engineering, Jaypee Institute of Information Technology, Deemed to be University, Noida 201304, India
3
Faculty of applied science, Department of Physics, Umm Al-Qura University, Mecca 24382, Saudi Arabia
4
Physics Department, Dhahran Aljanoub, King Khalid University, Abha 61421, Saudi Arabia
5
Faculty of Technology and Education, Beni-Suef University, Beni Suef 62521, Egypt
*
Author to whom correspondence should be addressed.
Crystals 2021, 11(12), 1533; https://doi.org/10.3390/cryst11121533
Submission received: 4 November 2021 / Revised: 25 November 2021 / Accepted: 28 November 2021 / Published: 9 December 2021

Abstract

:
In this manuscript, we have explored the photonic biosensing application of the 1D photonic crystal (PhC) (AB)NCDC(AB)N, which is capable of detecting reproductive progesterone and estradiol hormones of different concentration levels in blood samples of females. The proposed structure is composed of an air cavity surrounded by two buffer layers of material MgF2, which is sandwiched between two identical 1D sub PhCs (AB)N. Both sub PhCs are made up of alternate layers of materials, SiO2 and Si, of period 5. MATLAB software has been used to obtain transmission characteristics of the structure corresponding TE wave, only with the help of the transfer matrix method. The mainstay of this research is focused on the dependence of the intensity and position of the defect mode inside the photonic bandgap with respect to reproductive hormone concentrations in blood samples, change in the thickness of the cavity region and change in angle of incidence corresponding to TE wave only. The proposed design shows high sensitivity of 98.92 nm/nmol/L and 96.58 nm/nmol/L when the cavity of a thickness of 340 nm is loaded with progesterone and estradiol hormones of concentrations of 80 nmol/L and 11 nmol/L, respectively, at an incident angle of 20°. Apart from sensitivity, other parameters such as quality factor and figure of merit have also been computed to gain deep insight about the sensing capabilities of the proposed design. These findings may pave the path for the design and development of various sensing devices capable of detecting gynecological problems pertaining to reproductive hormones in females. Thus, the simple design and excellent performance makes our design most efficient and suitable for sensing applications in industrial and biomedical fields.

1. Introduction

PhCs are the multilayer structures in which the refractive index of the constituent materials modulates periodically. PCs are classified into one-dimensional (1D), two-dimensional (2D) and three-dimensional (3D), depending upon the modulation of refractive index in one, two and three orthogonal directions [1,2,3]. Photonic structures have tremendous ability to control propagation of electromagnetic waves of different frequencies because of their diversified designs. PCs are characterized by their photonic band gaps (PBGs) due to the existence of multiple Bragg scattering of light at the interface separating two different media [4,5,6,7,8,9]. First time the pioneering work of PBGs was predicted by two scientists, Yablonovitch and John, in 1987; since then, the contribution of PhCs has revolutionized the field of optical engineering and technology [10,11]. Presently, PhC-based photonic devices, such as optical switches, reconfigurable biosensors, multimode biosensors, photovoltaic cells, solar cells and loss-free optical waveguides, are being used in engineering and technological applications [12,13,14], which makes PhCs one of the hot research fields for photonics, electromagnetic, biological and biomedical engineering [15,16,17,18]. The introduction of the defect layer between PhC results in the localization of photons by means of a single transmission peak called the resonant mode inside PBG, because of a break in the periodicity of the structures [19,20,21,22,23,24,25]. This resonant mode allows the incident radiation of resonant wavelengths to pass through the structure. Any minute change in the refractive index of the defect layer region due to change in the concentration of the samples to be investigated causes a corresponding change in the position of the resonant mode inside PBG, because of the strong confinement of electric field inside defect layer region. This is the basic principle behind the sensing and detection mechanism of any high-performance biosensor working in the photonic domain. Therefore, 1D PhCs with defects can be effectively used as an optical refractive index sensing device. Moreover, 1D PhC-based biosensors are simple in design and have low-cost fabrication techniques in contrast to the biosensors based on 2D and 3D PhCs. All the above-mentioned properties of 1D photonic biosensors attract the significant attention of various research groups worldwide, who are working in fields such as biological technology, food industry, safety, security, environment, chemical engineering, agriculture and cosmetic [26,27].
There are varieties of biosensors such as nano-mechanical, electrical, acoustic, electrochemical and magnetic, which work on the conventional techniques of diagnosis. For example, an analytical biosensing device called an immunosensor based on reusable surface plasmon resonance (SPR) has been suggested by Makaravicute et al. for direct detection of human growth hormone [28], and antibody detection against these hormones by applying electrochemical techniques on the surface of SPR-chip [29]. These biosensors are available in the market and are widely used to detect chemical or biological properties of samples, such as the level of glucose in urine, concentration of creatinine in blood serum, brain tissues such as oligodendroglioma cells and brain lesions. In conventional biosensing techniques, the biosensor has to be immersed into the sample, called analyte, contrary to the photonic biosensors in which the sensing process is triggered by infiltrating only the cavity region with analyte. The photonic biosensing technology has several advantages such as being easy to handle, single step detection and accuracy in results over conventional biosensing techniques [28,29,30]. Moreover, any photonic biosensor comprises five parts: the sample which is to be investigated is called as analyte, which is the first part. The bioreceptor is the second part, which is used for sensing the analyte. The third part is the transducer mechanism to produce a measurable signal from the information of the bioreceptor. One of the essential requirements is an electronic circuit which converts the measurable signals from transducer into a desirable digital form. This is the fourth part. Finally, a software and hardware combination is used to display the results of the biosensing process [30,31,32,33,34,35,36].
Motivated by the aforementioned piece of excellent research work [21,22,23,24,25,26,27,28,29,30,31,32,33,34,35,36] in this paper, we propose a 1D photonic crystal (PhC) capable of sensing minute change in the refractive index of blood samples containing progesterone and estradiol reproductive hormones of different concentration levels in women. This design measures the shift in position of the defect mode inside PBG of the proposed structure depending upon the change in the refractive index of blood samples containing progesterone and estradiol reproductive hormones of different concentration levels in women. The comparison between the positions of defect modes due to the change in the refractive index of blood samples with zero and without zero concentration levels will give us the information about the most important female reproductive hormones. To the best of our knowledge 1D PC with defect has been rarely used for detecting progesterone and estradiol reproductive hormones of different concentration levels in women using the cavity which is composed of three material layers. The organization of the proposed work is as follows: Section 2 presents the theoretical formulation of the proposed problem. Results and discussions of the proposed work are presented in Section 3. Finally, conclusions are presented in Section 4.

2. Theoretical Formulation of Proposed Design

The proposed 1D photonic biosensor (AB)NCDC(AB)N is composed of two identical 1D PhCs (AB)N whose inner sides are coated with a layer of material C. These two modified 1D PhCs are separated by a layer D of air, which will be loaded with blood samples of different progesterone and estradiol hormone concentrations, as shown in Figure 1.
The plane electromagnetic waves are allowed to enter into the structure at an incident angle θ with respect to normal, which is the z-axis in our case. Both 1D PCs are composed of alternate layers of material A and B of period number N. The refractive indices and thicknesses of layers A, B, C and D are nA, nB, nC, nD, dA, dB, dC and dD, respectively. The cavity region D is filled with various blood samples in which reproductive hormones have to be detected as per the data given in Figure 2. The theoretical results have been obtained with the help of MATLAB software based on the transfer matrix method (TMM) [37]. The interaction between the incident electromagnetic radiation and the proposed structure is described by means of transfer total matrix as under
M = M 11 M 12 M 21 M 22 = ( m A m B ) N m C m D m C ( m A m B ) N
where M11, M12, M21 and M22 represent the elements of total transfer matrix of whole structure. The characteristic matrix of layers A, B, C and D of materials SiO2, Si, MgF2 and air, respectively, are described below.
m A = cos γ A i sin γ A p A i p A sin γ A cos γ A
m B = cos γ B i sin γ B p B i p B sin γ B cos γ B
m C = cos γ C i sin γ C p C i p C sin γ C cos γ C
m D = cos γ D i sin γ D p D i p D sin γ D cos γ D
The phase difference γ associated with layers A, B, C and D are defined as γ A = 2 π n A d A cos θ A λ 0 , γ B = 2 π n B d B cos θ B λ 0 , γ C = 2 π n C d C cos θ C λ 0 and γ D = 2 π n D d D cos θ D λ 0 .
Here, θ A , θ B , θ C and θ D are ray angles inside layers A, B, C and D, respectively. The values of p associated with layers A, B, C and D are given as p A = n A cos θ A , p B = n B cos θ B , p C = n C cos θ C and p D = n D cos θ D , respectively, corresponding to TE wave.
The transmission coefficient of the proposed design (AB)NCDC(AB)N based on Chebychev polynomials of the second kind can be calculated as
t = 2 p 0 ( M 11 + M 12 p f ) p 0 + ( M 21 + M 22 p f )
Here, the values of p corresponding to TE wave inside incident and exit media are defined as p 0 = n 0 cos θ and p f = n f cos θ f , respectively. Finally, transmittance of the proposed 1D photonic biosensor design (AB)NCDC(AB)N can be obtained as
T = p f p 0 t 2

3. Result and Discussions

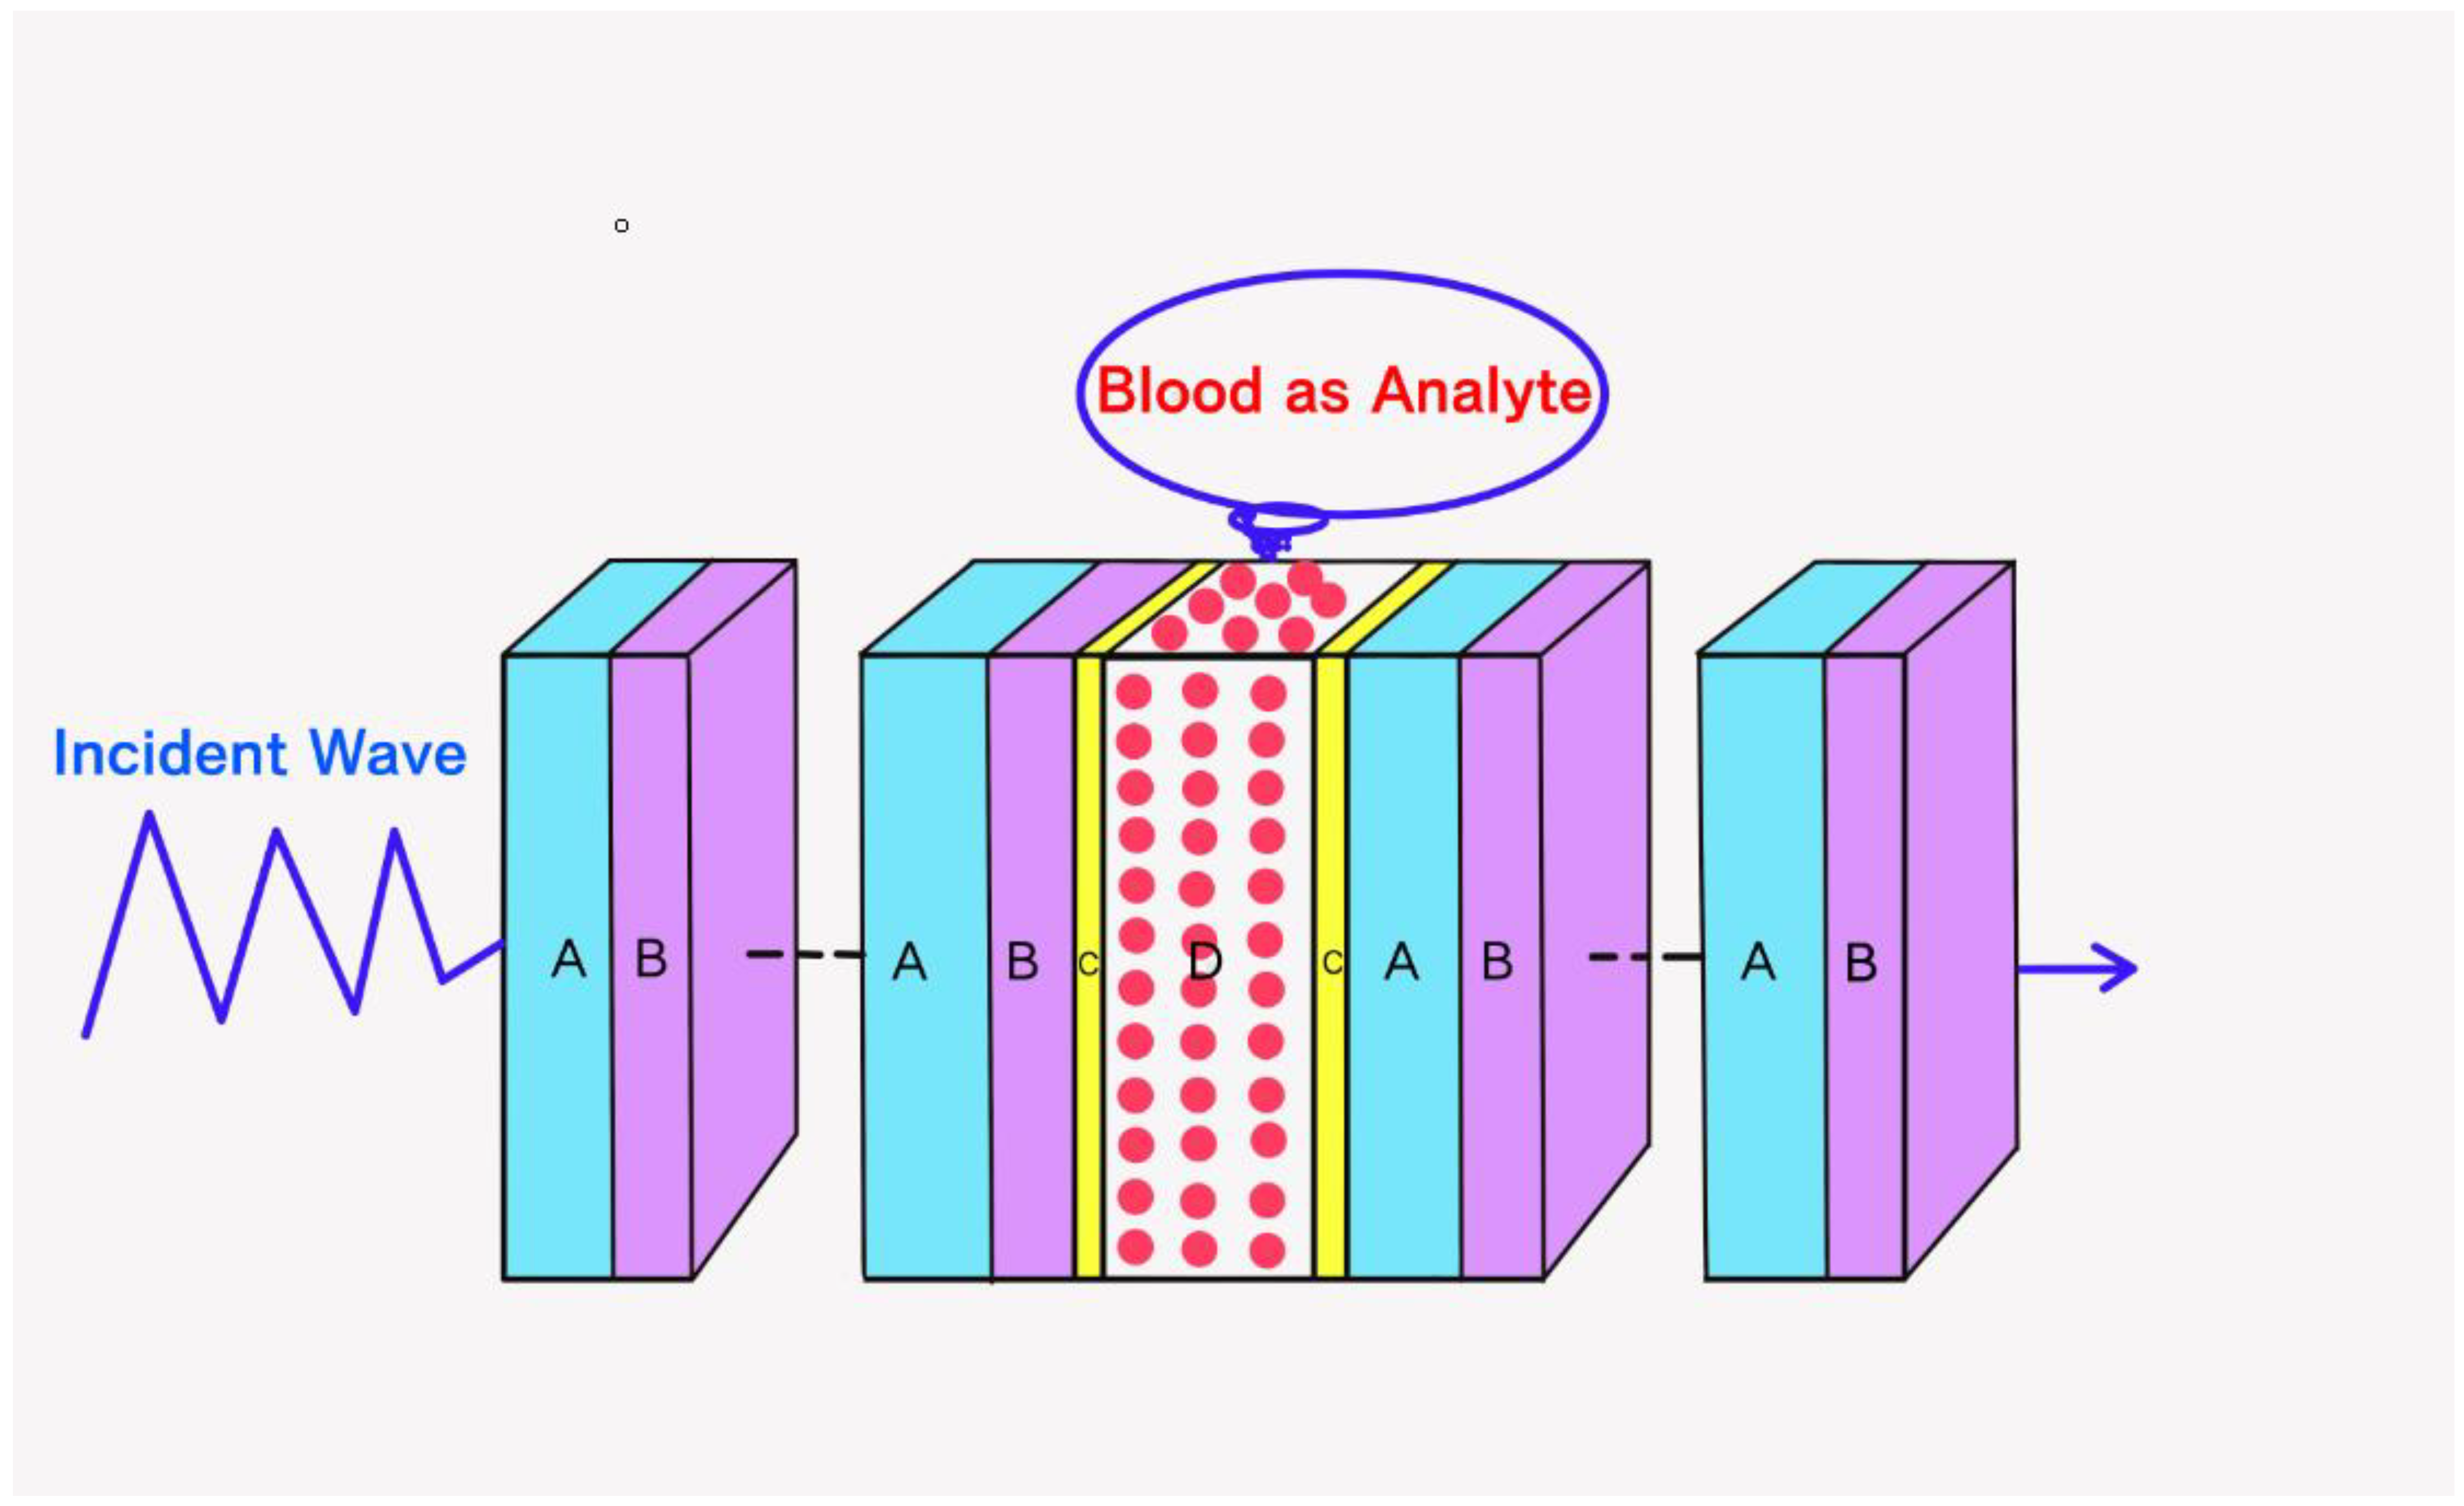
3.1. Structural Design and Working Principle

The proposed 1D PhC biosensor (AB)NCDC(AB)N as depicted in Figure 1 is composed of two identical 1D PhCs (AB)N. The inner sides of both the PhCs are coated with layer C of material MgF2 and are separated by a layer D of air. The purpose of coating both sides of 1D PhCs with material MgF2 is to prevent direct exposure of Si material layer with air and water. It will overcome the possibility of oxidation of silicon. The blood samples of a female patient in which reproductive hormones are to be detected are poured inside the cavity layer D of air, which is surrounded by buffer layers of MgF2. The alphabets A and B in both 1D PhCs have been used to represent SiO2 and Si material layers, respectively. In this work, the period number (N) of the structure has been fixed to 5. The whole structure has been immersed in air. The optimized thickness of layers A, B, C and D are dA = 380 nm, dB = 260 nm, dC = 20 nm and dD = 360 nm, respectively, which yields wider PBG with high value of sensitivity of the proposed design. The refractive indices of layers A, B and C of materials SiO2, Si and MgF2 are taken to be nA = 1.45, nB = 3.3 and nC = 1.35, respectively, in the region of investigation 600 nm to 750 nm.
The proposed biosensor works on the principle to detect minute change in the refractive index of blood samples containing progesterone and estradiol reproductive hormones of different concentrations. This minute change in refractive index of blood samples is sensed by means of the displacement of the defect mode inside the PBG of the proposed structure.

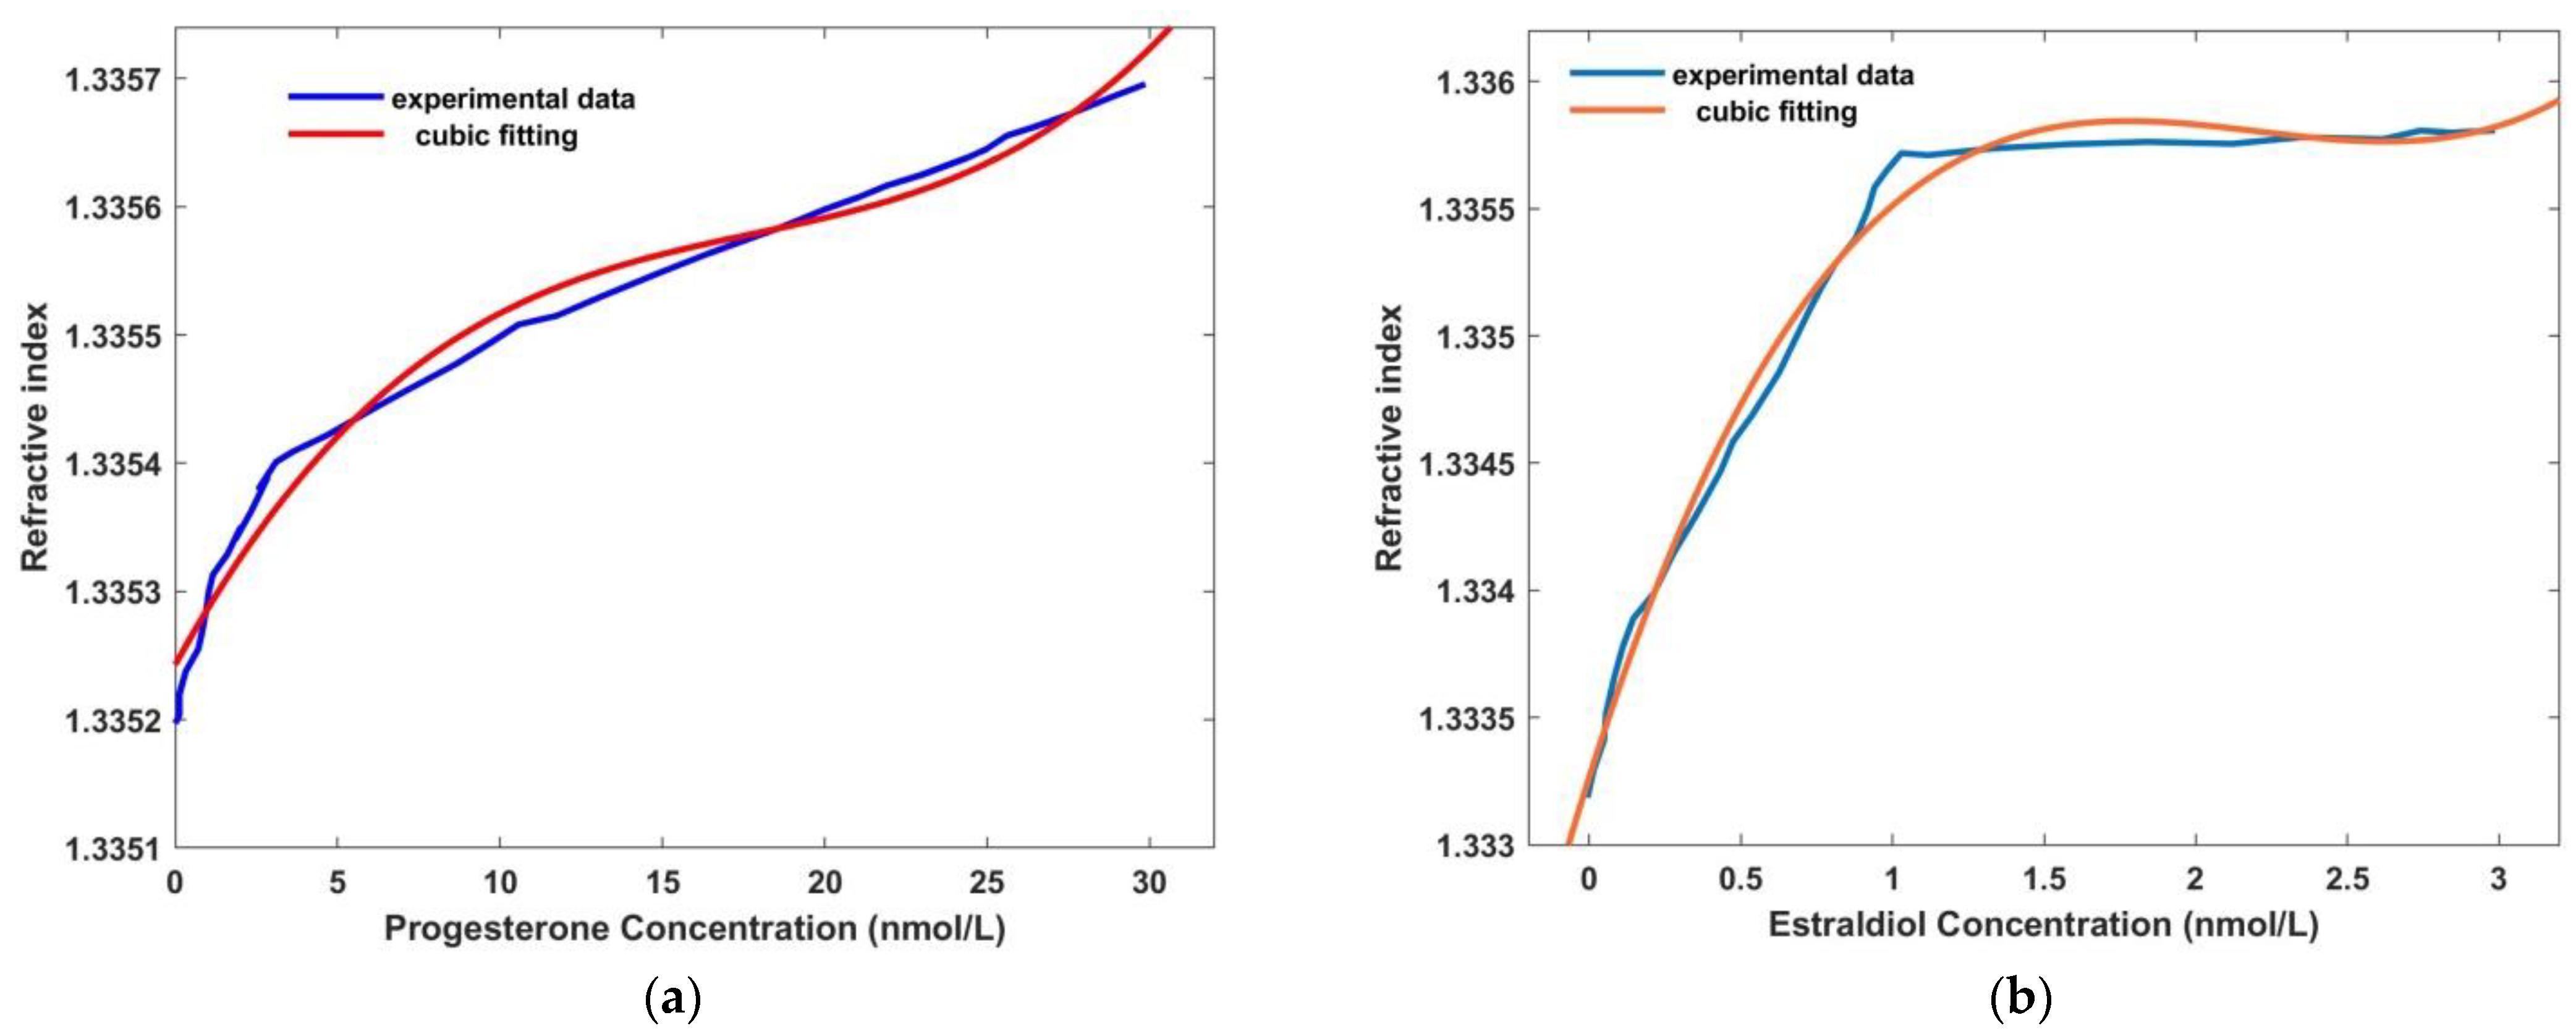
3.2. Determination of Refractive Index of Progesterone and Estradiol Reproductive Hormones along with Their Significance

In this section, we have described how to obtain the refractive index of blood samples containing progesterone and estradiol reproductive hormones of different concentration levels in females [38,39,40]. Progesterone is a type of steroid hormone which needs to be investigated during menstrual cycle disorders, as well as early stages of pregnancy. The role of progesterone in females is more significant during the reproductive process, such as menstruation and parturition. This hormone has the ability to release the egg from the ovary of women when it is fertilized by sperm. Moreover, the production of milk in mammary glands located inside breasts of females begins when progesterone hormones combine with other hormones. The progesterone is also responsible for the developing fetus in uterus during late pregnancy. Moreover, estradiol is a type of estrogen which is considered to be a female sex hormone. Its main function is to mature and then maintain the reproductive system. During the menstrual cycle, an increase in the estradiol level causes the maturation and release of the eggs. These hormones are also responsible for the thickening of the uterus lining from implantation of the fertilized egg. This hormone is also highly essential in males’ sexual function, which includes libido, erectile function and spermatogenesis. The refractive index of progesterone and estradiol hormones depending upon their concentration levels in blood samples has been theoretically obtained with the help of expressions 4 and 5, respectively, as given below.
n p = 4.2882 × 10 8 c 3 2.2847 × 10 6 c 2 + 4.5962 × 10 5 c + 1.3352
n e = 2.678 × 10 4 c 3 1.7684 × 10 3 c 2 + 3.7489 × 10 3 c + 1.3333
Here, c is the concentration level of progesterone and estradiol hormones in blood samples in the unit of nmol/L. We have used experimentally obtained refractive index values of progesterone and estradiol hormones, which have been obtained with the help of the Atago PAL-RI portable refractometer. In order to obtain more realistic results, the concentration-dependent refractive index values of progesterone and estradiol hormones obtained theoretically with the help of relations 4 and 5, respectively, have been synchronized with experimentally obtained refractive index values of progesterone and estradiol hormones. For this purpose, cubic curve fitting has been applied on the theoretically obtained refractive index values of progesterone and estradiol hormones, with the help of relations 4 and 5, respectively. The theoretical cubic curve fitting data along with experimentally obtained data of refractive index values of progesterone and estradiol hormones are plotted in Figure 2a and 2b, respectively.
Figure 2a,b show the refractive index variation of cubic curve fitting and experimental data dependent on concentration level of progesterone and estradiol hormones in blood sample, respectively. The refractive index of progesterone hormones varies between 1.3352 to 1.3358 as its concentration level in blood samples changes from 0 to 31 nmol/L, as shown in Figure 2a. Moreover, the refractive index values of estradiol hormone swiftly changes from 1.3332 to 1.3359 under the influence of its concentration level in blood samples from 0 to 1.3 nmol/L. Further increase in the concentration level of estradiol hormone from 1.3 nmol/L to 3.1 nmol/L causes a little change in the refractive index value of the estradiol hormone, which varies between 1.3355 and 1.3359, as depicted in Figure 2b. From Figure 2a,b, it can be clearly seen that the cubic curve fitting data obtained theoretically by using relations 4 and 5 are well in agreement with the experimentally obtained data from the portable refractometer Atago PAL-RI.

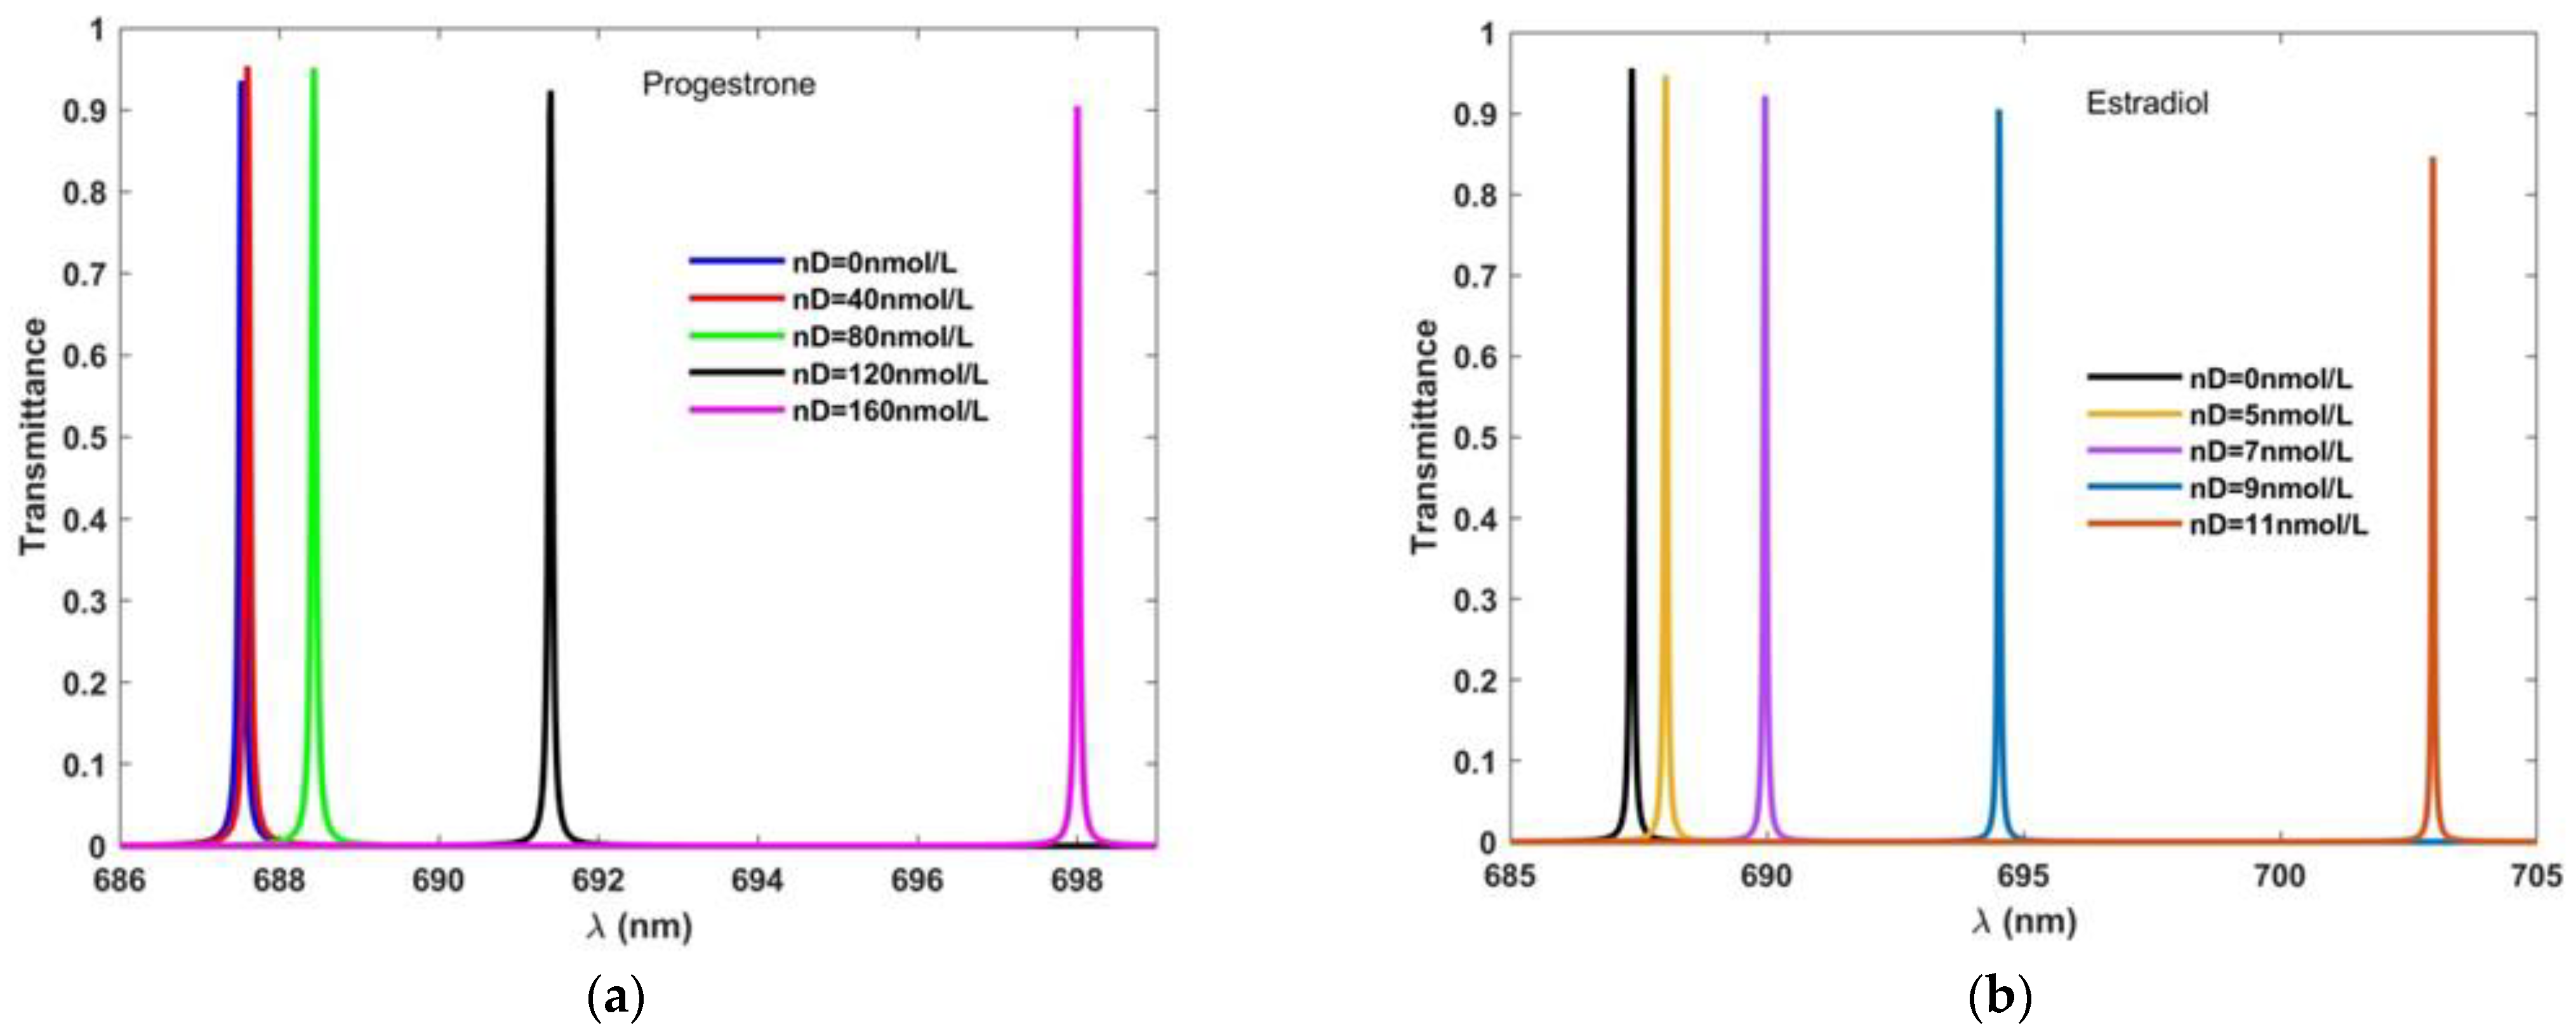
3.3. Effect of Change in Concentration of Progesterone and Estradiol in Blood Samples

First, we examine transmission characteristics of 1D PhC (AB)5CDC(AB)5 of structural parameters as defined in Section 3.1 at normal incidence with the help of TMM. For this purpose, we have poured blood samples containing progesterone and estradiol hormones of a concentration of zero one by one into the defect layer cavity region of air. The transmission spectra of 1D PhC (AB)5CDC(AB)5 with progesterone and estradiol blood samples of zero concentration are plotted in Figure 3.
It shows two defect modes inside photonic band gap of transmission 92.23% and 92.30% located at 711.2 nm and 711.4 nm corresponding to estradiol and progesterone blood samples, respectively. The appearance of these two distinguishable defect modes is due to minute change in concentration-dependent effective refractive indices of progesterone and estradiol blood samples which are governed by relations 4 and 5, respectively. The effective refractive indices of estradiol and progesterone blood samples of zero concentration are 1.3333 and 1.3352, respectively. The standing wave concept of laser cavity can also be applied to understand the presence of defect mode inside PBG, as noticed in Figure 3. According to the standing wave concept of laser cavity, only those wavelengths inside the cavity can come out, which satisfy the relation δ = = neffL. Here, letter/symbols δ, k, λ, neff and L are used to represent optical path difference, an integer, wavelength inside cavity, effective refractive index and length of the cavity region, respectively.
Next, we investigated the effect of different blood samples with progesterone hormone of concentrations of 0 nmol/L, 40 nmol/L, 80 nmol/L, 120 nmol/L and 160 nmol/L and estradiol hormone of concentration 0 nmol/L, 5 nmol/L, 7 nmol/L, 9 nmol/L and 11 nmol/L on the position of defect mode inside PBG, as shown in Figure 4a and 4b, respectively.
Figure 4a shows that as the concentration of progesterone hormone in blood sample increases from 0 nmol/L to 160 nmol/L insteps of 40 nmol/L, the defect mode shift towards higher wavelength side and also its full width half maximum increases. The similar findings can be drawn in Figure 4b which shows transmission spectra for blood samples with estradiol hormone of concentrations of 0 nmol/L, 5 nmol/L, 7 nmol/L, 9 nmol/L and 11 nmol/L.

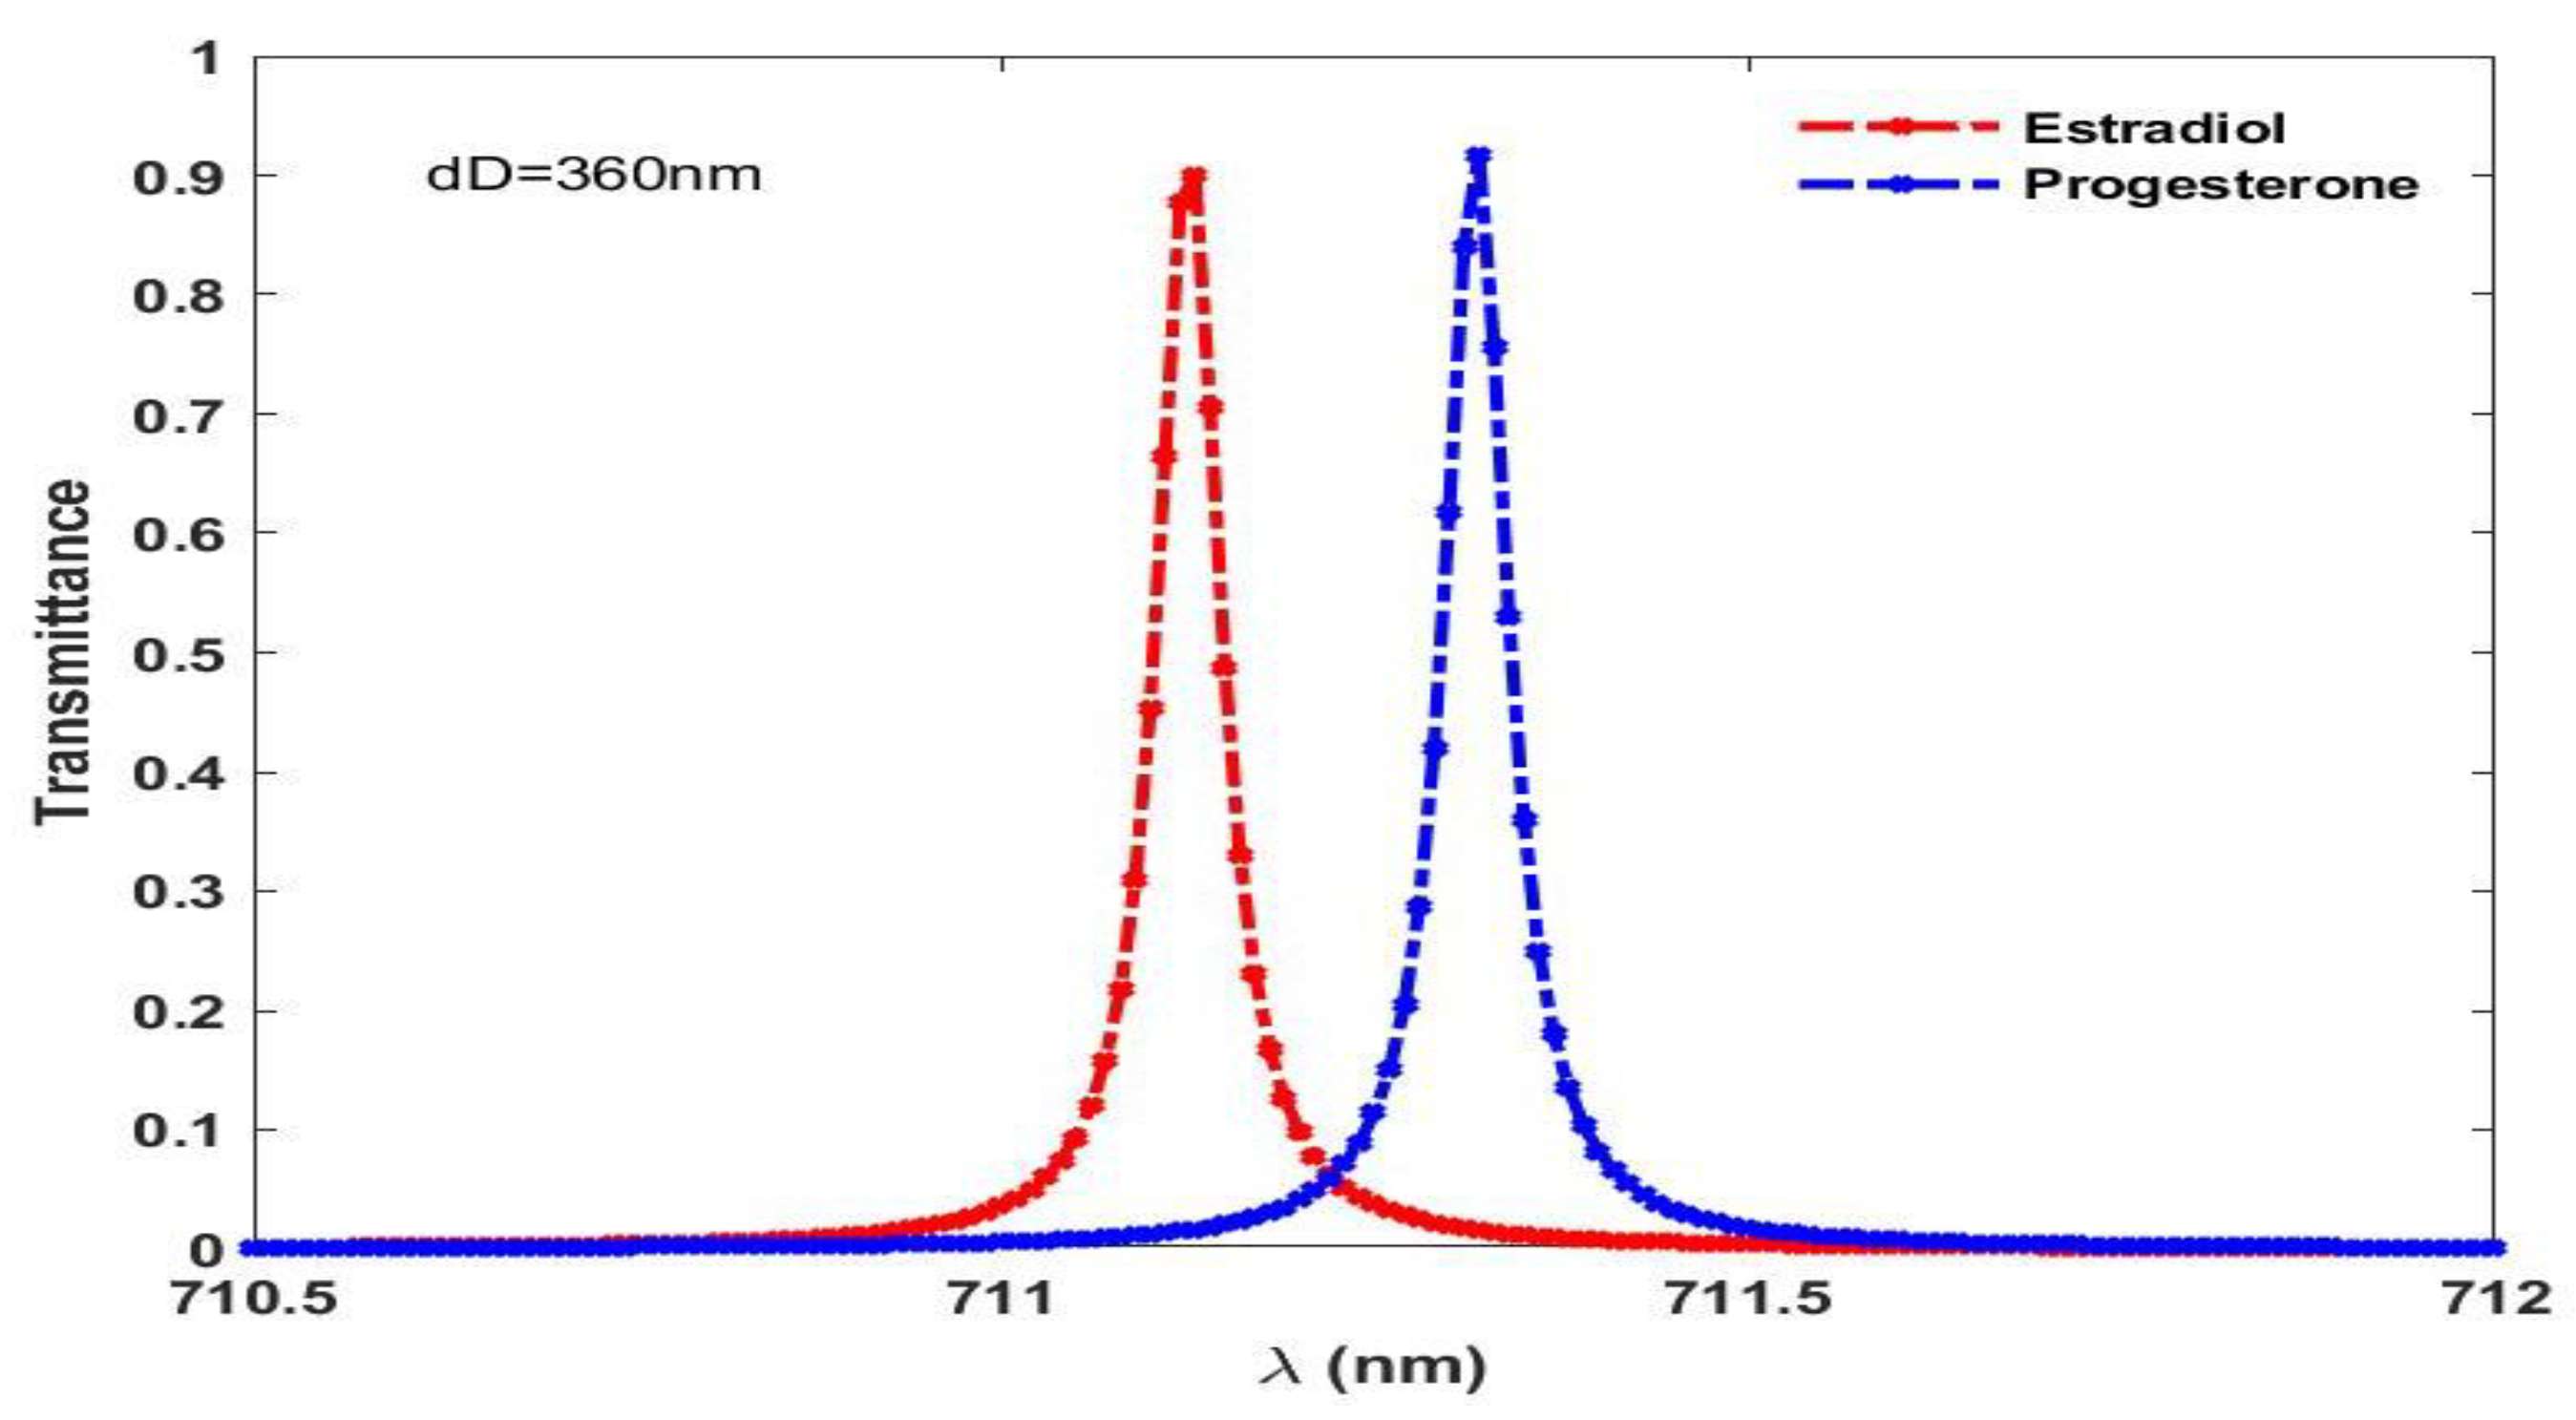
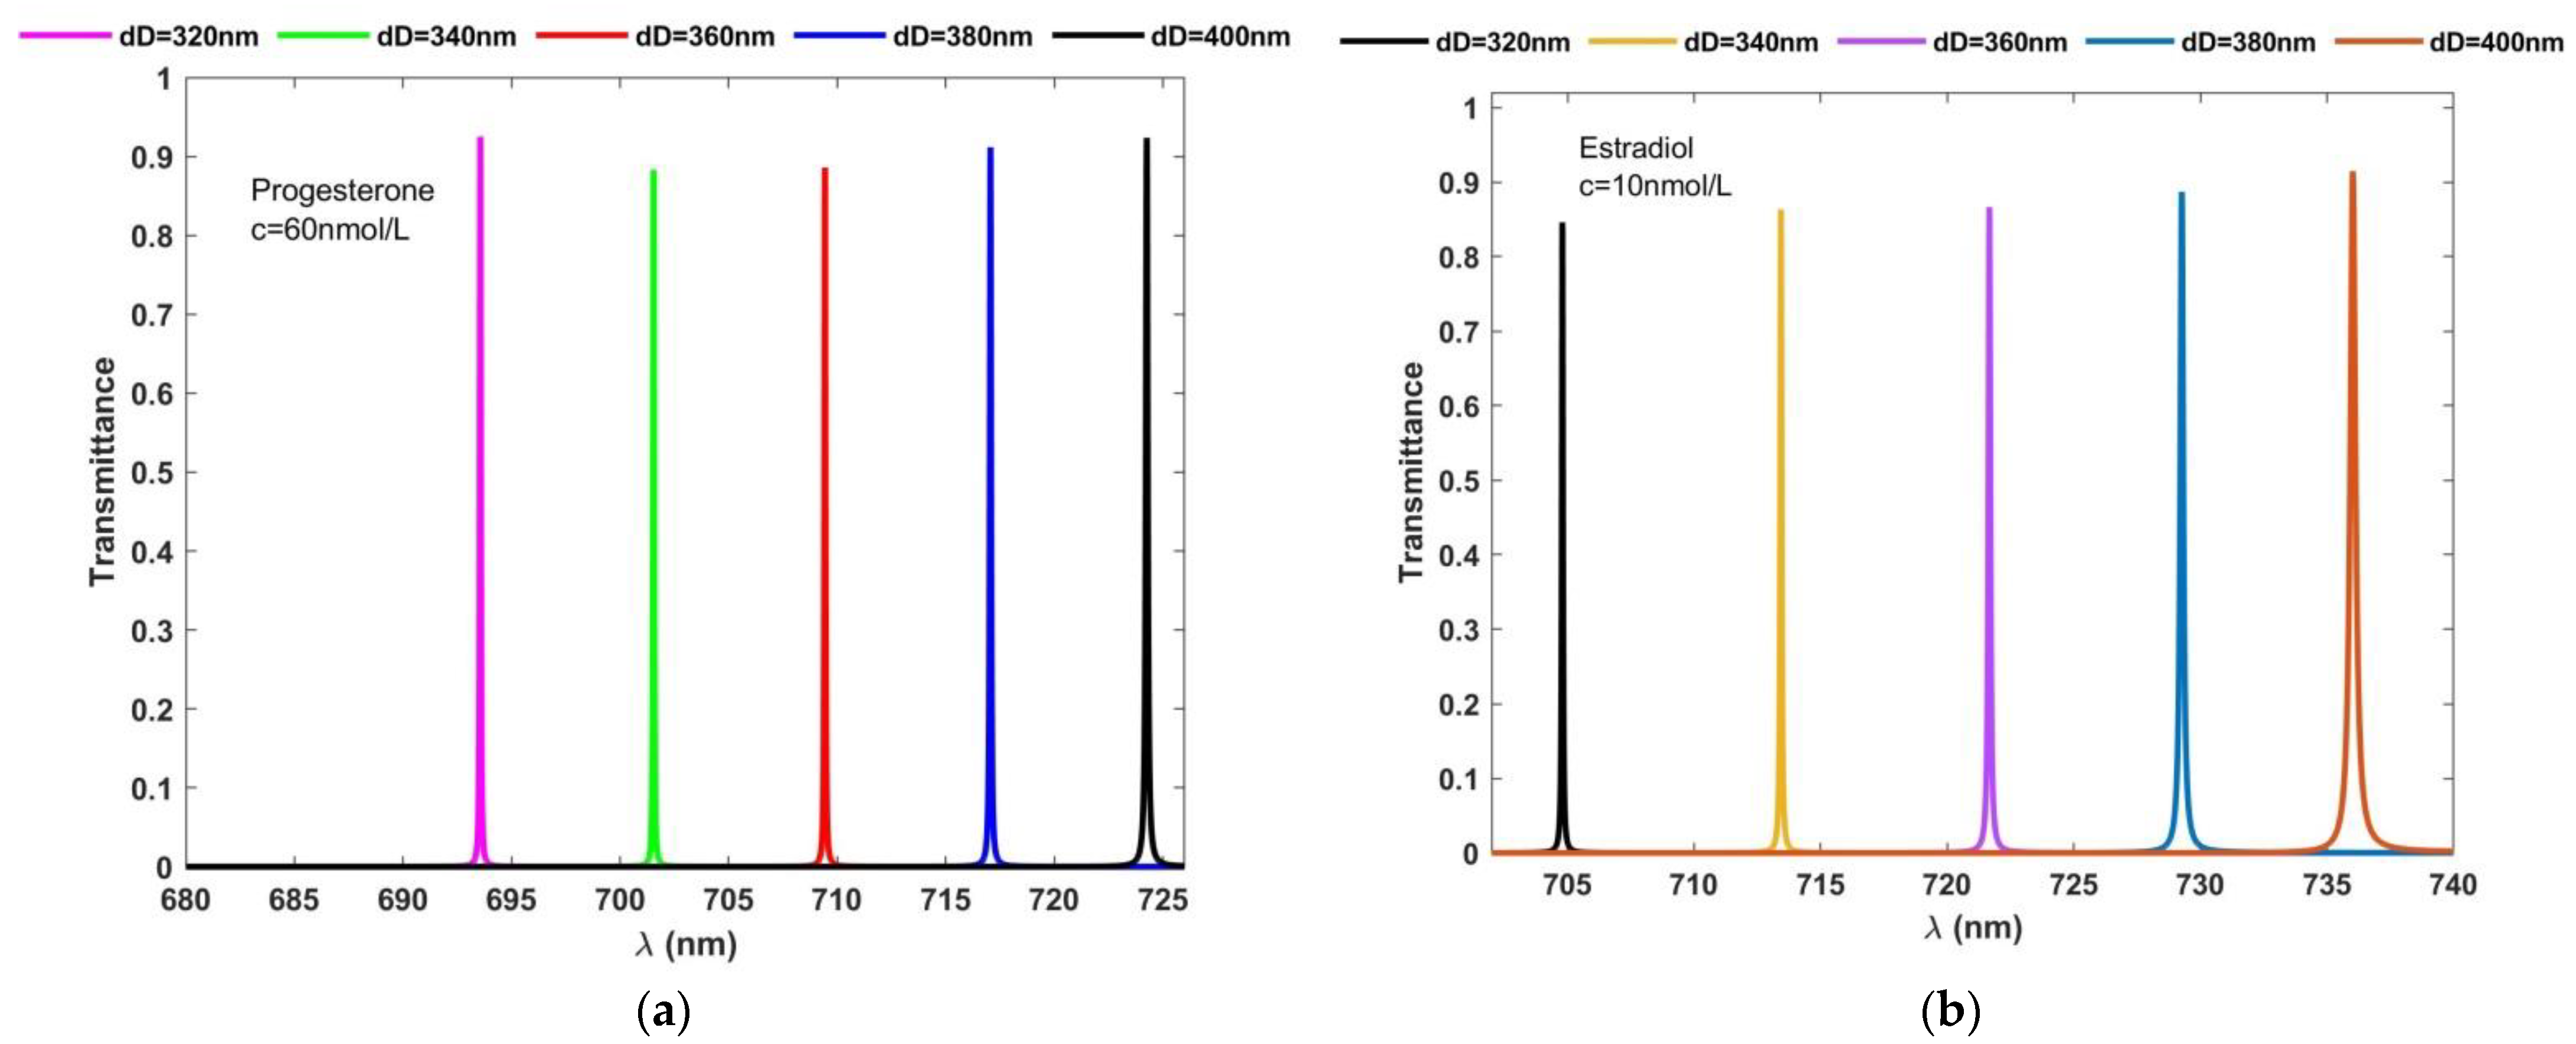
3.4. Effect of Change in Defect Layer Thickness on the Performance of the Design

Furthermore, the effect of change in the thickness of cavity loaded with separate blood samples containing progesterone and estradiol hormones of concentrations of 60 nmol/L and 10 nmol/L on the performance of the proposed design has been studied with the help of Figure 5a and 5b, respectively.
Figure 5a,b show the effect of change in the thickness of cavity region from 320 nm to 400 nm insteps of 20 nm when the cavity is loaded with blood samples containing progesteroneand estradiol hormones of concentrations of 60 nmol/L and 10 nmol/L, respectively. The evenly spaced defect modes of transmittance of more than 90% and 89% for progesterone and estradiol, respectively, have been found in Figure 5a,b due to the change in the thickness of defect layer (dD) from 320 nm to 400 nm insteps of 20 nm, corresponding to blood samples containing progesterone and estradiol hormones of concentrations of 60 nmol/L and 10 nmol/L, respectively. The 89% transmittance of the defect mode inside PBG is relatively good for designing a photonic biosensor. There is one common observation in Figure 5a,b, which is that the increase in the thickness of defect layer region causes the increase in the FWHM of the corresponding defect mode. The FWHM of the defect mode modulates between lowest to highest value, corresponding to a change in the thickness of defect layer from 320 nm to 400 nm, respectively.

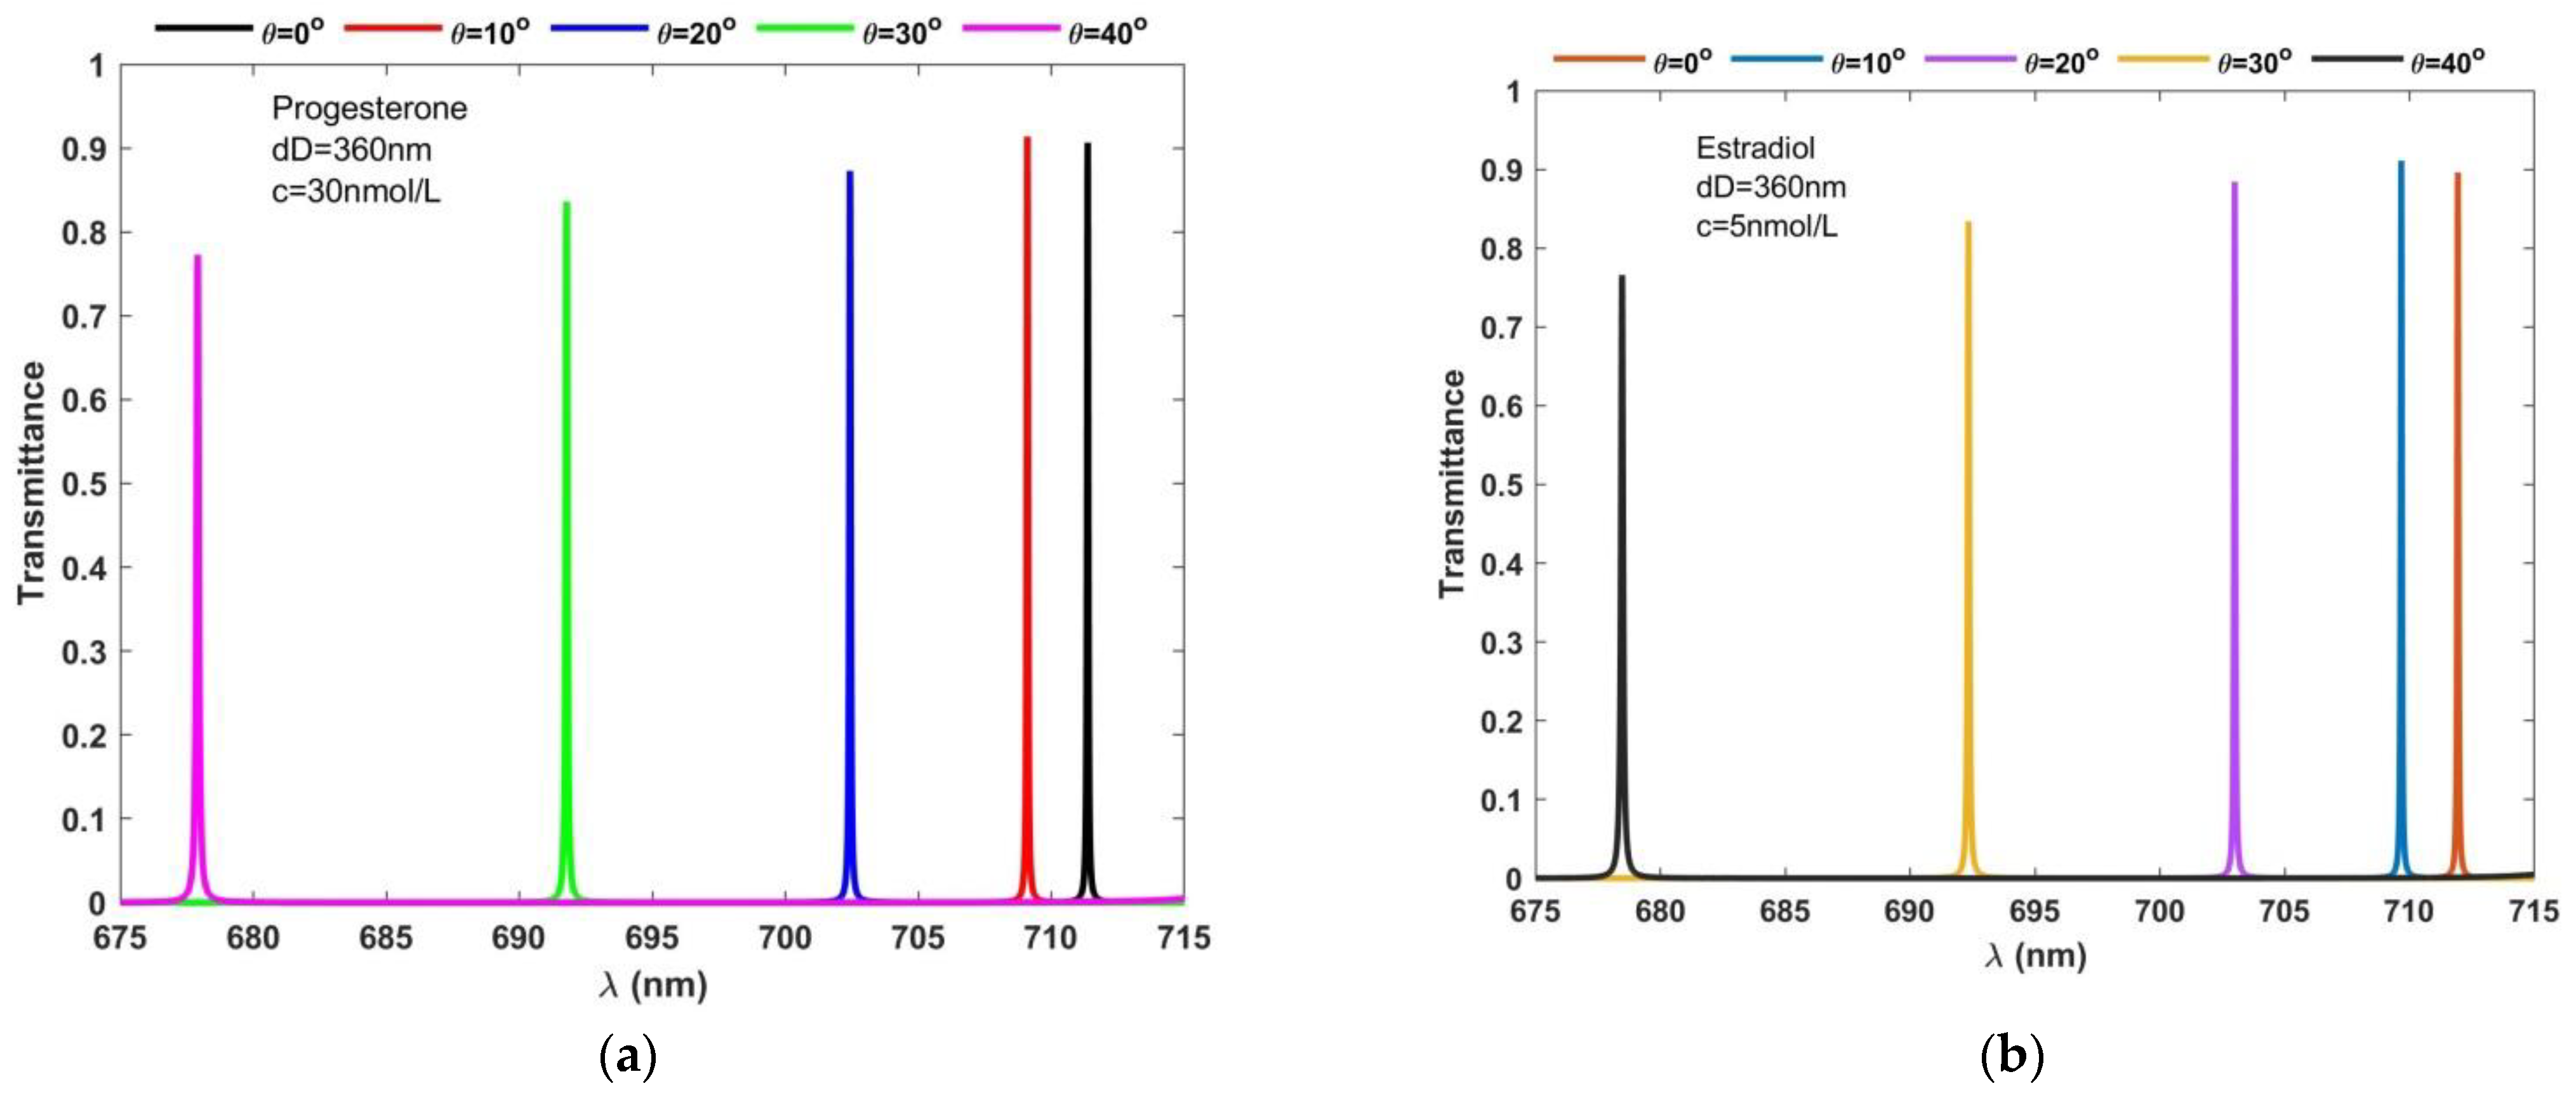
3.5. Effect of Change in Angle of Incidencecorresponding to TE Polarized Electromagnetic Wave on the Performance of the Design

In this section, we have studied the effect of change in the angle of incidence from 0° to 40° in steps of 10° corresponding to the TE polarized electromagnetic wave only, on the performance of the proposed structure. In order to find the effect of the angle of incidence on the performance of the design, we have loaded the air cavity with blood samples containing progesterone and estradiol hormones of concentrations of 30 nmol/L and 3 nmol/L, respectively. The thickness of the air cavity has been fixed to 360 nm for this purpose. The results are plotted in Figure 6a,b, which show the incident angle-dependent transmittance of the proposed design loaded with blood samples containing progesterone and estradiol hormones of concentrations of 30 nmol/L and 3 nmol/L, respectively.
It has been shown in Figure 6 that the increase in angle of incidence from 0° to 40° causes the decrease in the central wavelength and intensity of defect mode in transmission spectra. Moreover, due to an increase in the incident angle, the FWHM of the defect mode also increases. As the angle of incidence of TE polarized wave increases, the geometrical path travelled by the light wave inside the defect layer loaded with blood samples containing progesterone and estradiol hormones also increases. This results in a much better interaction between light wave and blood samples, and hence improves the performance of the proposed biosensing structure. Thus, the variation in the angle of incidence can be used to increase or decrease the intensity of transmission of defect mode of blood samples containing progesterone and estradiol hormones of concentrations 30 nmol/L and 3 nmol/L, respectively. The variation in angle of incidence from 0° to 40° results in corresponding variation in the intensity of the defect mode. The defect mode intensity modulates between maximum of 90.3% at θ = 10° and minimum of 79.92% at θ = 40° when the cavity is loaded with progesterone samples, as shown in Figure 6a. Under the influence of the estradiol sample, the intensity of the defect mode varies between a maximum of 89.22% at θ = 10° and a minimum of 78.68% θ = 40°, as shown in Figure 6b. Thus, the variation in angle of incidence can be used to improve the performance of any biosensor design similar to the findings of Arafa et al. [33,34].

3.6. Performance Evaluation of the Proposed Design

For evaluating the performance and efficiency of the proposed design, we have taken sensitivity (S), quality factor (Q) and figure of merit (FOM) into our consideration because these are most common parameters used to characterize the performance of any biosensor [41,42,43,44,45,46,47,48]. The sensitivity is the ratio of the resonant wavelength shift of the defect mode (Δλ) due to a small change in the refractive index of the analyte (Δn) as defined below
S = Δ λ Δ n
For obtaining accuracy in the results of biosensing measurements, the quality factor of the biosensor should be as high as possible. The resonant wavelength shifts due to a small change in the refractive index of the analyte helps in finding the expression of the quality factor with the help of the approximated Lorentzian function, and it is defined as
Q = λ r e s o n a n t F W H M
where λresonant and FWHM are used to represent resonant wavelength of the defect mode which passes through the 1D defective PC and its full width half maximum.
The figure of merit (FOM) of biosensor design is defined as the ratio of sensitivity to FWHM of defect mode inside the cavity. FOM can be obtained by using following relation
F O M = S F W H M
For evaluating the performance of the design suitable to investigate progesterone and estradiol hormones in blood samples, we have summarized S, Q and FOM values depending upon various parameters of the design in Table 1, Table 2, Table 3 and Table 4. Table 1 and Table 2 summarize the results corresponding to progesterone hormones with different thicknesses of defect layer region and incident angles. In Table 1, we have taken the defect layer thickness as 280 nm and the angle of incidence as 0°, whereas Table 2 shows the S, Q and FOM values of the design with the defect layer thickness as 340 nm and angle of incidence as 20°. As it can be observed from Table 1 and Table 2, under the selected structural parameters at both normal and oblique incidence, the sensitivity of design varies from 55.55 nm/nmol/L to 77.24 nm/nmol/L and 97.08 nm/nmol/L to 95.19 nm/nmol/L, respectively, corresponding to blood sample concentration of 0 to 200 nm/L. The Q factor varies from 1.13 × 10⁴ to 1.4 × 10⁴ and 1.4 × 10⁴ to 2.4 × 10⁴ when the concentration of the sample varies from 0 to 200 nm/L at normal and oblique incidence, respectively. On the other hand, the FOM varies from 0.9 × 10³ to 1.5 × 10³ and 1.9 × 10³ to 3.1 × 10³ in accordance with blood sample concentrations, as per the data given in Table 1 and Table 2, respectively. Thus, a higher hormone concentration in the blood sample improves the performance of the structure by improving the values of S, Q and FOM of the structure loaded with the sample under investigation for given thickness of the defect layer at both normal incidence and oblique incidence. Similar findings have been drawn for blood samples containing estradiol hormones of concentrations of 0 to 11 nm/L at both normal and oblique incidence, as per the data summarized in Table 3, Table 4 and Table 5 below, respectively. Here, Table 3 and Table 4 summarize the results corresponding to the defect layer of thickness 280 nm and 340 nm at an angle of incidence of 0°, whereas Table 5 contains results of the structure of defect layer of thickness 340 nm at θ = 20°. In Table 1, Table 2, Table 3, Table 4 and Table 5, the symbol λ reson. has been used to represent resonant wavelength of the defect mode inside PBG.

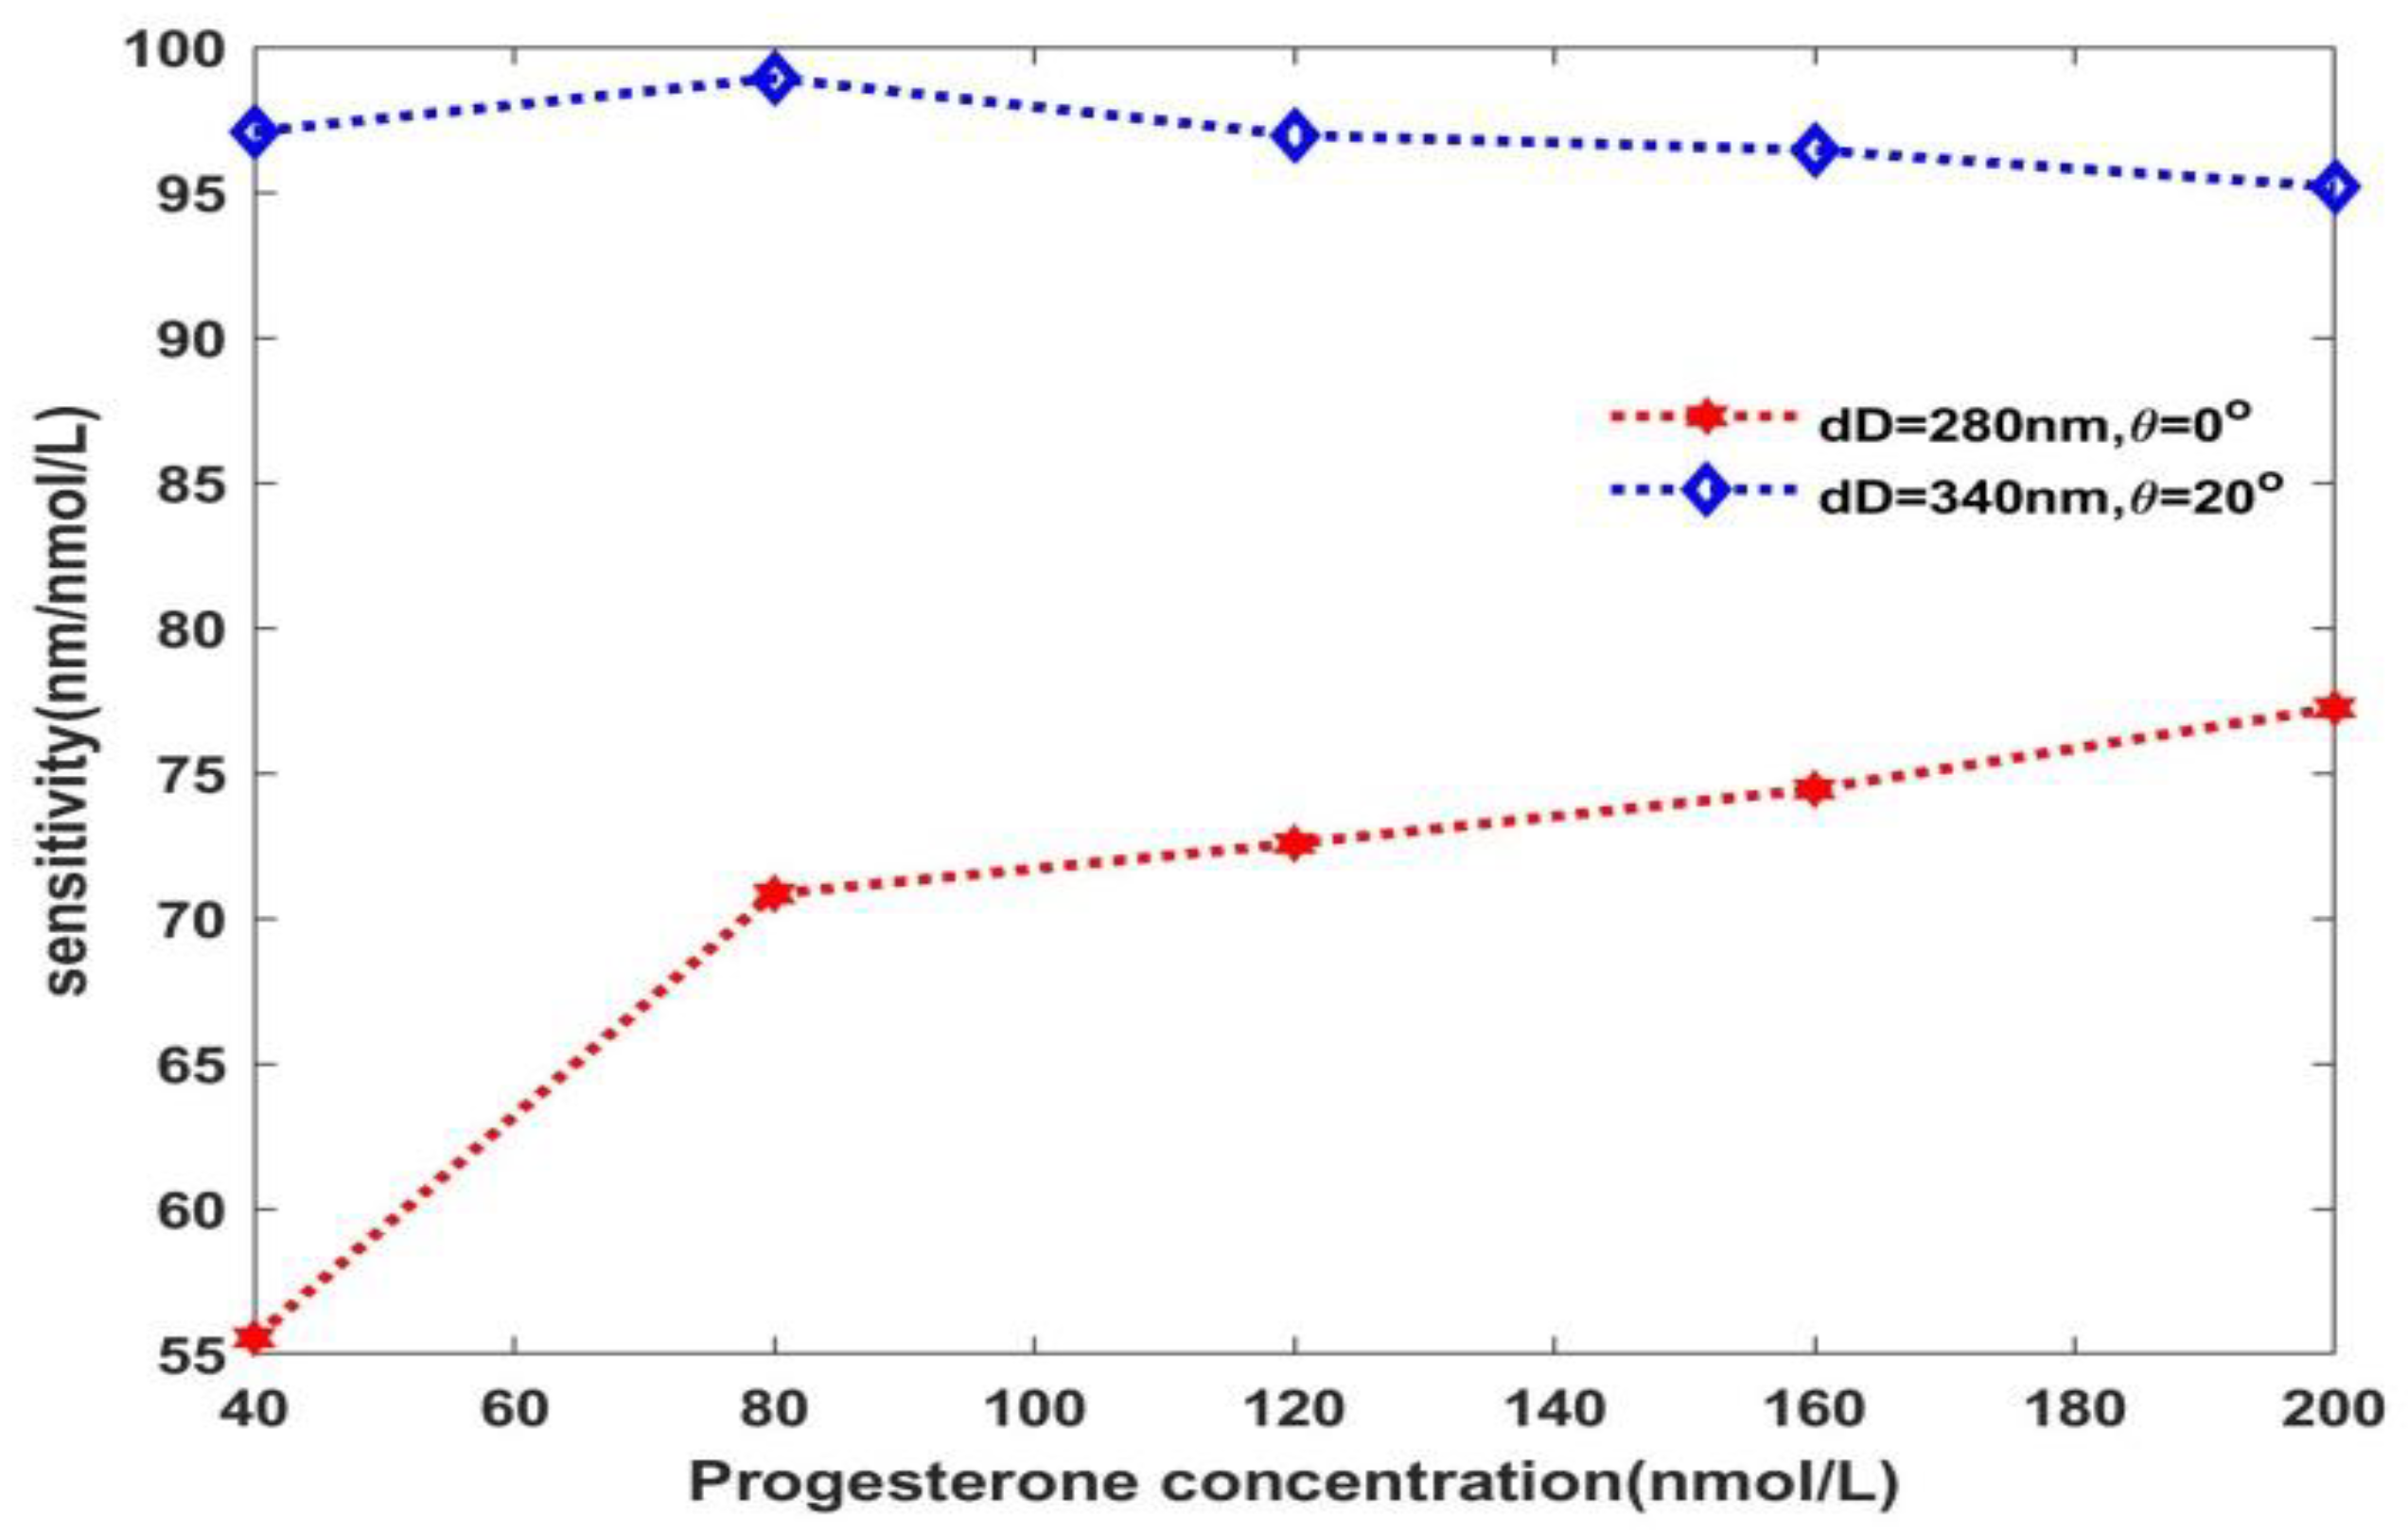
3.7. Sensitivity of Proposed Structure Separately Loaded with Blood Sample Containing Progesterone and Estradiol Hormones of Different Concentration at Given dD and θ0

Finally, we have examined how the sensitivity of the proposed structure varies with blood samples containing progesterone and estradiol hormones of different concentrations at particular thicknesses of cavity region (dD) and incident angle (θ0), as shown in Figure 7 and Figure 8, respectively.
Figure 7 shows the variation of sensitivity dependent on blood samples of different progesterone concentrations (c) at dD = 280 nm and 340 nm, corresponding to θ0 = 0° and 20°, respectively. It shows that at dD = 280 nm and θ0 = 0° sensitivity of the structure reaches to 55 nm/nmol/L corresponding to progesterone concentration 40 nmol/L. Further increase in c from 40 nmol/L to 200 nmol/L causes S to increase from 55 nm/nmol/L to 77.24 nm/nmol/L, as per the data mentioned in Table 1. The sensitivity variation is between 95.18 nm/nmol/L and 98.92 nm/nmol/L at dD = 340 nm and θ0 = 20°, depending upon the various progesterone concentrations in the blood samples, as shown in Figure 7, in accordance with the data mentioned in Table 2.
The sensitivity of the structure under the influence of blood samples containing estradiol hormones of concentration 0 to 11 nmol/L corresponding to dD = 280 nm and 340 nm at θ0 = 0° is plotted in Figure 8 as per the data given in Table 3 and Table 4, respectively. It shows that, at the given angle of incidence, increase in the thickness of cavity region results in improvement in the sensitivity of the structure. Moreover, we have also investigated the increase in the angle of incidence from 0° to 20° at a fixed value of dD = 340 nm on the sensitivity of the structure, as shown in Figure 8. It shows that under the influence of low concentration levels of the sample, the sensitivity variation is significant, whereas under the influence of high concentration levels, the sensitivity variation is relatively stagnant, corresponding to a change in the angle of incidence from 0° to 20° at dD = 340 nm (Table 5). Thus, we can conclude that for the given thickness of the cavity region, the concept of change in the angle of incidence can be used to increase the sensitivity of the structure, which in turn improves the performance.
Finally, Table 6 has been compiled to compare our results with some excellent research work carried by distinguished photonic workers. This comparison highlights the main advantages of proposed 1D PhC design with the previous works based on refractive index sensing mechanism having smaller sensitivity. The sensitivity of our structure can be easily tuned by changing incident angles without fulfilling any requirement of phase-matching conditions similar to that of structures based on SPR. The proposed design has same order of magnitude of quality factor and figure of merit values as the majority of schemes discussed in the cited references. The fabrication of the proposed design is easier with the help of presently available thin film deposition techniques. It is evident from Table 6 that the proposed biosensor possesses relatively good sensitivity and much better performance to detect reproductive hormones in females in contrast to the resent biosensing research work.

4. Conclusions

In conclusion, we have investigated how 1D PhC structure (AB)5CDC(AB)5 with a defect layer of air surrounded by MgF2 material layers can be used as a reconfigurable biosensor to detect progesterone and estradiol reproductive hormones of different concentrations in blood samples of females. The transfer matrix method has been used to study the transmission properties of the structure air/(SiO2/Si)5/MgF2/Cavity/MgF2(SiO2/Si)5/air theoretically. Blood samples containing reproductive hormones of different concentrations are loaded inside air cavity form biofilm, which is responsible for a positional change in the defect mode inside the photonic band gap. Under the optimum structural parameters, the proposed design possesses a high sensitivity of 98.92 nm/nmol/L and 96.13 nm/nmol/L when the cavity of thickness 340 nm is loaded with progesterone and estradiol hormones of concentration 80 nmol/L and 11 nmol/L, respectively, at an incident angle of 20° corresponding to the TE polarized wave. Apart from sensitivity, the quality factor and figure of merit observed from the proposed biosensor are 2.3 × 10⁴ and 3.17 × 10³, respectively, when the cavity is loaded with blood samples containing progesterone hormones of a concentration of 200 nmol/L at dD = 340 nm and θ0 = 20°. On the other hand, blood samples containing estradiol hormone of a concentration of 9 nom/L investigated the quality factor and figure of merit values to be 1.77 × 10⁴ and 2.3 × 10³, respectively, at dD = 340 nm and θ0 = 0°. In this work, we have also investigated how the change in the thickness of cavity region affects the performance of the proposed device in terms of its sensitivity, quality factor and figure of merit values. The proposed design may also be helpful for investigating biofluids whose refractive index variation is between 1.3333 and 1.5960604. The proposed design may work as a level free investigating device to determine gynecological problems pertaining to reproductive hormones in females.

Author Contributions

Conceptualization, A.H.A.; Data curation, A.H.A., Z.S.M., M.A.-D., M.T.T., A.F.A. and W.S.; Formal analysis, S.K.A., A.M.M., Z.S.M., M.A.M. and M.A.-D.; Investigation, A.H.A., S.K.A., M.T.T., Z.A.Z., A.F.A. and W.S.; Methodology, A.M.M., M.A.M., M.A.-D., M.T.T., A.F.A. and W.S.; Project administration, A.H.A.; Resources, Z.S.M., M.A.M. and M.A.-D.; Software, A.M.M., M.A.-D., M.T.T., A.F.A. and W.S.; Supervision, A.H.A.; Writing—original draft, S.K.A.; Writing—review & editing, A.H.A., S.K.A. and M.A.M. All authors have read and agreed to the published version of the manuscript.

Funding

This research received no external funding.

Institutional Review Board Statement

Not applicable.

Informed Consent Statement

Not applicable.

Data Availability Statement

Not applicable.

Conflicts of Interest

The authors declare no conflict of interest.

References

  1. Kinoshita, S.; Yoshioka, S.; Kawagoe, K. Mechanisms of Structural colour in the Morpho butterfly: Cooperation of regularity and irregularity in an iridescent scale. Proc. R. Roc. Lond. Soc. B 2002, 269, 1417–1421. [Google Scholar] [CrossRef] [PubMed] [Green Version]
  2. Fink, Y.; Winn, J.N.; Fan, S.; Chen, C.; Michel, J.; Joannopoulos, J.D.; Thomas, E.L. A Dielectric Omnidirectional Reflector. Science 1998, 282, 1679–1682. [Google Scholar] [CrossRef] [PubMed] [Green Version]
  3. Hart, S.D.; Maskaly, G.R.; Temelkuran, B.; Prideaux, P.H.; Joannopoulos, J.D.; Fink, Y. External reflection from omnidirectional dielectric mirror fibers. Science 2002, 296, 510–513. [Google Scholar] [CrossRef] [PubMed] [Green Version]
  4. Jiang, H.; Chen, H.; Li, H.; Zhang, Y. Omnidirectional gap and defect mode of one –dimensional photonic crystals containing negative index materials. Appl. Phys. Lett. 2003, 83, 5386–5388. [Google Scholar] [CrossRef]
  5. Awasthi, S.K.; Malaviya, U.; Ojha, S.P. Enhancement of omnidirectional total reflection wavelength range by using one- dimensional ternary photonic bandgap material. JOSA B 2006, 23, 2566–2571. [Google Scholar] [CrossRef]
  6. Awasthi, S.K.; Malaviya, U.; Ojha, S.P. Enhancement of omnidirectional high-reflection wavelength range in 1D ternary periodic structures: A comparative study. J. Nanophotonics 2008, 2, 023505. [Google Scholar]
  7. Upadhyay, M.; Awasthi, S.K.; Shiveshwari, L.; Srivastava, P.K.; Ojha, S.P. Thermally tunable photonic Filter for WDM networks Using 1D Superconductor dielectric photonic crystals. J. Supercond Nov. Magn. 2015, 28, 2275–2280. [Google Scholar] [CrossRef]
  8. John, S.; Florescu, M. Photonic bandgap materials: Towards an all-optical Micro-transistor. J. Opt. A Pure Appl. Opt. 2001, 3, S103–S120. [Google Scholar] [CrossRef]
  9. Rayleigh, L. On the maintenance of vibrations by forces of double frequency, and on the propagation of waves through a medium endowed with a periodic structure. Lond. Edinb. Dublin Philos. Mag. J. Sci. 1887, 24, 145–159. [Google Scholar] [CrossRef] [Green Version]
  10. Yablonovitcs, E. Inhibited spontaneous emission in solid state physics and electronics. Phys. Rev. Lett. 1986, 58, 2059–2062. [Google Scholar] [CrossRef] [Green Version]
  11. John, S. Strong localization of photons in certain disordered dielectric super lattices. Phys. Rev. Lett. 1987, 58, 2486–2489. [Google Scholar] [CrossRef] [Green Version]
  12. Zaky, Z.A.; Aly, A.H. Gyroidalgraphene/porous silicon array for exciting optical Tamm state as optical sensor. Sci. Rep. 2021, 11, 1–9. [Google Scholar] [CrossRef]
  13. Gao, S.; Dou, Y.; Li, Q.; Jiang, X. Tunable photonic crystal lens with high sensitivity of refractive index. Opt. Express 2017, 25, 7112–7120. [Google Scholar] [CrossRef]
  14. Suthar, B.; Bhargava, A. Pressure sensor based on Quantum well-structured photonic crystal. Silicon 2020, 13, 1765–1768. [Google Scholar] [CrossRef]
  15. Zaky, Z.A.; Aly, A.H. Theoretical study of a tunable lowtemperature photonic crystal sensor using dielectric superconductor Nanocomposite layers. J. Supercond Nov. Magn. 2020, 33, 2983–2990. [Google Scholar] [CrossRef]
  16. Sen, S.; Hasan, M.M.; Ahmed, K. Ultra-low material loss quasi pattern based photonic crystal Fiber for long distance THz wave propagation. Silicon 2020, 13, 1663–1673. [Google Scholar] [CrossRef]
  17. Alwan, A.M.; Abbas, R.A.; Dheyab, A.B. Study the characteristic of planer and sandwich PSi gas sensor (comparative study). Silicon 2018, 10, 2527–2534. [Google Scholar] [CrossRef] [Green Version]
  18. Aly, A.H.; Mohamed, D.; Zaky, Z.A.; Matar, Z.S.; El-Gawaad, N.S.; Shalaby, A.S.; Tayeboun, F.; Mohaseb, M. Novel biosensor detection of tuberculosis based on photonic band gap materials. Mater. Res. 2021, 24, 1–7. [Google Scholar] [CrossRef]
  19. Zaky, Z.A.; Ahmed, A.M.; Shalaby, A.S.; Aly, A.H. Refractive index gas sensor based on the Tamm state in a one-dimensional photonic crystal: Theoretical optimisation. Sci. Rep. 2020, 10, 9736. [Google Scholar] [CrossRef]
  20. Aly, A.H.; Zaky, Z.A. Ultra-sensitive photonic crystal cancer cells sensor with a high-quality factor. Cryogenics 2019, 104, 102991. [Google Scholar] [CrossRef]
  21. Zaky, Z.A.; Aly, A.H. Modeling of a biosensor using Tamm resonance excited by graphene. Appl. Opt. 2021, 60, 1411–1419. [Google Scholar] [CrossRef]
  22. Jabbar, A.A.; Alwan, A.M.; Zayer, M.Q.; Bohan, A.J. Efficient single cell monitoring of pathogenic bacteria using bimetallic nanostructures embedded in gradient porous silicon. Mater. Chem. Phys. 2020, 241, 122359. [Google Scholar] [CrossRef]
  23. Hopman, W.C.; Pottier, P.; Yudistira, D.; Van Lith, J.; Lambeck, P.V.; De La Rue, R.M. Quasi-one-dimensional photonic crystal as a compact building-block for refractometric optical sensors. IEEE J. Sel. Top. Quantum Electron. 2005, 11, 11–16. [Google Scholar] [CrossRef] [Green Version]
  24. Wu, L.; Jia, Y.; Jiang, L.; Guo, J.; Dai, X.; Xiang, Y. Sensitivity improved SPR biosensor based on the MoS2/graphene–aluminum hybrid structure. J. Lightwave Technol. 2016, 35, 82–87. [Google Scholar] [CrossRef]
  25. Li, H. Refractive index of silicon and germanium and its wavelength and temperature derivatives. J. Phys. Chem. Ref. Data 1980, 9, 561–658. [Google Scholar] [CrossRef]
  26. Kaliteevski, M.; Iorsh, I.; Brand, S.; Abram, R.; Chamberlain, J.; Kavokin, A. Tamm plasmon-polaritons: Possible electromagnetic Silicon states at the interface of a metal and a dielectric Bragg mirror. Phys. Rev. B 2007, 76, 165415-68. [Google Scholar] [CrossRef] [Green Version]
  27. Gaspar-Armenta, J.A.; Villa, F. Photonic surface-wave excitation: Photonic crystal–metal interface. JOSA B 2003, 20, 2349–2354. [Google Scholar] [CrossRef]
  28. Makaraviciute, M.; Ramanavicius, A. Development of a reusable protein G based SPR immunosensor for direct human growth hormone detection in real samples. Anal. Methods 2015, 7, 9875–9884. [Google Scholar] [CrossRef]
  29. German, N.; Kausaite-Minkstimiene, A. Determination of antibodies against human growth hormone using a direct immunoassay format and different electrochemical methods. Analyst 2013, 138, 1427–1433. [Google Scholar] [CrossRef]
  30. Pitruzzello, G.; Karuss, T.F. Photonic crystal resonances for sensing and imaging. J. Opt. 2018, 20, 073004. [Google Scholar] [CrossRef]
  31. Abd El-Ghany, S.E.; Noum, W.M.; Matar, Z.; Zaky, Z.A.; Aly, A.H. Optimized bio-photonic sensor using 1D-photonic crystals as a blood hemoglobin sensor. Phys. Scr. 2020, 96, 035501. [Google Scholar] [CrossRef]
  32. Sudro, S.; Carpignano, F.; Strambini, L.M.; Merlo, S.; Barillaro, G. Capillarity-driven (self-powered) one-dimensional photonic cry.stals for refractometry and (bio) sensing applications. RSC Adv. 2014, 4, 51935–51941. [Google Scholar]
  33. Gandhi, S.; Awasthi, S.K.; Aly, A.H. Biophotonic sensor design using a 1D defective annular photonic crystal for the detection of creatinine concentration in blood serum. RSC Adv. 2021, 11, 26655–26665. [Google Scholar] [CrossRef]
  34. Aly, A.H.; Mohamed, D.; Mohaseb, M.A.; Abd El-Gawaad, N.S. Trabelsi Biophotonic sensor for detection of creatinine concentration in blood serum based on 1D photonic crystal. RSC Adv. 2020, 10, 31765–31772. [Google Scholar] [CrossRef]
  35. NoumanWalaa, M.; Abd El-Ghany, S.E.-S.; Sallam Samira, M.; Dawood Abdel-Fattah, B.; Aly, A.H. Biophotonic sensor for rapid detection of brain lesions using 1D photonic crystal. Opt. Quan. Elect. 2020, 52, 1–14. [Google Scholar]
  36. Mehrota, P. Biosensors and their applications-a review. J. Oral Biol. Craniofacial Res. 2016, 6, 153–159. [Google Scholar] [CrossRef] [Green Version]
  37. Born, M.; Wolf, M. Principles of Optics: Basic Properties of the Electromagnetic Field; Pergamon Press: New York, NY, USA, 1984. [Google Scholar]
  38. Zeidan, E.; Shivaji, R.; Henrich, V.C.; Sandros, M.G. Nano-SPRi aptasensor for the detection of progesterone in buffer. Sci. Rep. 2016, 6, 26714. [Google Scholar] [CrossRef]
  39. Lieberman, A.; Curtis, L. In defense of progesterone: A review of the literature. Altern. Ther. Health Med. 2017, 23, 14–22. [Google Scholar]
  40. Panda, A.; Vigneswaran, D.; Pukhrambam, P.D.; Ayyanar, N.; Nguyen, T.K. Design and Performance Analysis of Reconfigurable 1D Photonic Crystal Biosensor employing Ge2Sb2Te5 (GST) for Detection of Women Reproductive Hormones. IEEE Trans. NanoBioscience 2021. [Google Scholar] [CrossRef]
  41. Danaie, M.; Kiani, B. Design of a label-free photonic crystal refractive index sensor for biomedical applications. Photonics Nanostructures Fundam. Appl. 2018, 31, 89–98. [Google Scholar] [CrossRef]
  42. Purkayastha, A.; Srivastava, T.; Jha, R. Ultrasensitive THz-Plasmonics gaseous sensor using doped grapheme. Sens. Actuators B 2016, 227, 291–295. [Google Scholar] [CrossRef]
  43. Klimov, V.V.; Pavlov, A.A.; Treshin, I.V.; Zabkov, I.V. Fano resonances in a photonic crystalcovered with a perforated gold film and itsapplication to bio-sensing. J. Phys. D Appl. Phys. 2017, 50, 285101. [Google Scholar] [CrossRef]
  44. El-Khozondar, H.J.; Mahalakshmi, P.; El-Khozondar, R.J.; Ramanujam, N.R.; Amirie, I.S.; Yupapin, P. Design of one dimensional refractive index sensor using ternary photonic crystal waveguide for plasma blood samples applications. Phys. E Low-Dimens. Syst. Nanostructures 2019, 111, 29–36. [Google Scholar] [CrossRef]
  45. Ramanujam, N.R.; Amiri, I.S.; Taya, S.A.; Olyaee, S.; Udiyakumar, R.; Pasumpon, A.; Wilson Joseph, K.S.; Mahalakshmi, P.; Yupapin, P.P. Enhanced sensitivity of cancer cell using one dimensional nano composite material coated photonic crystal. Microsyst. Technol. 2019, 25, 189–196. [Google Scholar] [CrossRef]
  46. Ramanujam, N.R.; El-Khozondar, H.A.; Dhasarathan, V.; Tayae, S.A.; Aly, A.H. Design of one dimensional defect based photonic crystal by composited superconducting material for bio sensing applications. Phys. B Condens. Matter 2019, 572, 42–55. [Google Scholar] [CrossRef]
  47. Lheureux, G.; Monavarian, M.; Anderson, R.; DeCrescent, R.A.; Bellessa, J.; Synmonds, C.; Schuller, J.A.; Speck, J.; Nakamura, S.; DenBaars, S.P. Tamm plasmons in metal/nanoporousGaN distributed Bragg reflector cavities for active and passive optoelectronics. Opt. Express 2020, 28, 17934–17943. [Google Scholar] [CrossRef]
  48. Bijalwan, A.; Singh, B.K.; Rastogi, V. Analysis of one-dimensional photonic crystal based sensor for detection of blood plasma and cancer cells. Optik 2021, 226, 165994. [Google Scholar] [CrossRef]
Figure 1. The schematic diagram of 1D photonic biosensor (AB)NCDC(AB)N.
Crystals 11 01533 g001
Figure 2. Experimental and cubic curve fitting values of refractive index of (a) progesterone and (b) estradiol hormones dependent on their concentration levels.
Crystals 11 01533 g002
Figure 3. Transmittance spectrum of proposed biosensor loaded with blood samples containing progesterone and estradiol hormones of zero concentration at dD = 360 nm.
Crystals 11 01533 g003
Figure 4. Transmission spectrum of our biosensing design loaded with blood samples of different concentration levels of (a) progesterone and (b) estradiol at dD = 300 nm.
Crystals 11 01533 g004
Figure 5. Transmission spectrum of our biosensing design of different cavity thicknesses loaded with blood samples containing (a) progesterone hormone at c = 60 nmol/L and (b) estradiol hormone at c = 10 nmol/L corresponding to θ = 10 ° .
Crystals 11 01533 g005
Figure 6. Transmission spectrum of our biosensing design under different incident angles with dD = 360 nm when the cavity is loaded with blood samples containing (a) progesterone hormone at c = 30 nmol/L and (b) estradiol hormone at c = 5 nmol/L.
Crystals 11 01533 g006
Figure 7. Sensitivity versus blood samples containing progesterone hormones of different concentration levels at dD = 280 nm, θ = 0° and dD = 340 nm, θ = 20°.
Crystals 11 01533 g007
Figure 8. Sensitivity versus blood samples containing estradiol hormones of different concentration levels at dD = 280 nm, θ = 0°, dD = 340 nm, θ = 0° and dD = 340 nm, θ = 20°.
Crystals 11 01533 g008
Table 1. The parameters showing performance of biosensing structure (AB)5CDC(AB)5 when cavity is loaded with blood sample containing progesterone hormones of different concentrations with dD = 280 nm at θ = 0°.
Types of HormonesC (nmol/L)Refractive Index λ r e s o n . ( nm ) λ F W H M ( nm ) S (nm/nmol/L) Q FOM (nmol/L)
Progesterone01.3352680.080.06-11,334.666-
401.336127680.130.0655.555511,335.5925.925
801.346210680.860.0770.844689726.5741012.666
1201.381915683.470.0772.575469763.8571036.794
1601.459606689.350.0674.4470611,489.1667124.7843
2001.5960604700.230.0577.2443814,004.61544.887
Table 2. The parameters showing performance of biosensing structure (AB)5CDC(AB)5 when cavity is loaded with blood sample containing progesterone hormones of different concentrations with dD = 340 nm at θ = 20°.
Types of HormonesC (nmol/L)Refractive Index λ r e s o n . ( nm ) λ F W H M ( nm ) S (nm/nmol/L) Q FOM (nmol/L)
Progesterone01.3352694.640.06-13,892.8-
401.336127694.730.0697.0873713,894.61941.7474
801.346210695.720.0798.9264317,3932473.1607
1201.381915699.160.0796.9693317,479.252424.2332
1601.459606706.650.0696.45191814,1331929.03836
2001.5960604719.390.0595.185010823,9813172.83369
Table 3. The parameters showing performance of biosensing structure (AB)5CDC(AB)5 when cavity is loaded with blood sample containing estradiol hormones of different concentrations with dD = 280 nm at θ = 0°.
Types of HormonesC (nmol/L)Refractive Index λ r e s o n . ( nm ) λ F W H M ( nm ) S (nm/nmol/L) Q FOM (nmol/L)
Estradiol01.3333679.920.1-6799.2-
51.341311680.50.1872.4003593780.555402.22421
71.3647495682.190.0972.1803557579.8888802.00394
91.4190331686.240.0773.71723849803.42851053.10341
111.5170166693.840.0475.769149173461894.22805
Table 4. The parameters showing performance of biosensing structure (AB)5CDC(AB)5 when cavity is loaded with blood sample containing estradiol hormones of different concentrations with dD = 340 nm at θ = 0°.
Types of HormonesC (nmol/L)Refractive Index λ r e s o n . ( nm ) λ F W H M ( nm ) S (nm/nmol/L) Q FOM (nmol/L)
Estradiol01.3333703.40.04-17,585-
51.341311703.980.0472.4031617,599.51810.079
71.3647495706.250.0490.621472511,656.252265.5368
91.4190331711.520.0494.7126517,7882367.81625
111.5170166720.960.0695.58199912,0161593.03332
Table 5. The parameters showing performance of biosensing structure (AB)5CDC(AB)5 when cavity is loaded with blood sample containing estradiol hormones of different concentrations with dD = 340 nm at θ = 20°.
Types of HormonesC (nmol/L)Refractive Index λ r e s o n . ( nm ) λ F W H M ( nm ) S (nm/nmol/L) Q FOM (nmol/L)
Estradiol01.3333696.450.05-13,889.8-
51.341311695.220.0690.04563911,5871500.76065
71.3647495697.470.0694.755083511,624.51579.2513
91.4190331702.710.0595.8788514,054.21917.577
111.5170166712.120.0196.126371,2129612.63
Table 6. Comparison of numeric values of sensitivity, quality factor and figure of merit of proposed design with previous research work of similar kind for evaluating the performance of the proposed bio-sensing design (AB)5CDC(AB)5.
YearS
(nm/RIU)
Q-FactorFOM
(RIU)
Frequency RangeReference
201634.11Not mentioned1.1 × 103THz42
2017173 × 1042.23 × 102Visible to NIR43
201925.75–51.49Not mentionedNot mentionedNIR44
201932–43.13Not mentionedNot mentionedNIR45
201953.0–90.9Not mentionedNot mentionedNIR46
2020103 × 10215.1Visible47
202171–75Not mentionedNot mentionedNIR48
This work55.55–98.92(0.68–2.3) × 104(1.96–2.6) × 104Visible
Publisher’s Note: MDPI stays neutral with regard to jurisdictional claims in published maps and institutional affiliations.

