1. Introduction
Additive manufacturing (AM), colloquially referred to as 3D printing, is defined by ASTM standard ISO/ASTM 52900 as “process of joining materials to make parts from the 3D model data, usually layer upon layer, as opposed to subtractive manufacturing and formative manufacturing methodologies” [
1]. In recent years, the manufacturing industry has seen a paradigm shift due to the full range of advantages of AM, such as complexity-free design, no need for tooling, reduction in waste, and amount of production steps compared to conventional techniques. Fabrication of complex geometries without increasing the production cost is one of the capabilities of the AM. This capability of AM allows the designing of complex lightweight components without compromising the functionality. For example, in the aerospace and automotive industries, the reduction in material weight is directly linked to the reduction in fuel consumption. Therefore, the AM has matured very rapidly in terms of technical aspects and process aspects. These developments have led to convincing many industries to adopt AM for manufacturing novel parts across many sectors.
Despite many technological advantages, many problems related in particular to the control of defects (porosity rate, cracking, etc.), to the management and control of heat transfer during the process, or material supply problems persist. Several operating factors, such as processing parameters, part design, support placement, powder properties, etc., can influence the quality of the finished part [
2]. For example, Galy et al. [
3] reviewed all the factors in the L-PBF process that influence the final quality of Al alloy parts. All these factors hinder the full adaption of the AM by many niche industries [
4,
5,
6]. Many of the factors that can influence the quality of the final part (
Figure 1) can be controlled in-line, and the process signatures can be directly linked to the quality [
7,
8,
9].
This led to the development of in situ monitoring of the process and closed-loop control. There is an enormous number of in situ sensing techniques developed for all types of AM processes. However, we will focus mainly on the laser powder bed fusion process (L-PBF), also known as selective laser melting (SLM). Usually, melt pool monitoring is the most used technique to control the L-PBF process due to the dependency of melt pool dynamics on the quality metric of the part [
10].
Generally, we monitor the process at three different levels, which are:
Local melt pool monitoring: involves monitoring of the melt pool morphology (shape and size) and heat-affected zone.
Layer wise monitoring: The total temperature distribution of the printed layer is monitored. The homogeneous temperature profile of the layer shows the stability of the process.
Part volume monitoring: it involves the monitoring of the whole build volume at the end of the process.
The in situ sensors for L-PBF can be divided into acoustic, optical systems, which are similar to the laser welding literature [
11]. Acoustic sensors are complicated to calibrate due to the significantly high noise factor. Therefore, optical systems, such as cameras and photodiodes, are common for the L-PBF process. Clijsters et al. [
12] and Craeghs et al. [
13,
14,
15] have developed a co-axial melt pool monitoring system in-house for the L-PBF process in the visible-near infrared detection range. Demir et al. [
16] proposed a co-axial system with a set of focused optics to control the area of focus. It is critical to control the area of focus to enhance the resolution around the melt pool. Nowadays, many commercial L-PBF machines are equipped with in situ monitoring systems. Nevertheless, the commercial systems are very closed and act as a black box. Therefore, it is essential to post-process the acquired sensors data to predict the quality of the part.
There are good critical reviews available on in situ monitoring and factors affecting the powder bed fusion (PBF) process [
7,
8,
9]. Therefore, there is a lack of comprehensive review, especially focused on the L-PBF process and covers the process, in situ monitoring systems, and post-processing of in situ sensing data. This review article bridges the gap and provides a brief overview of the in situ monitoring systems and treatment of data in the L-PBF process.
Section 3 and
Section 4 are inspired by the work of Grasso et al. [
9], which discussed commonly occurred defects in the powder bed fusion process. However, we have only reviewed the defects related to the L-PBF process.
This article is organized as follows. Firstly, we discuss the working principle of the L-PBF process and the most common defects that occur during the process, followed by the working principle of the in situ sensing devices. Finally, we review the literature available on the data treatment and automatic detection of defects in the L-PBF process using machine learning.
2. Working Principle of L-PBF
Laser powder bed fusion (L-PBF), also known as selective laser melting (SLM) and Direct melt laser sintering (DMLS), is an additive manufacturing process in which a laser source (thermal energy) selectively fuses regions of powder bed in a layer by layer fashion [
17]. The schematic of L-PBF is shown in
Figure 2a. The complex thermomechanical process in the form of a melt pool occurs locally due to laser–material interaction [
18]. The schematic of the laser–material interaction region is shown in
Figure 2b [
19]. The non-uniformity of temperature distribution in the melt pool (center of melt pool is at a higher temperature) develops a surface tension gradient, which leads to the thermocapillary motion of the liquid, i.e., the liquid from the center of the melt pool is transported to the edges (colder region). When the laser source moves away from the molten pool, a negative surface tension gradient develops in the melt pool, which generates a shallow and well-distributed liquid mass. Similarly, the segregated melt at the melt pool edges will acquire sufficient surface energy, which then flows back to the hotter region, and the convection loop completes [
20]. Rapid solidification with cooling rates of 10
6 K/s of melt pool allows for interlayer bonding [
21].
For metallic alloys, the support structures are required to anchor parts and their features to the build plate. It is necessary because the thermal gradients in the building part are high, which can lead to thermal stresses and warping if the anchors are not used. The thick build plate serves as the heat sink and also prevents the parts from warping while printing. The preheating of the build plate, which depends on the material manufactured, is done to minimize thermal stresses in the part. The dimensional accuracy and ability to print good surface finish products and fine feature details is one of the advantages of the L-PBF process.
3. Defects
As we discussed, the L-PBF process is a complex thermomechanical process that is affected by many controllable process parameters such as laser power, scan speed, hatch distance, powder material, and powder morphology. All these parameters can strongly influence the laser–material interaction, which will influence the thermophysical mechanism, resulting in various physical phenomena such as material evaporation, microstructural evolution, melt pool instabilities, and thermal stresses. Thus, the formation of various defects during the process is inevitable. Here, we review the formation mechanism of the most prevalent defects, such as porosities, lack of fusion, balling, and cracking defects that can be detrimental to the mechanical properties of the final part.
3.1. Porosities
Spherical and non-spherical porosities, which are usually smaller in size (100 µm), are the most common defects in the L-PBF process, which significantly influence the fatigue properties of the part [
22,
23,
24,
25,
26,
27]. The leading cause for the formation of gas porosities (generally spherical, as shown in
Figure 3a) is the entrapping of gas in the melt pool due to rapid solidification. The rapid solidification of the melt pool does not allow dissolved gas to come out on the surface. As we know, at high temperatures, the gas dissolves in the melt pool very easily. Moreover, enrichment of gas in the liquid melt can be due to various factors such as low packing density of powder bed, gas inclusion during gas atomization of powders, and evaporation due to high laser power. Dissociation of oxide films, adsorbed gas, and moisture on the powder material also results in gas formation [
28]. For example, Gong et al. [
29] showed the presence of gas porosities due to the entrapping of gas bubbles, which originated due to the vaporization of the low melting material in the alloys. The gas bubbles could not escape to the surface due to rapid solidification. Zang et al. [
30] reported the random distribution of the porosities within the printed layer, between the adjacent layers, and on the surface of the part.
Another type of porosity called “keyhole porosity” is due to excessive energy input, which leads to temperatures beyond the boiling point of the material, which causes evaporation of the material and forms a plasma. The laser beam penetrates the powder bed deep through the vapor voids, which creates a large melt pool. High energy density can occur at lower scan speeds, where the longer exposure time initiates boiling, which unstabilizes the melt pool and induces small metallics balls. The intense recoil pressure creates denudation along the scan track and, together with Marangoni convection (thermocapillary convection), forms a melt pool depression into the powder layers. The breakdown of the melt pool sidewalls during solidification leads to entrapped irregular porosities in the printed layer (as shown in
Figure 3b) [
31].
Still, there is a lack of universal consensus among researchers on the evolution mechanism of keyhole porosities [
29]. For example, according to reference [
25], the keyhole porosities occur when the Marangoni effect outweighs the buoyancy. Similarly, Choquet et al. [
32] stated that vortices, high fluid speed, and recirculation in the melt pool leads to keyhole phenomena. It is challenging to observe this type of defect experimentally and requires a sophisticated set up to observe it on-line. For instance, Cunningham et al. [
33] used ultrahigh-speed X-ray imaging to capture keyhole evolution in titanium alloy while printing. They have explained the evolution of the keyhole porosity, which is as follows: As the laser turned on, the powder began to melt, and a solid–liquid interface was formed. Once the melt pool temperature reached near the boiling point of the material, localized vaporization led to recoil pressure and formed a depression. Due to recoil pressure, the melt pushed up and out of depression, which developed instability in the melt pool. Soon after, the shallow vapor depression transitioned to deep, conical depression. Then, deep vapor depression rapidly penetrated the melt pool, and displacement of the melted liquid from the center of the melt pool occurred. The displacement in the liquid introduced the liquid–vapor interface fluctuations and changed the melt pool shape from quasi-semicircular to a bimodal shape to form keyhole porosity.
3.2. Lack of Fusion
Another common defect observed in L-PBF is the lack of fusion defect (LOF), which occurs due to incomplete fusion of two adjacent layers (as shown in
Figure 3c). It can happen due to (i) insufficient energy input leading to incomplete melting of the powder layer [
34], (ii) insufficient material due to shrinkage during solidification, and (iii) poor bonding between layers due to oxidation, which influences the wetting angle between layers [
29,
35]. As the L-PBF process selectively melts the powder line by line and layer by layer, the LOF defects are usually present in between the layers or between the scan vectors. Sometimes, the uneven powder layer spreading in consecutive layers also leads to incomplete melting of the powder, which also results in an LOF defect in the final part. Clijsters et al. and Read et al. [
12,
36] showed that the rapid formation of an oxide layer on the solidified layer of AlSi10Mg leads to poor wettability in between layers, which results in an LOF defect.
3.3. Balling
Another common defect in the L-PBF process is called “balling”, which leads to disruption in interlayer bonding, poor surface quality, and porosity in the final part [
36]. It occurs mainly in high scan speeds, which leads to an elongated melt pool that breaks into small beads (10 µm) to reduce the surface tension due to Rayleigh instability. Additionally, partially melted powder due to low input energy leads to limited melt formation and produces coarser sized beads (500 µm). Oxide layer or presence of moisture on the powder surface can also disrupt the melt pool surface tension, resulting in balling. These impurities reverse the capillary motion at the melt pool surface, and positive surface tension gradient forces the melt pool to flow inwards to the center, which develops unfavorable wetting conditions and leads to spheroidization. Remelting/double exposure or deoxidizing agents can significantly reduce the balling phenomena [
37,
38]. Li et al. [
39] presented the SEM images of the balling phenomena for stainless steel w.r.t different scanning speeds in the L-PBF process (as shown in
Figure 3d). Other authors, for example [
38,
40], reported the balling phenomenon in L-PBF for different materials.
3.4. Cracks
The residual stresses are the stresses that remain in the part after fabrication; these stresses are significantly detrimental to the mechanical strength of the final part. Higher thermal gradient due to rapid heating and cooling cycles develops residual stresses in the part and results in delamination, part distortion, and warping [
41,
42]. The two mechanisms responsible for the evolution of residual stresses are temperature gradient mechanism (TGM) and rapid solidification mechanism. During TGM, the pre-solidified layer underneath the melted layers is heated up very rapidly upon laser exposure, which tries to expand but is restricted by the cold solidified material. This restriction in thermal expansion develops compressive residual stresses at the regional heat affected zone (see
Figure 4a) [
43]. During the solidification mechanism, the melted zone cools very rapidly, and shrinkage is again restricted by the underlying layer, developing tensile residual stresses in the upper layer (
Figure 5a). Therefore, the cyclic heating and cooling phases during printing results in larger tensile residual stresses in the top surface layers and residual compression stress at the bottom of the printed part (
Figure 4b and
Figure 5b) [
43].
At a given time and temperature, when the tensile residual stresses cross the ultimate tensile strength of the material, it leads to cracking in the part [
44]. As reported [
45], the crack initiation and propagation start on the as-built surface as it adhered to the partially melted material and leads to interlayer delamination, also called interlayer cracking. Materials like nickel-based alloys, copper, and stainless steel are highly susceptible to cracking due to their low thermal conductivity [
46,
47,
48]. The pre-heating of the build plate is often applied to reduce the effect of the residual stresses in the final part.
3.5. Part Distortions
Another critical aspect of residual stresses on the overall quality of the part health is “part distortion”. If the thermally induced local residual stresses exceed the yield stress of the material, it can lead to part distortion in the middle of the process. Part distortion can also damage the recoater permanently. Kruth et al. [
49] reported the warping in the SLMed parts due to high thermal fluctuations experienced by the material in a short interval of time. The relaxation in the residual stresses after the removal of the finished part from the base plate and support structures, leads to macroscopic distortion in the final part (as shown in
Figure 3e). Mugwagwa et al. [
50] studied the influence of process parameters such as laser power, scanning speed, scanning strategies on the evolution of residual stresses, and part distortion experimentally and with finite element modeling. Sometimes, the warping of the parts can lead to failure of the bolts of the build plate as well. Mishurova et al. [
51] studied the influence of support structures on part distortion using the X-ray diffraction method. The stress redistribution takes place for the samples with support structures after removal from the base plate, whereas for parts without support structures, only simple stress relaxation observed. They have concluded that the support structures decrease the amount of residual stresses in the part.
Other defects or anomalies such as surface defects, material contamination, and geometrical inaccuracy are not discussed in this article. However, interested readers can refer to references [
52,
53,
54,
55].
4. Origin of Defects
L-PBF process involves a large number of critical parameters that can influence the quality of the final part and leads to the above mention defects if not optimized. Sharratt et al. [
26] categorized the influencing parameters into three categories, which are (i) process defects, (ii) equipment-induced defects, (iii) design defects. Equipment defects are basically due to aberration in the equipment of the machine such as f-theta lens aberration, improper calibration, wear of recoating blade, etc. Nowadays, due to significant technological advancements, most of the commercial machines are well-calibrated and standardized to minimize such defects. Design defects are due to improper optimization of the design as per AM standards such as lack of support structures, overhang angle, and bad orientation. These defects can be minimized by using commercial software such as AdditiveLab, Simufact, Virfac, etc., which helps to find the best support structure placement based on the thermomechanical simulations.
A lot of time and money is consumed to find best-fit process parameters such as laser power, scan speed, hatch distance, layer thickness, etc., to reduce the third type of defects called “process defects”. All the parameters mentioned above can be combined in the empirical formula of ’Energy density (
E)’ given by Equation (1), where
P,
v,
h, and
t represent laser power, scan speed, hatch distance, and layer thickness, respectively.
Each paramete in Equation (1) has its effect on the final quality of the part. For example, at lower scan speed and high laser power, the energy density is higher, and its attributes to porosity defects are due to entrapment of gas. Thijs et al. [
27] stated that high energy input in Ti6Al4V powders leads to large melt pool size, which causes denudation. Thus, not enough material is available to fuse the adjacent scan vector, which leads to bigger pores in the part. The higher residual stresses are also reported for low scan speed and higher laser power [
46].
Similarly, at low laser power and higher scan speed, a lack of fusion defects is more pronounced due to a lack of energy input to fully melt the powder layer [
29,
35,
56]. Sun et al. [
57] showed the relationship between the part density and input energy density for Al0.5CoCrFeNi High Entropy Alloys (
Figure 6). It can be observed that for lower energy density, the highest porosity is reported. Therefore, it is crucial to optimize the process parameters to attain the maximum dense parts.
It is important to note that the scanning strategy also makes an impact on the overall quality of the part. Although it has not been considered in the energy density equation, the scanning strategy directly influences the heat balance of the part. For example, Aboulkhair et al. [
30] showed the relation between the scan speed and different scan strategies, as shown in
Figure 7. The different strategies used are: “2X” is similar to “X” but each layer is scanned twice, “X&Y 2HS” means that each layer was scanned twice having each scan pass perpendicular to the one before and with different hatch spacings for each scan, “pre-sinter” means to first scan the layer with half the power followed by a second scan with full power, “overlap” strategy indicates where each layer was scanned twice with the second scan melting the overlap between each two adjacent melt pools, and “alternating” strategy indicates scanning each layer in a direction rotated by 90° to its precursor. As can be concluded from
Figure 7, the pre-sinter scanning strategy and scanning speed of 500 mm/s report a high density of AlSi10Mg parts.
5. Melt Pool Signatures
Laser–material interaction in L-PBF is a complex thermophysical phenomenon occurring in a short interval of time. The shape and size of the melt pool are significantly influenced by the process parameters and geometrical factors as well. Therefore, melt pool signatures provide essential information about the quality of the part. A different range of electromagnetic spectrum emanates from the melt pool, which serves as the input variable for in situ sensing devices. The types of electromagnetic radiations observed from the melt pool are shown in
Figure 8. As we know, scattering, absorption, and diffraction of the laser light are the common phenomena that occur. Hence, the backscattering of the laser light is a common phenomenon that occurs in L-PBF. Therefore, it is vital to eliminate the backscattering of the laser light in the in situ sensing module by installing correct mirrors. Thermal emissions from the melt pool occur at the wavelengths that correspond to the melt temperature. High laser energy can lead to the evaporation of melt and ionization of the gas, which results in the formation of a plasma plume above the melt pool. The electromagnetic radiation from the plasma can also add noise to the captured signatures [
58,
59,
60,
61]. Sometimes, the plasma also hinders the laser beam, which results in low input energy to the powder bed. Thermal radiation, which ranges from 900 to 2300 nm, is captured to monitor the process and links it to the temperature field of the melt pool. Plasma radiations, which are in the range of visible wavelengths (400–600 nm), are eliminated [
58,
62]. These melt pool signatures are captured by using in situ sensing sensors, which are discussed in the next section.
6. In Situ Sensing Devices
As discussed in the last section, capturing the melt pool signatures is essential to monitor the process. Therefore, in this section, we review the working principle of the most used devices or sensors for in situ sensing of melt pool signatures in the L-PBF process. Generally, two entities related to the melting pool are measured, i.e., melt pool morphology (shape and size) and temperature. For temperature measurements, there are two types of sensors available, i.e., photon detectors, also called non-contact sensors, and thermal detectors, referred to as contact detectors. As can be seen in
Figure 9, the thermal detector response is constant with the wavelength (radiations emanating from the melt pool), whereas the photon detector response was greatly influenced by the wavelength of the light. The linking of the photon detectors output to the melt pool temperature will be discussed in
Section 7. Besides monitoring the melt pool signatures, other process signatures such as powder bed spreading and part geometry are also studied using different sensor techniques, such as ultrasonic, line profiling, optical coherence tomography, etc., as reported in references [
63,
64,
65].
6.1. Non-Contact Temperature Measurement Devices
Most of the studies involve the monitoring of the temperature field or electromagnetic radiations from the melt pool both in a co-axial/on-axis and off-axis manner. The melt pool signatures capture the most invaluable information such as the temperature profile of the melt pool and the morphology of the melt pool that directly influences the quality the part [
66,
67,
68]. Electromagnetic emissions are associated with the melt pool and plasma plume [
27]. Therefore, to capture electromagnetic signatures, mostly non-contact measurement sensors are used. Broadly, these sensors can be classified as spatially integrated, i.e., photodiodes and pyrometers; spatially resolved, i.e., cameras; spectrally resolved, i.e., spectrometers [
62,
69]. Regardless of the sensors, the essential requirement for AM applications is the ability of the sensor to capture the rapid melt pool dynamics. Below, we discuss the working mechanism of the two most common photodevices used in the L-PBF process.
6.1.1. Photodiodes
Spatially integrated, single-channel detectors such as photodiodes are semiconductor devices that convert light (radiation) into electric current. The basic principle of the photodiode or photodetector is that when photons of sufficient energy (radiation) hit the active area of the device, it generates an electron-hole pair, which changes the effective resistance or conductance of the detector. A bias voltage is applied to collect the charge carriers, and the signal (photocurrent) is measured across a load resistor RL, as shown in
Figure 10. The photocurrent is directly proportional to the intensity of the photons hitting the active area of the device. The intensity of photons is directly linked to the melt pool temperature. Photodiodes have the advantages and disadvantages of reducing the signal to a single data point, i.e., photovoltage corresponding to the amount of light hitting the photodiode. Reducing the signal to a single point relates to data shrinkage, which makes it easier to post-process. Low cost, high sensitivity, and high sampling rates (typically ~50 kHz) make them suitable for in situ sensing of the L-PBF process. The detection range of these devices is limited to over a range of the spectrum; for example, germanium (Ge) and InGaAs-based photodiodes are used for visible to infrared light detection. In contrast, silicon-based photodiodes are used for the UV and visible spectrum [
70,
71,
72,
73].
6.1.2. Digital Cameras
The digital cameras, also called spatially resolved sensors, are an array of photodiodes where each photodiode is labeled as a pixel. The different types of photodiodes with their detection wavelength range are given in
Figure 11. Each pixel detects the photon coming from the melt pool and converts it into photocurrent. Afterward, signal processing is done to extract a picture which corresponds to the temperature fields of the melt pool. Based on the detection range of the devices, it can be classified either as a regular digital camera that has detection range in the visible spectrum or a thermal camera, which has detection range in the infrared spectrum. Mostly, for monitoring melt pool signatures, thermal cameras are preferred with a detection range over 700 nm. Based on the signal processing method, the digital cameras can be classified into two categories, i.e., charge-coupled device (CCD) and complementary metal-oxide-semiconductor (CMOS). In a CCD camera, all the pixel information is processed by the single circuit, whereas, in a CMOS camera, each pixel has its processing circuit. Therefore, the CMOS cameras have better signal processing speed, but the capture area is limited compared to a CCD camera. The main disadvantage of using cameras for in situ sensing of the L-PBF process is the speed of the process, which requires a high frame rate camera that results in an enormous size of data that are difficult to post-process [
74,
75,
76].
6.2. Contact Temperature Measurement Devices
Another category of the devices or sensors used for monitoring the temperature fields in the L-PBF process is direct contact-based measurement devices such as thermocouples. The thermocouple is an electric device that produces a temperature-dependent voltage due to thermoelectric effect. The working principle of the thermocouple is based on the Peltier effect. The thermocouple consists of two electric conductors joined together to form two junctions. If junctions are attached to the surface at different temperatures, an electromotive force (EMF) is generated due to the temperature gradient between the two junctions of the circuit; then, total EMF can be calculated based on the temperature of the junctions and the properties of the electric conductors used. A point of measurement is connected to one of the junctions in the circuit, also called a hot junction. Another body of known temperature is connected to the other junction, also called a cold junction or a reference junction. A voltmeter measures voltage or current generated due to the temperature gradient between the two junctions. This voltage or current is then converted into the temperature [79,80]. Thermocouples can be used to monitor the overall heat flow of the part while printing. However, one limitation of the thermocouple is that it requires physical contact to measure the temperature, which is difficult in the L-PBF process and often requires extra preparation such as drilling holes or slots. Some of the researchers have monitored the L-PBF process using thermocouples, which can be found in the reference article [
71].
7. Temperature Correlation
One of the key advantages of using photodiodes and digital cameras is the possibility to monitor the melt pool temperature fields or process signatures without any physical contact with the target surface. It provides the freedom to monitor the processes like AM, in which it is challenging to access the target surface. Another advantage of these sensors is the possibility to detect high temperatures such as 2000 °C. Although these sensors provide great flexibility and easy detectability, calibration of these sensors properly is a vital issue. The main principle of the sensors is to generate a photocurrent or photovoltage based on the emitted radiation from the melt pool. Therefore, it requires much understanding about the process and complex thermophysical phenomena occurring in that short interval of time. Usually, the melt pool is compared with the black body phenomenon to compute the actual temperature. However, in reality, the melt pool does not behave as an ideal black body rather than a real body. In addition, the emissivity of the material concerning different temperatures is not known. Therefore, a better understanding of black body phenomena is inevitable. Here, we present an insight into black body radiation and their correlation with the melt pool physics in L-PBF.
All bodies above absolute zero (0 K) emit thermal radiation due to the thermal vibrations of atomic particles. The quantity of the power emitted is expressed by the radiative intensity. The total energy is distributed across the electromagnetic spectrum. The emission intensity and shape of the distribution is dependent on the temperature. Conversely, the temperature of the body can be calculated by the quantity and spectral distribution of its emitted energy across the spectrum.
Firstly, a black body is a physical body that absorbs all the incident electromagnetic radiation and emits electromagnetic radiation called black body radiation. The radiation emitted by the black body is dependent on the temperature alone, not on body shape and composition. For an ideal black body at a specific temperature (T), spectral radiance (
B) is given by Planck’s law (Equation (2)), where h is Planck’s constant;
c is the speed of light;
KB is the Boltzmann constant.
Figure 12 shows the spectral radiance of ideal black body radiation at different temperatures. It can be seen that the radiant intensity increases with increasing temperature at all wavelengths and for all temperatures. For any given temperature, the radiant intensity reaches a maximum at a specific wavelength, and there are two wavelengths where the radiant intensity is equal for intensities less than the maximum or peak intensity. The wavelength at maximum radiant intensity decreases with an increase in temperature (Wien’s displacement law) [
70].
Nevertheless, real surfaces do not emit radiations like an idealized black body. The fraction of the emitted radiation from the real body is relative to a black body, which is known as spectral emissivity. However, spectral emissivity is temperature and wavelength-dependent. Therefore, it is challenging to obtain spectral emissivity of every material for each temperature and wavelength. Therefore, the direct application of Planck’s law for temperature correlation cannot be used. Instead, to overcome this challenge, there are three possibilities which are as follows:
For a single measurement, assume the emissivity and calculate the temperature (spectral method).
Make two measurements at different wavelengths and assume a relationship between the emissivities at each wavelength and calculate a single temperature (ratio method).
Make multiple measurements at different wavelengths and assume some functional form of the emissivity and find the best fit to the temperature and emissivity (multispectral method).
Mostly, the ratio method is used to calculate the actual temperature. In the ratio method, the two intensity measurements (
I1 and
I2 ) at two different wavelengths
λ1 and
λ2 are calculated. The ratio of intensities
I1 and
I2 are taken to calculate the temperature as given by Equation (3).
The difference between the two wavelengths (
λ1 and
λ2) chosen is very small so that it is assumed that the emissivities (
ϵ1 and
ϵ2) are equal. Once the constants
A1 and
A2 are known, the calibration curve can be calculated, which relates the intensity ratio to the temperature of the object irrespective of the emissivity. Therefore, the choice of the two wavelengths is very critical. Because too close wavelengths can lead to low signal and noise ratio from the sensors, i.e., the measurement will be dominated by the noise. If too distinct wavelengths are chosen, the assumption of equal emissivities will no longer be valid. Most of the engineering materials have a melting point above 1000 K and vaporization temperature around 3000 K. Therefore, most of the monitoring devices have detection ranges in the visible-near infrared region. Typically, for calibration of the sensors and to find the values of the constants
A1 and
A2, the tungsten halogen light source with known spectral radiance is used. The halogen lamp is placed inside the build chamber, and the spectral radiance measured by the sensors is then compared with the radiance obtained by the calibrated spectrometer. Then, the
A1 and
A2 values are computed [
70].
Moylan et al. [
77] also used a multispectral method to calculate the imaged temperature from captured infrared images using a hyperspectral camera in the L-PBF process. The imaged temperature can be calculated by using this method. It shall be noted that the imaged temperature is different from the true temperature, as the true temperature is highly dependent on the emissivity of the material, which is subjected to the temperature.
8. Overview of ML Techniques
In the L-PBF process, the quality of the final part and the reliability of the whole process are highly dependent on various process parameters, as discussed in
Section 3 and
Section 4. The above-discussed process parameters incorporate inconsistency in the part quality, which is difficult to monitor. The inconsistency during the process can be effectively controlled and monitored by using in situ monitoring systems. However, there are numerous problems associated with monitoring systems, which hinders the full exploitation of these systems. Firstly, the size of the data, real-time processing, and storage of the data are significant challenges. For example, consider a laser printing a part with geometrical tolerances of ±100 μm with a scanning speed of 100 mm/s. The sensors will have a data collection rate of ~10 kHz, i.e., one data point for every 10 μm to achieve a spatial resolution of 10 μm. Most of the researchers have reported a sampling rate of 50 kHz and used more than two sensing devices, such as a digital camera, photodiode, or combination of both. Therefore, if a single data value is stored in binary fashion, it occupies 32 bits. With a 50 kHz data sampling rate and with five sensing devices, the data will be stored at 1 MB/s. Therefore, if the machine runs for three days, it will generate at least 233 GB of data. The post-processability of this dataset and storage is difficult [
78]. Secondly, linking the obtained in situ sensing data to the quality of the product is a significant challenge. In recent years, the research community is working on integrating ML methods into AM.
Machine learning (ML) is a subset of Artificial Intelligence (AI) that can learn and improve in an automated fashion from experience without being explicitly programmed. The process of learning starts with data observation and data pattern recognition to allow algorithms to learn automatically and adjust actions accordingly. The main aim of the ML is to learn and improve from data without human intervention. The ML algorithms are used in AM for design and process optimization, in situ monitoring, inspection and validation, and cost estimation. The data used for training the ML algorithms decide the effectiveness of the ML approach. In other words, the ML algorithms are as good as the training dataset [
79].
ML algorithm can be broadly classified into three categories: supervised learning, unsupervised learning, and reinforcement learning. In supervised machine learning, the algorithm is trained with a labeled dataset. The labeled dataset is the dataset in which the output is known for the input variables. Therefore, the model is trained based on inferring the functional relationship between input and output variable. Supervised learning can be used for regression and classification problems. For instance, classifying the part quality as “good” and “bad” is a classification problem, whereas predicting the porosity level or mechanical properties of the part is a regression problem. In unsupervised learning, the output labels are not known for the input training dataset. The algorithm separates the training dataset into different clusters based on the relationship among input data. Unsupervised learning is useful in clustering problems such as detecting anomalous conditions. The third ML category, called reinforcement learning (RL), is learning by interacting with an environment. The RL algorithm learns from the consequences of its actions, and it selects its actions based on its experience and new choices, which is trial and error learning. The RL algorithm receives a numerical reward which encodes the success of an action’s outcome. The RL algorithm seeks to learn to select actions that maximize the accumulated reward over time. Applications of the RL algorithm are game theory and self-driving cars. The list of various ML algorithms is shown in
Figure 13 [
80].
There is another type ML algorithm called “semi-supervised learning”, which combines unsupervised and supervised learning. Semi-supervised learning combines the small or limited amount of the labeled dataset with a large amount of the unlabeled dataset during training the algorithm [
81]. This type of learning is beneficial in AM applications, where obtaining the labeled dataset is a very challenging task. The decision for using a type of ML approach is based on the available dataset, and specific output preferred. The use of the abovementioned ML approaches for monitoring the L-PBF process is discussed in the next sections.
9. Problem with ML Techniques
Although there are tremendous possibilities of the ML approach in the AM industry, there are a few limitations or problems associated with the AM methods that can have a deterministic effect on the ML outcomes.
Size of data: ML approaches are data-driven methods which require a sufficient amount of data for making accurate predictions. The amount of training data needed increases exponentially with a number of input variables. However, in some applications such as AM, data acquisition and labeling the training data is extremely difficult and expensive. For example, it is challenging to obtain a large amount of data for particular defects such as keyhole and lack of fusion in the L-PBF process. Thus, using neural networks that require a copious amount of data for defect detection can be a challenging task.
Lack of knowledge for feature extraction: Selecting good features that can capture the distinction in the dataset is most vital. Sometimes, it is very tricky to identify and extract these features. For example, it is challenging to identify the features that will distinguish an unstable melt pool signal from a stable melt pool signal in photodiode data.
Lack of labeled data: As discussed earlier, the supervised learning ML approach requires a labeled dataset for training. Therefore, a better understanding of the acquired data is needed to label it. However, sometimes it is challenging to label the data accurately and effectively. For example, in the case of melt pool in situ monitoring data, it is very tricky to identify the “acceptable” melt pool profile from the “unacceptable” melt pool profile. There are high chances of human error and misclassification. It can affect the accuracy of the whole model.
Machine learning training problems: Overfitting and underfitting are the most common problems that can occur while training machine learning models. Overfitting occurs when the model tries to fit every data point precisely in the training dataset. It makes the model vulnerable to noise and outliers. Usually, overfitting is most likely with non-parametric and non-linear models that are more flexible while learning a target function. For example, the Decision tree (DT) is a nonparametric algorithm that is very flexible and subjected to overfitting training data. Overfitting problem can be eliminated by running a tree after it has learned, to remove some of the detail it has picked up. Underfitting occurs when the model is unable to extract a reasonable relationship among training data points. An underfit model will perform poorly on training data and will not be able to generalize to new data. Drop out and regularization techniques can be used to overcome underfitting and overfitting problems [
82,
83].
In the next sections, we discuss the class-wise (supervised, unsupervised, semi-supervised) ML approaches used for in situ monitoring of the L-PBF process.
10. In Situ Data Processing Using ML
In this section, post-processing of the in situ monitoring data is presented as per the used ML approach classes. This section mostly focuses on in situ defects related to melt pool signatures and the powder layer spread. The use of the ML approach in other domains such as geometric control, cost estimation, process optimization, etc., is not covered in this review.
10.1. Supervised Learning Approach
Supervised learning is one of the most commonly used ML approaches for detecting the defect in the L-PBF process. The first step in supervised learning is to prepare a labeled training dataset. Labeling the in situ data is the most challenging and error-prone task, which can affect the overall accuracy of the supervised ML model. Therefore, labeling the in situ data, such as IR images, photodiode signals, pyrometer signals, can be done via making a statistical comparison between in situ data and CT images, which captures the ground truth labels. The same can be used for labeling the different clusters obtained by unsupervised learning. Gobert et al. and Petrich et al. [
84,
85] used a 36.3-megapixel digital single-lens reflex (DSLR) CCD camera (Nikon D800E) mounted inside the build chamber of EOS M280 (L-PBF system) to detect discontinuity defects such as overheating, pores and unmolten powder. The ground truth bales were extracted by comparing the post-CT scan data with captured in situ images. The labeled dataset was then used to train supervised ML approaches such as support vector machine (SVM) and neural network (NN). Imani et al. [
86] used ML techniques like SVM, K-NN, and NN to find the process parameters such as hatch distance, laser power, and scanning speed that likely to produce more porous parts. The link between process parameters and the location, size, and frequency of the pores was studied. Aminzadeh et al. [
87] used an 8.8 megapixel USB Digital Camera with high focus lenses to capture the post-printed images of every layer in L-PBF. They used Bayesian inference to detect the porosity and quality of the final part. The training dataset was labeled as “defective” and “non-defective” based on visual inspection. The frequency-domain features were extracted, and a trained Bayesian classifier was used to predict the quality of the part. Zhang et al. [
88] used a high-speed camera to capture process images such as melt pool, plume, and spatters. These images were used to train SVM classifiers and CNN to detect the process anomalies. The CNN model showed a higher accuracy of 92.7% compared to the SVM classifier, which showed an accuracy of 90.1%.
Baumgartl et al. [
89] used a convolutional neural network (CNN) to detect defects from thermographic images. CNN showed an average accuracy of 96.80%. The thermographic images were captured using an infrared camera, which was placed above the build chamber with an angle of 60
o to the build plate. Delamination and spatter defects were successfully identified and cross-validated with the CT scan. However, the model does not identify other defects, such as balling, lack of fusion, and keyhole.
Scime et al. [
90] used a one megapixel Photron FASTCAM Mini AX200 high-speed camera in the visible range to capture melt pool images. The machine learning technique, called Scale Invariant Feature Transforms (SIFT), was used to extract features from the captured melt pool signatures. The bag-of-words (or Keypoints) were used to obtain a scale-agnostic description of melt pool morphology. The melt pool morphology represents the shape of the melt pool, spatter, and vapor plume. With the ML approach, the author classified the individual melt pool morphologies into four categories, such as desirable, balling, under-melting, and keyhole porosities. A supervised classification ML technique called support vector machine (SVM) was used to train and test the model. The percentage of the melt pool morphologies linked to process parameters such as laser power and scan speed was obtained.
In another study, Scime et al. [
91] used a computer vision algorithm to predict the percentage of types of defects present in the part based on the powder bed images. Scime et al. extracted the regions of the images and classify such as anomaly-free, recoater hopping, recoater streaking, debris, superelevation, part failure, and incomplete spreading. These categories were used as the fingerprints for the computer vision algorithm. A percentage of the particular defect in the respective layer was classified. The approach did not use melt pool signatures and instead used powder bed spreading as their main signature. Repossini et al. [
92] used a high-speed camera to capture spatter images and used them as an indicator for process stability. They have developed a supervised learning logistic regression model to classify different energy density conditions to various quality states using spatters as a descriptor.
Some researchers also studied the acoustic signals to detect the defects in the L-PBF process using a supervised learning ML approach. For example, Ye et al. [
93] used deep belief networks (DBN) to analyze the acoustic signals to detect defects such as balling, keyhole, and cracking. Shevchik et al. [
94] used Bragg grating acoustic sensors to capture the acoustic signals during melting, solidification, and spattering processes. The time-domain captured signal was transformed into the frequency domain using the wavelet transformation technique. The spectral CNN was used to identify the particular defect signals. The presented sCNN model showed an accuracy of 83–89%.
10.2. Unsupervised Learning Approach
The use of unsupervised machine learning is limited in the field of the L-PBF process. However, unsupervised can be useful when obtaining the labeled training dataset is not possible. Another advantage of using unsupervised learning compared to supervised learning is that it does not require human interaction to the label training dataset. Grasso et al. [
10] demonstrated the use of the T-mode Principal Component Analysis (PCA) for image data obtained by an Olympus
TM I-speed 3 camera mounted outside the build chamber at an angle of 40° w.r.t build plate to define a spatial statistical descriptor and to detect local over-heating phenomena along the scan path by analyzing the intensity profile of each pixel. These local hotspots correspond to the regions where slow cooling occurred due to variation in heat flux; it can be observed at sharp corners and overhang structures. K-means clustering learning was applied to the spatially distributed PCA descriptors to detect a defect in an automated fashion. Although an iterative updating of the k-means clustering based on the new dataset allowed to detect defects in complex shapes, the approach is dependent on the comparisons between data collected at different layers or on the signal from successful builds of the same geometry, which limits its applicability to other situations. Grasso et al. [
95] used an off-axis IR camera to monitor the plume of zinc material to design a data-driven and automated approach for process monitoring. The region of interest (ROI), which is the plume, was extracted from the IR images. A multivariate control-charting method was proposed to monitor the ROI features, i.e., mean intensity and area of the plume, to detect the deviation from the stable plume patterns. However, in this work, the author did not take into consideration the morphology of the melt pool.
10.3. Semi-Supervised Learning
Okaro et al. [
96] proposed another perspective of the ML approach for data treatment and predicted the quality of the parts based on their mechanical property as a descriptor. Key features were extracted from the photodiode signals, and a semi-supervised classification algorithm called “Gaussian Mixture Model-Expectation Maximization (GMM-EM)” was applied to classify the samples as “faulty” and “acceptable” based on the ultimate tensile strength of the tensile bars. This approach showed the possibility for automatic certification of the L-PBF parts based on their mechanical properties. However, the method of Okaro et al. does not illustrate any possibility to detect the defects in the parts, which is the cause of inferior mechanical properties.
Yuan et al. [
97] used a high-speed 1 kHz video camera, with its focal point moving along with the laser spot, to acquire in situ video data to monitor scan track width and continuity. Image processing algorithms were used to label a small amount of data using structured light measurements. The labeled in situ videos were used to train a semi-supervised CNN model based on the temporal ensemble method, with a small amount of labeled data and a large amount of unlabeled data. Yuan et al. showed that the semi-supervised CNN approach performs better than the supervised CNN approach. They also studied the average measuring time for 100 videos, which was 1.4 ms and concluded that the trained CNN approach is adequately fast to monitor in real-time. The summary of the discussed literature is presented in
Table 1.
The final aim of in situ monitoring is to improve the overall reliability of the process via a feedback control loop. This will significantly reduce the material waste and time needed to qualify the part for quality assurance. Yao et al. [
98] developed a closed-loop feedback control system for real-time monitoring of the L-PBF process. Firstly, the defect level of each printed layer was calculated based on irregular and non-homogeneous patterns using multifractal analysis. Secondly, the composite index was decided for each porosity level based on Hotelling T
2 statistics from the multifractal spectrum. Finally, the stochastic dynamics of the layer to layer defect conditions were modeled as a Markov process to determine an optimal control policy.
11. Commercial Monitoring Systems
Due to the increasing demand for L-PBF systems in manufacturing industries, the commercial suppliers of L-PBF systems are now equipped with the inbuilt in situ sensing modules. The monitoring system layout, detection range, and types of sensors differentiate different commercial supplier monitoring systems. There is no common consensus on the detection range of the melt pool emissions among different suppliers. The reason to choose a specific detection range is protected under the confidentiality clause by the supplier. Therefore, each module has its disadvantages and advantages. For example, the EOSTATE Optical Tomography (OT) module detects the light emitted from the met pool for every layer. The EOSTATE Exposure analysis tool provided by EOS GmbH uses a statistical algorithm to detect so-called “hotspots” and “cold spots”, which are the regions of high and low intensity compared to rest of the layer.
Similarly, Melt Pool Monitoring (MPM) provided by SLM solutions captures the melt pool emissions in the near-infrared region by using two photodiodes with different spectral ranges. Then, captured thermal emissions can be studied in the software module supplied by SLM solutions in a layer by layer fashion. The Layer Control System (LCS), also supplied by SLM solutions, uses the visible range camera to monitor the quality of the powder bed spread. After the powder bed spreading, an automatic algorithm processes the captured image in real-time and automatically activates the recoating operation in case of inhomogeneous powder spread. Renishaw supplied the InfiAM module composed of MeltView, which captures the in situ data in a wide spectral range and LaserView to monitor the part build and laser power, respectively. It provides the captured data in 2D and 3D view as the build progresses.
Table 2 summarizes the in situ sensing equipment with their sensing process signature capabilities. It shall be noted that the author’s aim is not to comment on the capabilities of the available commercial systems as the authors have not personally used all these systems.
12. Conclusions
From the literature available, it is evident that the in situ sensing of the L-PBF process is still in the infancy stage. Much of the research conducted so far focuses on developing in situ sensing systems to understand the process and less concentrated on detecting defects in real-time. The ultimate goal of in situ sensing in the L-PBF process is to develop a closed feedback control system to improve and control the quality assurance in real-time. Understanding the process signatures and their link to the potential defect in the final part is the first step towards this. Commercial systems equipped with monitoring systems work on a black box phenomenon, and the critical information obtained during the process is protected by the manufacturer. The large size of the data generated for a particular job is another limitation of these systems. Thus, there is a huge demand for other advanced machine learning models for treating and extracting crucial information from the available captured data. To date, only a few researchers have used a machine learning approach to counter this problem.
The complexity of the L-PBF process is a significant challenge to understand all the phenomena occurring due to controllable and uncontrollable parameters. Therefore, monitoring each stage of the process, such as powder health, powder spreadability, build chamber inert gas flow, oxygen content, melt pool stability, etc., are closely interlinked. Therefore, linking the different process states such as powder bed spreading, layer heatmap, and melt pool stability can enhance the quality control in real-time. Real-time monitoring will also limit the use of other quality checks, such as non-destructive testing, which costs a lot of time and money. The improved reliability and repeatability of the L-PBF process will allow risk-averse industries to adopt the process entirely.
Author Contributions
Conceptualization and methodology, P.Y., E.L., O.R., C.A., E.L.G.; investigation, E.L., O.R., C.A.; writing—original draft preparation, P.Y.; writing—review and editing, P.Y., E.L., O.R., C.R.; visualization, P.Y.; supervision, E.L., O.R., C.R., E.L.G.; All authors have read and agreed to the published version of the manuscript.
Funding
This work was conducted as part of the “ENABLE” project funded by the European Union’s Marie Sklodowska-Curie Actions (MSCA) Innovative Training Networks (ITN) H2020-MSCA-ITN-2017 under the grant agreement Number 764979.
Acknowledgments
The authors would like to thank the T-ADD team at SIRRIS for providing valuable suggestions and seminars related to the L-PBF process.
Conflicts of Interest
The authors declare no conflict of interest.
Abbreviations
| AI | Artificial Intelligence |
| AM | Additive Manufacturing |
| ANN | Artificial Neural Networks |
| ASTM | American Society for Testing and Materials |
| CCD | Charge-Coupled Device |
| CMOS | Complementary Metal–Oxide–Semiconductor |
| CNN | Convolutional Neural Network |
| DBN | Deep Belief Networks |
| DMLS | Direct Melt Laser Sintering |
| DT | Decision Tree |
| EMF | Electromotive Force |
| GMM-EM | Gaussian Mixture Model- Expectation-Maximization |
| KNN | k-Nearest Neighbors |
| LOF | Lack of Fusion |
| L-PBF | Laser-Powder Bed Fusion |
| ML | Machine Learning |
| NN | Neural Network |
| PCA | Principal Component Analysis |
| RL | Reinforcement Learning |
| SIFT | Scale Invariant Feature Transforms |
| SLM | Selective Laser Melting |
| SVM | Support Vector Machine |
| TGM | Temperature Gradient Mechanism |
References
- ASTM Standard. ISO/ASTM 52900: 2015 Additive Manufacturing-General Principles-Terminology; ASTM F2792-10e1; ASTM Standard: West Kanshohoken, PA, USA, 2012. [Google Scholar]
- Mani, M.; Feng, S.; Lane, B.; Donmez, A.; Moylan, S.; Fesperman, R. Measurement Science Needs for Real-Time Control of Additive Manufacturing Powder Bed Fusion Processes. 2015. Available online: https://www.researchgate.net/publication/279178288_Measurement_Science_Needs_for_Real-time_Control_of_Additive_Manufacturing_Powder_Bed_Fusion_Processes (accessed on 17 June 2020).
- Galy, C.; Le Guen, E.; Lacoste, E.; Arvieu, C. Main defects observed in aluminum alloy parts produced by SLM: From causes to consequences. Addit. Manuf. 2018, 22, 165–175. [Google Scholar] [CrossRef]
- Tapia, G.; Elwany, A. A review on process monitoring and control in metal-based additive manufacturing. J. Manuf. Sci. Eng. 2014, 136, 060801. [Google Scholar] [CrossRef]
- Khoda, A.; Ozbolat, I.T.; Koc, B. Designing heterogeneous porous tissue scaffolds for additive manufacturing processes. Comput. Aided Des. 2013, 45, 1507–1523. [Google Scholar] [CrossRef] [Green Version]
- Huang, Q.; Zhang, J.; Sabbaghi, A.; Dasgupta, T. Optimal offline compensation of shape shrinkage for three-dimensional printing processes. Iie Trans. 2015, 47, 431–441. [Google Scholar] [CrossRef]
- Everton, S.K.; Hirsch, M.; Stravroulakis, P.; Leach, R.K.; Clare, A.T. Review of in-situ process monitoring and in-situ metrology for metal additive manufacturing. Mater. Des. 2016, 95, 431–445. [Google Scholar] [CrossRef]
- Spears, T.G.; Gold, S.A. In-process sensing in selective laser melting (SLM) additive manufacturing. Integr. Mater. Manuf. Innov. 2016, 5, 16–40. [Google Scholar] [CrossRef] [Green Version]
- Grasso, M.; Colosimo, B.M. Process defects and in situ monitoring methods in metal powder bed fusion: A review. Meas. Sci. Technol. 2017, 28, 044005. [Google Scholar] [CrossRef] [Green Version]
- Grasso, M.; Laguzza, V.; Semeraro, Q.; Colosimo, B.M. In-process monitoring of selective laser melting: Spatial detection of defects via image data analysis. J. Manuf. Sci. Eng. 2017, 139, 051001. [Google Scholar] [CrossRef]
- You, D.; Gao, X.; Katayama, S. Review of laser welding monitoring. Sci. Technol. Weld. Join. 2014, 19, 181–201. [Google Scholar] [CrossRef]
- Clijsters, S.; Craeghs, T.; Buls, S.; Kempen, K.; Kruth, J.-P. In situ quality control of the selective laser melting process using a high-speed, real-time melt pool monitoring system. Int. J. Adv. Manuf. Technol. 2014, 75, 1089–1101. [Google Scholar] [CrossRef]
- Craeghs, T.; Bechmann, F.; Berumen, S.; Kruth, J.-P. Feedback control of Layerwise Laser Melting using optical sensors. Phys. Procedia 2010, 5, 505–514. [Google Scholar] [CrossRef] [Green Version]
- Craeghs, T.; Clijsters, S.; Kruth, J.-P.; Bechmann, F.; Ebert, M.-C. Detection of process failures in layerwise laser melting with optical process monitoring. Phys. Procedia 2012, 39, 753–759. [Google Scholar] [CrossRef] [Green Version]
- Craeghs, T.; Clijsters, S.; Yasa, E.; Bechmann, F.; Berumen, S.; Kruth, J.-P. Determination of geometrical factors in Layerwise Laser Melting using optical process monitoring. Opt. Lasers Eng. 2011, 49, 1440–1446. [Google Scholar] [CrossRef]
- Demir, A.G.; Mazzoleni, L.; Caprio, L.; Pacher, M.; Previtali, B. Complementary use of pulsed and continuous wave emission modes to stabilize melt pool geometry in laser powder bed fusion. Opt. Laser Technol. 2019, 113, 15–26. [Google Scholar] [CrossRef]
- Dobrzański, L.A.; Dobrzańska-Danikiewicz, A.D.; Achtelik-Franczak, A.; Dobrzański, L.B.; Szindler, M.; Gaweł, T.G. Porous selective laser melted Ti and Ti6Al4V materials for medical applications. In Powder Metallurgy–Fundamentals and Case Studies; InTech: Rijeka, Croatia, 2017; pp. 161–181. [Google Scholar]
- Fischer, P.; Romano, V.; Weber, H.-P.; Karapatis, N.; Boillat, E.; Glardon, R. Sintering of commercially pure titanium powder with a Nd: YAG laser source. Acta Mater. 2003, 51, 1651–1662. [Google Scholar] [CrossRef]
- Hebert, R.J. metallurgical aspects of powder bed metal additive manufacturing. J. Mater. Sci. 2016, 51, 1165–1175. [Google Scholar] [CrossRef]
- Kruth, J.; Bartscher, M.; Carmignato, S.; Schmitt, R.; De Chiffre, I.; Weckenmann, A. Computed tomography for dimensional metrology. CIRP Ann. 2011, 60, 821–842. [Google Scholar]
- Song, B.; Dong, S.; Deng, S.; Liao, H.; Coddet, C. Microstructure and tensile properties of iron parts fabricated by selective laser melting. Opt. Laser Technol. 2014, 56, 451–460. [Google Scholar] [CrossRef]
- Karimi, P.; Raza, T.; Andersson, J.; Svensson, L.-E. Influence of laser exposure time and point distance on 75-μm-thick layer of selective laser melted Alloy 718. Int. J. Adv. Manuf. Technol. 2018, 94, 2199–2207. [Google Scholar] [CrossRef] [Green Version]
- Gu, H.; Gong, H.; Pal, D.; Rafi, K.; Starr, T.; Stucker, B. Influences of energy density on porosity and microstructure of selective laser melted 17-4PH stainless steel. In Proceedings of the 2013 Solid Freeform Fabrication Symposium, Austin, TX, USA, 12–14 August 2013. [Google Scholar]
- Slotwinski, J.A.; Garboczi, E.J. Porosity of additive manufacturing parts for process monitoring. In AIP Conference Proceedings; American Institute of Physics: College Park, MD, USA, 2014; pp. 1197–1204. [Google Scholar]
- Weingarten, C.; Buchbinder, D.; Pirch, N.; Meiners, W.; Wissenbach, K.; Poprawe, R. Formation and reduction of hydrogen porosity during selective laser melting of AlSi10Mg. J. Mater. Process. Technol. 2015, 221, 112–120. [Google Scholar]
- Sharratt, B.M. Non-Destructive Techniques and Technologies for Qualification of Additive Manufactured Parts and Processes; Sharratt Research and Consulting Inc.: Victoria, BC, USA, 2015. [Google Scholar]
- Thijs, L.; Verhaeghe, F.; Craeghs, T.; Van Humbeeck, J.; Kruth, J.-P. A study of the microstructural evolution during selective laser melting of Ti–6Al–4V. Acta Mater. 2010, 58, 3303–3312. [Google Scholar] [CrossRef]
- Das, S. Physical aspects of process control in selective laser sintering of metals. Adv. Eng. Mater. 2003, 5, 701–711. [Google Scholar] [CrossRef]
- Gong, H.; Rafi, K.; Gu, H.; Starr, T.; Stucker, B. Analysis of defect generation in Ti–6Al–4V parts made using powder bed fusion additive manufacturing processes. Addit. Manuf. 2014, 1, 87–98. [Google Scholar] [CrossRef]
- Aboulkhair, N.T.; Everitt, N.M.; Ashcroft, I.; Tuck, C. Reducing porosity in AlSi10Mg parts processed by selective laser melting. Addit. Manuf. 2014, 1, 77–86. [Google Scholar] [CrossRef]
- Song, B.; Dong, S.; Liu, Q.; Liao, H.; Coddet, C. Vacuum heat treatment of iron parts produced by selective laser melting: Microstructure, residual stress and tensile behavior. Mater. Des. 2014, 54, 727–733. [Google Scholar] [CrossRef]
- Rafi, H.; Karthik, N.; Gong, H.; Starr, T.L.; Stucker, B.E. Microstructures and mechanical properties of Ti6Al4V parts fabricated by selective laser melting and electron beam melting. J. Mater. Eng. Perform. 2013, 22, 3872–3883. [Google Scholar] [CrossRef]
- Cunningham, R.; Zhao, C.; Parab, N.; Kantzos, C.; Pauza, J.; Fezzaa, K.; Sun, T.; Rollett, A.D. Keyhole threshold and morphology in laser melting revealed by ultrahigh-speed x-ray imaging. Science 2019, 363, 849–852. [Google Scholar] [CrossRef]
- Liu, Q.C.; Elambasseril, J.; Sun, S.J.; Leary, M.; Brandt, M.; Sharp, P.K. The effect of manufacturing defects on the fatigue behaviour of Ti-6Al-4V specimens fabricated using selective laser melting. In Advanced Materials Research; Trans Tech Publications Ltd.: Kapellweg, Switzerland, 2014; pp. 1519–1524. [Google Scholar]
- Vilaro, T.; Colin, C.; Bartout, J.-D. As-fabricated and heat-treated microstructures of the Ti-6Al-4V alloy processed by selective laser melting. Metall. Mater. Trans. A 2011, 42, 3190–3199. [Google Scholar] [CrossRef]
- Read, N.; Wang, W.; Essa, K.; Attallah, M.M. Selective laser melting of AlSi10Mg alloy: Process optimisation and mechanical properties development. Mater. Des. 2015, 65, 417–424. [Google Scholar] [CrossRef] [Green Version]
- Antony, K.; Arivazhagan, N. Studies on energy penetration and marangoni effect during laser melting process. J. Eng. Sci. Technol. 2015, 10, 509–525. [Google Scholar]
- Gu, D.; Shen, Y. Balling phenomena in direct laser sintering of stainless steel powder: Metallurgical mechanisms and control methods. Mater. Des. 2009, 30, 2903–2910. [Google Scholar] [CrossRef]
- Li, R.; Liu, J.; Shi, Y.; Wang, L.; Jiang, W. Balling behavior of stainless steel and nickel powder during selective laser melting process. Int. J. Adv. Manuf. Technol. 2012, 59, 1025–1035. [Google Scholar] [CrossRef]
- Tolochko, N.K.; Mozzharov, S.E.; Yadroitsev, I.A.; Laoui, T.; Froyen, L.; Titov, V.I.; Ignatiev, M.B. Balling processes during selective laser treatment of powders. Rapid Prototyp. J. 2004, 10. [Google Scholar] [CrossRef]
- Mercelis, P.; Kruth, J.P. Residual stresses in selective laser sintering and selective laser melting. Rapid Prototyp. J. 2006, 12. [Google Scholar] [CrossRef]
- Harrison, N.J.; Todd, I.; Mumtaz, K. Reduction of micro-cracking in nickel superalloys processed by Selective Laser Melting: A fundamental alloy design approach. Acta Mater. 2015, 94, 59–68. [Google Scholar] [CrossRef] [Green Version]
- Mercelis, P. Control of Selective Laser Sintering and Selective Laser Melting Processes. Ph.D. Thesis, DentWise Division, Leuven, Belgium, 2007. [Google Scholar]
- Carter, L.N.; Martin, C.; Withers, P.J.; Attallah, M.M. The influence of the laser scan strategy on grain structure and cracking behaviour in SLM powder-bed fabricated nickel superalloy. J. Alloy. Compd. 2014, 615, 338–347. [Google Scholar] [CrossRef]
- Carter, L.N.; Attallah, M.M.; Reed, R.C. Laser powder bed fabrication of nickel-base superalloys: Influence of parameters; characterisation, quantification and mitigation of cracking. Superalloys 2012, 2012, 577–586. [Google Scholar]
- Carter, L.N.; Wang, X.; Read, N.; Khan, R.; Aristizabal, M.; Essa, K.; Attallah, M.M. Process optimisation of selective laser melting using energy density model for nickel based superalloys. Mater. Sci. Technol. 2016, 32, 657–661. [Google Scholar] [CrossRef]
- Zhao, X.; Lin, X.; Chen, J.; Xue, L.; Huang, W. The effect of hot isostatic pressing on crack healing, microstructure, mechanical properties of Rene88DT superalloy prepared by laser solid forming. Mater. Sci. Technol. A 2009, 504, 129–134. [Google Scholar] [CrossRef]
- Jing, C.; Xin, L.; Tao, W.; Haiou, Y.; Weidong, H. The hot cracking mechanism of 316L stainless steel cladding in rapid laser forming process. Rare Met. Mater. Eng. 2003, 32, 183–186. [Google Scholar]
- Kruth, J.-P.; Deckers, J.; Yasa, E.; Wauthlé, R. Assessing and comparing influencing factors of residual stresses in selective laser melting using a novel analysis method. Proceedings of the institution of mechanical engineers. Part B J. Eng. Manuf. 2012, 226, 980–991. [Google Scholar] [CrossRef]
- Mugwagwa, L.; Dimitrov, D.; Matope, S.; Yadroitsev, I. Influence of process parameters on residual stress related distortions in selective laser melting. Procedia Manuf. 2018, 21, 92–99. [Google Scholar] [CrossRef]
- Mishurova, T.; Cabeza, S.; Thiede, T.; Nadammal, N.; Kromm, A.; Klaus, M.; Genzel, C.; Haberland, C.; Bruno, G. The influence of the support structure on residual stress and distortion in SLM Inconel 718 parts. Metall. Mater. Trans. A 2018, 49, 3038–3046. [Google Scholar] [CrossRef] [Green Version]
- Song, B.; Zhao, X.; Li, S.; Han, C.; Wei, Q.; Wen, S.; Liu, J.; Shi, Y. Differences in microstructure and properties between selective laser melting and traditional manufacturing for fabrication of metal parts: A review. Front. Mech. Eng. 2015, 10, 111–125. [Google Scholar] [CrossRef]
- Townsend, A.; Senin, N.; Blunt, L.; Leach, R.; Taylor, J. Surface texture metrology for metal additive manufacturing: A review. Precis. Eng. 2016, 46, 34–47. [Google Scholar] [CrossRef] [Green Version]
- Strano, G.; Hao, L.; Everson, R.M.; Evans, K.E. Surface roughness analysis, modelling and prediction in selective laser melting. J. Mater. Process. Technol. 2013, 213, 589–597. [Google Scholar] [CrossRef]
- Fox, J.C.; Moylan, S.P.; Lane, B.M. Effect of process parameters on the surface roughness of overhanging structures in laser powder bed fusion additive manufacturing. Procedia Cirp 2016, 45, 131–134. [Google Scholar] [CrossRef] [Green Version]
- Yadroitsev, I.; Bertrand, P.; Smurov, I. Parametric analysis of the selective laser melting process. Appl. Surf. Sci. 2007, 253, 8064–8069. [Google Scholar] [CrossRef]
- Sun, K.; Peng, W.; Yang, L.; Fang, L. Effect of SLM processing parameters on microstructures and mechanical properties of Al0. 5CoCrFeNi high entropy alloys. Metals 2020, 10, 292. [Google Scholar] [CrossRef] [Green Version]
- Zenzinger, G.; Bamberg, J.; Ladewig, A.; Hess, T.; Henkel, B.; Satzger, W. Process monitoring of additive manufacturing by using optical tomography. In AIP Conference Proceedings; American Institute of Physics: College Park, MD, USA, 2015; pp. 164–170. [Google Scholar]
- Kurzynowski, T.; Chlebus, E.; Kuźnicka, B.; Reiner, J. Parameters in selective laser melting for processing metallic powders. In High Power Laser Materials Processing: Lasers, Beam Delivery, Diagnostics, and Applications; International Society for Optics and Photonics: Bellingham, DC, USA, 2012; p. 823914. [Google Scholar]
- Hoffman, J.; Szymański, Z. Time-dependent spectroscopy of plasma plume under laser welding conditions. J. Phys. D Appl. Phys. 2004, 37, 1792. [Google Scholar] [CrossRef]
- Hauser, C.; Childs, T.; Dalgarno, K.; Eane, R. Atmospheric control during direct selective laser sintering of stainless steel 314S powder. 1999. Available online: https://repositories.lib.utexas.edu/bitstream/handle/2152/73605/1999-030-Hauser.pdf?sequence=2&isAllowed=y (accessed on 18 June 2020).
- Lott, P.; Schleifenbaum, H.; Meiners, W.; Wissenbach, K.; Hinke, C.; Bültmann, J. Design of an optical system for the in situ process monitoring of selective laser melting (SLM). Phys. Procedia 2011, 12, 683–690. [Google Scholar] [CrossRef]
- Smith, R.J.; Hirsch, M.; Patel, R.; Li, W.; Clare, A.T.; Sharples, S.D. Spatially resolved acoustic spectroscopy for selective laser melting. J. Mater. Process. Technol. 2016, 236, 93–102. [Google Scholar] [CrossRef]
- Guan, G.; Hirsch, M.; Syam, W.P.; Leach, R.K.; Huang, Z.; Clare, A.T. Loose powder detection and surface characterization in selective laser sintering via optical coherence tomography. Proc. R. Soc. A Math. Phys. Eng. Sci. 2016, 472, 20160201. [Google Scholar] [CrossRef]
- Guan, G.; Hirsch, M.; Lu, Z.H.; Childs, D.T.; Matcher, S.J.; Goodridge, R.; Groom, K.M.; Clare, A.T. Evaluation of selective laser sintering processes by optical coherence tomography. Mater. Des. 2015, 88, 837–846. [Google Scholar] [CrossRef]
- Wang, H. Materials’ fundamental issues of laser additive manufacturing for high-performance large metallic components. Acta Aeronaut. Astronaut. Sin. 2014, 35, 2690–2698. [Google Scholar]
- Caiazzo, F.; Cardaropoli, F.; Alfieri, V.; Sergi, V.; Cuccaro, L. Experimental analysis of Selective Laser Melting process for Ti-6Al-4V turbine blade manufacturing. In Proceedings of the XIX International Symposium on High-Power Laser Systems and Applications 2012, Nara, Japan, 26–31 August 2012; p. 86771H. [Google Scholar]
- Yan, C.; Hao, L.; Hussein, A.; Young, P. Ti–6Al–4V triply periodic minimal surface structures for bone implants fabricated via selective laser melting. J. Mech. Behav. Biomed. Mater. 2015, 51, 61–73. [Google Scholar] [CrossRef] [PubMed] [Green Version]
- Purtonen, T.; Kalliosaari, A.; Salminen, A. Monitoring and adaptive control of laser processes. Phys. Procedia 2014, 56, 1218–1231. [Google Scholar] [CrossRef] [Green Version]
- Coates, P.; Lowe, D. The Fundamentals of Radiation Thermometers; CRC Press: Boca Raton, FL, USA, 2016. [Google Scholar]
- Held, G. Introduction to Light Emitting Diode Technology and Applications; CRC press: Boca Raton, FL, USA, 2016. [Google Scholar]
- Bi, G.; Gasser, A.; Wissenbach, K.; Drenker, A.; Poprawe, R. Identification and qualification of temperature signal for monitoring and control in laser cladding. Opt. Lasers Eng. 2006, 44, 1348–1359. [Google Scholar] [CrossRef]
- Bi, G.; Schürmann, B.; Gasser, A.; Wissenbach, K.; Poprawe, R. Development and qualification of a novel laser-cladding head with integrated sensors. Int. J. Mach. Tools Manuf. 2007, 47, 555–561. [Google Scholar] [CrossRef]
- Fathi, A.; Khajepour, A.; Durali, M.; Toyserkani, E. Geometry control of the deposited layer in a nonplanar laser cladding process using a variable structure controller. J. Manuf. Sci. Eng. 2008, 130, 031003. [Google Scholar] [CrossRef]
- Zeinali, M.; Khajepour, A. Height control in laser cladding using adaptive sliding mode technique: Theory and experiment. J. Manuf. Sci. Eng. 2010, 132, 041016. [Google Scholar] [CrossRef]
- Salehi, D.; Brandt, M. Melt pool temperature control using LabVIEW in Nd: YAG laser blown powder cladding process. Int. J. Adv. Manuf. Technol. 2006, 29, 273–278. [Google Scholar] [CrossRef]
- Moylan, S.; Whitenton, E.; Lane, B.; Slotwinski, J. Infrared thermography for laser-based powder bed fusion additive manufacturing processes. In AIP Conference Proceedings; American Institute of Physics: College Park, MD, USA, 2014; pp. 1191–1196. [Google Scholar]
- Li, Y.; Gu, D. Thermal behavior during selective laser melting of commercially pure titanium powder: Numerical simulation and experimental study. Addit. Manuf. 2014, 1, 99–109. [Google Scholar] [CrossRef]
- Wuest, T.; Weimer, D.; Irgens, C.; Thoben, K.-D. Machine learning in manufacturing: Advantages, challenges, and applications. Prod. Manuf. Res. 2016, 4, 23–45. [Google Scholar] [CrossRef] [Green Version]
- Alpaydin, E. Introduction to Machine Learning; MIT Press: Cambridge, MA, USA, 2020. [Google Scholar]
- Chapelle, O.; Scholkopf, B.; Zien, A. Semi-supervised learning (chapelle, o. et al., eds.; 2006). IEEE Trans. Neural Netw. 2009, 20, 542. [Google Scholar] [CrossRef]
- Ng, A.Y. Feature selection, L 1 vs. L 2 regularization, and rotational invariance. In Proceedings of the Twenty-First International Conference on Machine Learning, New York, NY, USA, 4–8 July 2004; 2004; p. 78. [Google Scholar]
- Srivastava, N.; Hinton, G.; Krizhevsky, A.; Sutskever, I.; Salakhutdinov, R. Dropout: A simple way to prevent neural networks from overfitting. J. Mach. Learn. Res. 1929, 15, 1929–1958. [Google Scholar]
- Petrich, J.; Gobert, C.; Phoha, S.; Nassar, A.R.; Reutzel, E.W. Machine learning for defect detection for PBFAM using high resolution layerwise imaging coupled with post-build CT scans. In Proceedings of the 27th International Solid Freeform Fabrication Symposium, Austin, TX, USA, 7–9 August 2017. [Google Scholar]
- Gobert, C.; Reutzel, E.W.; Petrich, J.; Nassar, A.R.; Phoha, S. Application of supervised machine learning for defect detection during metallic powder bed fusion additive manufacturing using high resolution imaging. Addit. Manuf. 2018, 21, 517–528. [Google Scholar] [CrossRef]
- Imani, F.; Gaikwad, A.; Montazeri, M.; Rao, P.; Yang, H.; Reutzel, E. Layerwise in-process quality monitoring in laser powder bed fusion. In Proceedings of the ASME 2018 13th International Manufacturing Science and Engineering Conference, College Station, TX, USA, 18–22 June 2018. [Google Scholar]
- Aminzadeh, M.; Kurfess, T.R. Online quality inspection using Bayesian classification in powder-bed additive manufacturing from high-resolution visual camera images. J. Intell. Manuf. 2019, 30, 2505–2523. [Google Scholar] [CrossRef]
- Zhang, Y.; Hong, G.S.; Ye, D.; Zhu, K.; Fuh, J.Y. Extraction and evaluation of melt pool, plume and spatter information for powder-bed fusion AM process monitoring. Mater. Des. 2018, 156, 458–469. [Google Scholar] [CrossRef]
- Baumgartl, H.; Tomas, J.; Buettner, R.; Merkel, M. A deep learning-based model for defect detection in laser-powder bed fusion using in-situ thermographic monitoring. Prog. Addit. Manuf. 2020, 1–9. [Google Scholar] [CrossRef] [Green Version]
- Scime, L.; Beuth, J. Using machine learning to identify in-situ melt pool signatures indicative of flaw formation in a laser powder bed fusion additive manufacturing process. Addit. Manuf. 2019, 25, 151–165. [Google Scholar] [CrossRef]
- Scime, L.; Beuth, J. Anomaly detection and classification in a laser powder bed additive manufacturing process using a trained computer vision algorithm. Addit. Manuf. 2018, 19, 114–126. [Google Scholar] [CrossRef]
- Repossini, G.; Laguzza, V.; Grasso, M.; Colosimo, B.M. On the use of spatter signature for in-situ monitoring of Laser Powder Bed Fusion. Addit. Manuf. 2017, 16, 35–48. [Google Scholar] [CrossRef]
- Ye, D.; Hong, G.S.; Zhang, Y.; Zhu, K.; Fuh, J.Y.H. Defect detection in selective laser melting technology by acoustic signals with deep belief networks. Int. J. Adv. Manuf. Technol. 2018, 96, 2791–2801. [Google Scholar] [CrossRef]
- Shevchik, S.A.; Kenel, C.; Leinenbach, C.; Wasmer, K. Acoustic emission for in situ quality monitoring in additive manufacturing using spectral convolutional neural networks. Addit. Manuf. 2018, 21, 598–604. [Google Scholar] [CrossRef]
- Grasso, M.; Demir, A.; Previtali, B.; Colosimo, B. In situ monitoring of selective laser melting of zinc powder via infrared imaging of the process plume. Robot. Comput. Integr. Manuf. 2018, 49, 229–239. [Google Scholar] [CrossRef]
- Okaro, I.A.; Jayasinghe, S.; Sutcliffe, C.; Black, K.; Paoletti, P.; Green, P.L. Automatic fault detection for laser powder-bed fusion using semi-supervised machine learning. Addit. Manuf. 2019, 27, 42–53. [Google Scholar] [CrossRef]
- Yuan, B.; Giera, B.; Guss, G.; McMains, S. Semi-Supervised Learning for Selective Laser Melting Monitoring via In-Situ Videos; Lawrence Livermore National Lab.(LLNL): Livermore, CA, USA, 2018. [Google Scholar]
- Yao, B.; Imani, F.; Yang, H. Markov decision process for image-guided additive manufacturing. IEEE Robot. Autom. Lett. 2018, 3, 2792–2798. [Google Scholar] [CrossRef]
- Achieve the Highest Possible Quality in Series Production Thanks to LaserCUSING ®, n.d. Available online: www.concept-laser.de (accessed on 30 March 2020).
- Monitoring for 3D Printing Systems, (n.d.). Available online: https://www.eos.info/software/monitoring-software/meltpool-monitoring (accessed on 30 March 2020).
- Alberts, D.; Schwarze, D.; Witt, G. In Situ Melt Pool Monitoring and the Correlation to Part Density of Inconel® 718 for Quality Assurance in Selective Laser Melting. Available online: https://pdfs.semanticscholar.org/e410/17f193cd01fbb30b97ef140c698ba48e609d.pdf (accessed on 17 June 2020).
- InfiniAM Spectral, (n.d.). Available online: https://www.renishaw.com/en/infiniam-spectral-42310 (accessed on 30 March 2020).
- Monitoring TruPrint | TRUMPF, (n.d.). Available online: https://www.trumpf.com/en_US/products/services/services-machines-systems-and-lasers/monitoring-analysis/monitoring-truprint/ (accessed on 30 March 2020).
- Sigma Labs—Quality Assurance 3D Printing and Additive Manufacturing, (n.d.). Available online: https://sigmalabsinc.com/?page=products (accessed on 30 March 2020).
© 2020 by the authors. Licensee MDPI, Basel, Switzerland. This article is an open access article distributed under the terms and conditions of the Creative Commons Attribution (CC BY) license (http://creativecommons.org/licenses/by/4.0/).


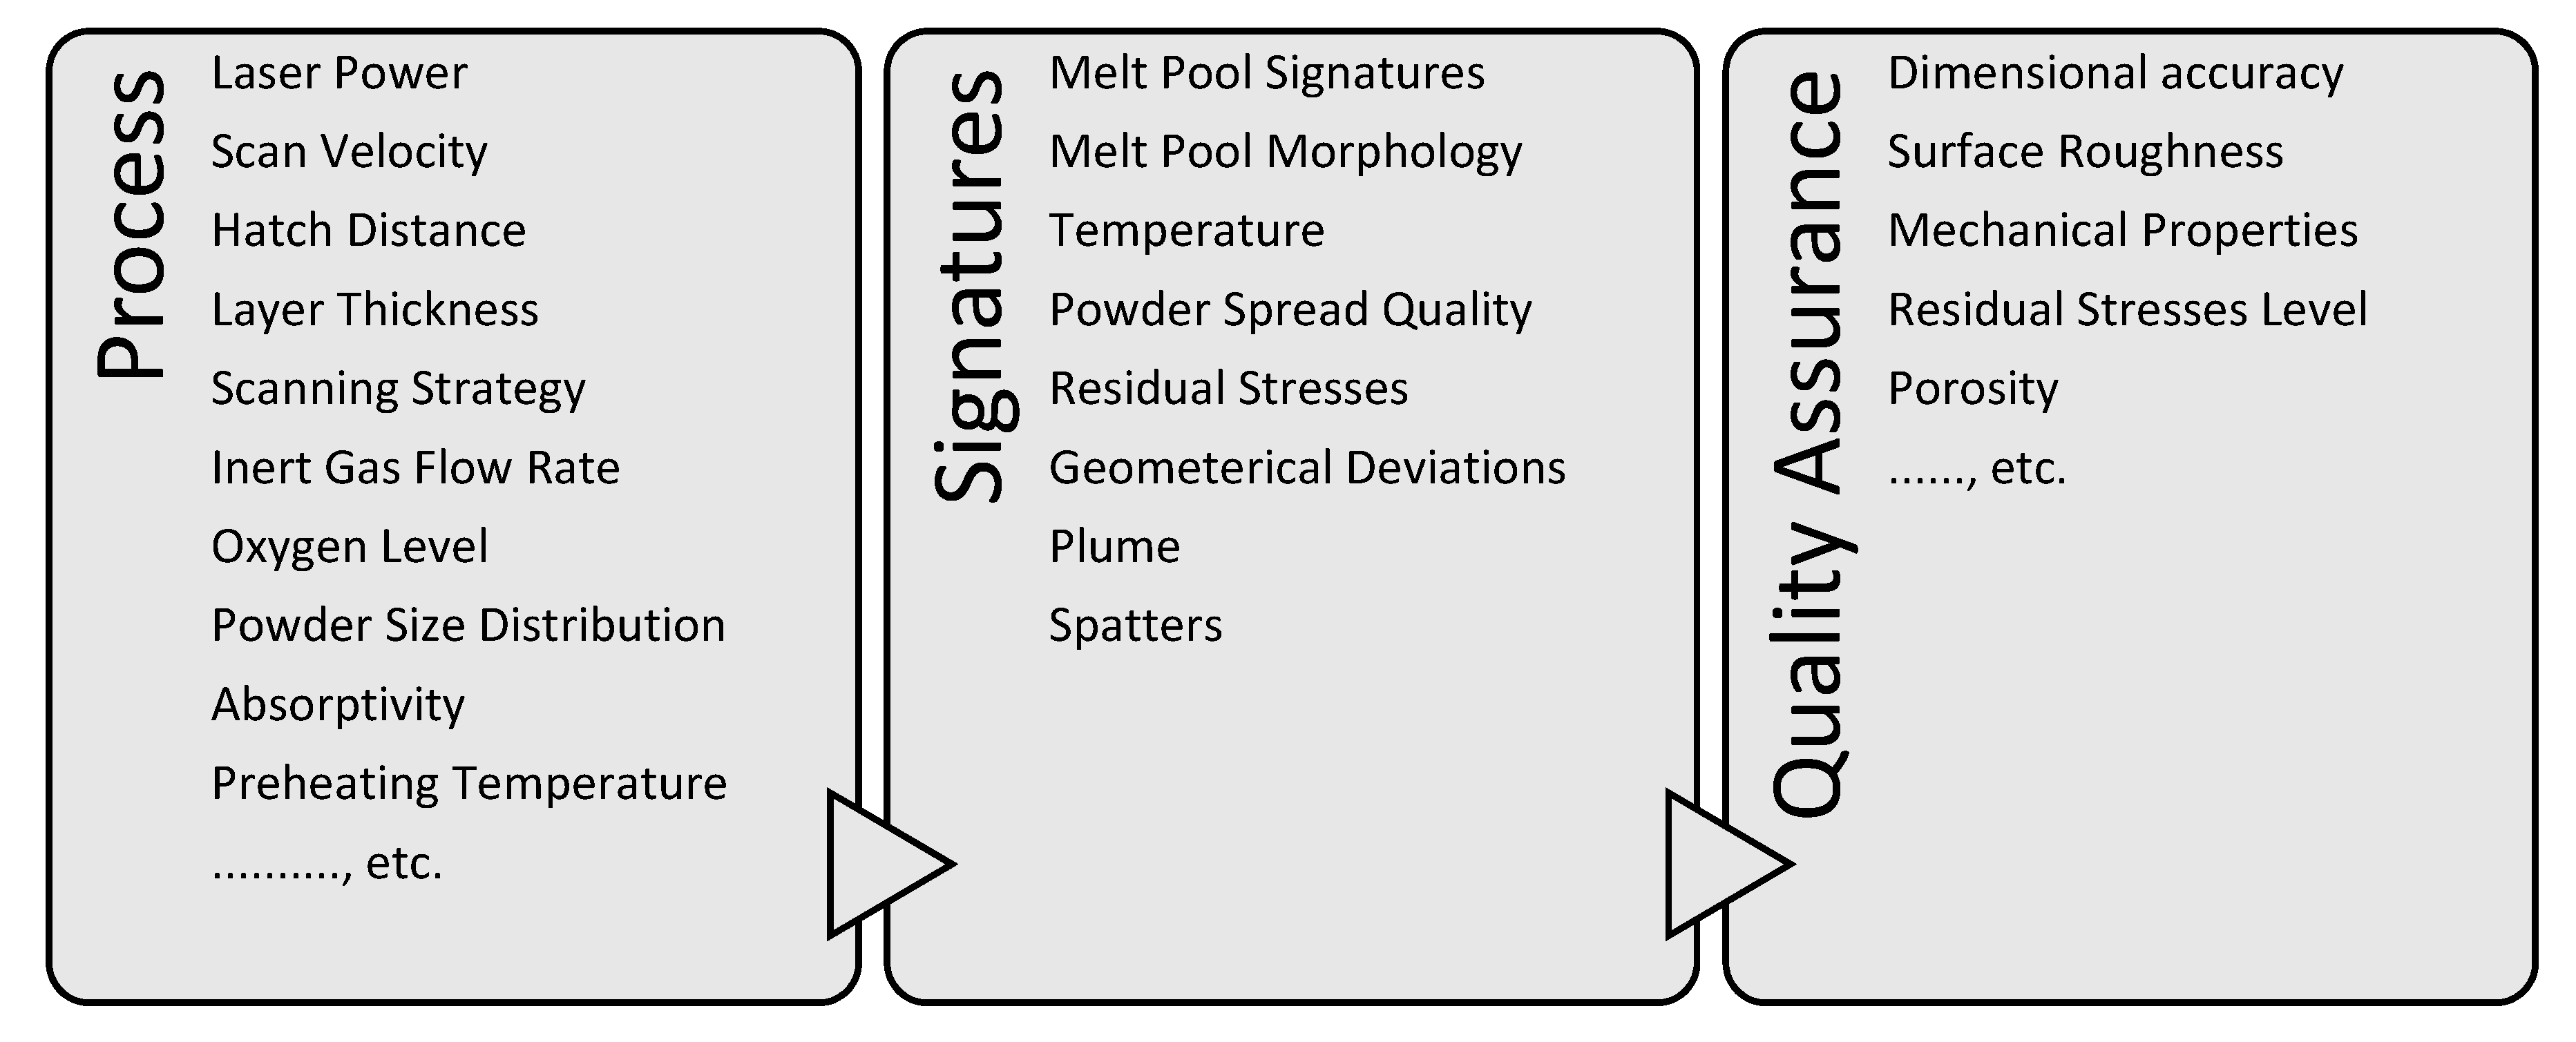
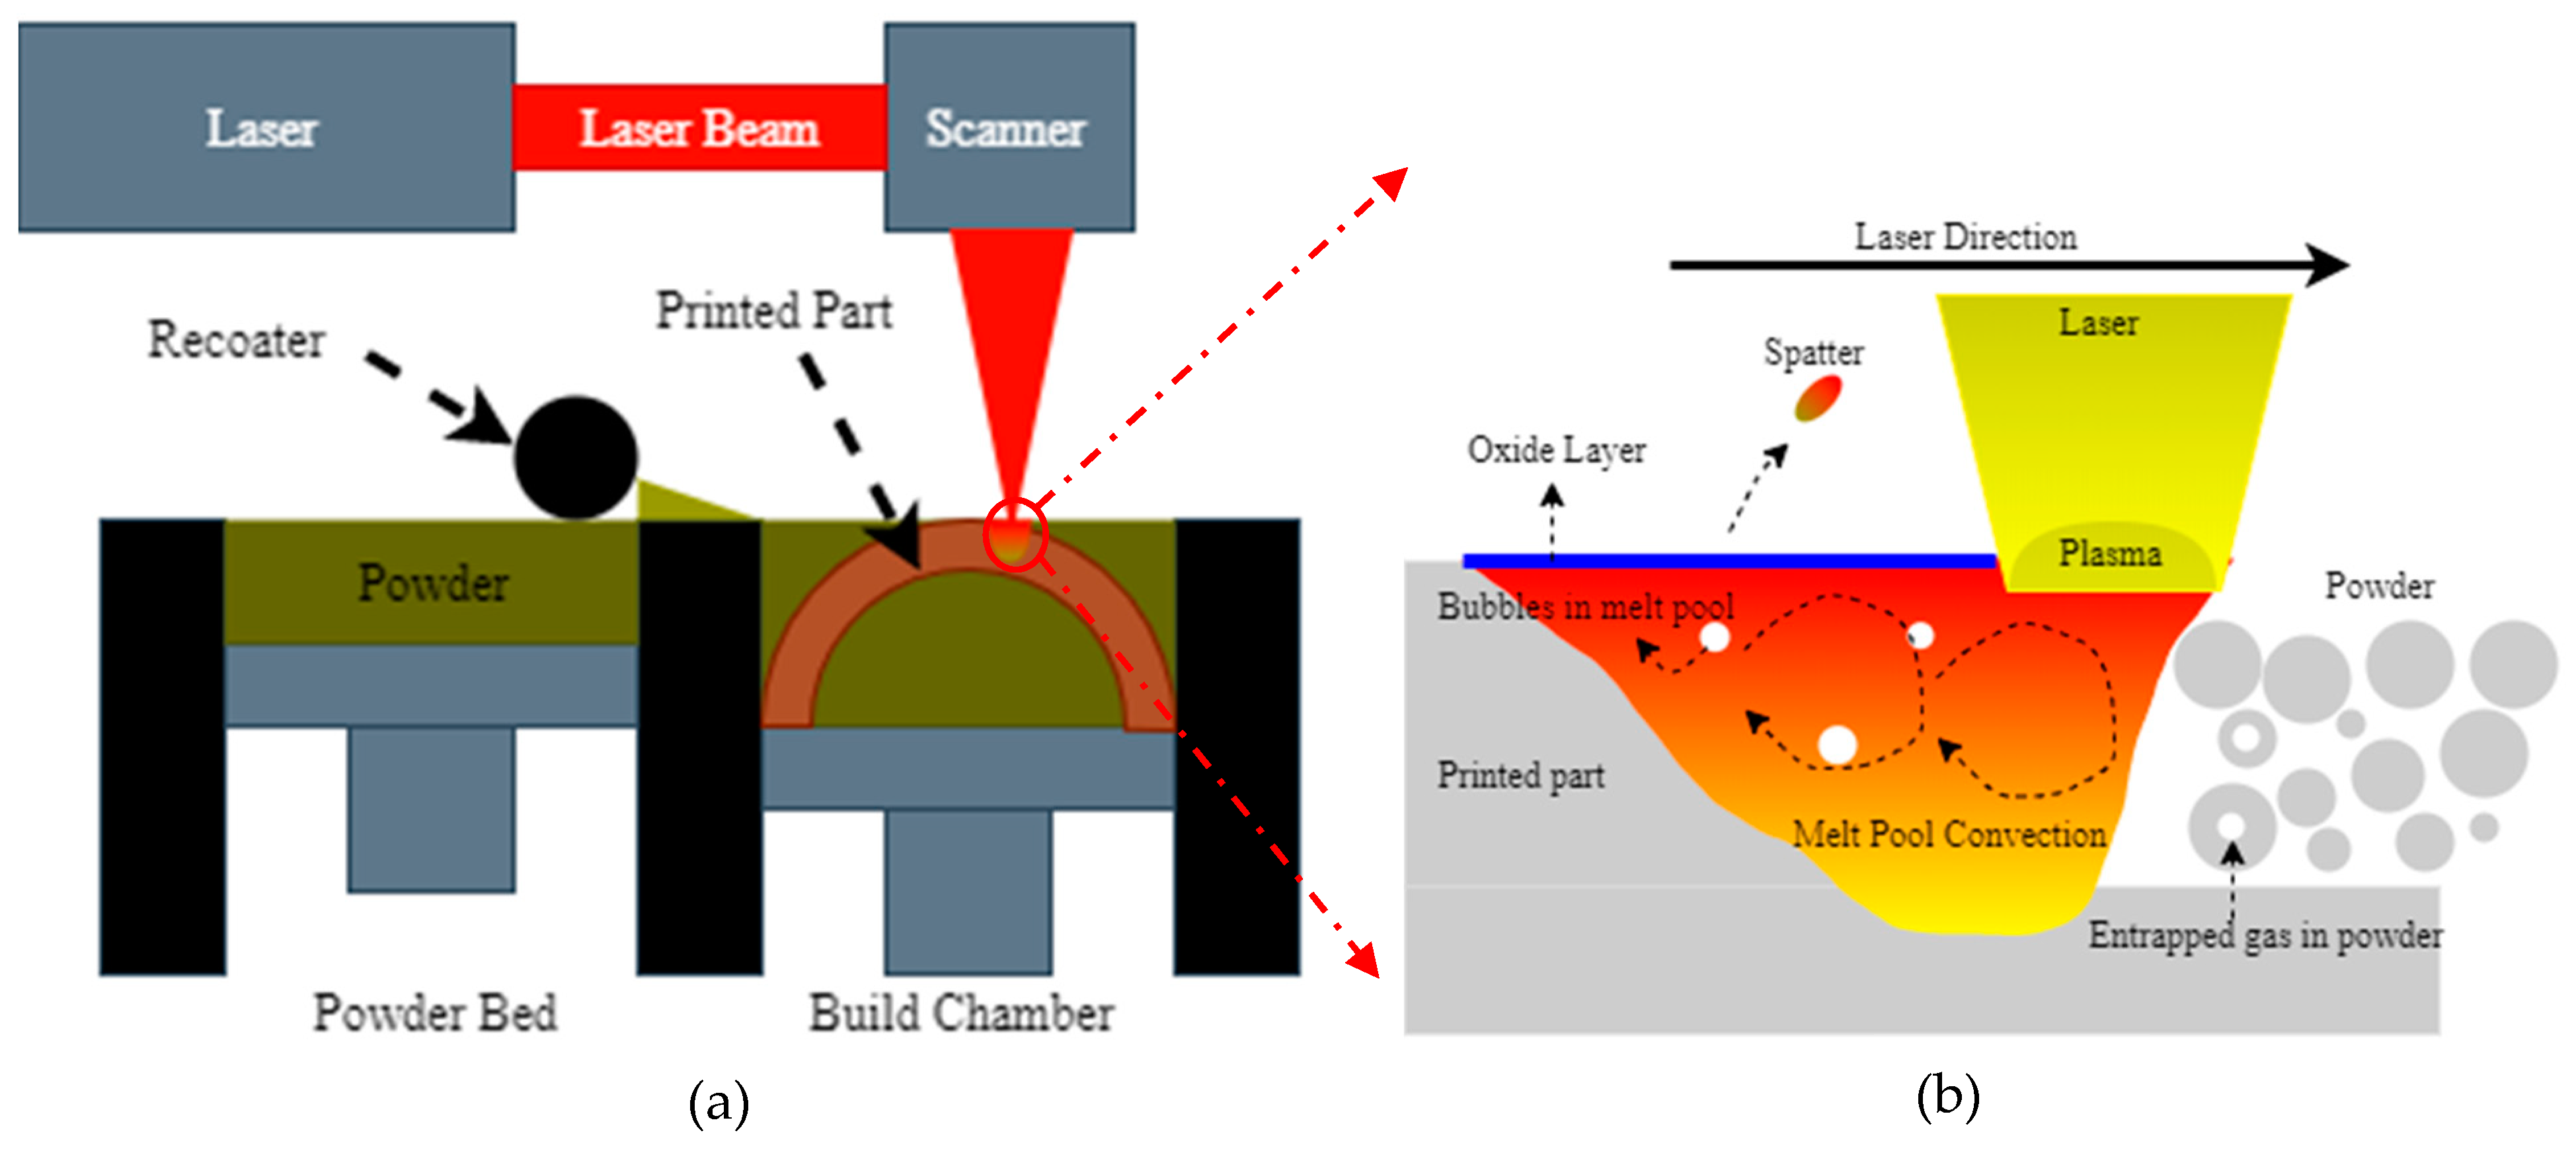
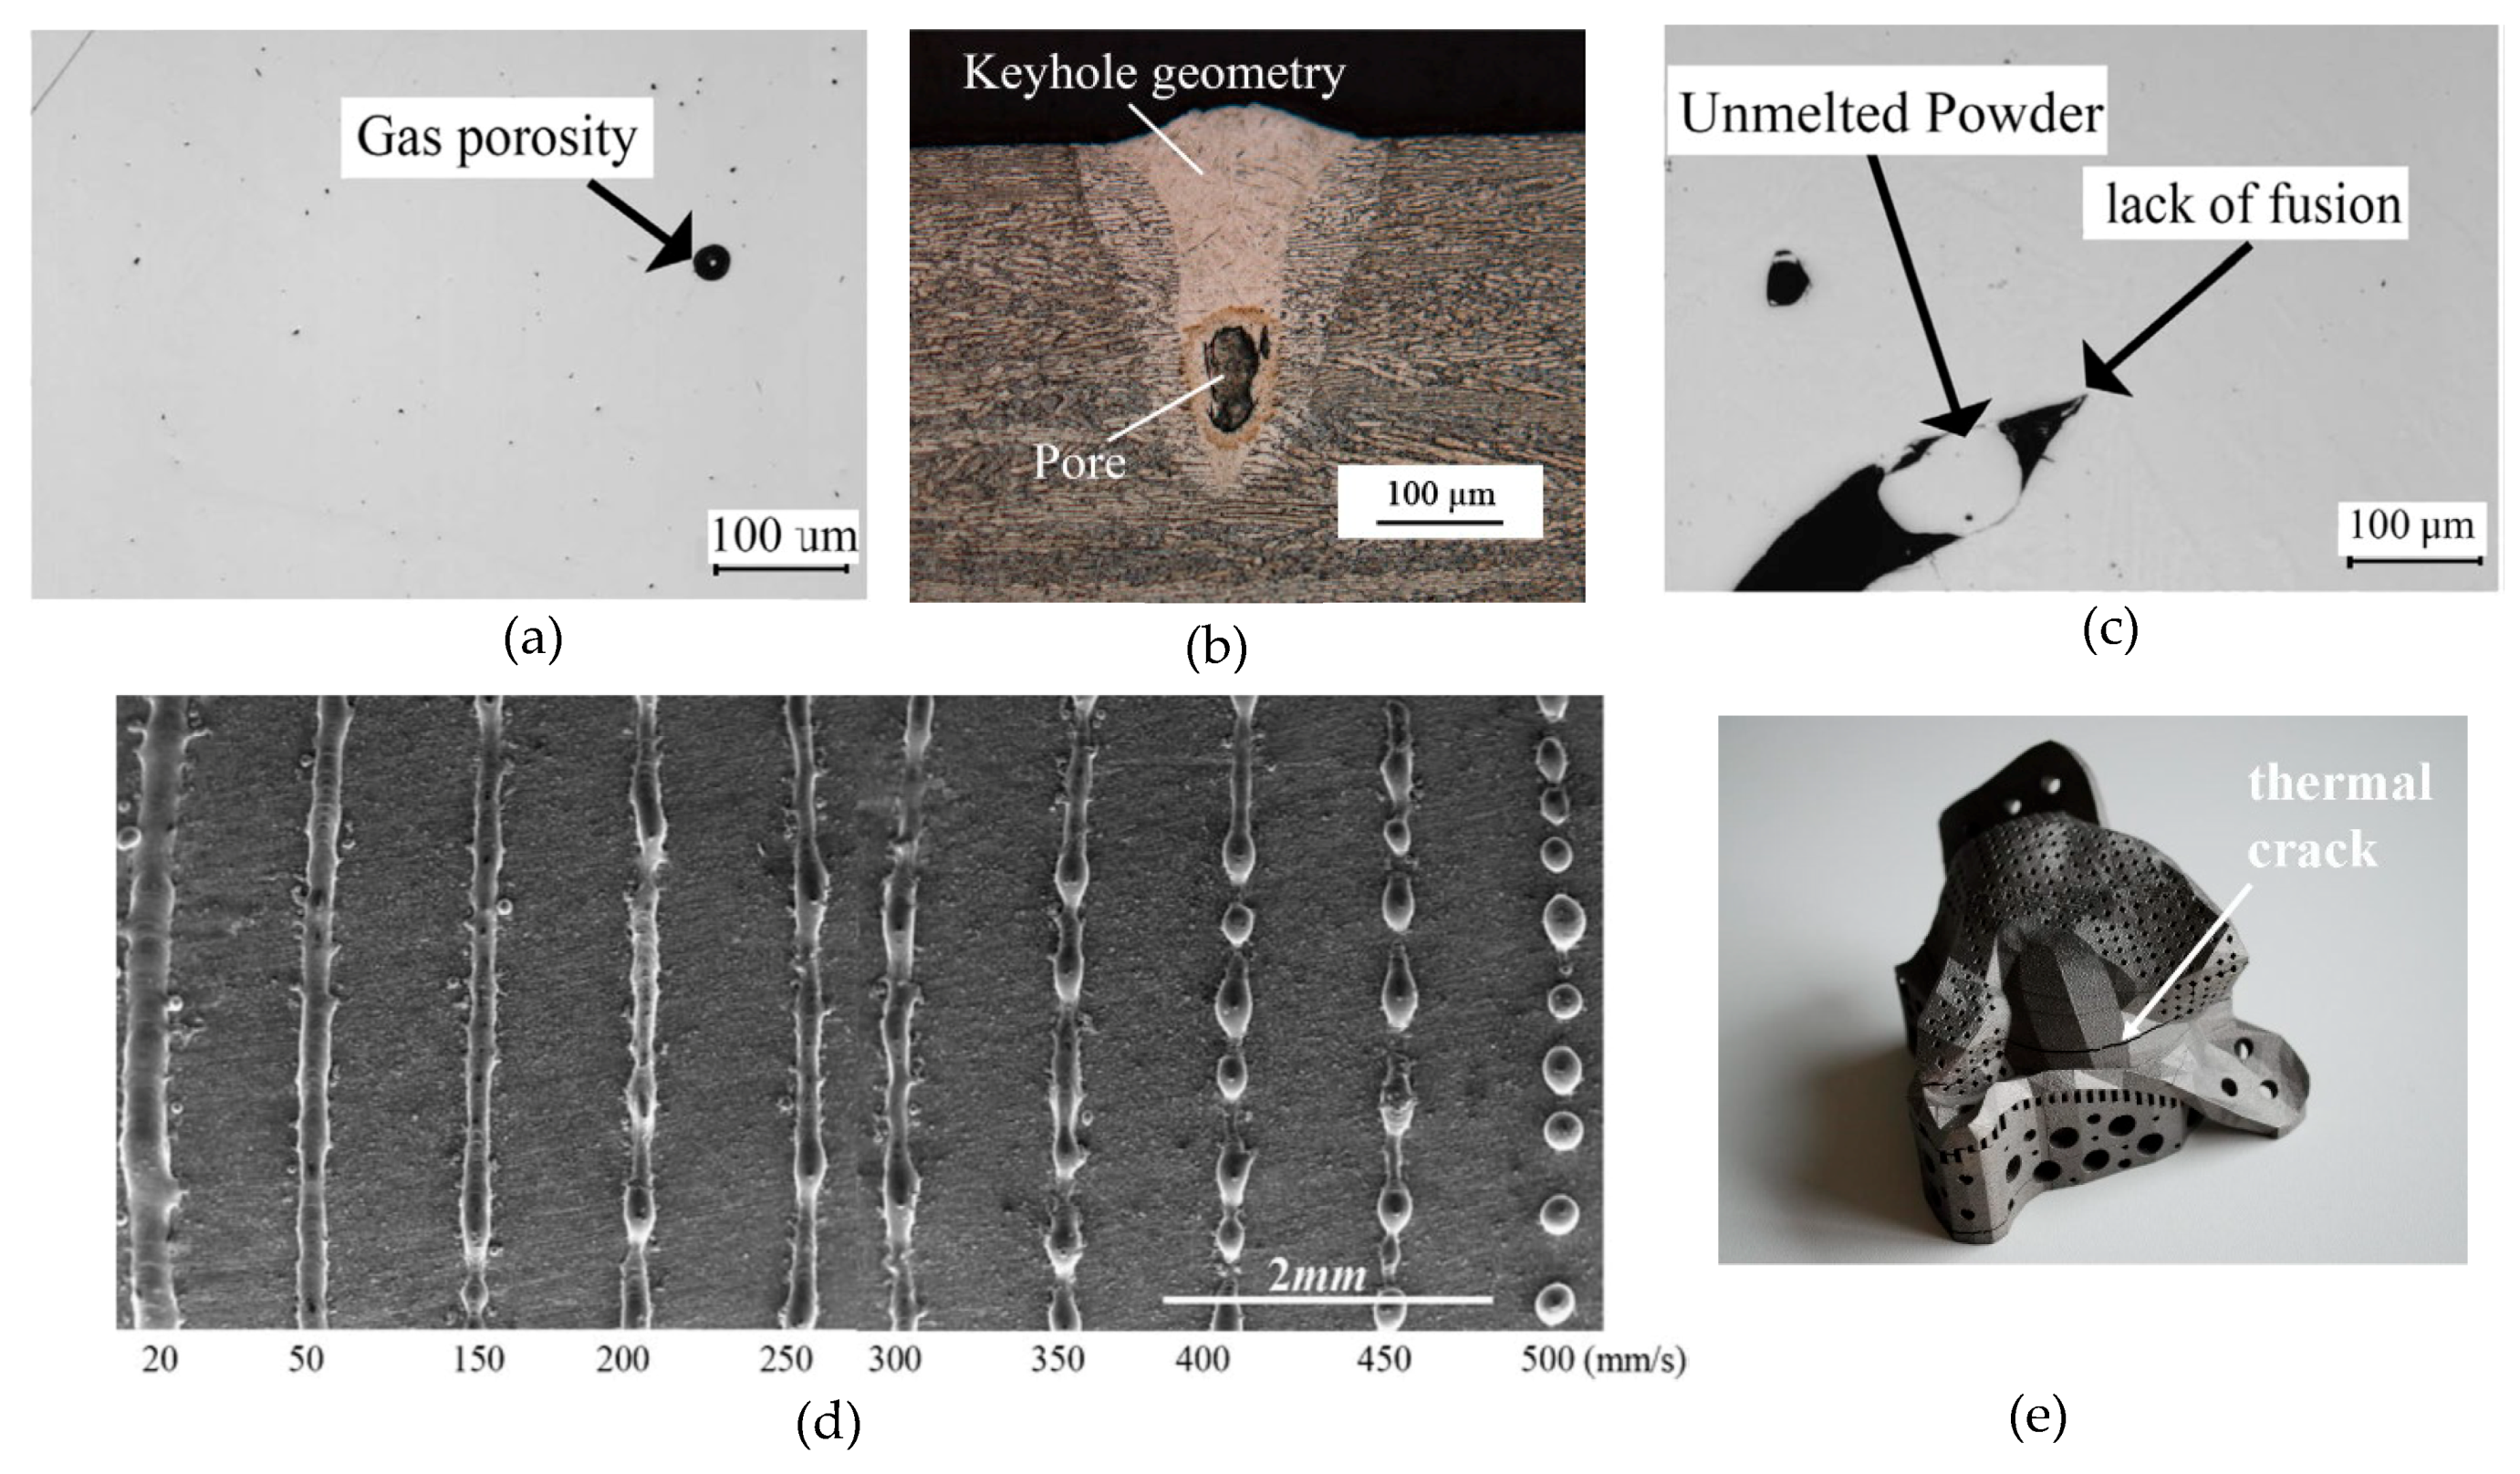
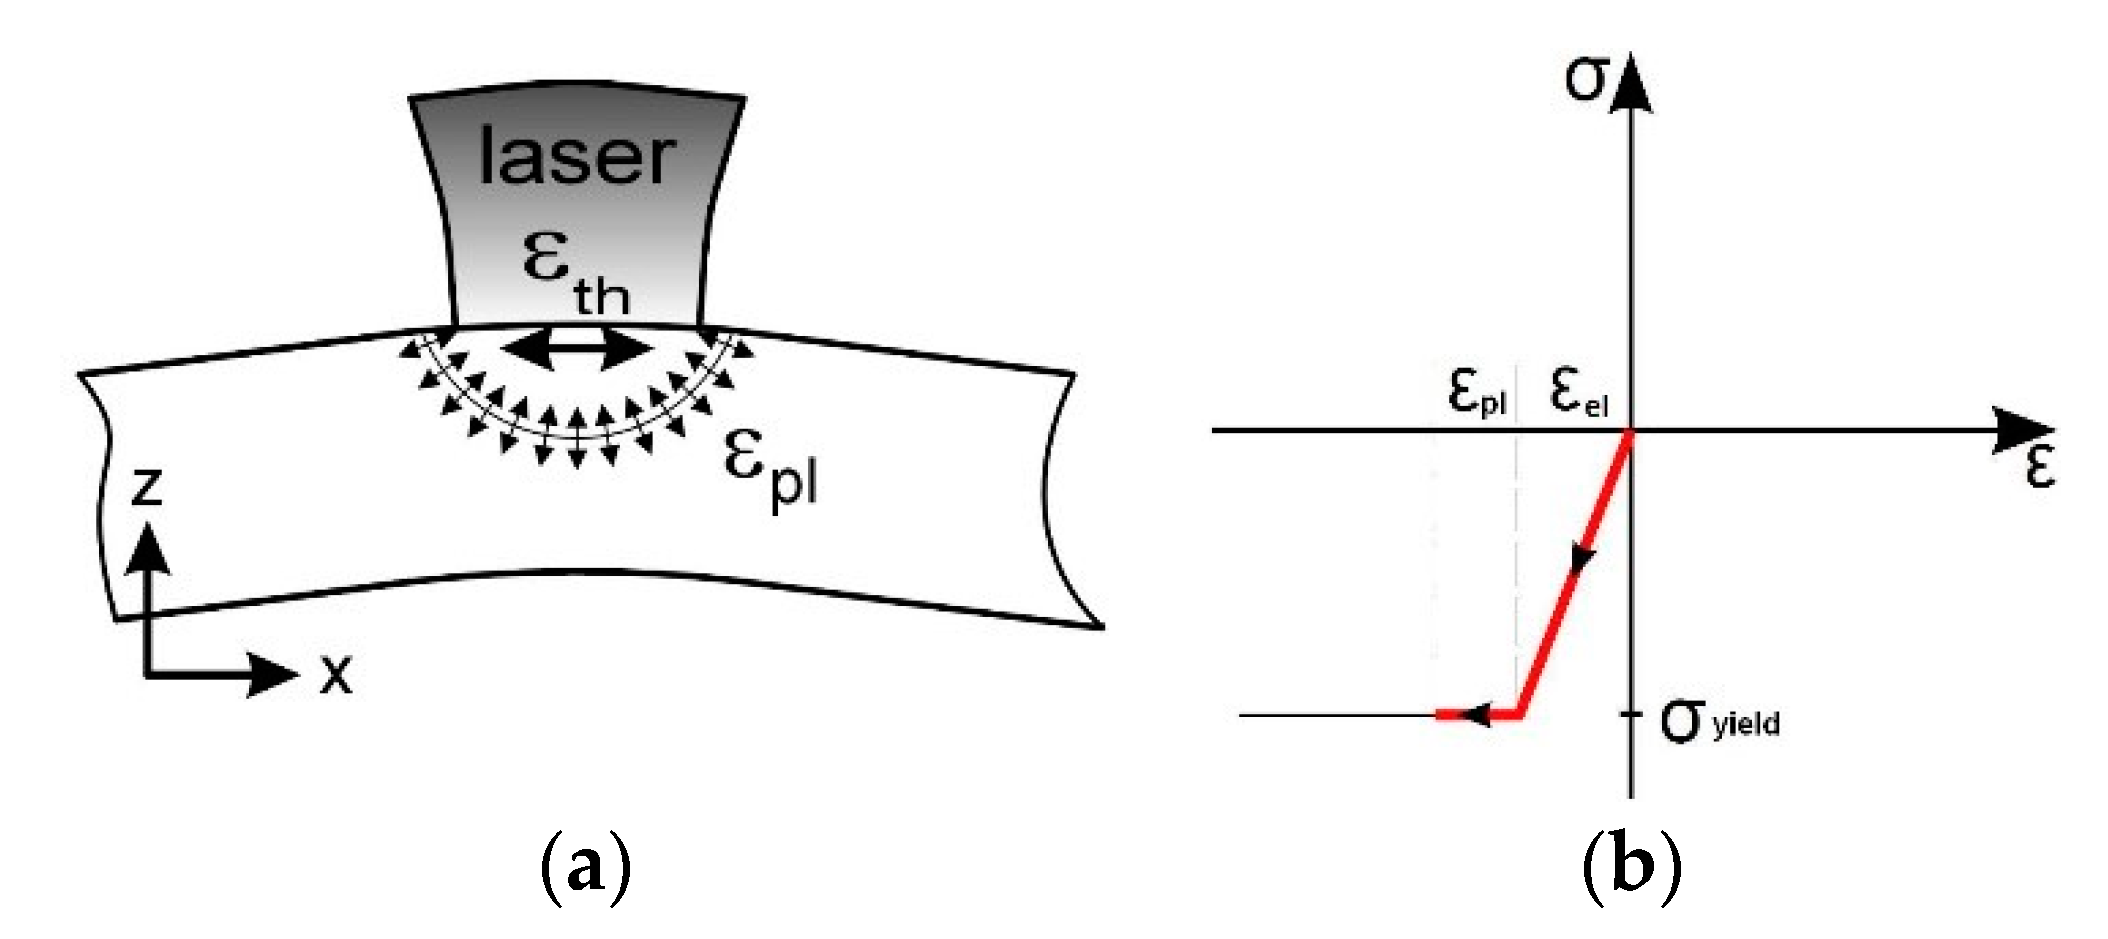
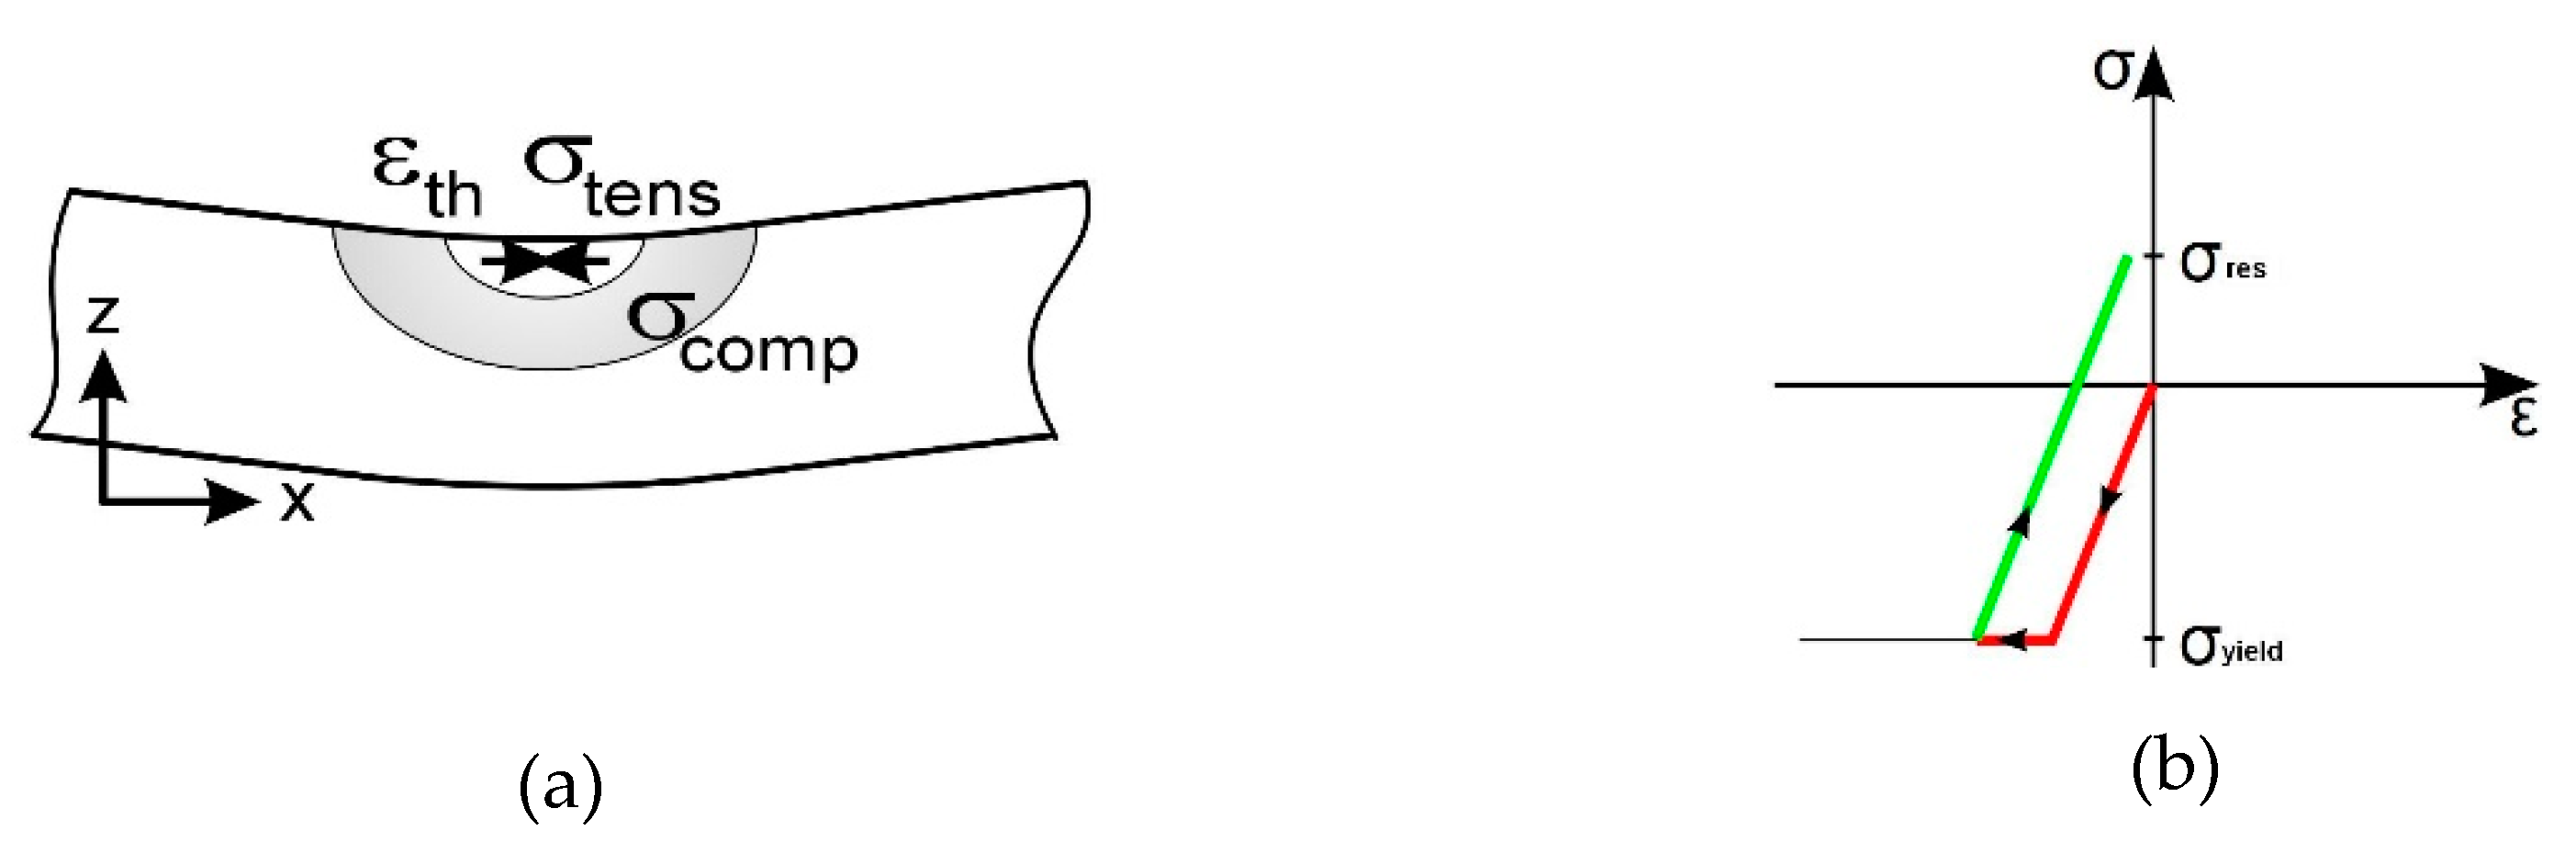
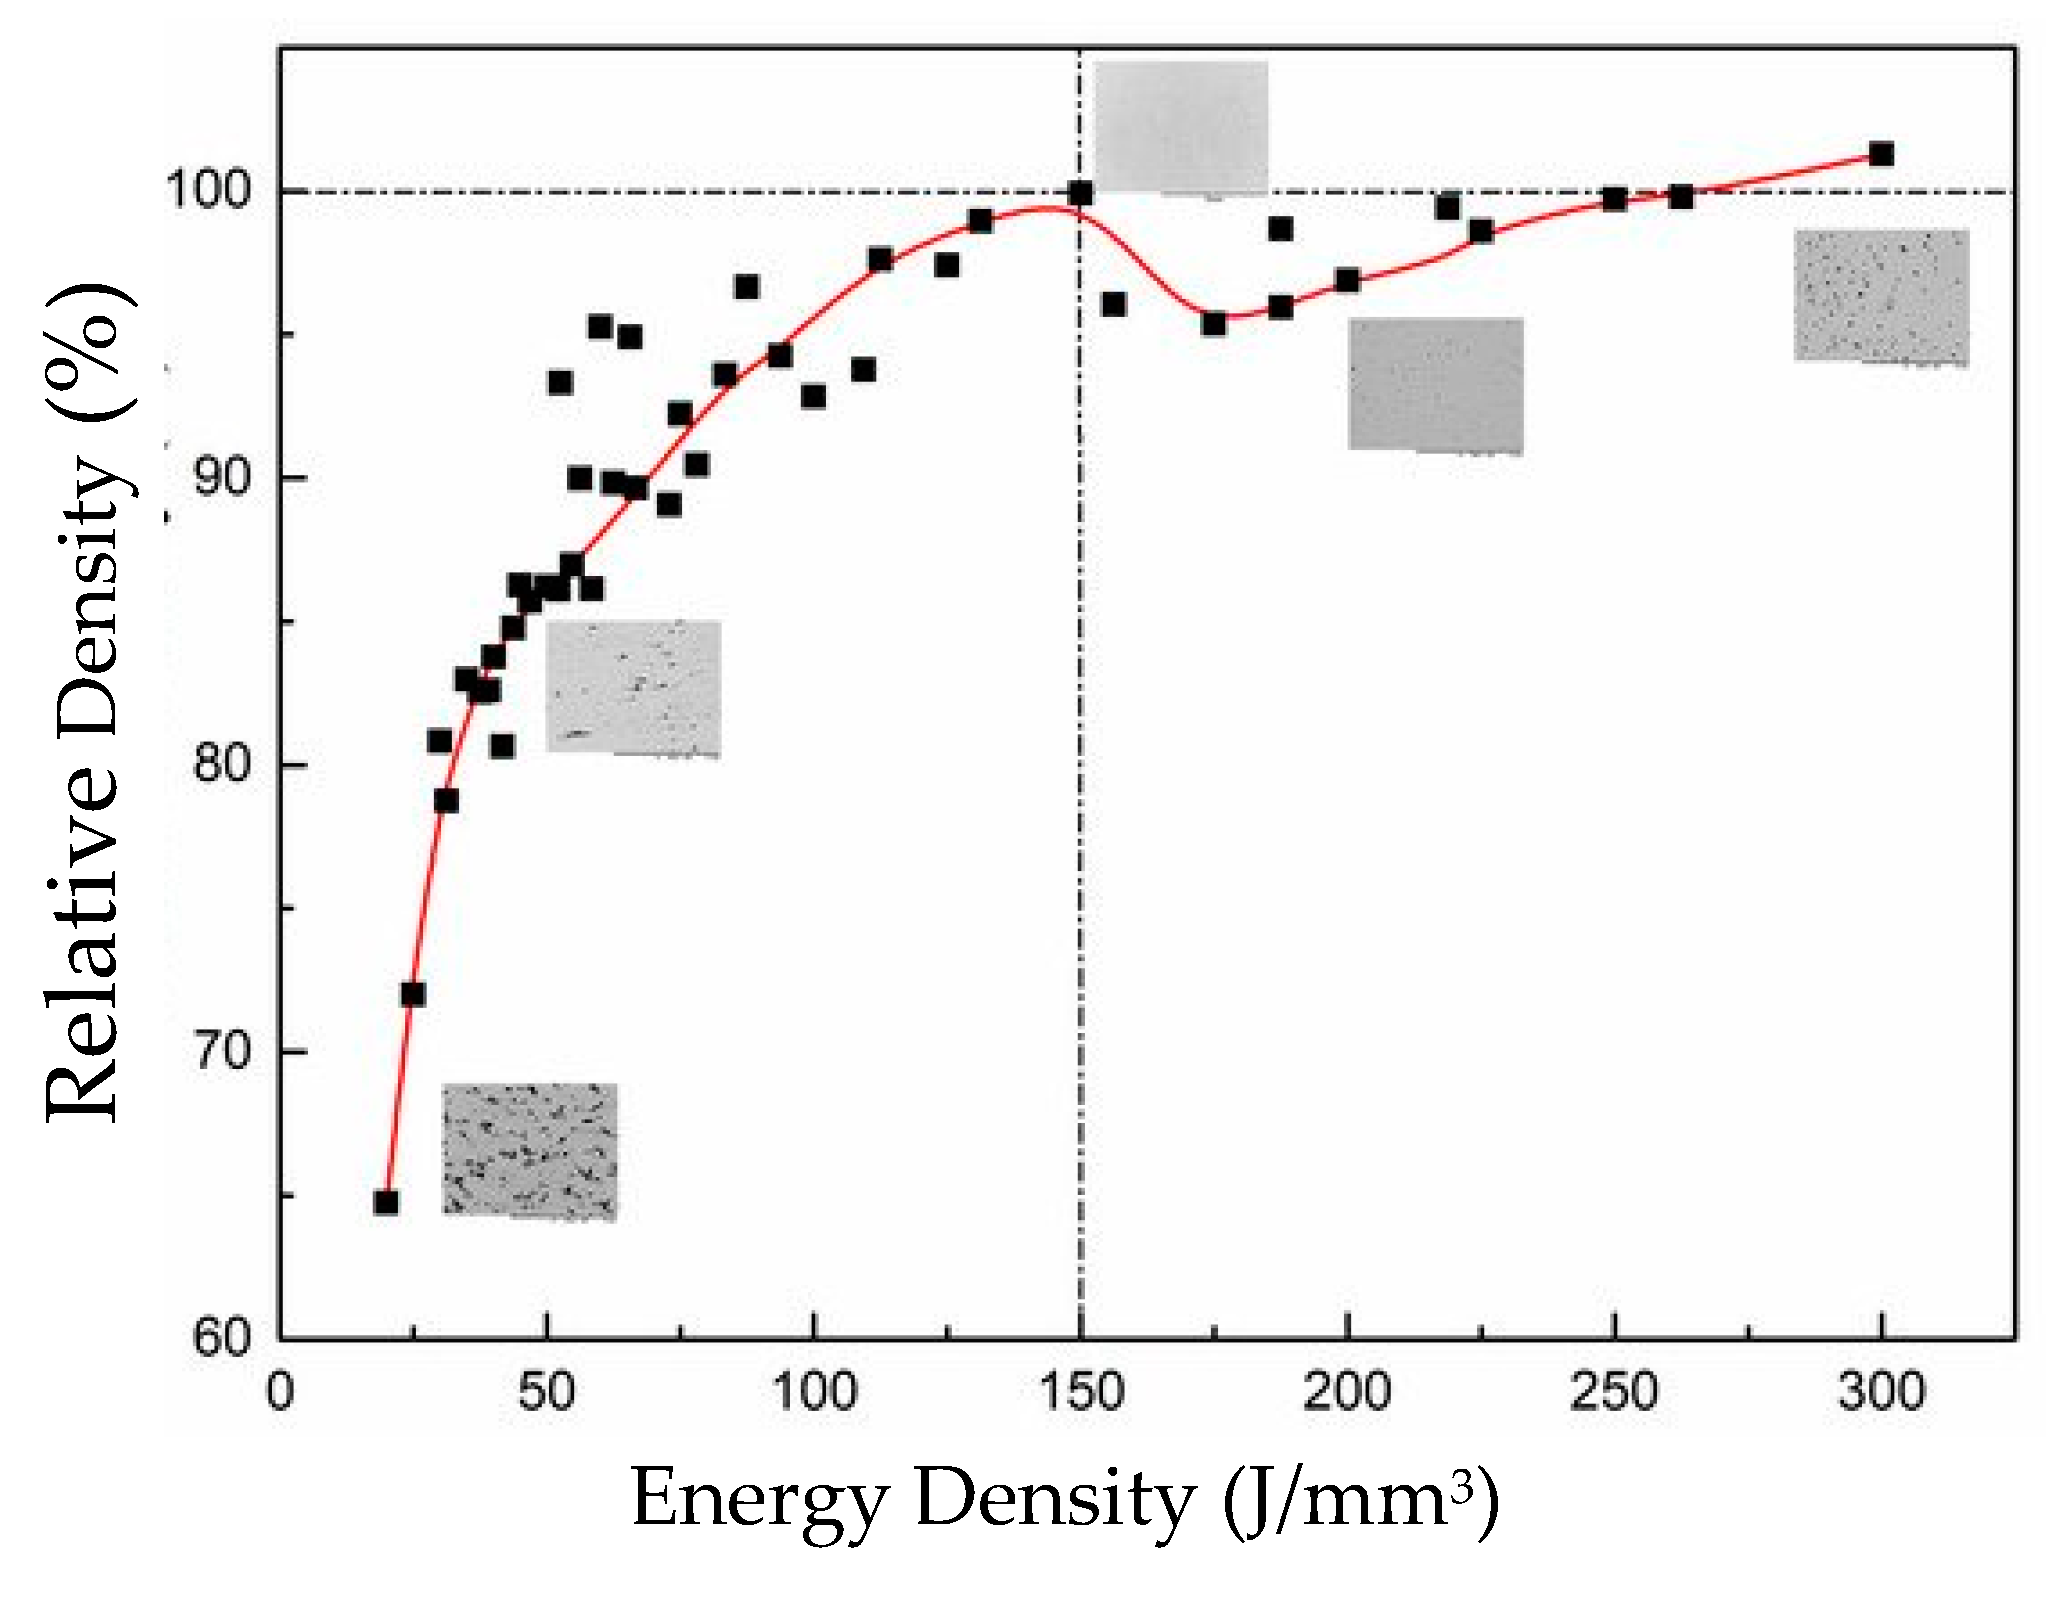
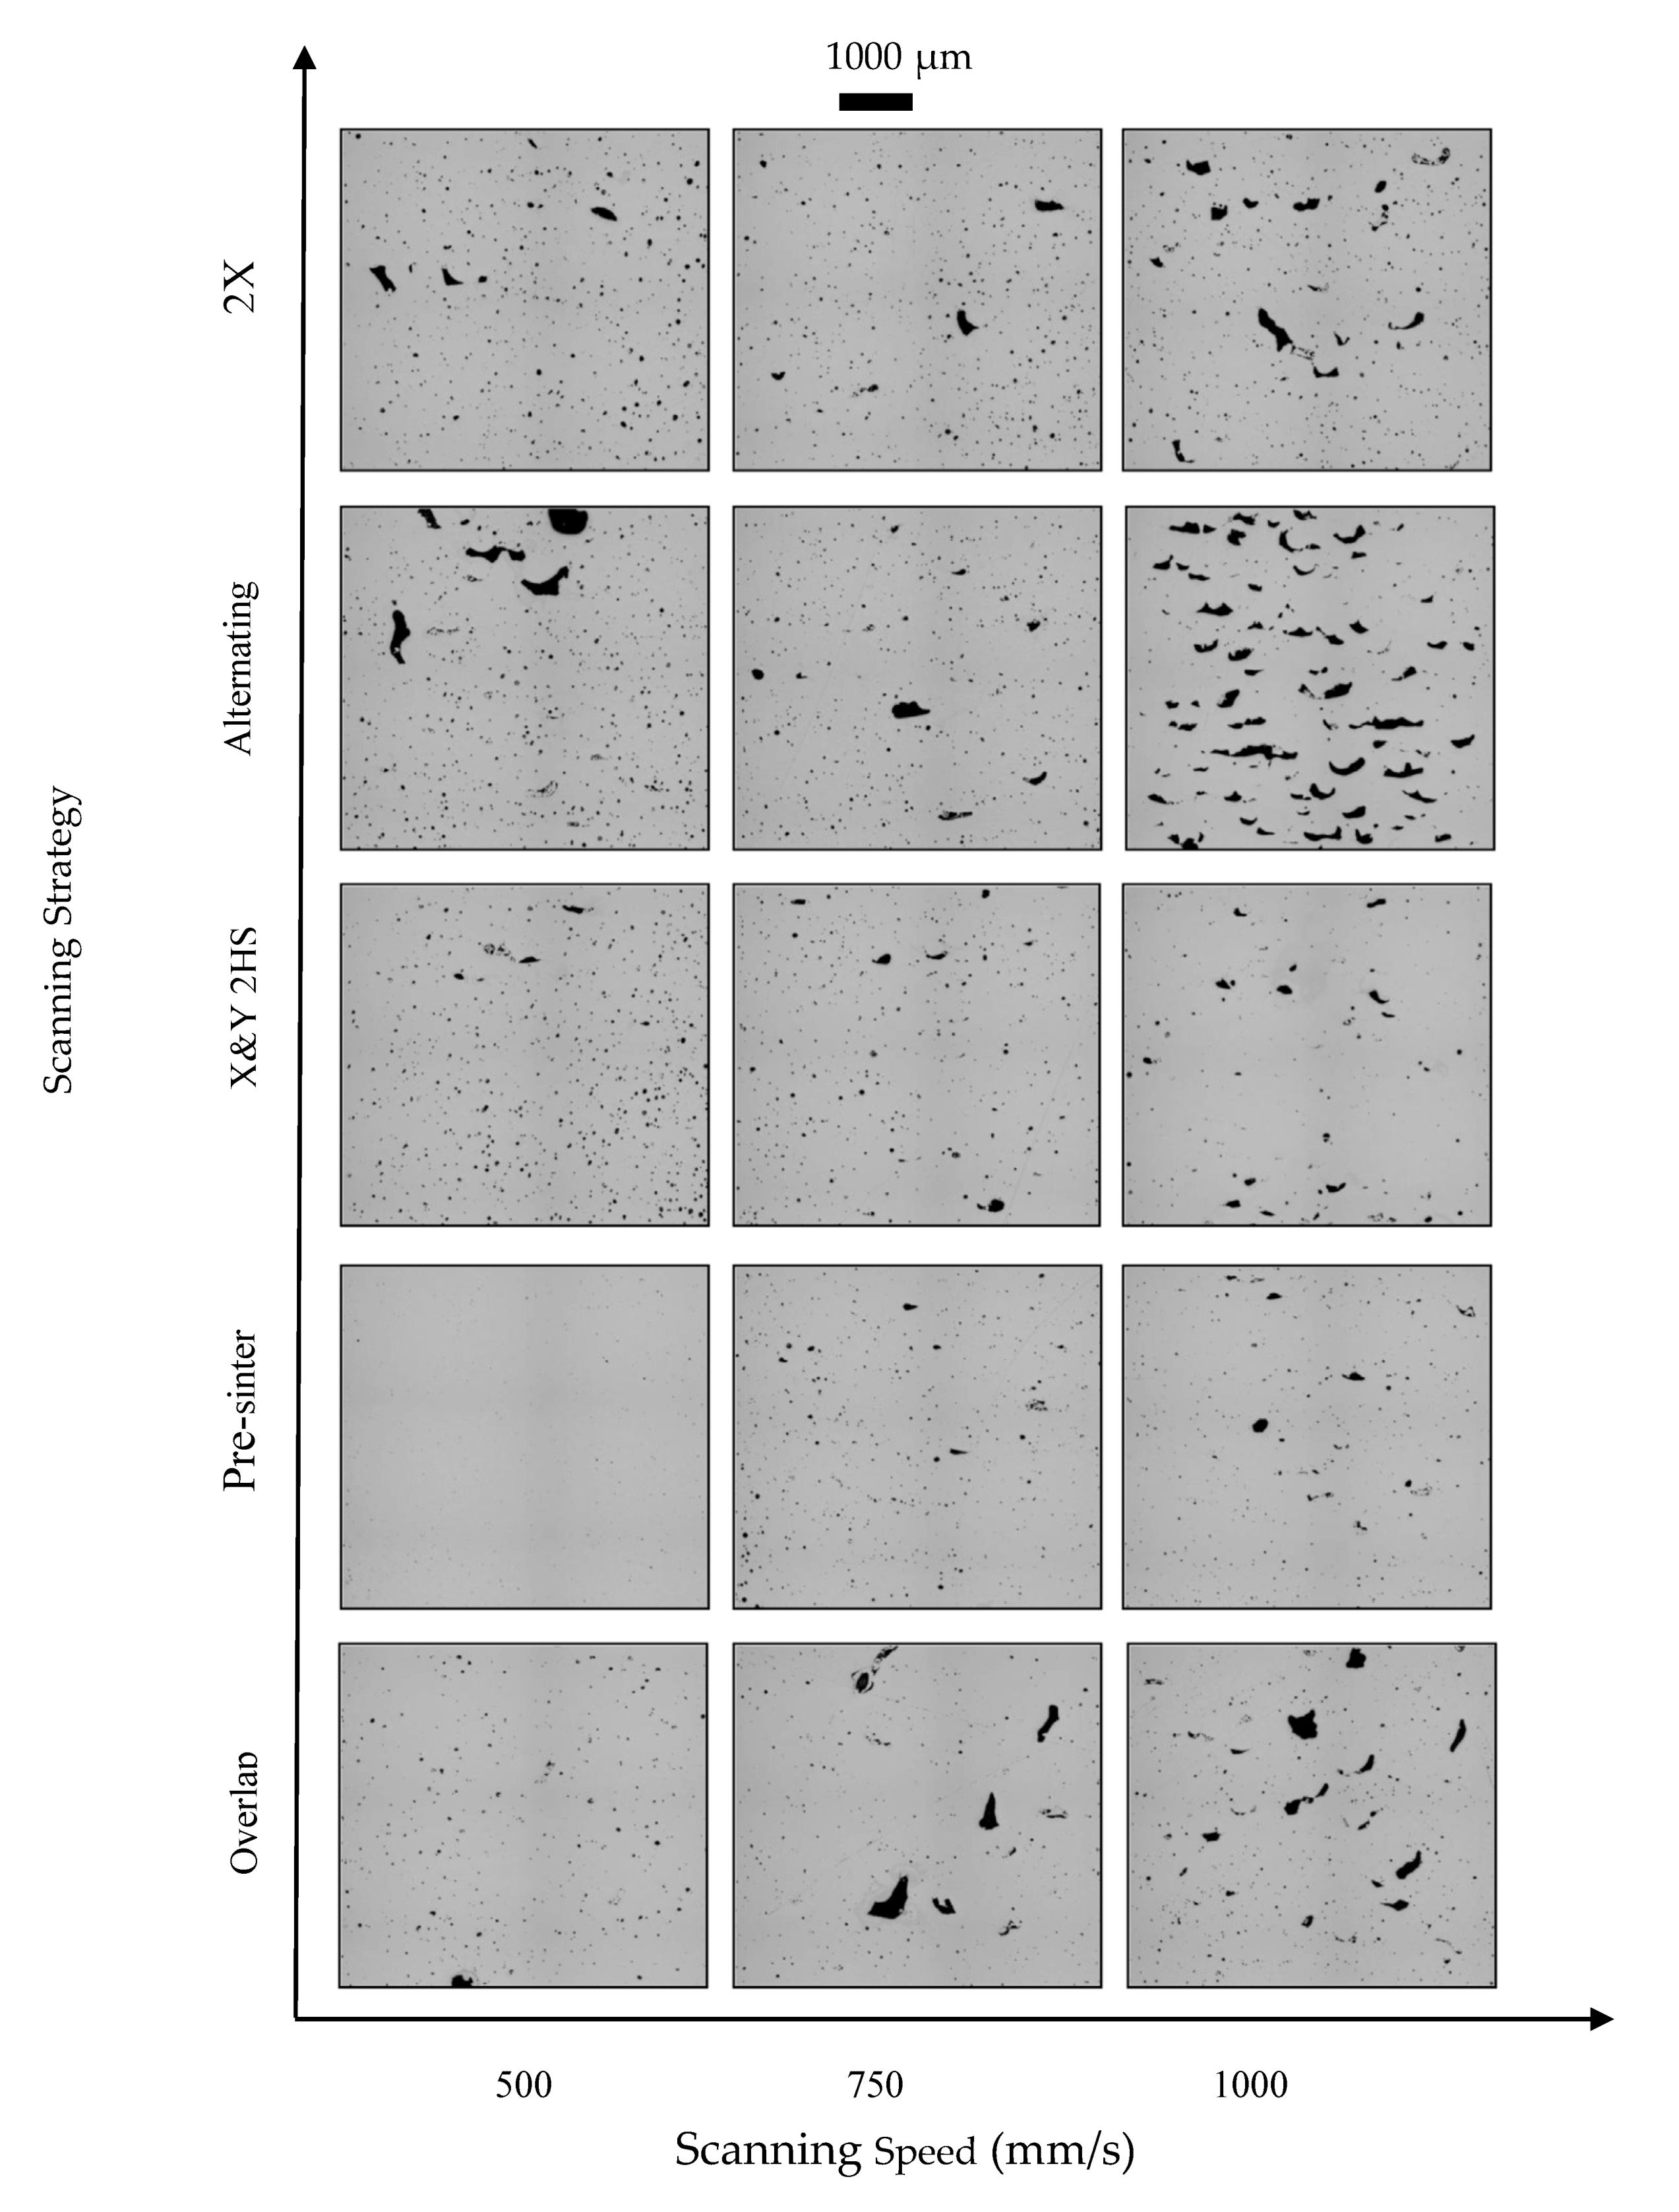
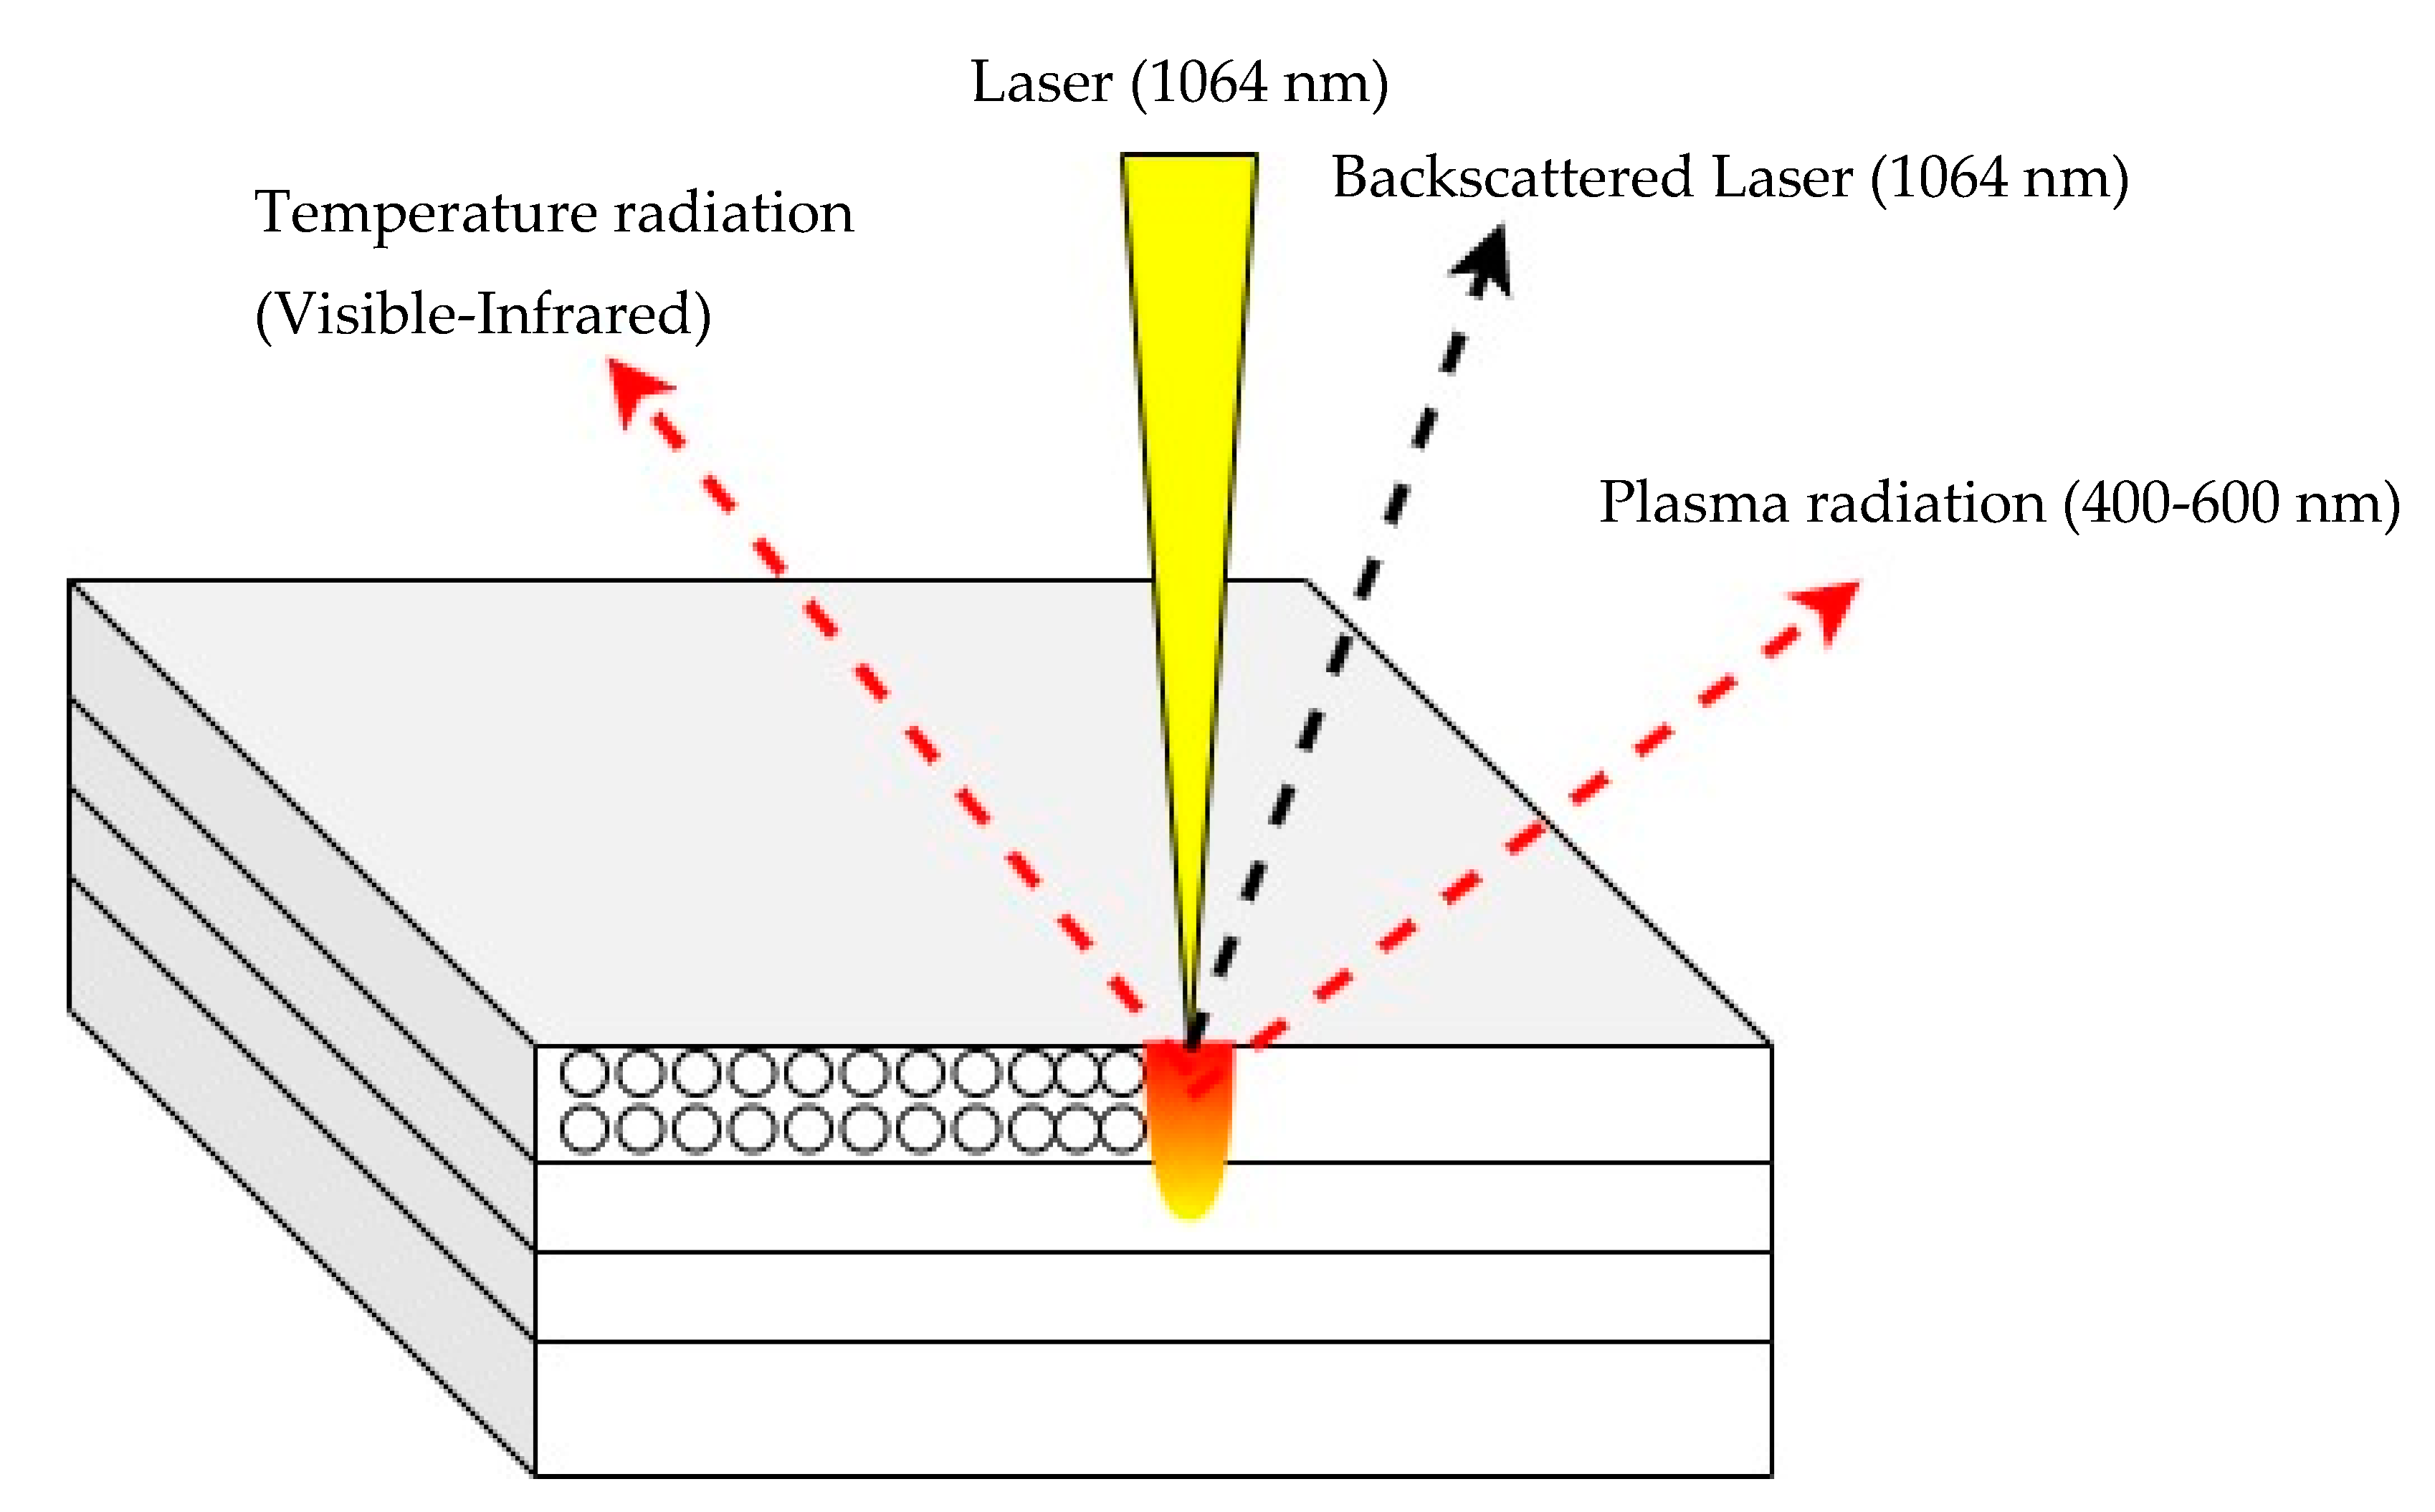
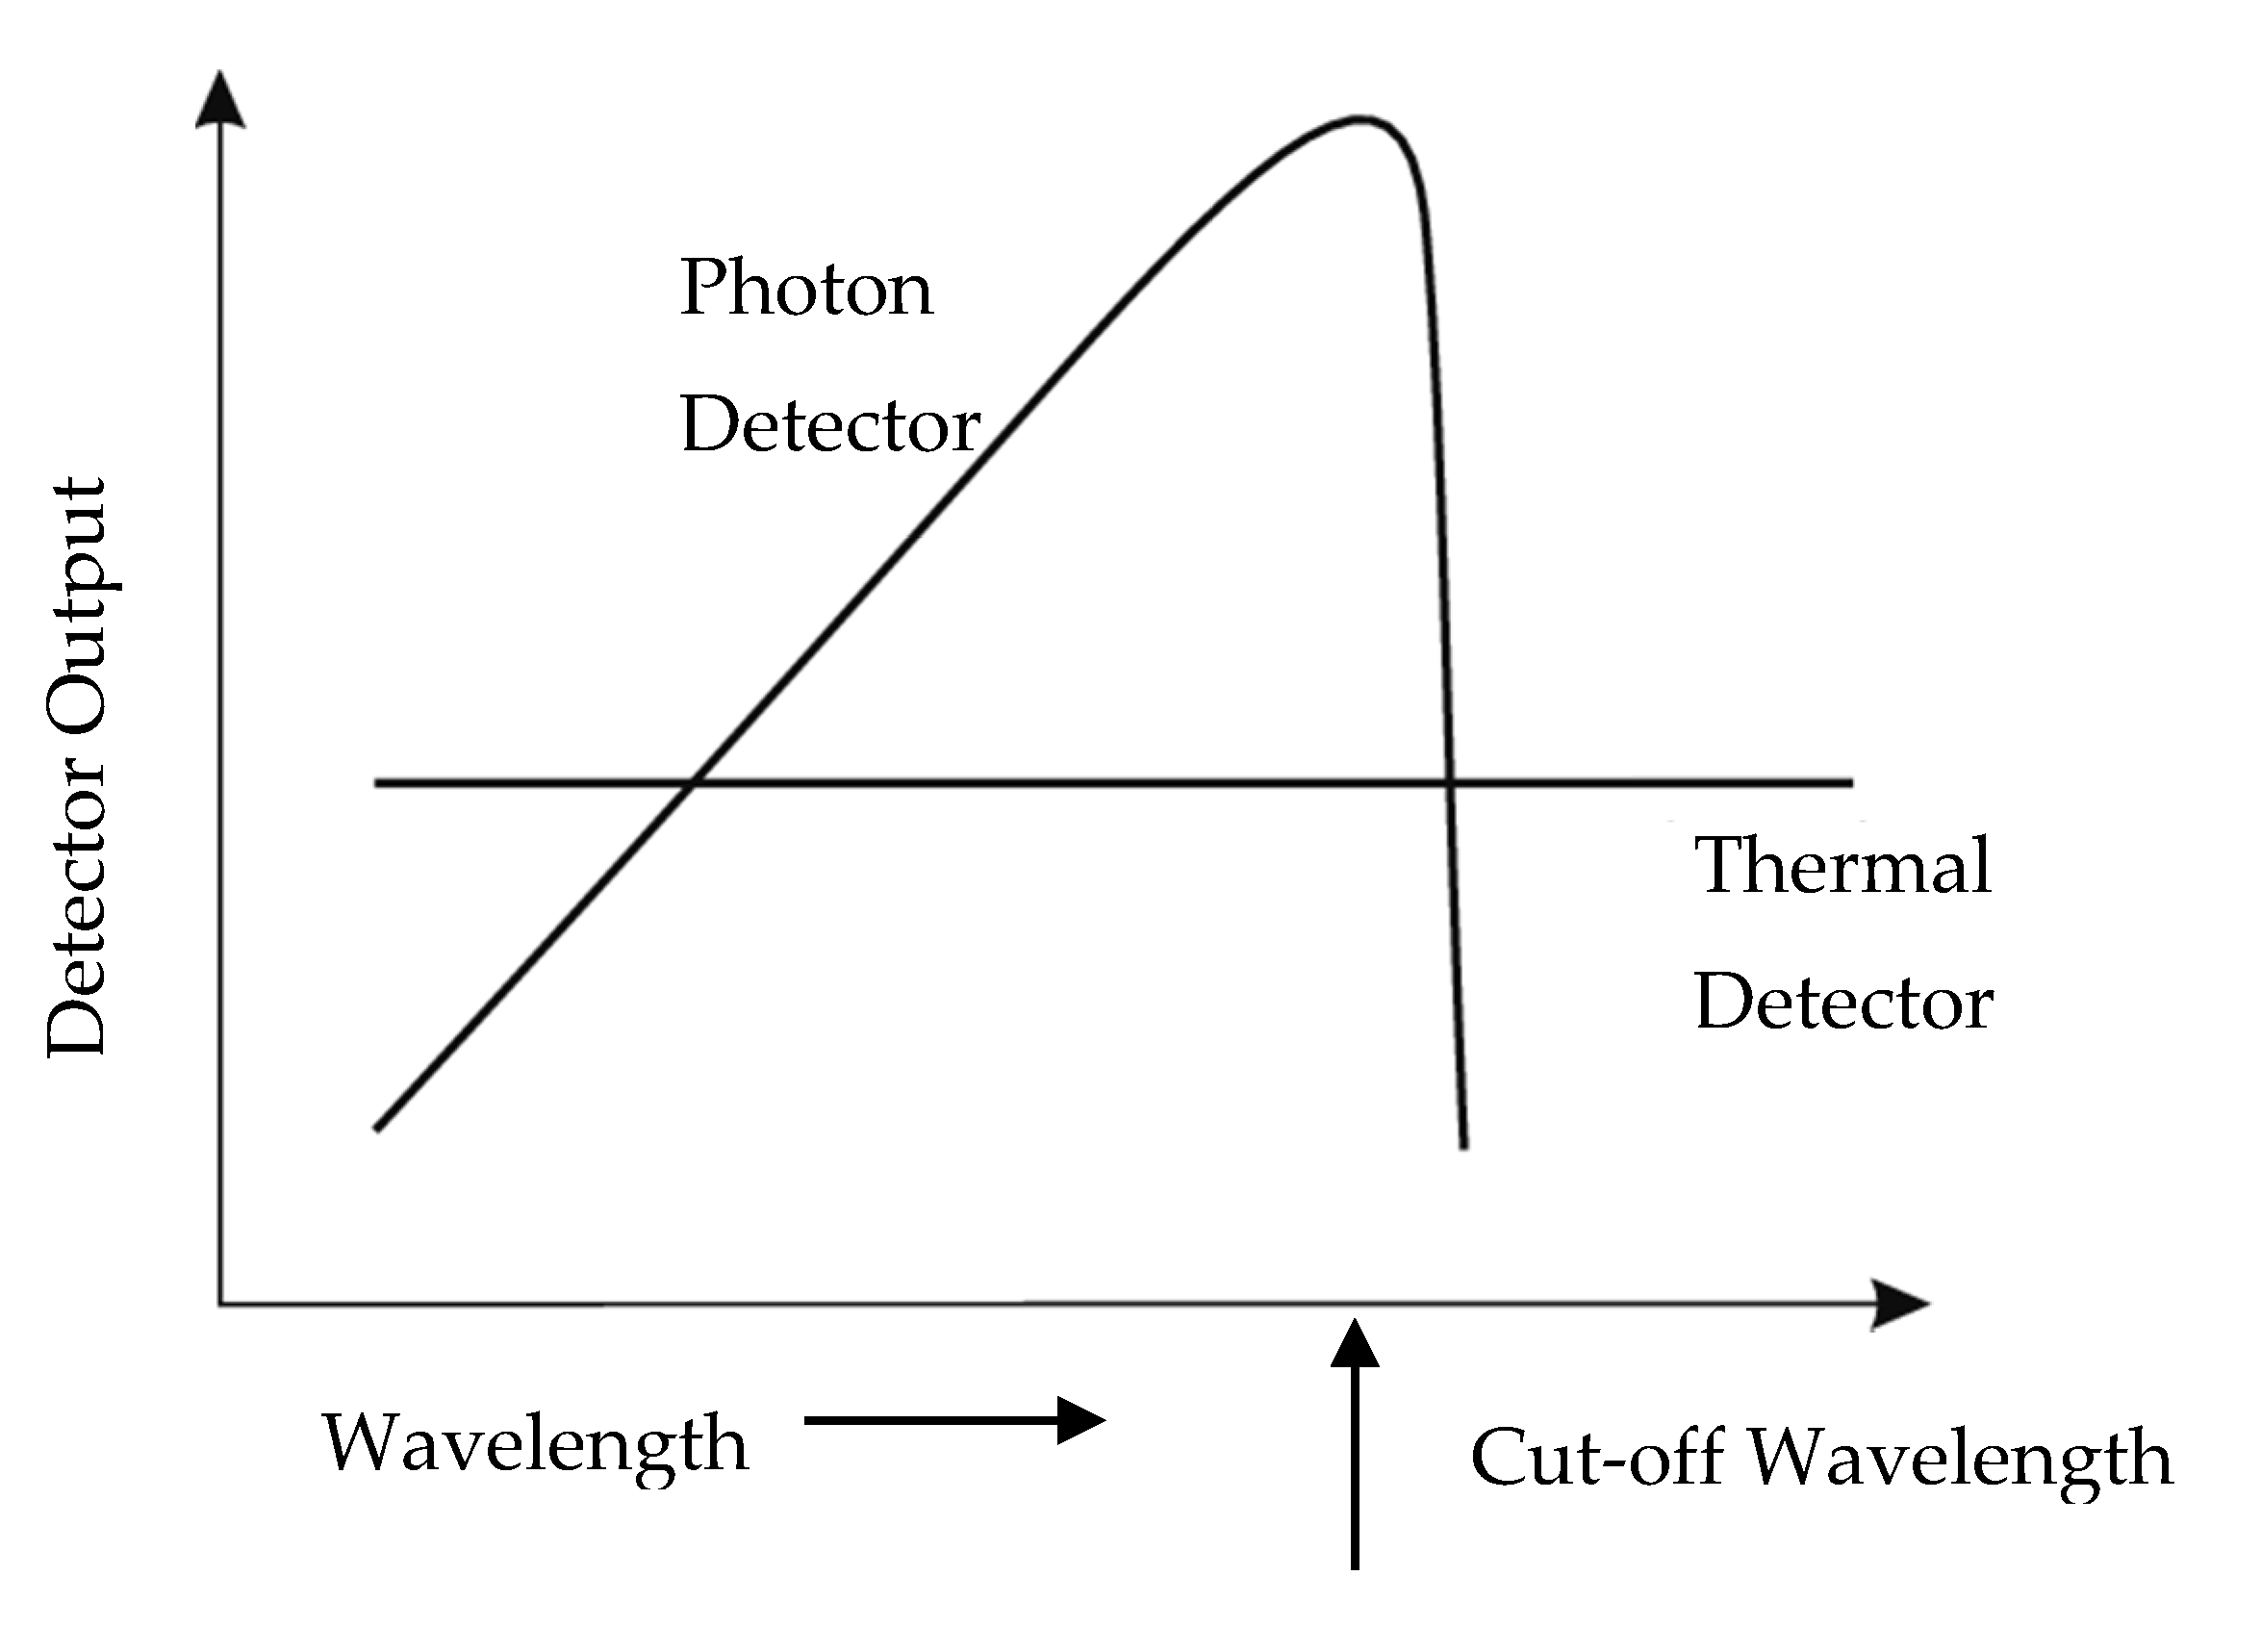
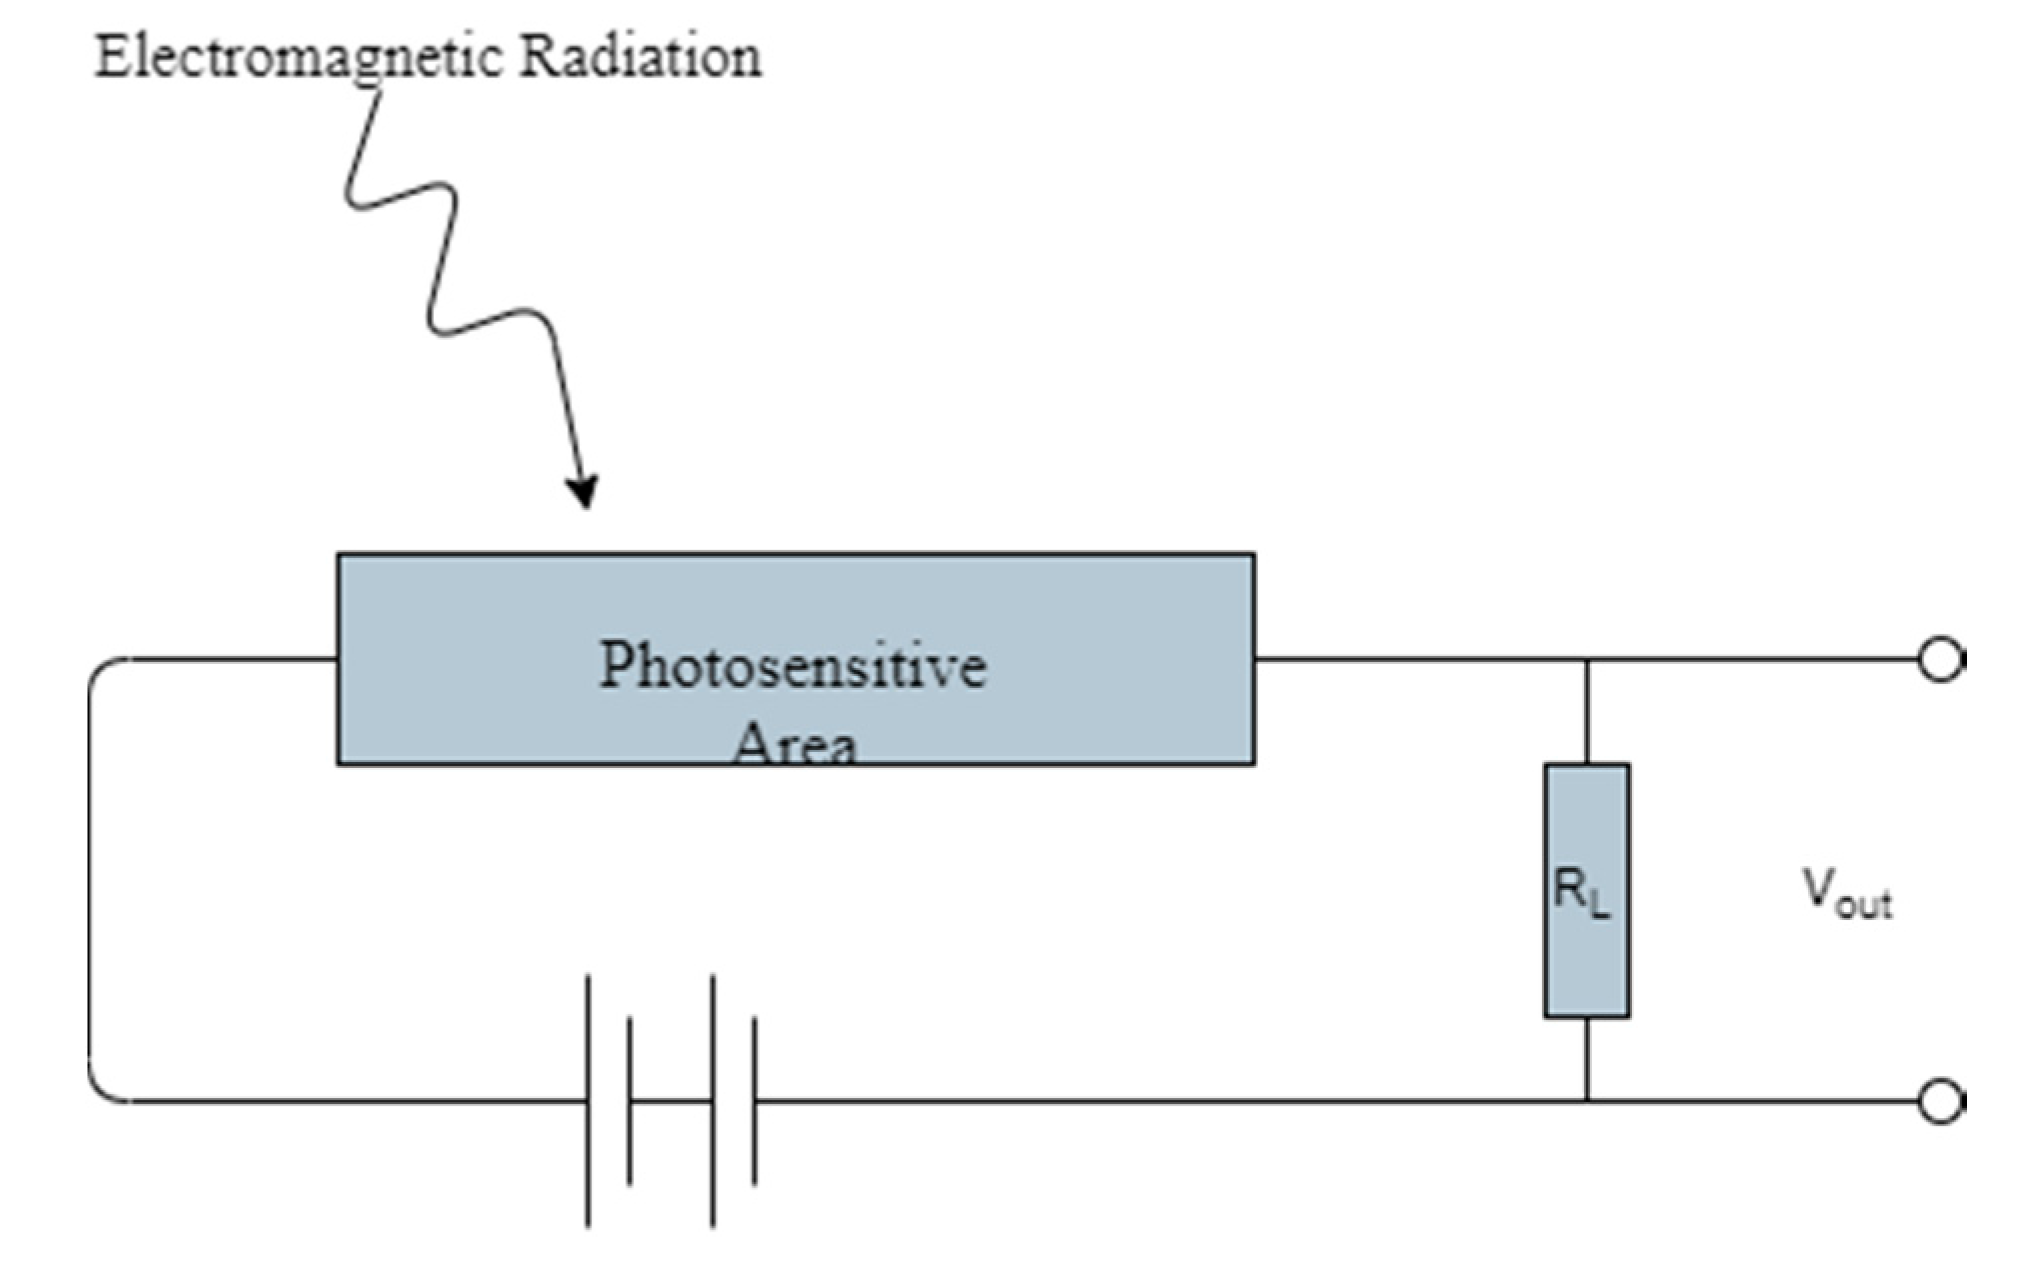
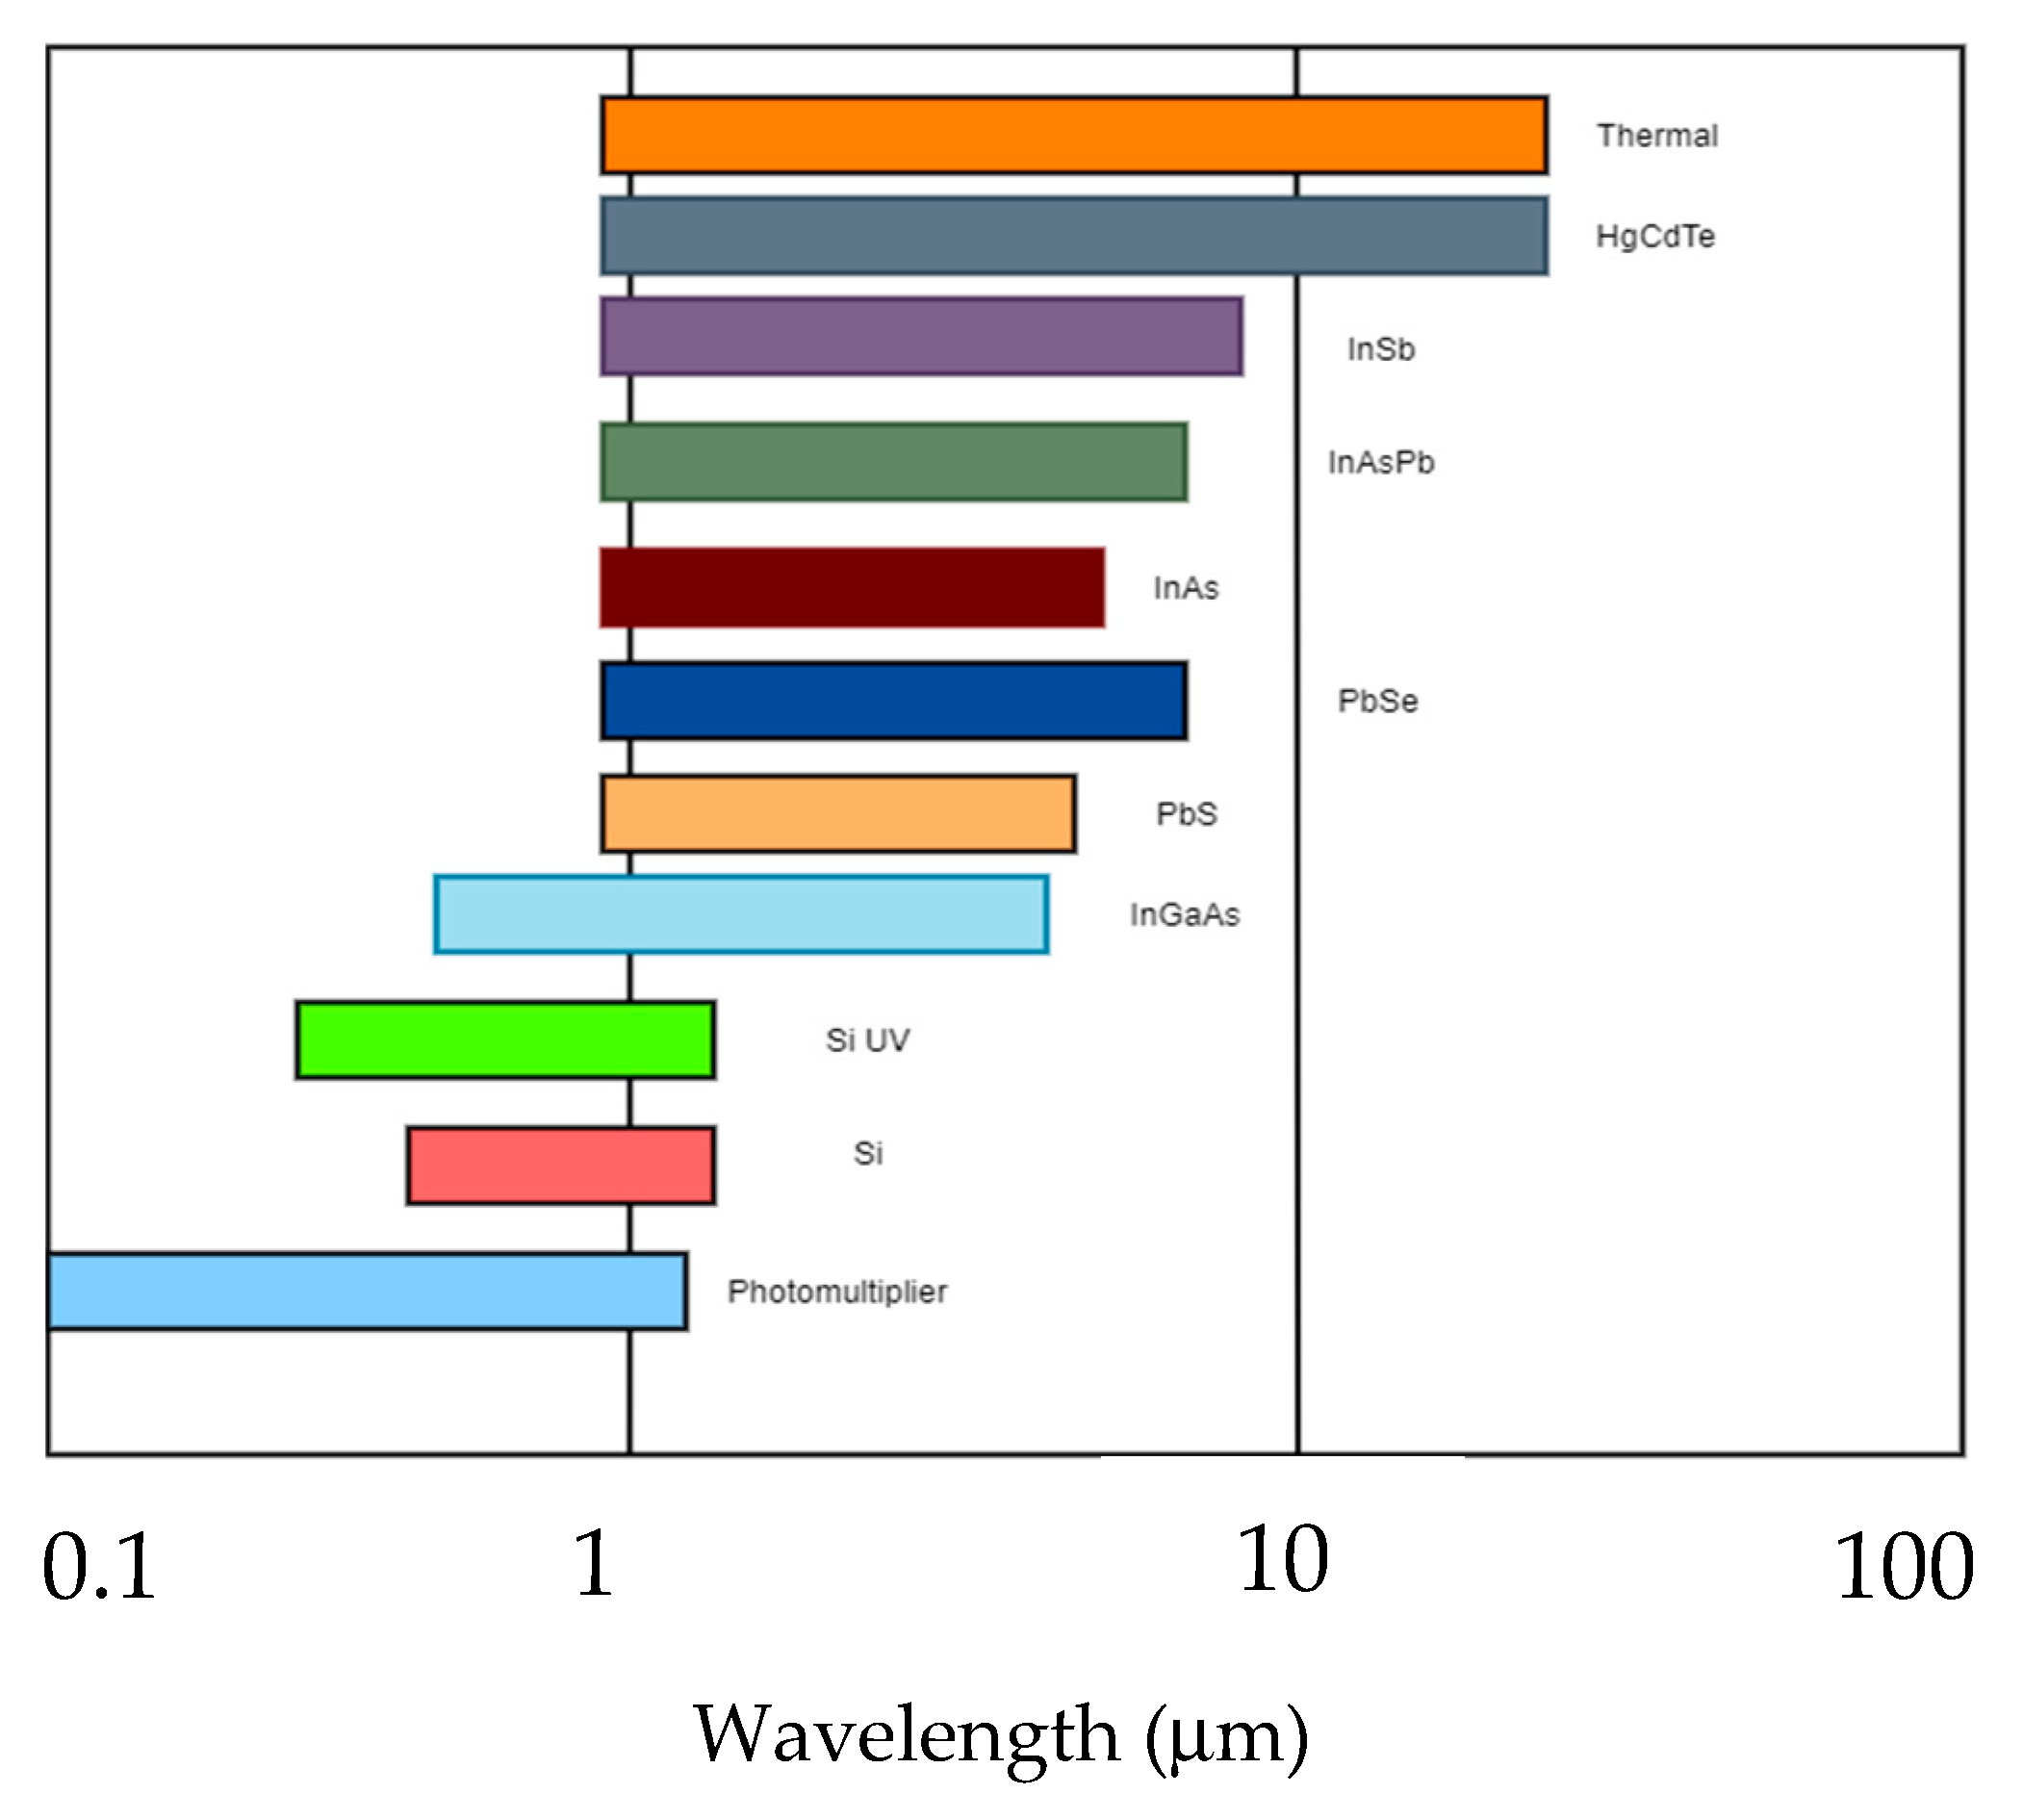
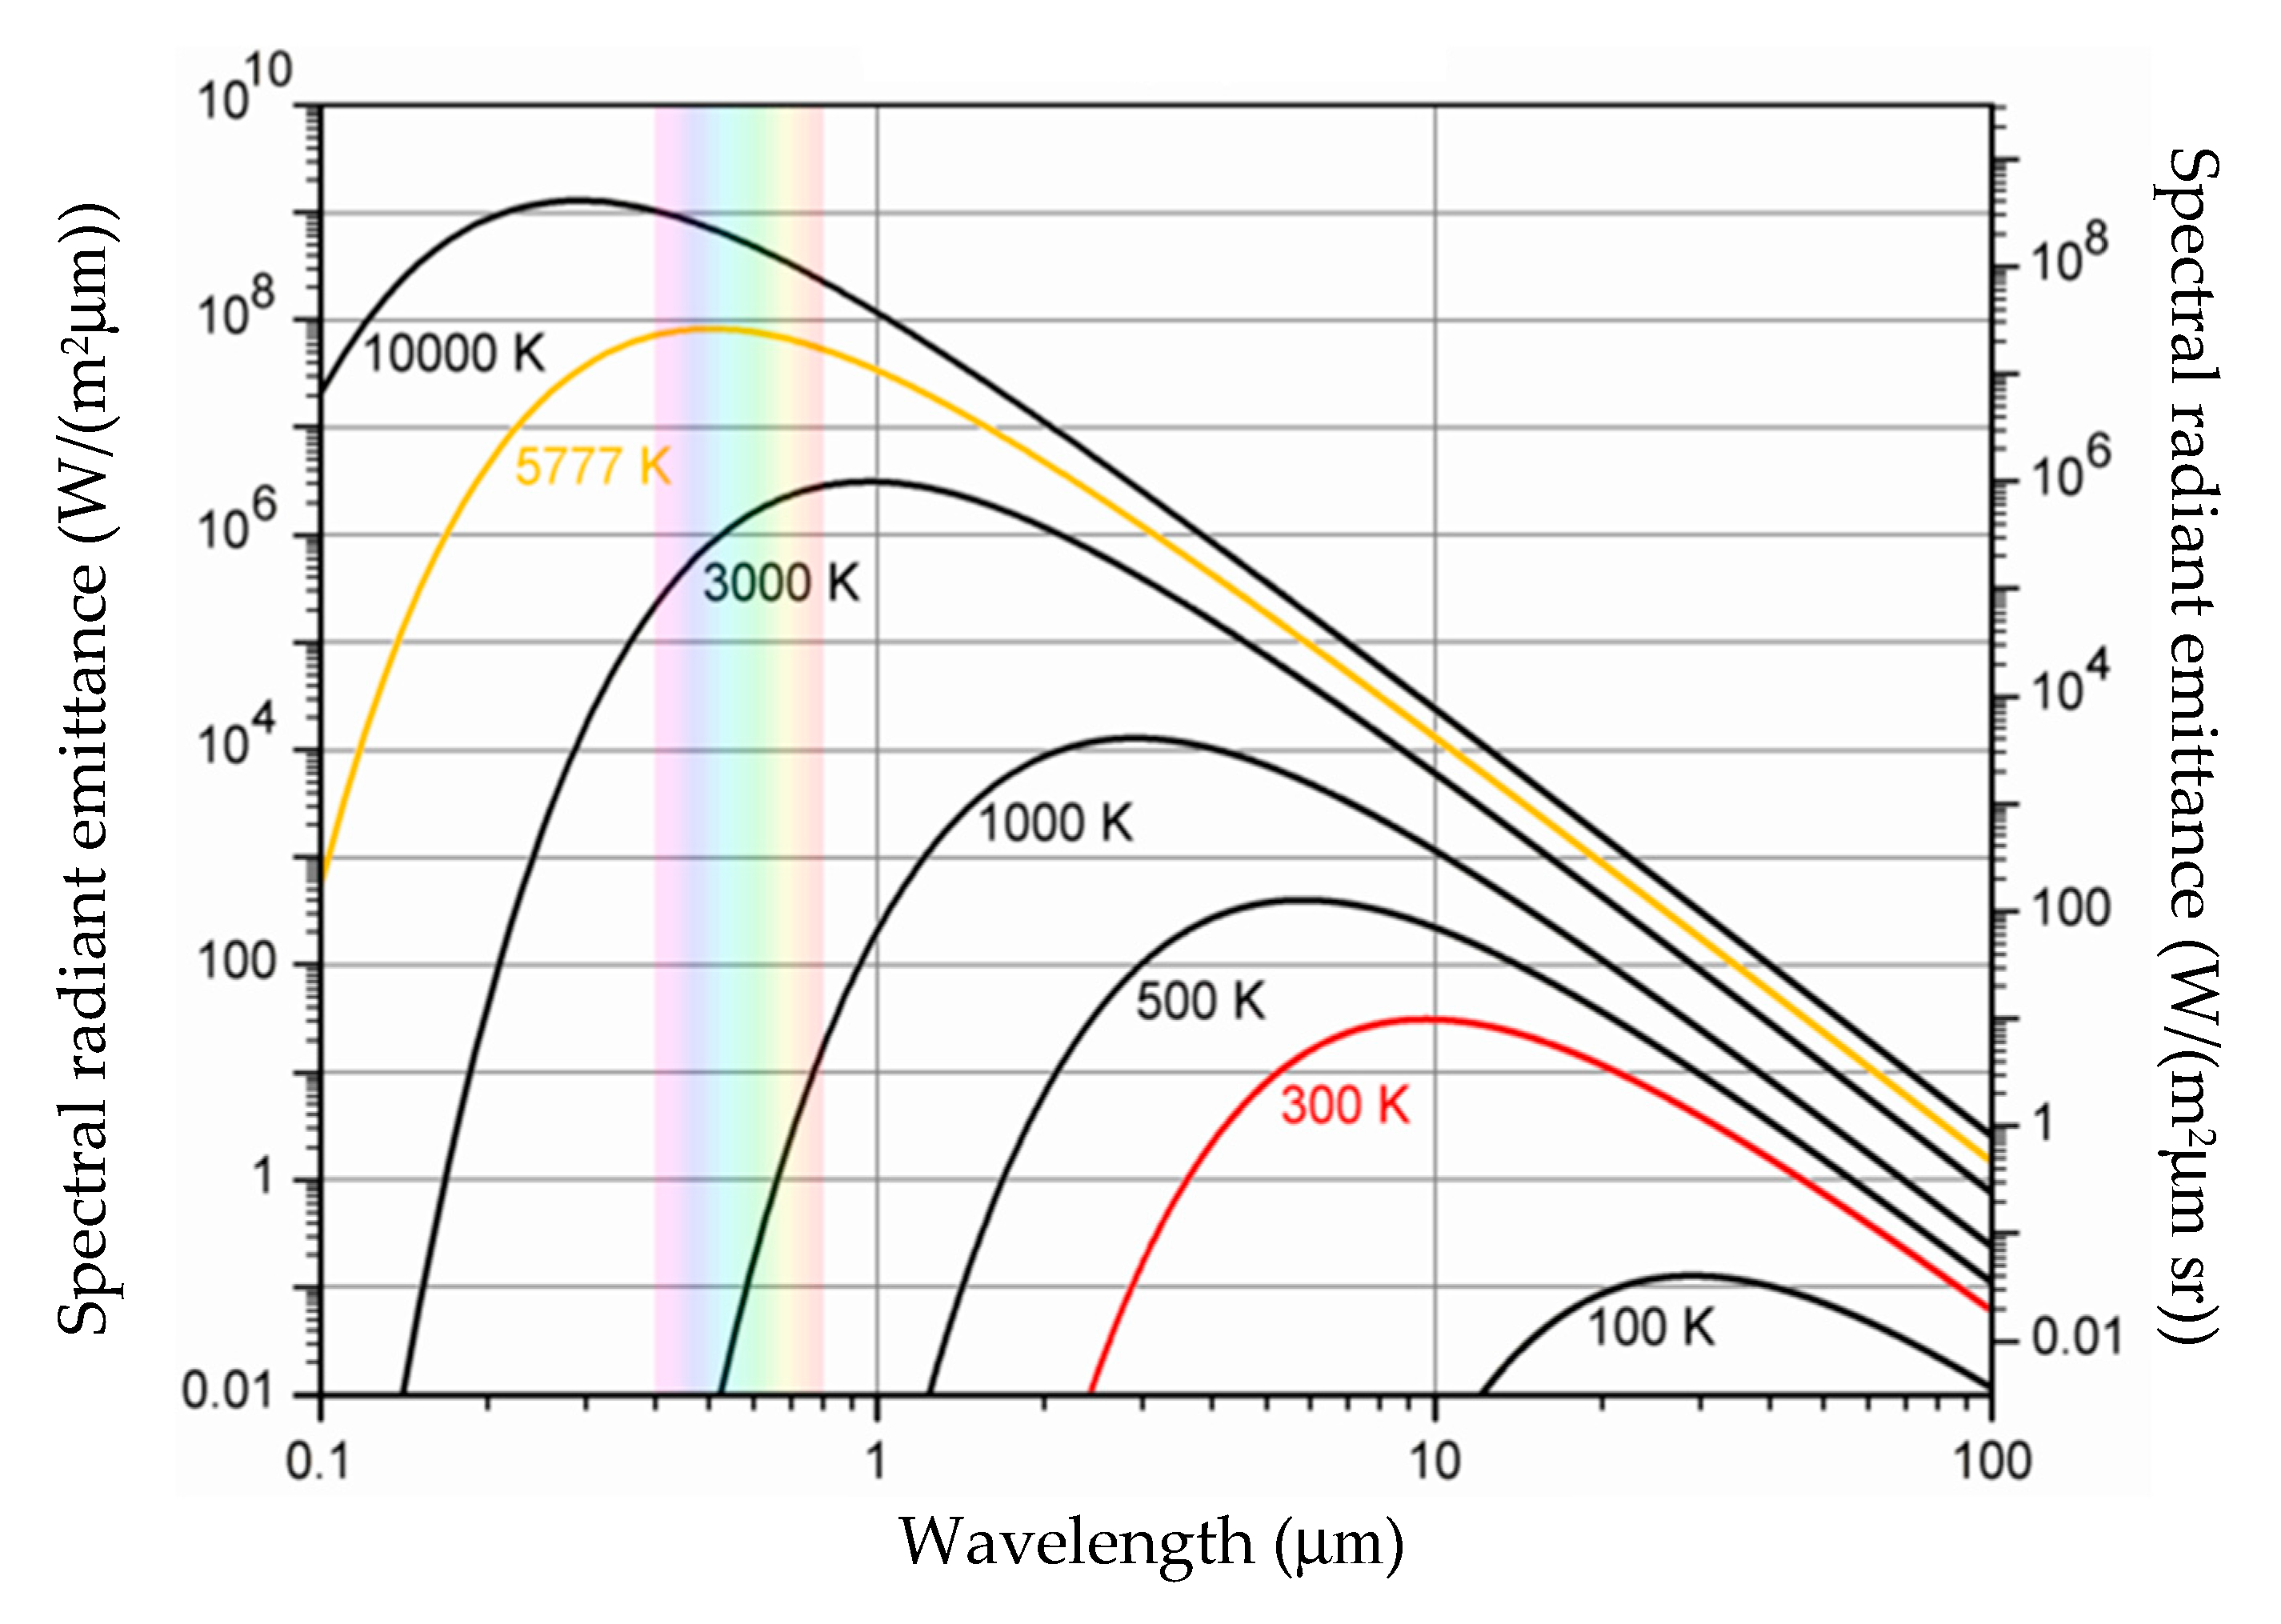
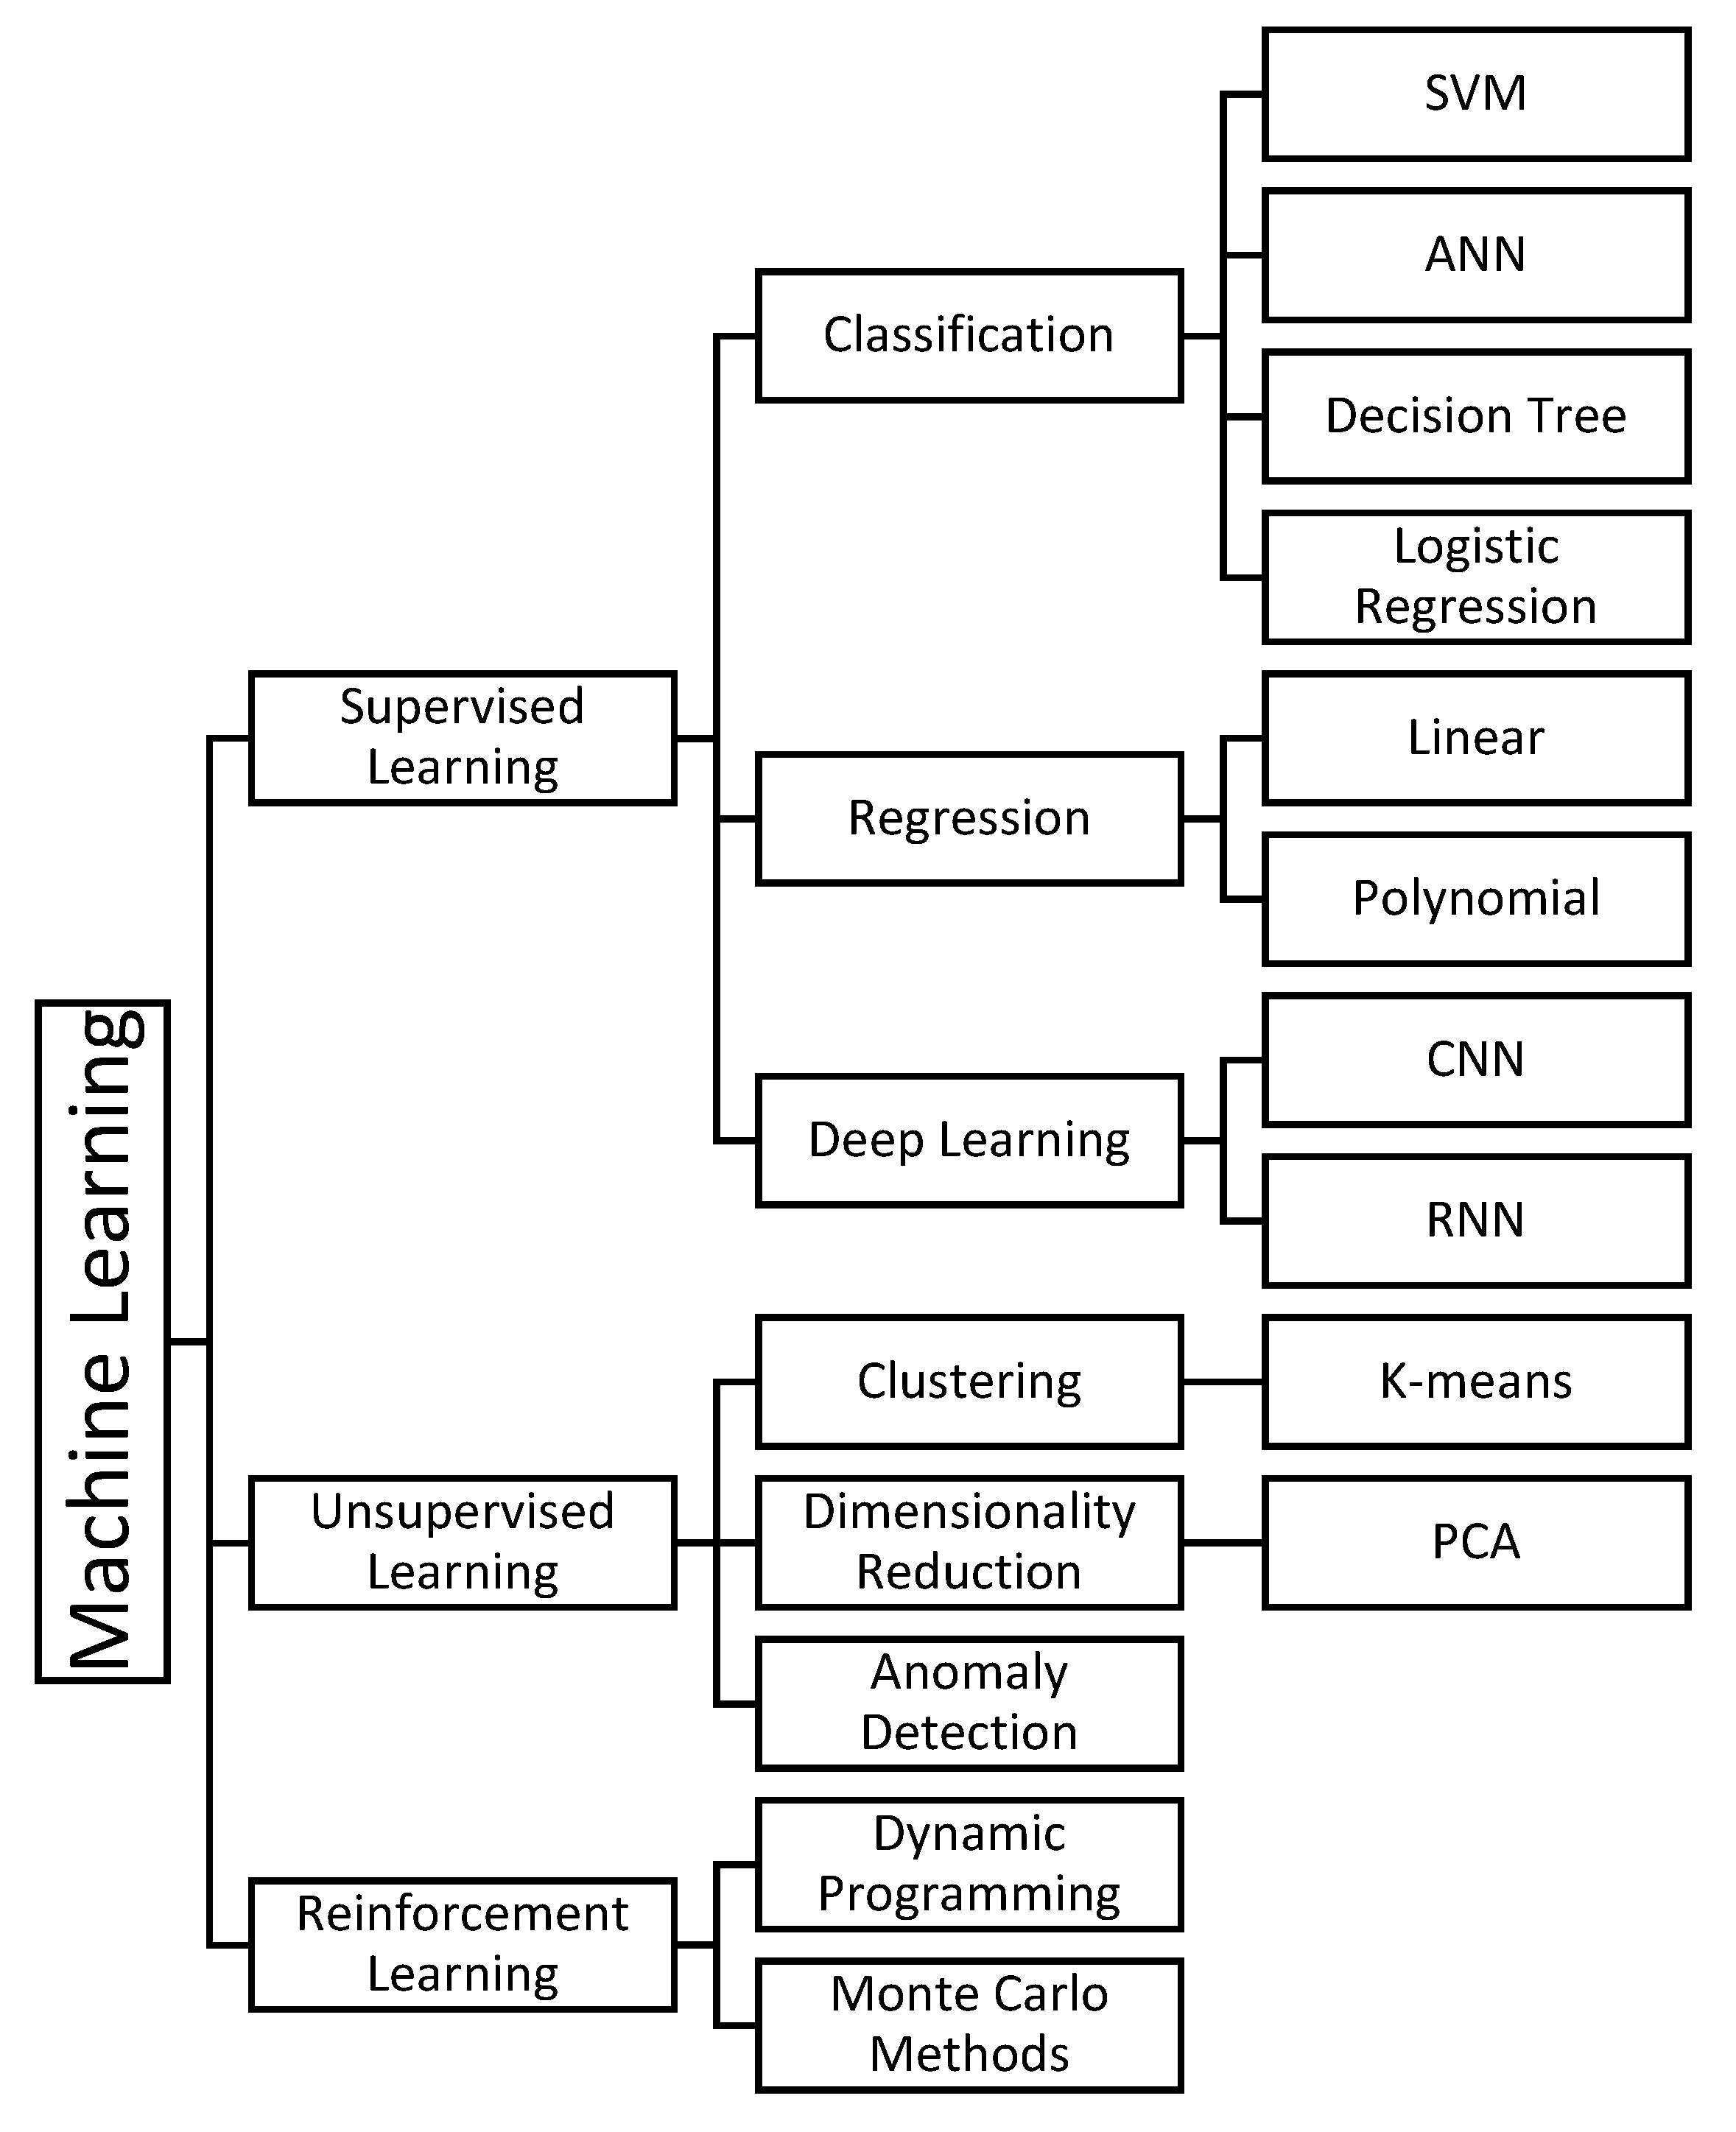