
Effect of Decoration of C@TiO2 Core-Shell Composites with Nano-Ag Particles on Photocatalytic Activity in 4-Nitrophenol Degradation

Abstract
:1. Introduction
2. Results
3. Materials and Methods
3.1. Chemicals
3.2. Synthesis
3.2.1. Preparation of C@TiO2 Composite
3.2.2. Deposition of Ag Nanoparticles
3.3. Characterization
3.4. Photocatalytic Activity
4. Conclusions
Author Contributions
Funding
Data Availability Statement
Conflicts of Interest
References
- Jurado, A.; Vàzquez-Suñé, E.; Carrera, J.; de Alda, M.L.; Pujades, E.; Barceló, D. Emerging organic contaminants in groundwater in Spain: A review of sources, recent occurrence and fate in a European context. Sci. Total. Environ. 2012, 440, 82–94. [Google Scholar] [CrossRef] [PubMed]
- Jurado, A.; Pujades, E.; Walther, M.; Diaz-Cruz, M.S. Occurrence, fate, and risk of the organic pollutants of the surface water watch List in European groundwaters: A review. Environ. Chem. Lett. 2022, 20, 3313–3333. [Google Scholar] [CrossRef]
- Diao, P.; Chen, Q.; Wang, R.; Sun, D.; Cai, Z.; Wu, H.; Duan, S. Phenolic endocrine-disrupting compounds in the Pearl River Estuary: Occurrence, bioaccumulation and risk assessment. Sci. Total. Environ. 2017, 584–585, 1100–1107. [Google Scholar] [CrossRef] [PubMed]
- Youbin, S.; Yongde, Y.; Zaipeng, W.; Ruyi, W.; Dapeng, D. Bioaccumulation and Biodegration of Phenol by the Algae Micro-cystis aeruginosa Kutz. J. Anhui Agric. Univ. 2000, 27, 269–271. [Google Scholar]
- Anku, W.W.; Mamo, M.A.; Govender, P.P. Chapter 17. Phenolic Compounds in Water: Sources, Reactivity, Toxicity and Treatment Methods. In Phenolic Compounds—Natural Sources, Importance and Applications, 1st ed.; Soto-Hernández, M., Palma-Tenango, M., García-Mateos, R., Eds.; IntechOpen: Rijeka, Croatia, 2017; Volume 1, pp. 419–443. [Google Scholar]
- Mahugo-Santana, C.; Sosa-Ferrera, Z.; Torres-Padrón, M.E.; Santana-Rodríguez, J.J. Analytical Methodologies for the Determination of Nitroimidazole Residues in Biological and Environmental Liquid Samples: A Review. Anal. Chim. Acta 2010, 665, 113–122. [Google Scholar] [CrossRef]
- Hättenschwiler, S.; Vitousek, R.M. The Role of Polyphenols in Terrestrial Ecosystem Nutrient Cycling. Trends Ecol. Evol. 2000, 15, 238–243. [Google Scholar] [CrossRef]
- Mukherjee, S.; Basak, B.; Bhunia, B.; Dey, A.; Mondal, B. Potential use of polyphenol oxidases (PPO) in the bioremediation of phenolic contaminants containing industrial wastewater. Rev. Environ. Sci. Bio/Technol. 2013, 12, 61–73. [Google Scholar] [CrossRef]
- Raza, W.; Lee, J.; Raza, N.; Luo, Y.; Kim, K.-H.; Yang, J. Removal of phenolic compounds from industrial waste water based on membrane-based technologies. J. Ind. Eng. Chem. 2019, 71, 1–18. [Google Scholar] [CrossRef]
- Dąbrowski, A.; Podkościelny, P.; Hubicki, Z.; Barczak, M. Adsorption of phenolic compounds by activated carbon—A critical review. Chemosphere 2005, 58, 1049–1070. [Google Scholar] [CrossRef]
- Mohammadi, S.; Kargari, A.; Sanaeepur, H.; Abbassian, K.; Najafi, A.; Mofarrah, E. Phenol removal from industrial wastewaters: A short review. Desalin. Water Treat. 2013, 53, 2215–2234. [Google Scholar] [CrossRef]
- Said, K.A.M.; Ismail, A.F.; Karim, Z.A.; Abdullah, M.S.; Hafeez, A. A review of technologies for the phenolic compounds recovery and phenol removal from wastewater. Process. Saf. Environ. Prot. 2021, 151, 257–289. [Google Scholar] [CrossRef]
- Ng, Y.S.; Jayakumar, N.S.; Hashim, M.A. Performance Evaluation of Organic Emulsion Liquid Membrane on Phenol Removal. J. Hazard. Mater. 2010, 184, 255–260. [Google Scholar] [CrossRef]
- Pradeep, N.V.; Anupama, S.; Navya, K.; Shalini, H.N.; Idris, M.; Hampannavar, U.S. Biological removal of phenol from wastewaters: A mini review. Appl. Water Sci. 2014, 5, 105–112. [Google Scholar] [CrossRef]
- Mojoudi, N.; Mirghaffari, N.; Soleimani, M.; Shariatmadari, H.; Belver, C.; Bedia, J. Phenol adsorption on high microporous activated carbons prepared from oily sludge: Equilibrium, kinetic and thermodynamic studies. Sci. Rep. 2019, 9, 19352. [Google Scholar] [CrossRef]
- Ren, T.; Jin, Z.; Yang, J.; Hu, R.; Zhao, F.; Gao, X.; Zhao, C. Highly Efficient and Stable p-LaFeO3/n-ZnO Heterojunction Photocatalyst for Phenol Degradation under Visible Light Irradiation. J. Hazard. Mater. 2019, 377, 195–205. [Google Scholar] [CrossRef]
- Busca, G.; Berardinelli, S.; Resini, C.; Arrighi, L. Technologies for the removal of phenol from fluid streams: A short review of recent developments. J. Hazard. Mater. 2008, 160, 265–288. [Google Scholar] [CrossRef]
- Makatsa, T.J.; Baloyi, J.; Ntho, T.; Masuku, C.M. Catalytic wet air oxidation of phenol: Review of the reaction mechanism, kinetics, and CFD modeling. Crit. Rev. Environ. Sci. Technol. 2020, 51, 1891–1923. [Google Scholar] [CrossRef]
- Besson, M.; Descorme, C.; Bernardi, M.; Gallezot, P.; Di Gregorio, F.; Grosjean, N.; Minh, D.P.; Pintar, A. Supported noble metal catalysts in the catalytic wet air oxidation of industrial wastewaters and sewage sludges. Environ. Technol. 2010, 31, 1441–1447. [Google Scholar] [CrossRef]
- De-Bin, L.; Duo, W.; Zi-Sheng, J. Catalytic Wet Air Oxidation of Sewage Sludge: A Review. Curr. Organocatal. 2020, 7, 199–211. [Google Scholar]
- Li, X.; Cubbage, J.W.; Tetzlaff, T.A.; Jenks, W.S. Photocatalytic Degradation of 4-Chlorophenol. 1. The Hydroquinone Pathway. J. Org. Chem. 1999, 64, 8509–8524. [Google Scholar] [CrossRef]
- Chen, D.; Ray, A.K. Photodegradation kinetics of 4-nitrophenol in TiO2 suspension. Water Res. 1998, 32, 3223–3234. [Google Scholar] [CrossRef]
- Subramaniam, M.N.; Goh, P.S.; Lau, W.J.; Ng, B.C.; Ismail, A.F. Chapter 3—Development of Nanomaterial-Based Photocatalytic Membrane for Organic Pollutants Removal. In Advanced Nanomaterials for Membrane Synthesis and its Applications, 1st ed.; Lau, W.J., Ismail, A.F., Isloor, A., Al-Ahmed, A., Eds.; Elsevier: Amsterdam, The Netherlands, 2019; Volume 1, pp. 45–67. [Google Scholar]
- Vaiano, V.; Matarangolo, M.; Murcia, J.; Rojas, H.; Navío, J.; Hidalgo, M. Enhanced photocatalytic removal of phenol from aqueous solutions using ZnO modified with Ag. Appl. Catal. B Environ. 2018, 225, 197–206. [Google Scholar] [CrossRef]
- Davis, A.P.; Huang, C.P. Removal of Phenols from Water by a Photocatalytic Oxidation Process. Water Sci. Technol. 1989, 21, 455–464. [Google Scholar] [CrossRef]
- Al-Hamdi, A.M.; Rinner, U.; Sillanpää, M. Tin Dioxide as a Photocatalyst for Water Treatment: A Review. Process Saf. Environ. Prot. 2017, 107, 190–205. [Google Scholar] [CrossRef]
- Mele, G.; Słota, R.; Dyrda, G. Chapter 12—Semiconductor @ Sensitizer Composites for Enhanced Photoinduced Processes. In Materials Science in Photocatalysis, 1st ed.; Garcia Lopez, E., Palmisano, L., Eds.; Elsevier: Amsterdam, The Netherlands, 2021; Volume 1, pp. 183–209. [Google Scholar]
- Dou, L.; Zhong, J.; Li, J.; Luo, J.; Zeng, Y. Fabrication of Bi2SiO5 hierarchical microspheres with an efficient photocatalytic performance for rhodamine B and phenol removal. Mater. Res. Bull. 2019, 116, 50–58. [Google Scholar] [CrossRef]
- Völz, H.G. Pigments, Inorganic. In Ullmann’s Encyclopedia of Industral Chemistry, 6th ed.; Ley, C., Elvers, B., Eds.; Wiley-VCH: Weinheim, Germany, 2002; Volume: Dyes and Pigments, pp. 1–145. [Google Scholar]
- Shawabkeh, R.A.; Khashman, O.A.; Bisharat, G.I. Photocatalytic Degradation of Phenol Using Fe-TiO2 by Different Illumination Sources. Int. J. Chem. 2010, 2, 10–18. [Google Scholar] [CrossRef]
- Hanaor, D.A.H.; Sorrell, C.C. Review of the Anatase to Rutile Phase Transformation. J. Mater. Sci. 2011, 46, 855–874. [Google Scholar] [CrossRef]
- Basavarajappa, P.S.; Patil, S.B.; Ganganagappa, N.; Reddy, K.R.; Raghu, A.V.; Reddy, C.V. Recent progress in metal-doped TiO2, non-metal doped/codoped TiO2 and TiO2 nanostructured hybrids for enhanced photocatalysis. Int. J. Hydrog. Energy 2019, 45, 7764–7778. [Google Scholar] [CrossRef]
- Mani, A.; Reddy, P.K.; Srinivaas, M.; Ghosal, P.; Xanthopoulos, N.; Subrahmanyam, C. Facile synthesis of efficient visible active C-doped TiO2 nanomaterials with high surface area for the simultaneous removal of phenol and Cr(VI). Mater. Res. Bull. 2015, 61, 391–399. [Google Scholar] [CrossRef]
- Huang, W.C.; Ting, J.-M. Novel nitrogen-doped anatase TiO2 mesoporous bead photocatalysts for enhanced visible light response. Ceram. Int. 2017, 43, 9992–9997. [Google Scholar] [CrossRef]
- Quesada-Cabrera, R.; Sotelo-Vázquez, C.; Quesada-González, M.; Melián, E.P.; Chadwick, N.; Parkin, I.P. On the apparent visible-light and enhanced UV-light photocatalytic activity of nitrogen-doped TiO2 thin films. J. Photochem. Photobiol. A Chem. 2017, 333, 49–55. [Google Scholar] [CrossRef]
- Belekbir, S.; El Azzouzi, M.; El Hamidi, A.; Rodríguez-Lorenzo, L.; Santaballa, J.A.; Canle, M. Improved Photocatalyzed Degradation of Phenol, as a Model Pollutant, over Metal-Impregnated Nanosized TiO2. Nanomaterials 2020, 10, 996. [Google Scholar] [CrossRef]
- Dobrosz-Gómez, I.; Gómez-García, M.; Zamora, S.L.; GilPavas, E.; Bojarska, J.; Kozanecki, M.; Rynkowski, J. Transition metal loaded TiO2 for phenol photo-degradation. Comptes Rendus Chim. 2015, 18, 1170–1182. [Google Scholar] [CrossRef]
- Ayati, A.; Ahmadpour, A.; Bamoharram, F.F.; Tanhaei, B.; Mänttäri, M.; Sillanpää, M. A Review on Catalytic Applications of Au/TiO2 Nanoparticles in the Removal of Water Pollutant. Chemosphere 2014, 107, 163–174. [Google Scholar] [CrossRef]
- Espino-Estévez, M.R.; Fernández-Rodríguez, C.; González-Díaz, O.M.; Araña, J.; Espinós, J.P.; Ortega-Méndez, J.A.; Doña-Rodríguez, J.M. Effect of TiO2–Pd and TiO2–Ag on the Photocatalytic Oxidation of Diclofenac, Isoproturon and Phenol. Chem. Eng. J. 2016, 298, 82–95. [Google Scholar] [CrossRef]
- Scott, T.; Zhao, H.; Deng, W.; Feng, X.; Li, Y. Photocatalytic degradation of phenol in water under simulated sunlight by an ultrathin MgO coated Ag/TiO2 nanocomposite. Chemosphere 2018, 216, 1–8. [Google Scholar] [CrossRef]
- Alberici, R.M.; Jardim, W.F. Photocatalytic Degradation of Phenol and Chlorinated Phenols Using Ag@TiO2 in a Slurry Reactor. Wat. Res. 1994, 28, 1845–1849. [Google Scholar] [CrossRef]
- UK Disagree with EU Position on Titanium Dioxide, Food Safety News. 9 March 2022. Available online: https://www.foodsafetynews.com/2022/03/uk-disagrees-with-eu-position-on-titanium-dioxide (accessed on 20 February 2023).
- Luo, Z.; Li, Z.; Xie, Z.; Sokolova, I.M.; Song, L.; Peijnenburg, W.J.G.M.; Hu, M.; Wang, Y. Rethinking Nano-TiO2 Safety: Overview of Toxic Effects in Humans and Aquatic Animals. Small 2020, 16, 2002019. [Google Scholar] [CrossRef]
- Jiang, X.; Manawan, M.; Feng, T.; Qian, R.; Zhao, T.; Zhou, G.; Kong, F.; Wang, Q.; Dai, S.; Pan, J.-H. Anatase and Rutile in Evonik Aeroxide P25: Heterojunctioned or Individual Nanoparticles? Catalysts 2018, 300, 12–17. [Google Scholar] [CrossRef]
- Sidor, K.; Berniak, T.; Łątka, P.; Rokicińska, A.; Michalik, M.; Kuśtrowski, P. Tailoring Properties of Resol Resin-Derived Spherical Carbons for Adsorption of Phenol from Aqueous Solution. Molecules 2021, 26, 1736. [Google Scholar] [CrossRef]
- Zhao, Y.; Wang, S.; Shen, Y.; Lu, X. Effects of Nano-TiO2 on Combustion and Desulfurization. Energy 2013, 56, 25–30. [Google Scholar] [CrossRef]
- Li, W.-X.; Stampfl, C.; Scheffler, M. Oxygen adsorption on Ag(111): A density-functional theory investigation. Phys. Rev. B 2002, 65, 075407. [Google Scholar] [CrossRef]
- Lekshmi, G.S.; Ramasamy, T.; Bazaka, O.; Levchenko, I.; Bazaka, K.; Govindan, R.; Mandhakini, M. Antioxidant, Anti-Bacterial, and Congo Red Dye Degradation Activity of AgxO-Decorated Mustard Oil-Derived rGO Nanocomposites. Molecules 2022, 27, 5950. [Google Scholar] [CrossRef] [PubMed]
- Van Noi, N.; Cam, B.D.; Cam, N.T.D.; Dong, P.T.; Phuong, D.T. Silver Doped Titania Materials on Clay Support for Enhanced Visible Light Photocatalysis. e-J. Surf. Sci. Nanotechnol. 2011, 9, 454–457. [Google Scholar] [CrossRef]
- Lazzarini, A.; Piovano, A.; Pellegrini, R.; Agostini, G.; Rudić, S.; Lamberti, C.; Groppo, E. Graphitization of Activated Carbon: A Molecular-Level Investigation by INS, DRIFT, XRD and Raman Techniques. Phys. Procedia 2016, 85, 20–26. [Google Scholar] [CrossRef]
- Xu, H.; Li, G.; Liu, N.; Zhu, K.; Zhu, G.; Jin, S. Ag@Hierarchical TiO2 Core-Shell Nanostructures for Enhanced Photocatalysis. Mater. Latt. 2015, 142, 324–327. [Google Scholar] [CrossRef]
- Xu, Y.; Wu, S.; Wan, P.; Sun, J.; Hood, Z.D. Introducing Ti3+ defect based on lattice distortion for enhanced visible light photoreactivuty in TiO2 microspheres. RSC Adv. 2017, 7, 3261–32467. [Google Scholar]
- Göpel, W.; Anderson, J.; Frankel, D.; Jaehnig, M.; Phillips, K.; Schäfer, J.; Rocker, G. Surface defects of TiO2(110): A combined XPS, XAES AND ELS study. Surf. Sci. 1984, 139, 333–346. [Google Scholar] [CrossRef]
- Akel, S.; Dillert, R.; Balayeva, N.O.; Boughaled, R.; Koch, J.; El Azzouzi, M.; Bahnemann, D.W. Ag/Ag2O as a Co-Catalyst in TiO2 Photocatalysis: Effect of the Co-Catalyst/Photocatalyst Mass Ratio. Catalysts 2018, 8, 647. [Google Scholar] [CrossRef]
- Fang, R.; He, M.; Huang, H.; Feng, Q.; Ji, J.; Zhan, Y.; Leung, D.Y.; Zhao, W. Effect of redox state of Ag on indoor formaldehyde degradation over Ag/TiO2 catalyst at room temperature. Chemosphere 2018, 213, 235–243. [Google Scholar] [CrossRef]
- Lin, X.; Rong, F.; Fu, D.; Yuan, C. Enhanced photocatalytic activity of fluorine doped TiO2 by loaded with Ag for degradation of organic pollutants. Powder Technol. 2012, 219, 173–178. [Google Scholar] [CrossRef]
- Yang, X.; Wang, Y.; Xu, L.; Yu, X.; Guo, Y. Silver and Indium Oxide Codoped TiO2 Nanocomposites with Enhanced Photo-catalytic Activity. J. Phys. Chem. C 2008, 112, 11481–11489. [Google Scholar] [CrossRef]
- Zhang, H.; Wang, G.; Lv, X.; Li, J. Tuning Photoelectrochemical Performances of Ag-TiO2 Nanocomposites via Reduction/Oxidation of Ag. Chem. Mater. 2008, 20, 6543–6549. [Google Scholar] [CrossRef]
- Grünert, W.; Brückner, A.; Hofmeister, H.; Claus, P. Structural Properties of Ag/TiO2 Catalysts for Acrolein Hydrogenation. J. Phys. Chem. B 2004, 108, 5709–5717. [Google Scholar] [CrossRef]
- Lai, Y.; Chen, Y.; Zhuang, H.; Lin, C. A facile method for synthesis of Ag/TiO2 nanostructures. Mater. Lett. 2008, 62, 3688–3690. [Google Scholar] [CrossRef]
- Keshavaraja, A.; She, X.; Flytzani-Stephanopoulos, M. Selective catalytic reduction of NO with methane over Ag-alumina catalysts. Appl. Catal. B Environ. 2000, 27, L1–L9. [Google Scholar] [CrossRef]
- Kundakovic, L.; Flytzani-Stephanopoulos, M. Deep oxidation of methane over zirconia supported Ag catalysts. Appl. Catal. A Gen. 1999, 183, 35–51. [Google Scholar] [CrossRef]
- Sung-Suh, H.M.; Choi, J.R.; Hah, H.J.; Koo, S.M.; Bae, Y.C. Comparison of Ag deposition effects on the photocatalytic activity of nanoparticulate TiO2 under visible and UV light irradiation. J. Photochem. Photobiol. A Chem. 2004, 163, 37–44. [Google Scholar] [CrossRef]
- Jaafar, N.; Jalil, A.; Triwahyono, S.; Efendi, J.; Mukti, R.; Jusoh, R.; Jusoh, N.; Karim, A.; Salleh, N.; Suendo, V. Direct in situ activation of Ag0 nanoparticles in synthesis of Ag/TiO2 and its photoactivity. Appl. Surf. Sci. 2015, 338, 75–84. [Google Scholar] [CrossRef]
- Harifi, T.; Montazer, M. Fe3+: Ag/TiO2 Nanocomposite: Synthesis, Characterization and Photocatalytic Activity under UV and Visible Light Irritation. Appl. Catal. A Gen. 2014, 473, 104–115. [Google Scholar] [CrossRef]
- Zielińska, A.; Kowalska, E.; Sobczak, J.W.; Łącka, I.; Gazda, M.; Ohtani, B.; Hupka, J.; Zaleska, A. Silver-doped TiO2 prepared by microemulsion method: Surface properties, bio- and photoactivity. Sep. Purif. Technol. 2010, 72, 309–318. [Google Scholar] [CrossRef]
- Mahy, J.G.; Lambert, S.D.; Léonard, G.L.-M.; Zubiaur, A.; Olu, P.-Y.; Mahmoud, A.; Boschini, F.; Heinrichs, B. Towards a large scale aqueous sol-gel synthesis of doped TiO2: Study of various metallic dopings for the photocatalytic degradation of pnitrophenol. J. Photochem. Photobiol. A 2016, 329, 189–202. [Google Scholar] [CrossRef]
- Hamrouni, A.; Azzouzi, H.; Rayes, A.; Palmisano, L.; Ceccato, R.; Parrino, F. Enhanced Solar Light Photocatalytic Activity of Ag Doped TiO2–Ag3PO4 Composites. Nanomaterials 2020, 10, 795. [Google Scholar] [CrossRef] [PubMed]
- Thompson, T.L.; Yates, J.T. Surface Science Studies of the Photoactivation of TiO2 New Photochemical Processes. Chem. Rev. 2006, 106, 4428–4453. [Google Scholar] [CrossRef] [PubMed]
- Makuła, P.; Pacia, M.; Macyk, W. How To Correctly Determine the Band Gap Energy of Modified Semiconductor Photocatalysts Based on UV–Vis Spectra. J. Phys. Chem. Lett. 2018, 9, 6814–6817. [Google Scholar] [CrossRef]


| Sample | Surface Area | Pore Volume | |||
|---|---|---|---|---|---|
| BET [m2·g−1] | Langmuir [m2·g−1] | Vtotal a [cm3·g−1] | Vmeso b [cm3·g−1] | Vmicro c [cm3·g−1] | |
| C@TiO2 | 404 | 496 | 0.325 | 0.104 | 0.124 |
| C@TiO2/Ag_IMP | 375 | 462 | 0.317 | 0.094 | 0.123 |
| C@TiO2/Ag_H2O | 380 | 473 | 0.318 | 0.108 | 0.114 |
| @TiO2 | 91 | 142 | 0.339 | 0.212 | 0.000 |
| @TiO2/Ag_IMP | 85 | 138 | 0.320 | 0.191 | 0.000 |
| @TiO2/Ag_H2O | 72 | 112 | 0.249 | 0.156 | 0.000 |
| P25 | 57 | 89 | 0.139 | 0.080 | 0.003 |
| P25/Ag_IMP | 47 | 74 | 0.244 | 0.156 | 0.001 |
| P25/Ag_H2O | 47 | 72 | 0.218 | 0.095 | 0.003 |
| Sample | Positions of XPS Peaks [eV] | Content of Surface Ag [at.%] | Eg [eV] | |||
|---|---|---|---|---|---|---|
| Ti 2p3/2 | Ti 2p1/2 | Ag 3d5/2 | Ag 3d3/2 | |||
| P25 | 459.0 | 464.7 | - | - | - | 3.20 |
| P25/Ag_IMP | 458.9 | 464.6 | 368.1 | 374.1 | 2.0 | 3.12 |
| P25/Ag_H2O | 458.5 | 464.2 | 367.8 | 373.8 | 1.4 | 3.21 |
| @TiO2 | 458.9 | 464.6 | - | - | - | 3.27 |
| @TiO2/Ag_IMP | 458.9 | 464.6 | 368.1 | 374.1 | 0.8 | 3.27 |
| @TiO2/Ag_H2O | 458.4 | 464.0 | 367.6 | 373.7 | 0.3 | 3.32 |
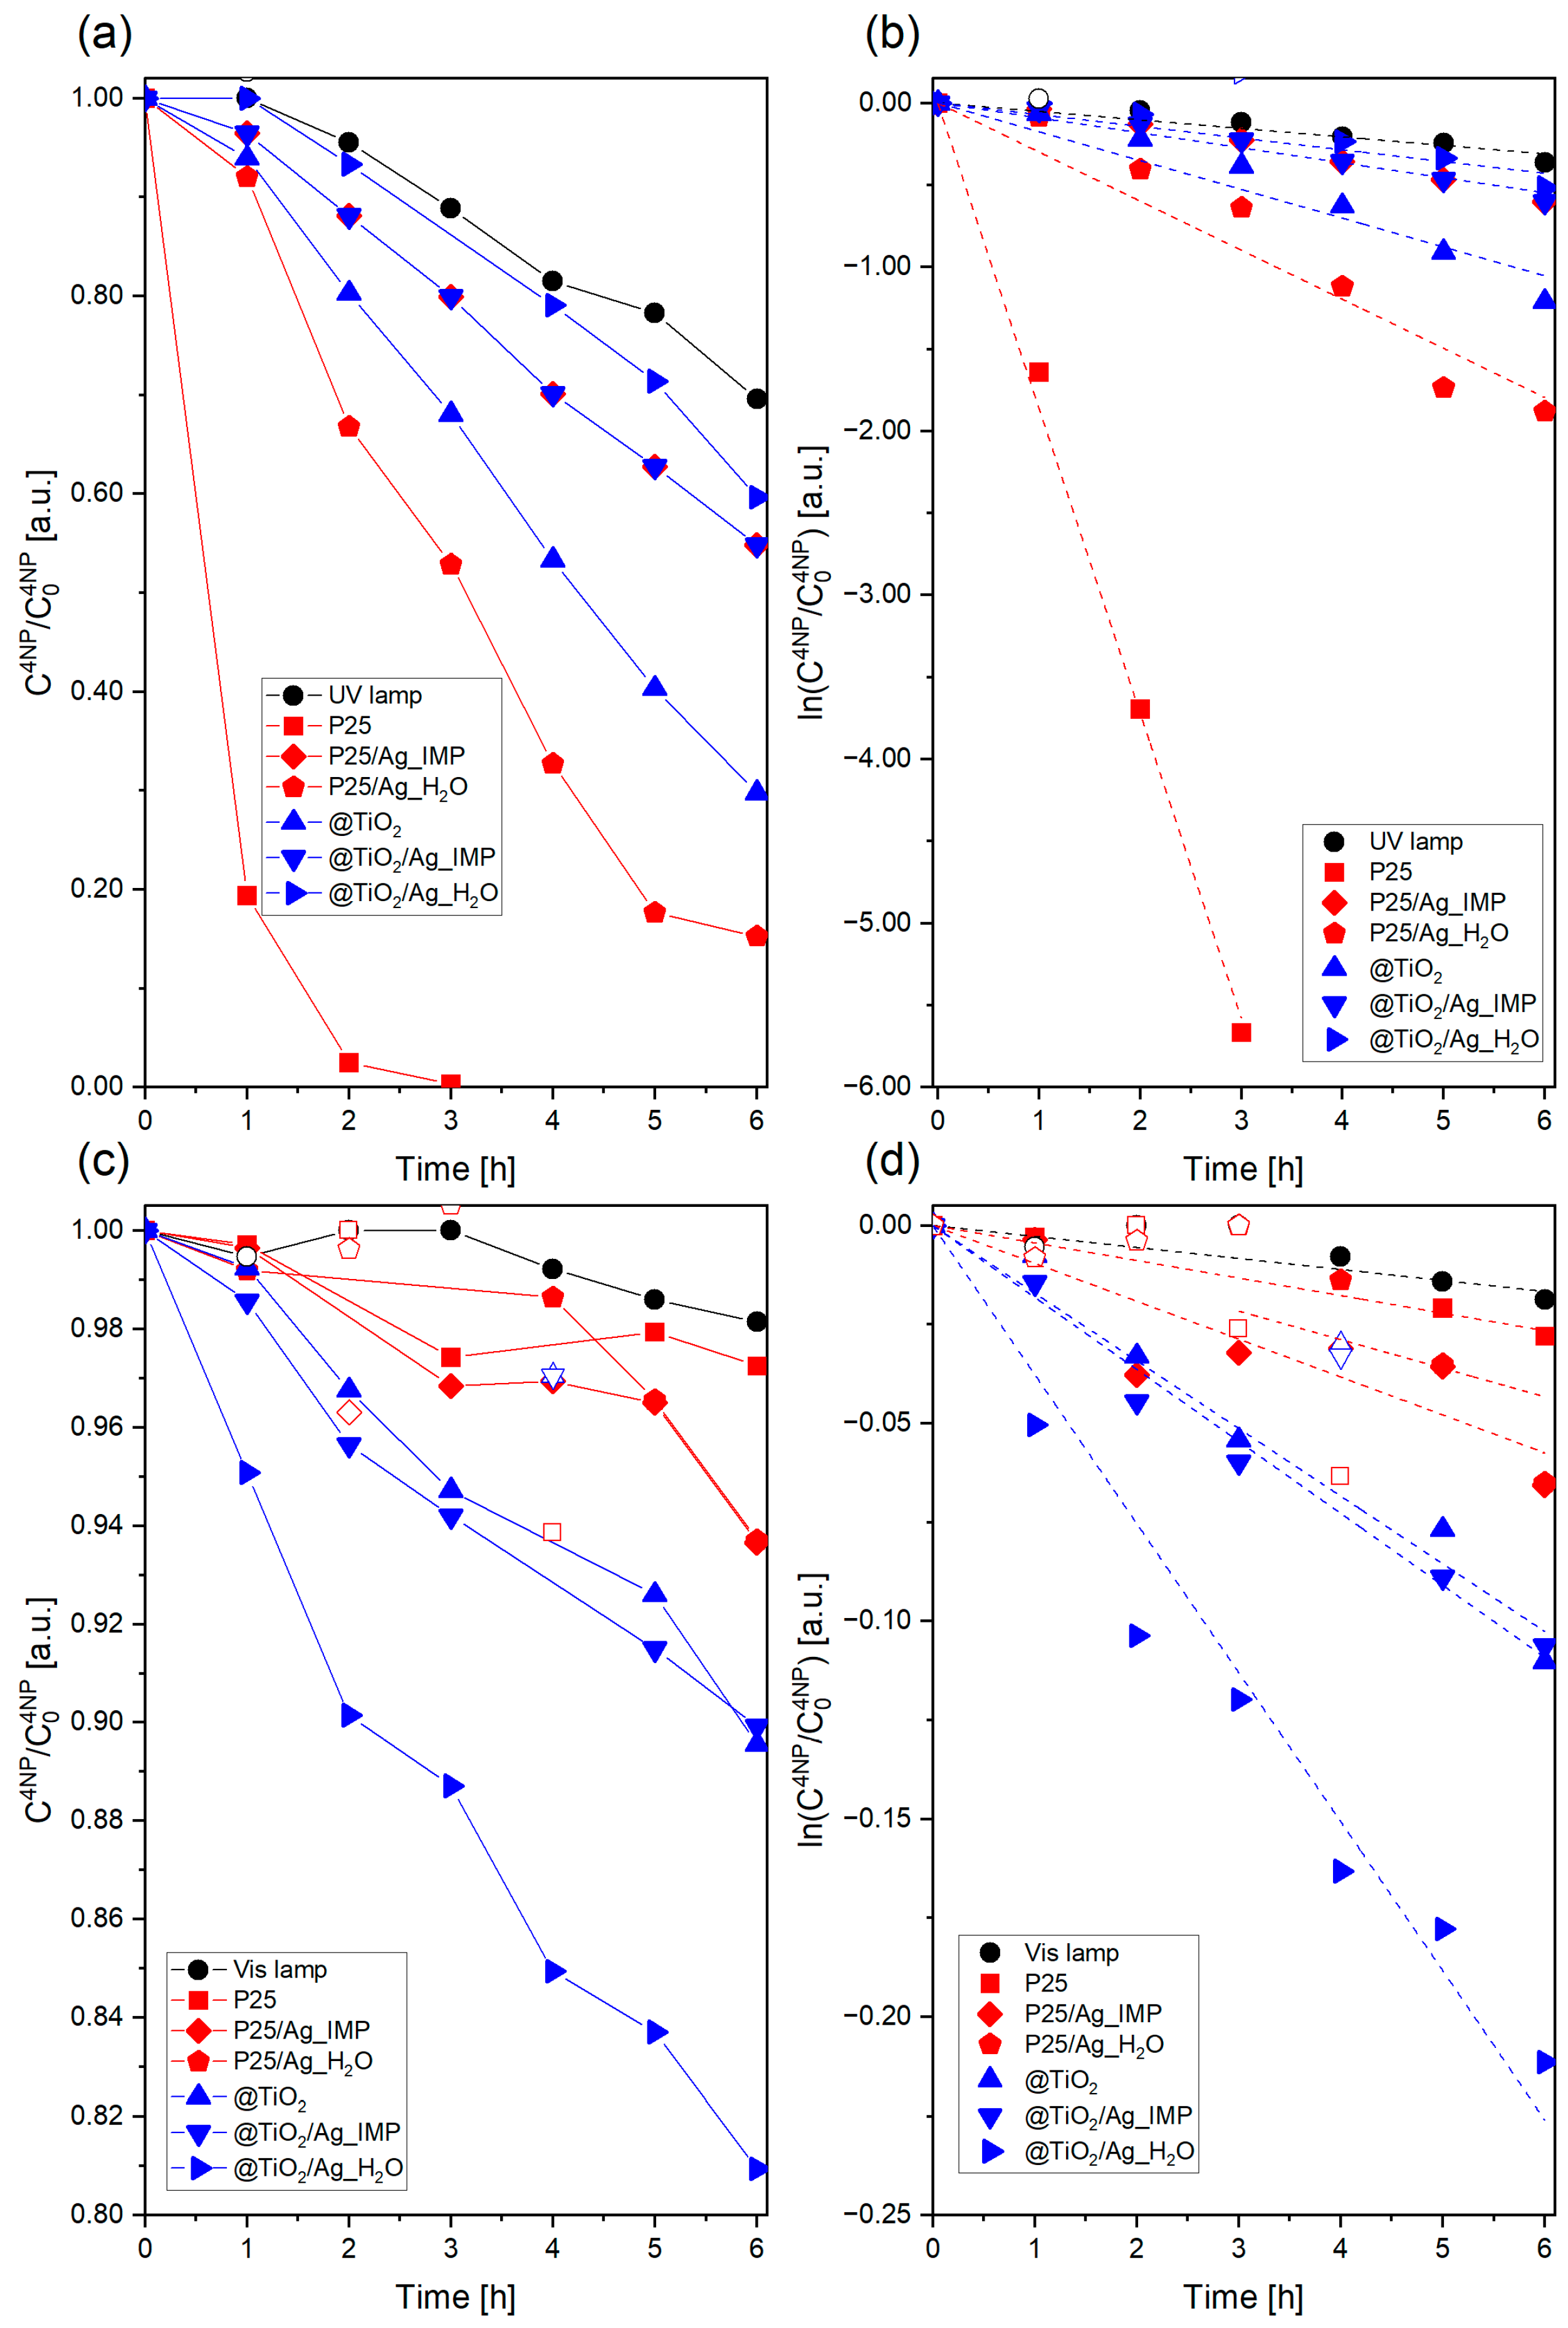
| Sample | UV (λ = 340 nm) | Vis (λ = 400–800 nm) | ||||
|---|---|---|---|---|---|---|
| C/C0 | k [h−1] | R2 | C/C0 | k [h−1] | R2 | |
| non (lamp) | 0.696 | 0.052 | 0.9692 | 0.982 | 0.0028 | 0.9756 |
| P25 | 0.004 | 1.8591 | 0.9988 | 0.973 | 0.0044 | 0.9952 |
| P25/Ag_IMP | 0.549 | 0.0913 | 0.9848 | 0.937 | 0.0096 | 0.9269 |
| P25/Ag_H2O | 0.153 | 0.2992 | 0.9734 | 0.937 | 0.0072 | 0.7925 |
| @TiO2 | 0.297 | 0.1757 | 0.9718 | 0.896 | 0.0171 | 0.9895 |
| @TiO2/Ag_IMP | 0.549 | 0.0913 | 0.9848 | 0.899 | 0.0182 | 0.9952 |
| @TiO2/Ag_H2O | 0.597 | 0.0715 | 0.9519 | 0.809 | 0.0376 | 0.9886 |
Disclaimer/Publisher’s Note: The statements, opinions and data contained in all publications are solely those of the individual author(s) and contributor(s) and not of MDPI and/or the editor(s). MDPI and/or the editor(s) disclaim responsibility for any injury to people or property resulting from any ideas, methods, instructions or products referred to in the content. |
© 2023 by the authors. Licensee MDPI, Basel, Switzerland. This article is an open access article distributed under the terms and conditions of the Creative Commons Attribution (CC BY) license (https://creativecommons.org/licenses/by/4.0/).
Share and Cite
Sidor, K.; Lehmann, R.; Rokicińska, A.; Berniak, T.; Dębosz, M.; Kuśtrowski, P. Effect of Decoration of C@TiO2 Core-Shell Composites with Nano-Ag Particles on Photocatalytic Activity in 4-Nitrophenol Degradation. Catalysts 2023, 13, 764. https://doi.org/10.3390/catal13040764
Sidor K, Lehmann R, Rokicińska A, Berniak T, Dębosz M, Kuśtrowski P. Effect of Decoration of C@TiO2 Core-Shell Composites with Nano-Ag Particles on Photocatalytic Activity in 4-Nitrophenol Degradation. Catalysts. 2023; 13(4):764. https://doi.org/10.3390/catal13040764
Chicago/Turabian StyleSidor, Karol, Róża Lehmann, Anna Rokicińska, Tomasz Berniak, Marek Dębosz, and Piotr Kuśtrowski. 2023. "Effect of Decoration of C@TiO2 Core-Shell Composites with Nano-Ag Particles on Photocatalytic Activity in 4-Nitrophenol Degradation" Catalysts 13, no. 4: 764. https://doi.org/10.3390/catal13040764