
3D Flower-like TiO2 Nanostructures: Anatase-To-Rutile Phase Transformation and Photoelectrochemical Application

1
AGH University of Science and Technology, Faculty of Materials Science and Ceramics, al. A. Mickiewicza, 30-059 Kraków, Poland
2
AGH University of Science and Technology, Faculty of Energy and Fuels, al. A. Mickiewicza 30, 30-059 Kraków, Poland
*
Author to whom correspondence should be addressed.
Catalysts 2023, 13(4), 671; https://doi.org/10.3390/catal13040671
Submission received: 28 February 2023
/
Revised: 27 March 2023
/
Accepted: 28 March 2023
/
Published: 29 March 2023
(This article belongs to the Section Nanostructured Catalysts)
Abstract
:Flower-like TiO2 nanostructures were obtained by chemical oxidation of Ti foil using H2O2 combined with subsequent annealing. This paper offers an analysis of the phase transformation of 3D flower-like titanium dioxide nanostructures. The role of the annealing atmosphere, sample thickness, grain shape, and nanoflower size are discussed. The nanostructures were examined using SEM, XRD, and Raman spectroscopy. Due to the nature of these two processes, the morphology of these nanomaterials is complex, and is obtained through a reaction involving Ti foil and H2O2 at 80°C. A distinction is made between the layer composed of small grains at the substrate/oxide interface, elongated crystal-like structures, and outer spongle-like film. The annealing parameters, such as atmosphere (air or argon) and temperature (450 or 600 °C), affect phase composition. The photoelectrochemical performance of the anode based on flower-like TiO2 has been shown. The thickness and phase composition of the anodes are factors that strongly affect the photocurrent. The multiphase heterojunctions proposed for 3D flower-like TiO2 photoanodes in photoelectrochemical (PEC) cells suppose that the conduction band of anatase should be above rutile. The highest photoelectrochemical performance was obtained for a photoanode composed of 20–40% anatase and an associated thickness of 0.75–1.5 µm.
1. Introduction
TiO2 is among the first semiconductors for which the photodecomposition of water has been experimentally demonstrated [1]. For hydrogen generation in photoelectrochemical (PEC) cells, metal oxides (e.g., TiO2, ZnO, WO3, Fe2O3, BiVO4) have been widely studied [2,3]. Investigations are focused on overcoming some limitations of metal oxide semiconductors. In the case of photoanodes based on wide-bandgap semiconductors, the ability to absorb visible light is limited. However, for narrow-bandgap oxides, it is due to the low chemical stability or edge shift of the conduction and valence bands and the redox potential of water. In both wide-band-gap materials, there is a recombination of charge carriers.
Titanium dioxide was used as a photoanode in a photoelectrochemical (PEC) cell and still plays a key role in photoelectrochemistry. Continuing effort is required to modify the physicochemical properties of TiO2 to achieve a high conversion efficiency of solar energy to chemical energy (hydrogen). The efficiency of the photoelectrochemical cell is significantly dependent on the processes in the photoactive electrode, which include (1) light absorption, (2) charge separation and migration, and (3) competition between charge recombination on the surface and in the bulk of photoanodes. It has been admitted that one of the best ways to improve the performance of photoelectrochemical devices is to change the electronic structure of TiO2 [4]. Several strategies that could provide a longer lifetime of photocharge carriers for photoelectrodes based on the semiconductor have been proposed, while the creation of multicomponent composites composed of multicomponent (semiconductor/metal or semiconductor/semiconductor) or multiphase heterojunctions can be an effective method to improve carrier separation [2,5].
TiO2 has three main crystal phases: brookite, anatase, and rutile. Anatase has advantages over the rutile phase in terms of its photocatalytic and photoelectrochemical applications [2]. On the other hand, the synergistic effect of anatase-rutile is well-known [6,7]. According to the literature, the optimal phase composition of mixtures varies in different reports [5,7]; however, high photoactivity is only observed for multiphase composites prepared in situ. Some authors attribute the synergetic effect to the electronic band alignment of the anatase and rutile structures [5]. The coexistence of the anatase and rutile phases has shown enhanced charge carrier separation. On the other hand, A. K. Wahab et al. [7] have suggested that lattice expansion of the anatase phase along the c-dimension can be related to increasing the reaction rate.
Brookite and anatase irreversibly transform to rutile at elevated temperatures in various ways: anatase-to-brookite-to-rutile, anatase-to-rutile, brookite-to-rutile, or brookite-to-anatase-to-rutile [8]. The phase transformation process and the order of polymorphic appearance are determined by several parameters, including material synthesis (temperature, atmosphere, heating rate), impurities [9], and titania morphology [8,10]. The conversion of amorphous TiO2 to rutile is observed in the range of 300 to 1200 °C. Nevertheless, in the case of nanomaterials, the surface area is important. The impact of phase stability can be reversed. In the literature, the main parameters considered to affect the transformation of the anatase-to-rutile in nanomaterials are grain size and shape. Both experimental [11,12,13] and theoretical [14,15] studies suggest that due to slight differences in surface energy, the transformation sequence may vary. Zhang and Banfield [8] developed a stability range of individual polymorphics. Anatase is the preferred form for grains smaller than 11 nm, rutile is most frequently observed for grains over 35 nm in size, while grains ranging from 11 to 35 nm are predominantly brookite. The boundary between anatase and rutile inversion was determined to be 16 nm, which is in agreement with earlier calculations (14 nm) [15]. On the basis of calorimetric measurements [13] of nanocrystalline titanium dioxide, ranges of stability of the various phases were proposed as a function of surface area. As a metastable phase, brookite can be converted into anatase (38 nm) or rutile (145 nm); this is associated with a decrease in surface energy. Thermodynamic properties are closely related to grain size and surface-to-volume ratio. Energy changes associated with surface morphology are also expected. The greater the modification of the shape of the nanomaterial, the greater the value of the enthalpy changes on the surface. Consequently, this value is the lowest for spherical 0D nanoparticles and the highest for more complicated 3D systems [16].
Table 1 shows examples of TiO2-based nanostructures with different contributions of anatase-to-rutile. The classification of nanostructures is based on the number of dimensions that are greater than 100 nm (e.g., 1D-two dimensions are at the nanoscale and the other is outside the nanoscale). The largest number of papers is related to the application of 0D and 3D materials in photocatalysis. In many works, the range of contribution of anatase to rutile is not so wide or is not specified.
All the features mentioned above suggest that the influence of titanium dioxide surface modification on anatase-to-rutile phase transformation and the underlying mechanism should be analyzed.
An alternative approach is a modification of titania morphology and microstructure and the formation of functionalized TiO2 structures [2,17]. Titanium dioxide nanostructures of different dimensionalities have been studied for practical application in photocatalysis, photoelectrochemistry, and gas detection [2,18]. In a PEC, the photoelectrode is produced from a semiconductor which is supported on a conductive substrate and can act as a photoanode in the case of an n-type semiconductor (a p-type semiconductor as the cathode).

Table 1.
TiO2-based nanostructures with different contributions of anatase-to-rutile.
| Nanostructure | Anatase Fraction, fA | The Optimum Mixture, fA | Application | References |
|---|---|---|---|---|
| 0D | 36–89% | 36% | photocatalysis | [19] |
| 80% | 80% | photocatalysis | [20,21] | |
| 80–100% | 100% | photocatalysis | [22] | |
| 80% or 92% | improved the photodegradation for mixed-phase TiO2 materials compared to anatase | photocatalysis | [23] | |
| not specified | improved the separation and transfer of photogenerated electrons and holes | photocatalysis | [24] | |
| 1D | 80–100% | improved photodegradation for mixed-phase TiO2 nanotubes compared to anatase nanotubes | photocatalysis | [25] |
| 29–100% | 57% | photocatalysis | [26] | |
| 15–98% | 98% | photocatalysis | [27] | |
| 2D | 0–100% | 74% | photoanode in PEC | [28] |
| 0–82% | 60% | photocatalysis | [6] | |
| not specified | studies the role of phase junction in PEC water splitting | photoanode in PEC | [29] | |
| 3D | 14–91% | 82% | photocatalysis | [30] |
| not specified | improved Iph compared to anatase | photoanode in PEC | [31] | |
| not specified | improved the photodegradation for mixed-phase TiO2 materials compared to P25 | photocatalysis | [32] | |
| not specified | improved charge separation due to the migration across the anatase–rutile interface | photocatalysis | [33] | |
| 40–77% | 77% | photocatalysis | [34] |
The design and production of semiconductors with high photoactivity and stability, with the assurance of transport of photoelectrons via external wire to the cathode, are among the most important aspects of materials engineering. In our previous work [35,36], 1D and 3D TiO2 nanostructures on titanium foil were studied as photoanodes in the water photolysis process. TiO2 in the form of nanotubes (1D) and nanoflower (3D) were prepared on the titanium substrate using electrochemical and chemical oxidation processes, respectively. It was shown that the 3D interconnected architecture improved photoelectrochemical performance.
The present work aims to study the role of the preparation conditions of TiO2 nanoflowers, such as the annealing temperature or atmosphere, as well as microstructure parameters such as grain size, for the phase transformation anatase/rutile and the morphology of the photoanode in PEC. Moreover, the heterojunction effect formed between anatase and rutile in a wide range of ratios in 3D mesoporous nanostructures applied as photoanodes in photoelectrochemical water splitting is highlighted.
2. Results and Discussion
2.1. Phase Transformation Mechanism in TiO2 Flower-like Nanostructures
Phase transformation is based on the reconstruction of the crystallographic structure, which involves band breaking and reforming. The particular phase modification behavior depends primarily on time and temperature during thermal treatment.
On the other hand, surface modification results in a different surface energy. The more complicated the morphology, the higher the energy [37], which affects the synthesis of multiphase functional materials. In our studies, we focused on the impact of temperature, annealing atmosphere, and grain size on the phase transformation in 3D flower-like titanium dioxide.
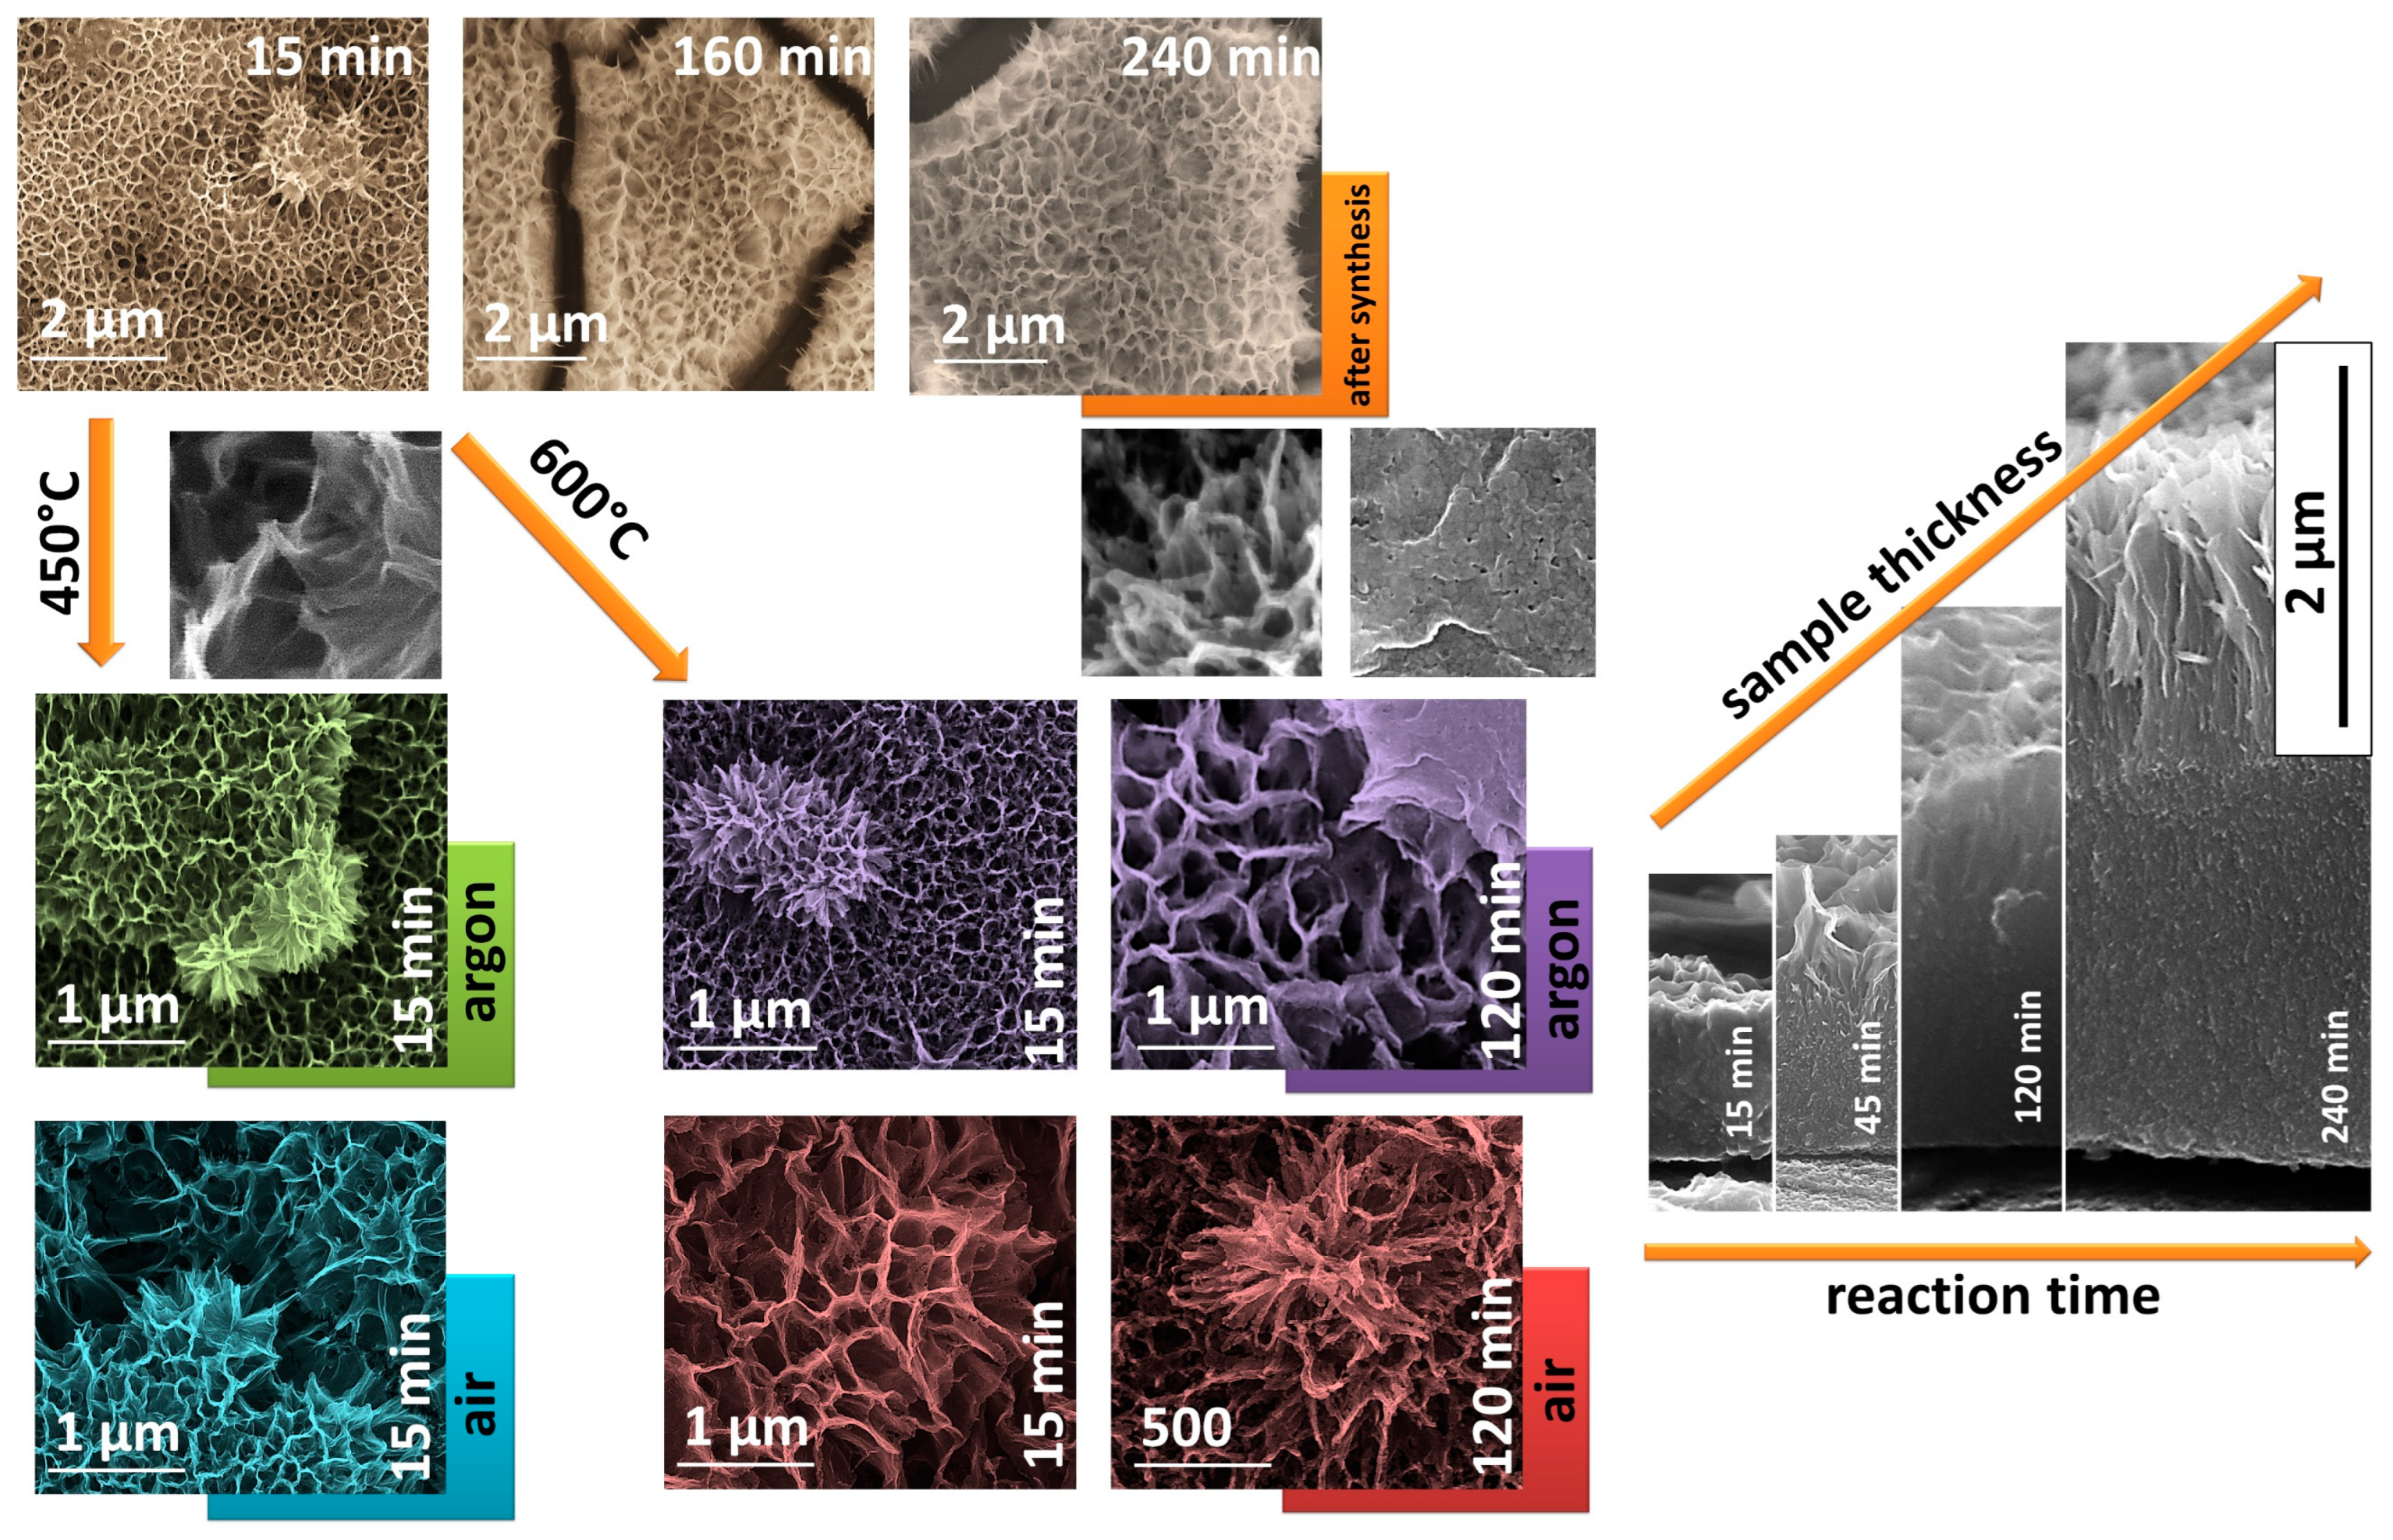
Figure 1 shows the impact of preparation conditions, including synthesis time, type of atmosphere, and temperature used for annealing, on nanostructure morphology (SEM analysis). It was shown that, for all samples, a complex structure consists of a sponge-like layer and, uniformly distributed at the surface, flower-like forms. Their size increases as synthesis time increases, from 600 nm (15 min) to 6.5 µm (240 min). As a result of the flower-like structure’s growth, cracks appear due to the surface stress and mass transport on the surface. The influence of process conditions on the sample morphology becomes evident after annealing in various atmospheres at 600 °C. The surface of nanoflower petals obtained after heating in the air instead of argon is rough and composed of several grains that retain contact with one another. This affects their porosity and specific surface area. Nevertheless, no impact of the annealing conditions on sample thickness was observed. Regardless of the choice of annealing conditions, the thickness of the sample is determined by the oxidation process time and varies from 0.17 μm (15 min) to approximately 4 μm (240 min). The film thickness values determined using ImageJ software are summarized in Table 2.
The direct analysis of the phase composition after the annealing process in both air and argon environments is shown in Figure S1a,b. After calcination at 450 °C, regardless of the atmosphere and duration of the Ti foil oxidation process, the nanoflowers crystallized in the anatase form, with a small amount of rutile present (approximately 3 wt%). Diffraction patterns related to the metallic substrate are visible. Their intensity decreases with the increasing thickness of the nanostructured TiO2 layer. The crystallite size (dXRD) varies in the range of 8 to 16 nm (Table 2).
The phase composition of the nanostructured layers changes after annealing at 600 °C depending on ambient conditions. Though the anatase-to-rutile ratio remains stable despite the chemical oxidation time after thermal treatment in air, conducting the process in the atmosphere of argon results in the predominant form of TiO2 (anatase) changing. From a 15 min synthesis time to a longer reaction time, the subsequently increased sample thickness and phase shifts from rutile-to-anatase can be observed. The relation between crystallite size and Ti foil oxidation time is shown in Table 1. The size of the anatase crystallites increases from about 13 nm after 19 min of reaction to approximately 19 nm after 240 min. On the other hand, the size of rutile crystallites decreases from 19 to 5 nm over a longer reaction process. Meanwhile, when annealing in the air, a stable mixed phase with a crystallite size of 10nm to 17 nm emerged.
The results obtained show that annealing conditions have a significant influence on the transformation. It is well known that titanium can easily react with oxygen species and form TiO2. An oxygen-free atmosphere (argon) favors the formation of oxygen vacancies (1) with high mobility.
For nanostructures grown on the titanium foil substrate, defects accumulate at the metal/oxide interface, the oxide/gas interface, and inside the nanostructured oxide layer [38]. Depending on the rate of diffusion of oxygen species through the grain boundary network and their availability, different amounts of rutile can be obtained. In a reducing atmosphere (argon), the rupturing of Ti-O bonds occurs more easily in the anatase structure. The introduction of oxygen vacancies affects the octahedral rearrangement, leading to the formation of rutile [39].
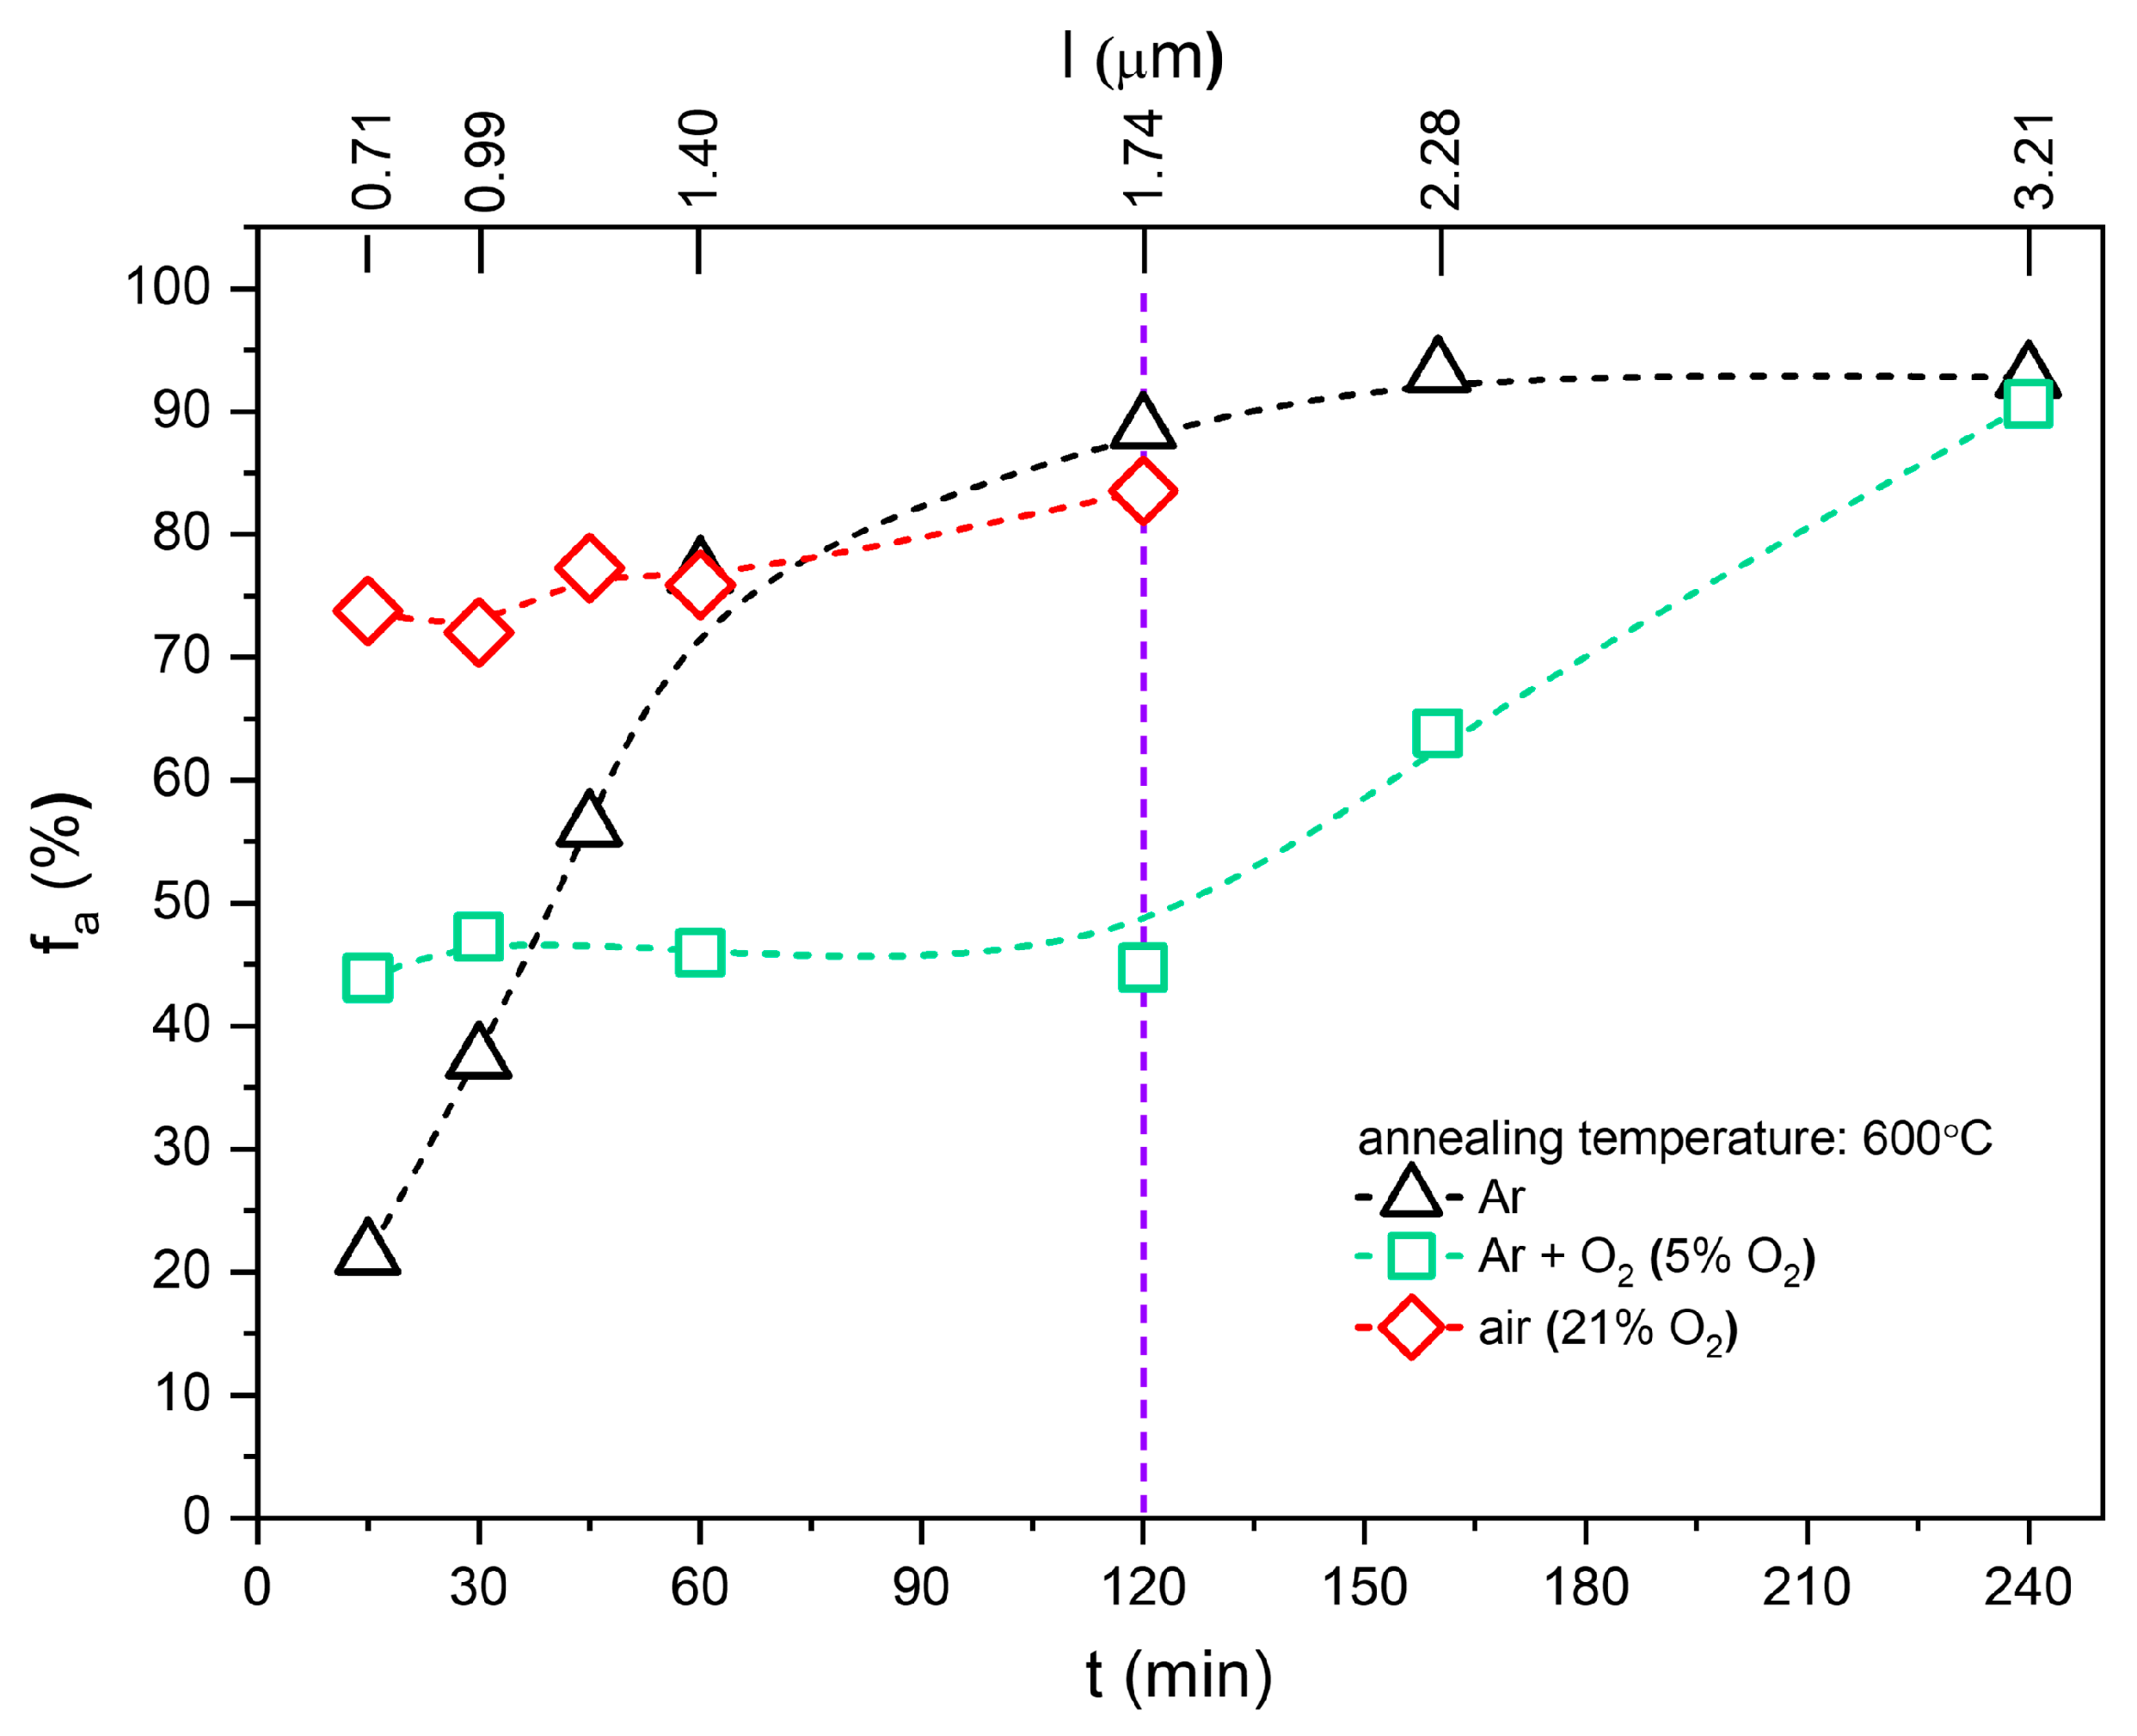
Huang et al. [40] investigated the presence of oxygen vacancies and their influence on crystallization and phase transformation. They found that annealing in an oxygen-deficient atmosphere shifts the anatase-to-rutile transformation to a lower temperature, and that a large density of significantly affects the crystallinity of the sample. Similar results were obtained in our studies. The impact of an oxygen-free atmosphere on anatase stability and rutile formation is presented in Figure 2. As can be seen, the annealing atmosphere is the key factor that determines the anatase-to-rutile phase transition.
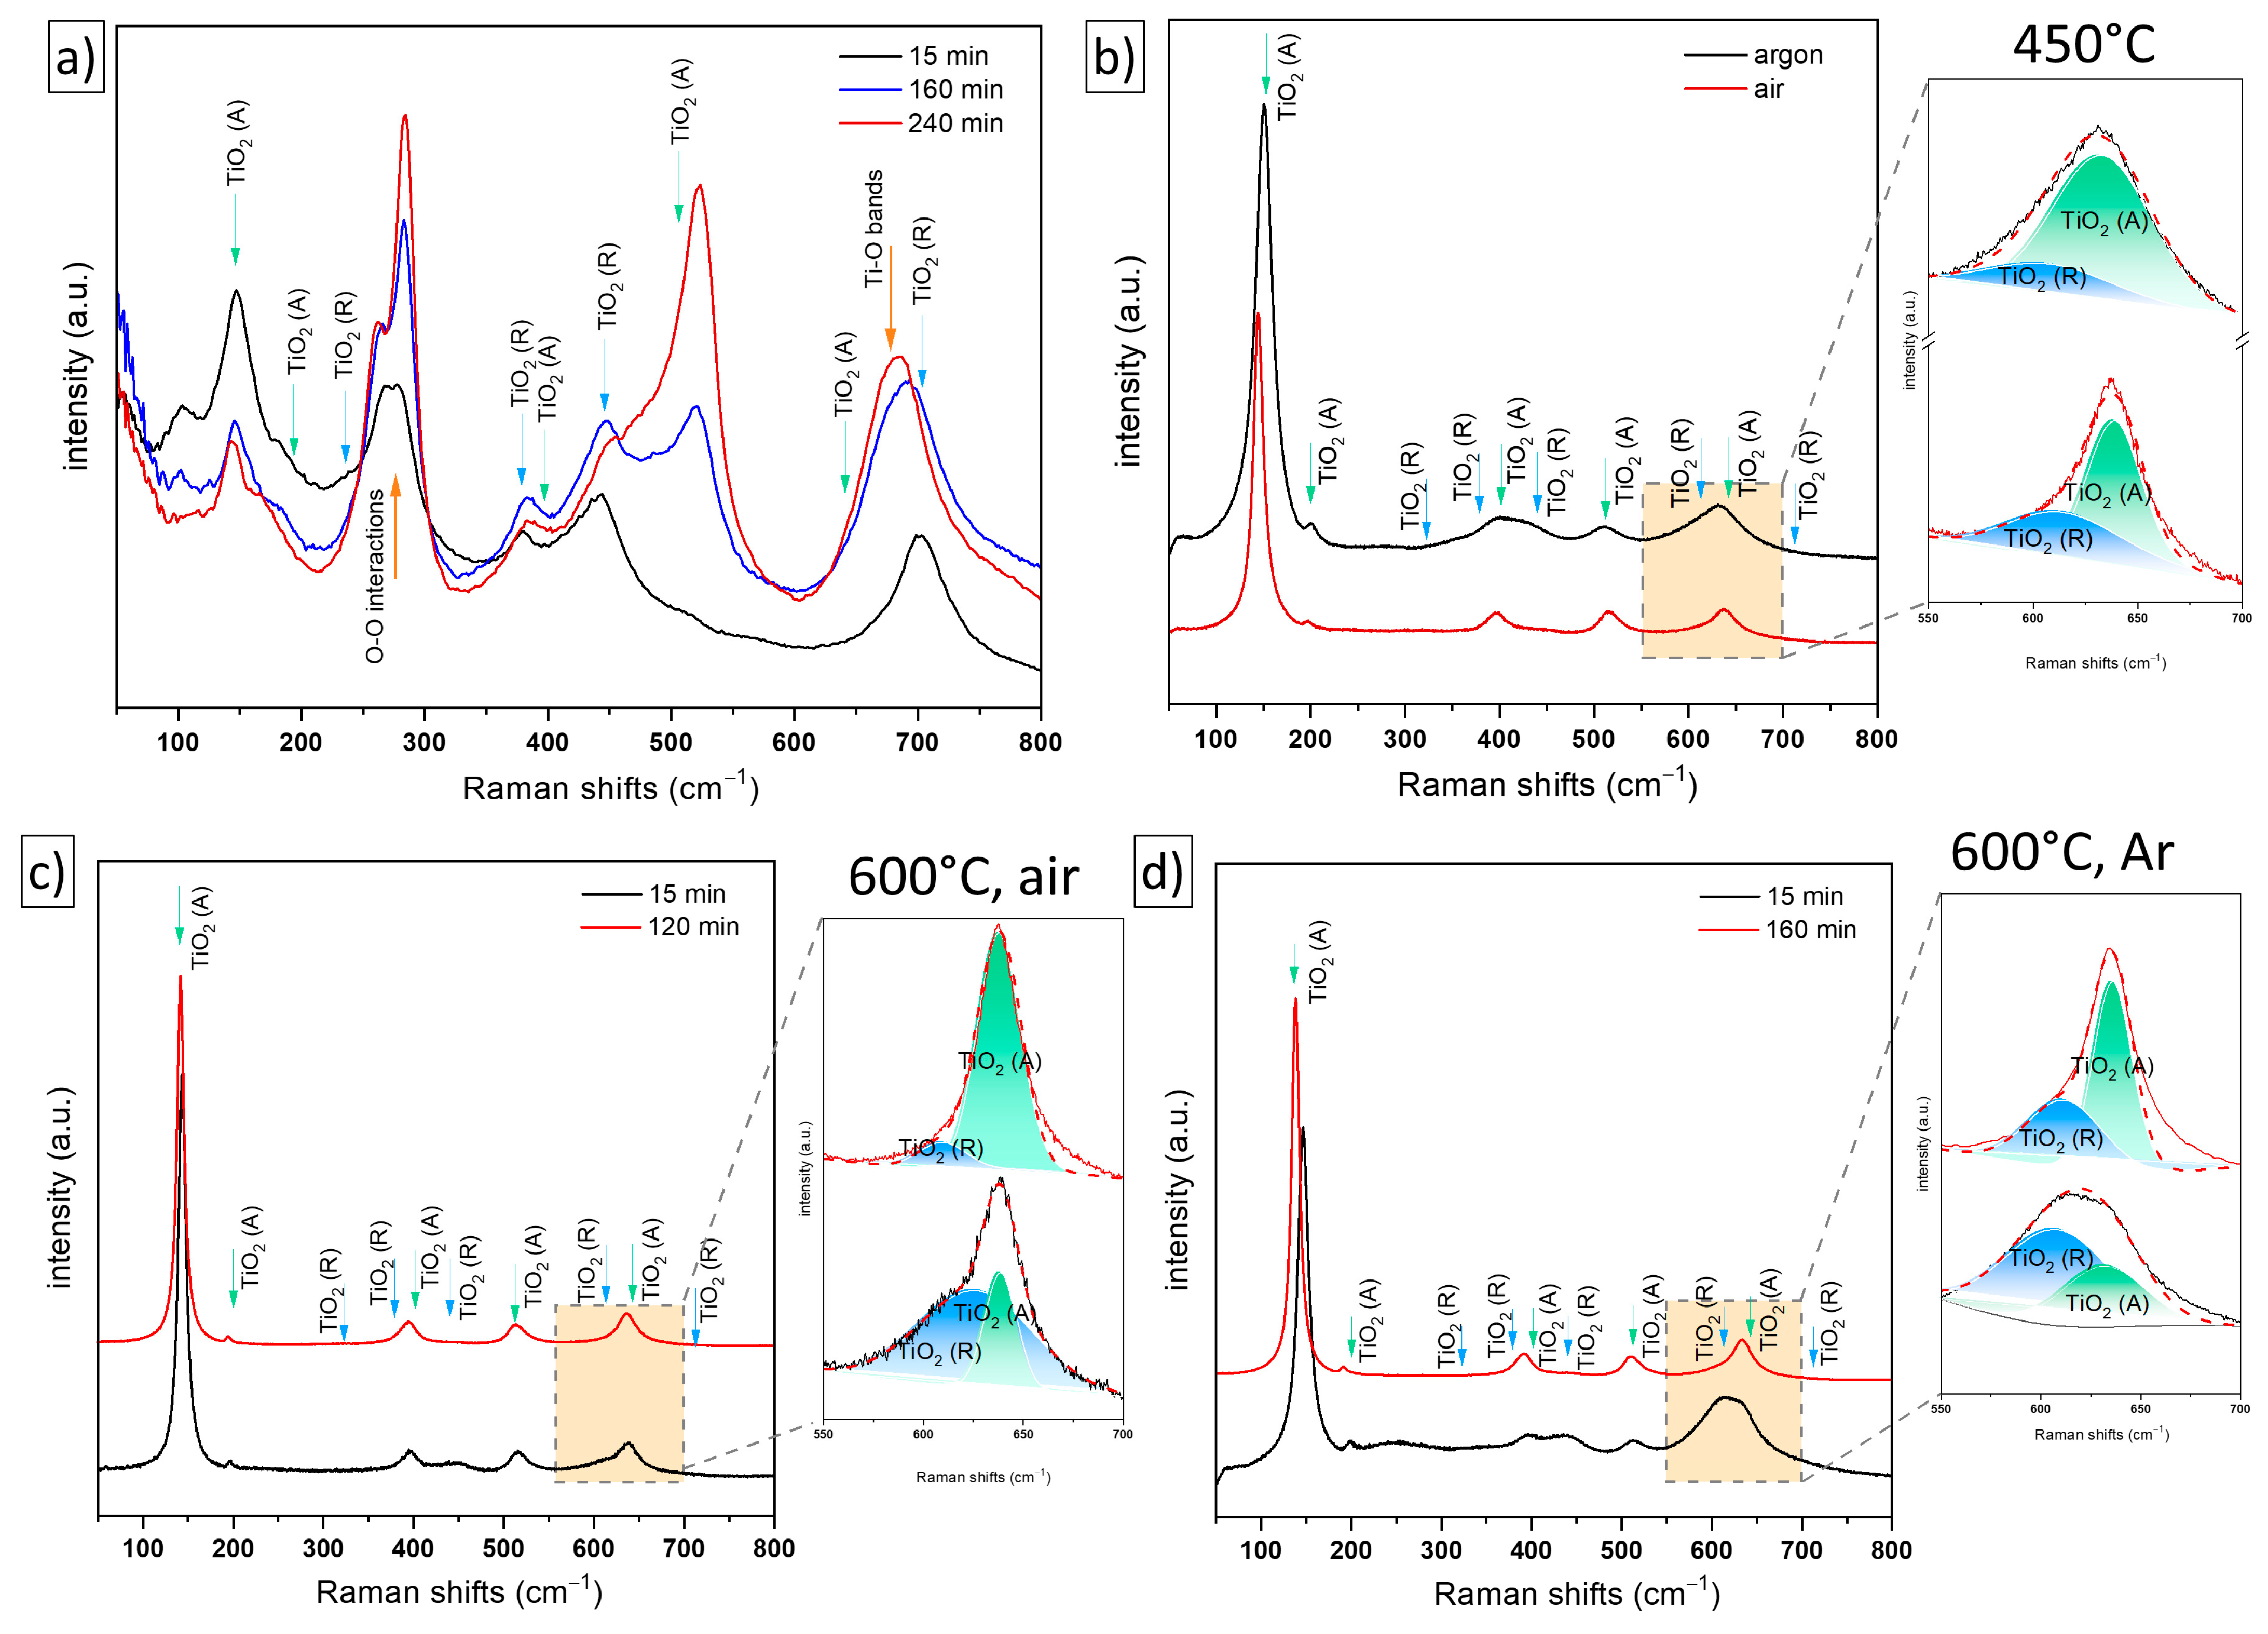
The anatase-to-rutile transition was also analyzed using Raman spectroscopy [39,41,42,43]. This method was found to be more sensitive to surface phase analysis than XRD. Figure 3a shows the Raman spectra observed for the samples after the reaction in 30% hydrogen peroxide at 80 °C. For all samples, a characteristic wide band is observed at 225–300 cm−1 (O-O interactions with TiO68− octahedral). Its intensity increased along with the duration of the oxidation process; this can be associated with the formation of a thicker oxide layer. Around 680 cm−1, a Ti-O vibrations band can be attributed to the presence of amorphous titanium dioxide. After 15 min of oxidation, a strong peak emerges at around 144 cm−1. It can be identified as the Eg mode of the anatase (Ti-O stretching vibrations). Other bands at 375 cm−1, 448 cm−1 and 707 cm−1 can be attributed to the thermodynamically stable rutile phase. An increased synthesis time affects the crystallinity and thickness of the formed nanostructured layer. In the first case, an ordered structure of titanium dioxide appears due to the dissolution of the formed Ti(OH)4 and its re-deposition [44,45,46].
The heating process of the nanostructures (Figure 3b–d) affects the degree of crystallization and initiates a phase transition. Regardless of the applied atmosphere, annealing at 450°C (Figure 3b) results in the formation of the anatase phase (144 cm−1 Eg, 197 cm−1 Eg, 398 cm−1 B1g, 513 cm−1 A1g, 519 cm−1 A1g, and 640 cm−1 Eg) as well as a small amount of rutile (375 cm−1, 448 cm−1, 610 cm−1). Nonetheless, annealing in an oxygen-poor atmosphere had the effect of crystallizing more rutile.
On the other hand, increasing the temperature to 600 °C highlights the differences in phase composition depending on the heating conditions (Figure 3c,d). The XRD data (Figure S1a) indicate that the weight fraction of anatase is approximately the same for all samples (Table 2). The only variable factor is the synthesis time and thus the thickness of the sample. Based on the Raman shift data obtained and the comparison of peak intensities at 610 cm−1 and 635 cm−1 for different reaction times, it can be assumed that the anatase-to-rutile transition begins at the metal/oxide interface (Figure 3c). After 15 min of chemical oxidation of titanium foil, both polymorphic forms of TiO2 can be distinguished; after 120 min of reaction, it seems that the sample is almost pure anatase. It is worth highlighting that the depth of the laser focus is about 1–2 µm, which only allows information to be gathered only from the surface in the case of thick samples. Therefore, after a long period of oxidation, only anatase-specific bands can be observed [39,41,42,43]. A similar effect can be observed for nanostructures annealed in argon (Figure 3d). For short reaction times, bands of well-crystallized rutile are present (446 cm−1 Eg, 610 cm−1 A1g). With a prolonged synthesis time, the aforementioned bands disappear.
According to Hardcastle et al. [39], the oxygen vacancies responsible for facilitating the cleavage of Ti-O bonds and the reduction in lattice volume are created by titanium reduced at the metal/oxide interface. This affects the formation of titanium dioxide in the rutile form. For thicker samples, more flower-like nanostructures are located outside this region, enabling anatase crystallization.
For thin nanostructured layers (0.71 µm, t = 15 min), the degree of contact between them is high due to significant porosity. As a result, faster nucleation of rutile is observed (Table 1, fA = 21.6%). An increase in the partial oxygen pressure shifts the equilibrium of reaction (1) toward the formation of OO; this causes a drop in the VO concentration and slows the phase transformation. For the sample obtained after the same time but after annealing in air, the content of the anatase phase is high and amounts to about 75%. The difference in the thickness of the TiO2 nanostructured layers can be attributed to a higher phase transformation temperature. Furthermore, a longer oxidation process limits the contact of Ti/TiO2, which causes the anatase-to-rutile transition to be slower.
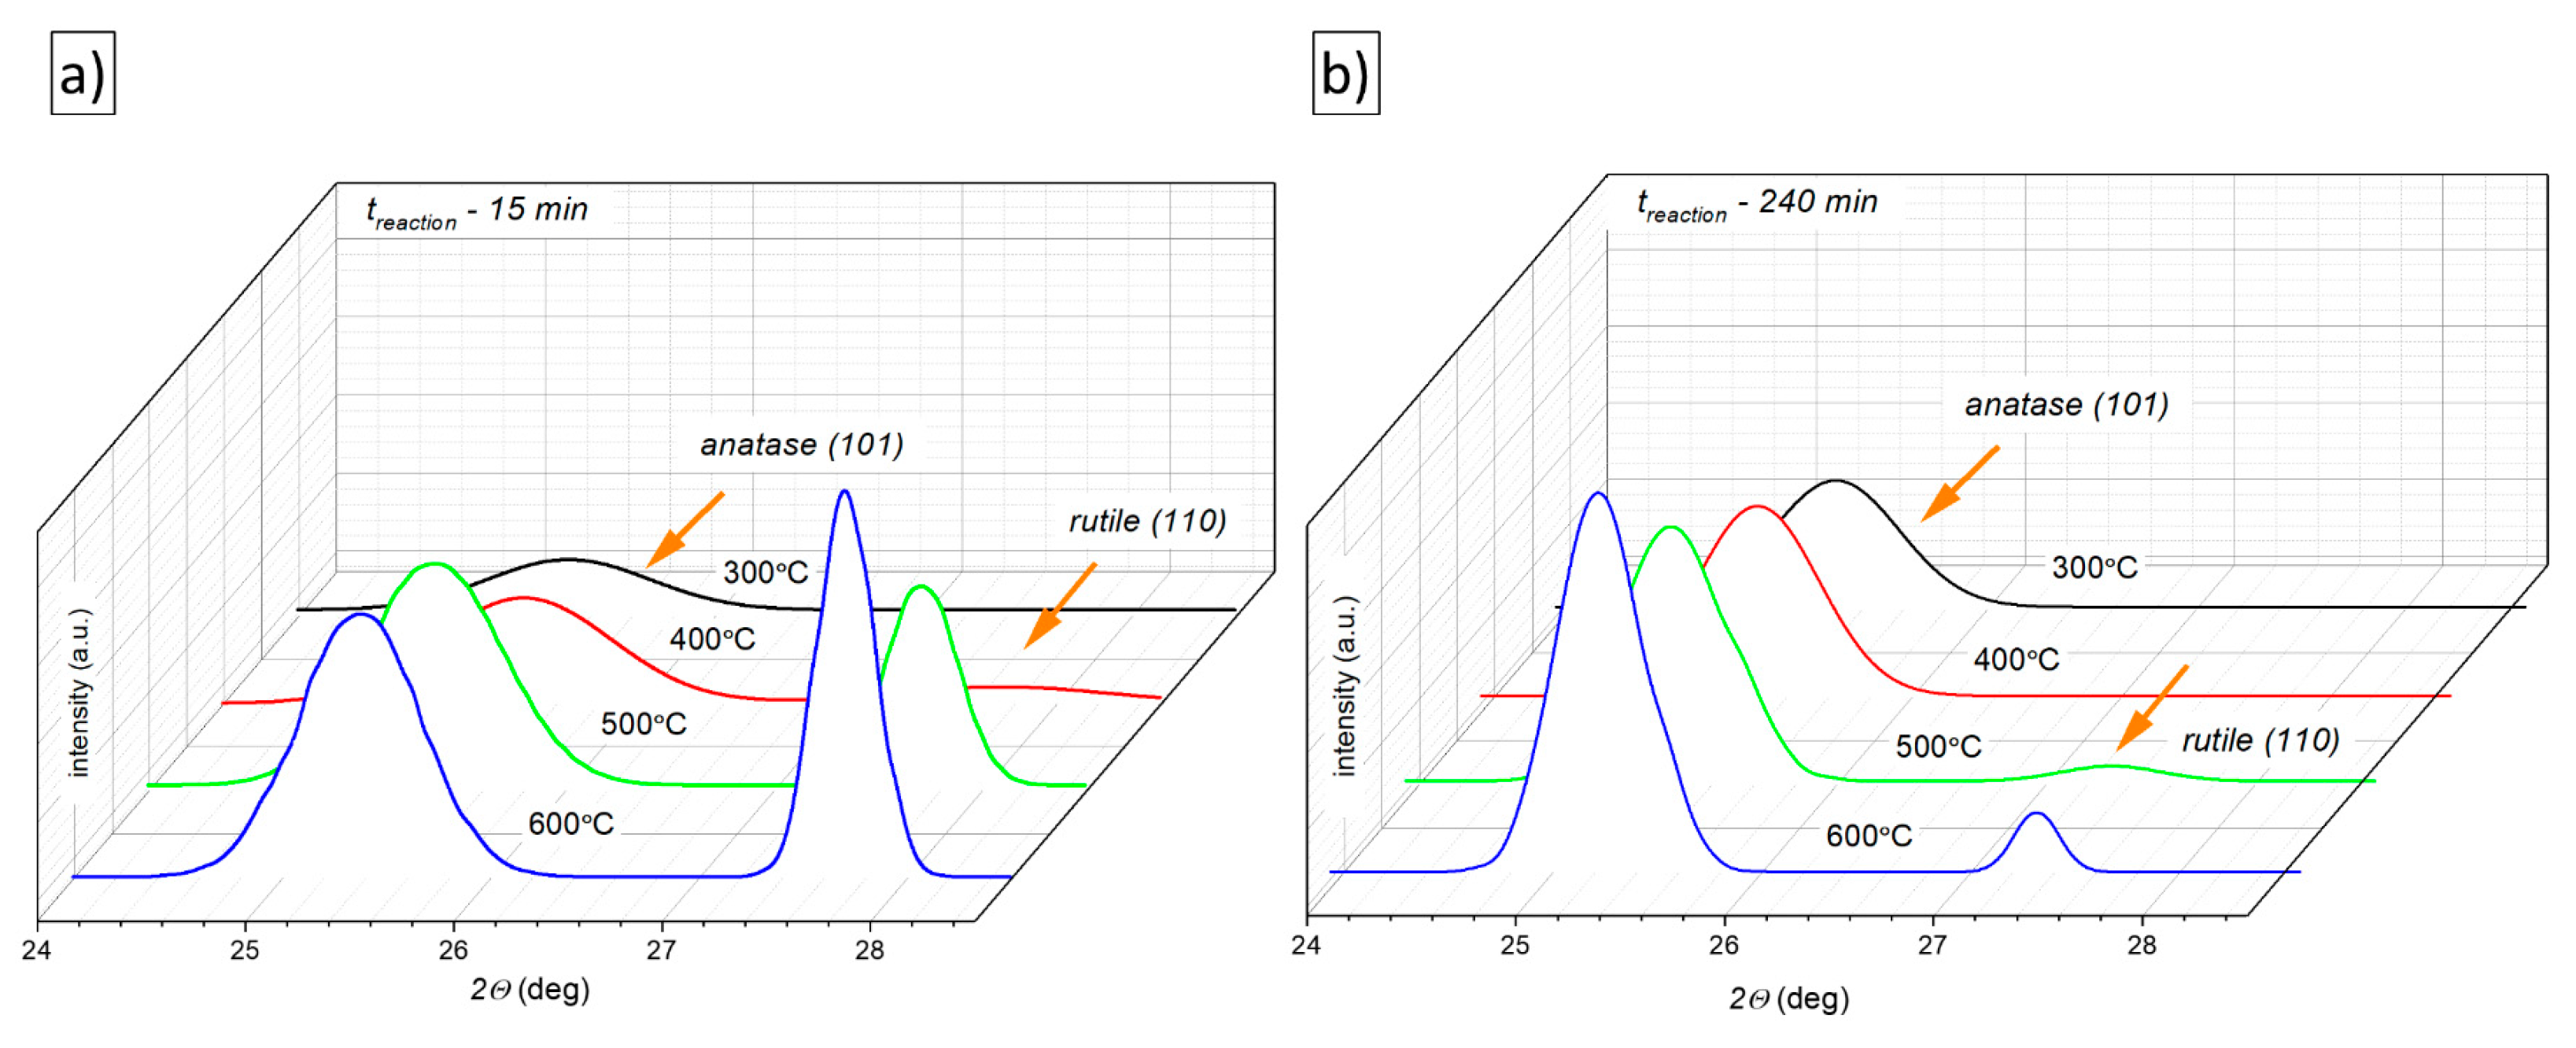
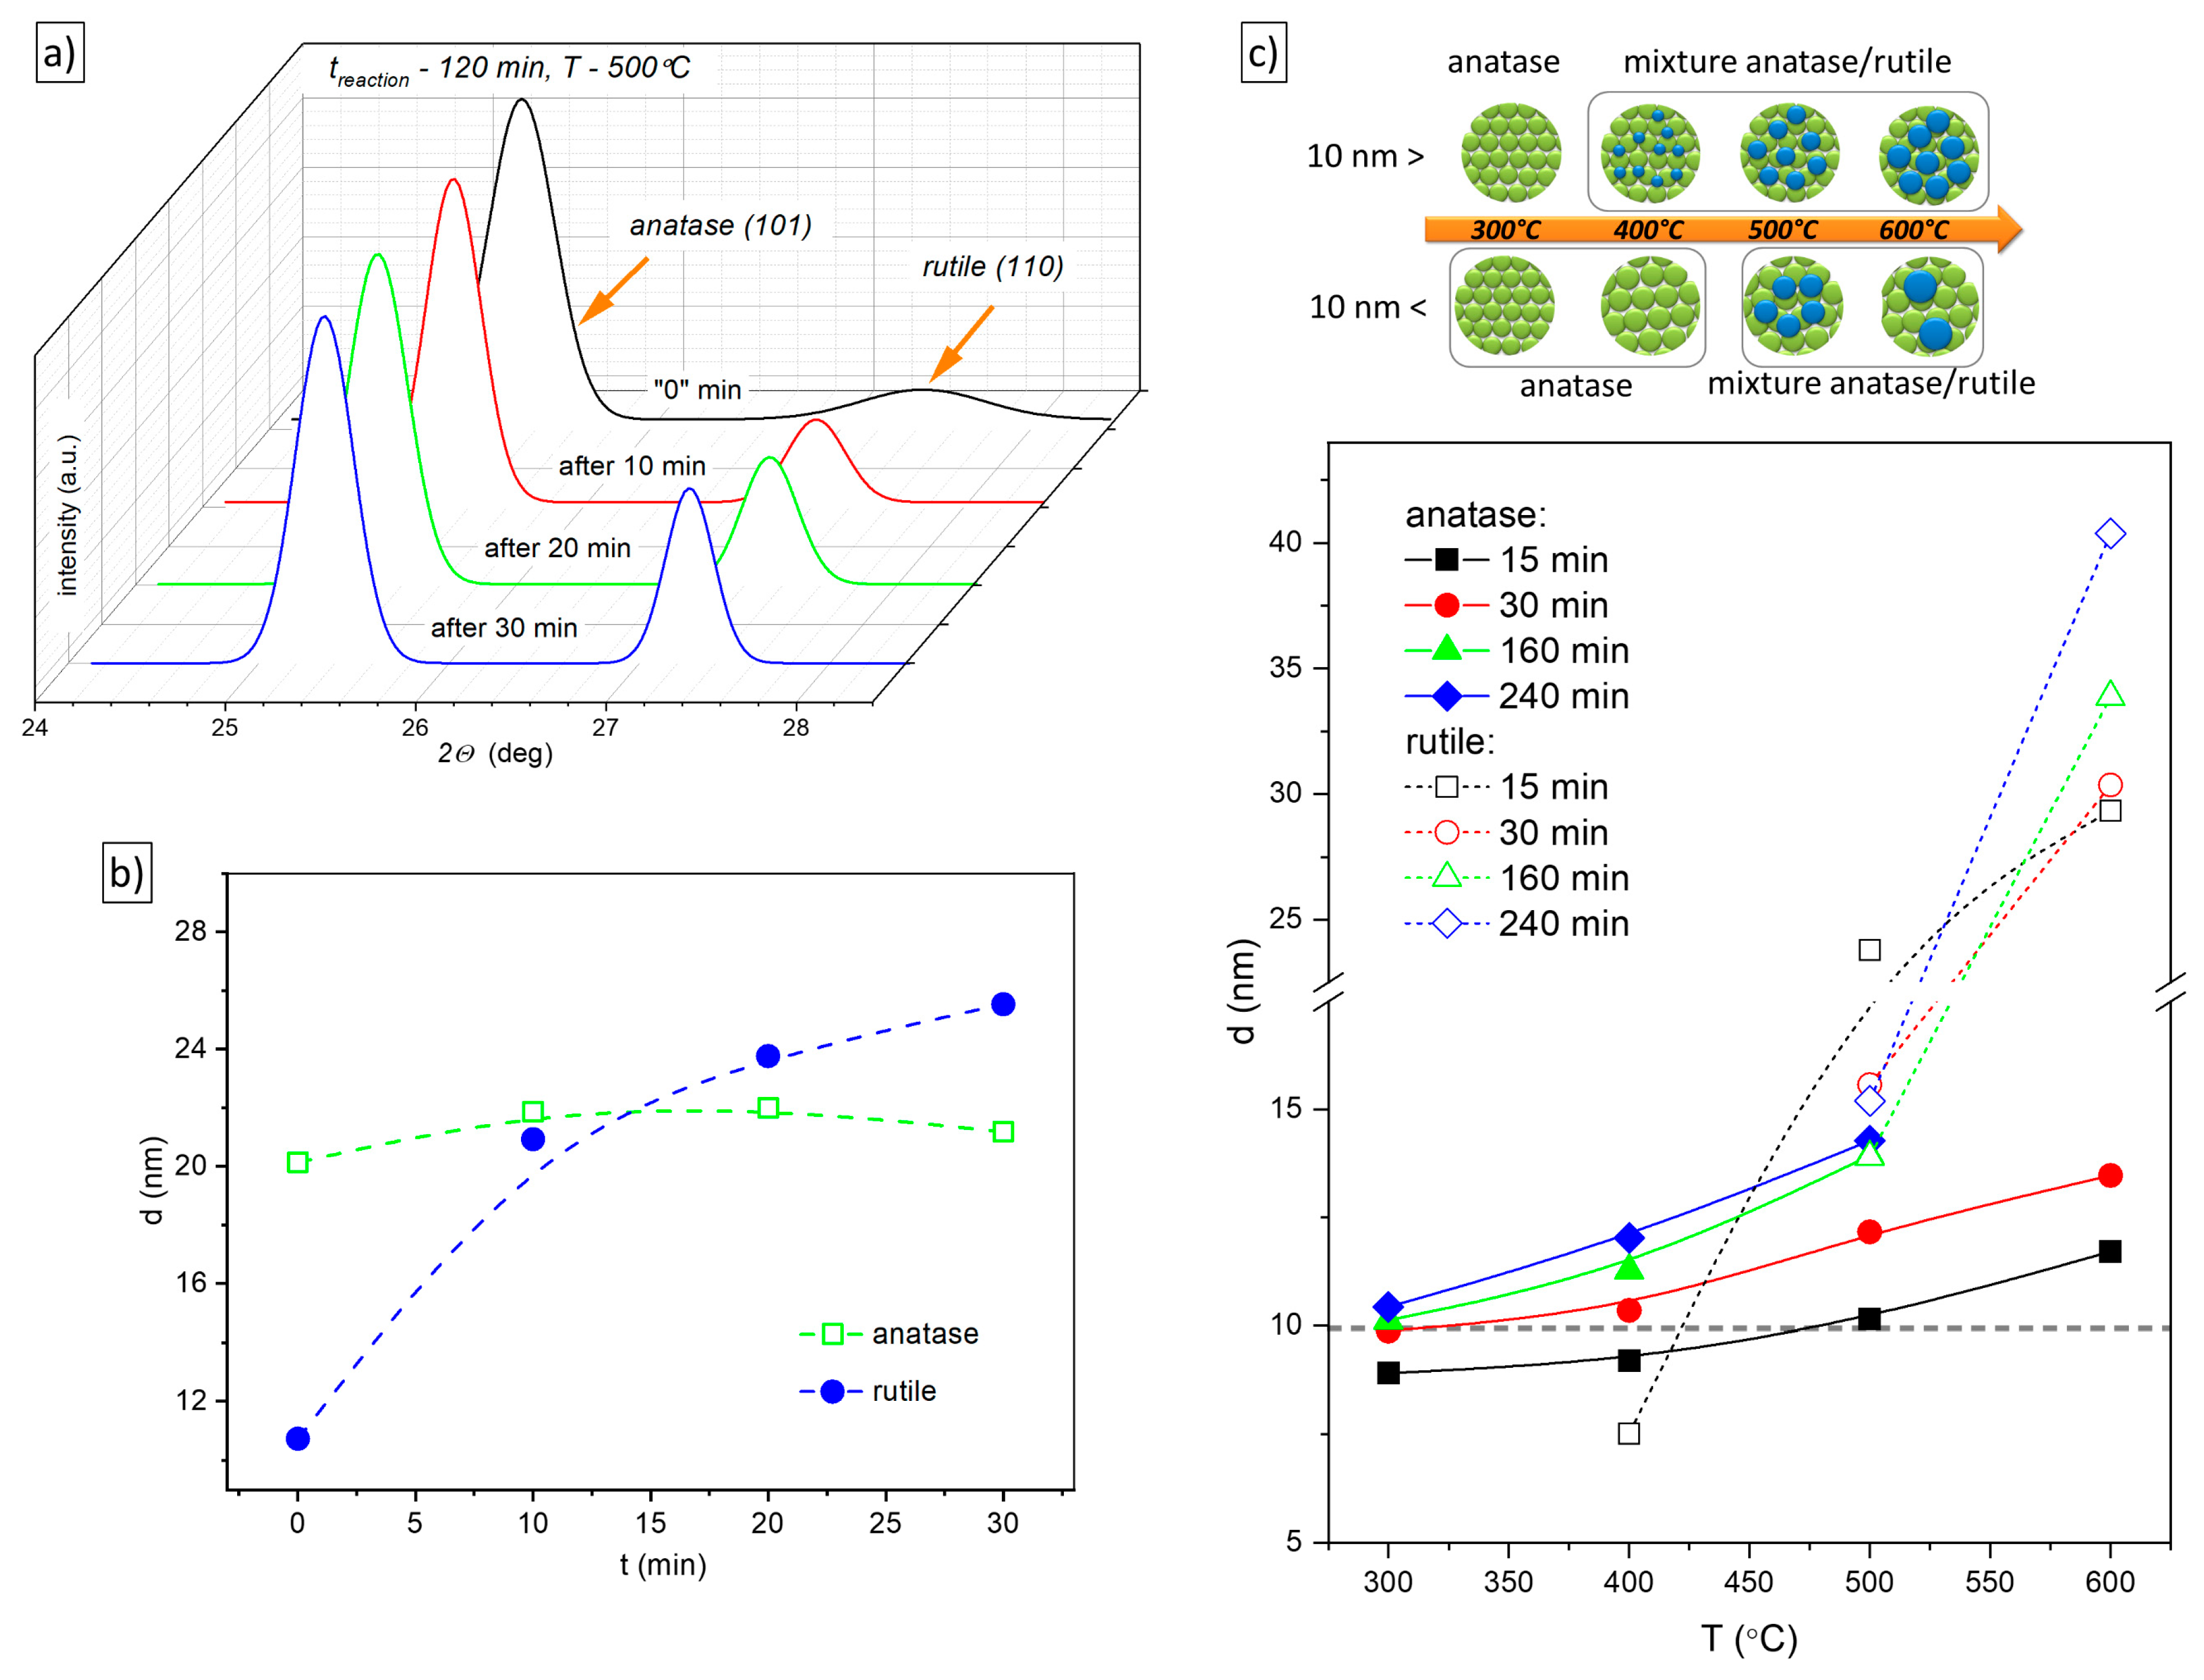
To examine real-time phase transformation of 3D flower-like nanostructures, in situ XRD measurements were performed over a temperature range from 300 to 600 °C and in the 2Θ range of 24–30° in an atmosphere containing an Ar + 5% O2 gas mixture (Figure 4).
After the reaction, no XRD patterns related/specific to TiO2 were observed. During heating (300 °C), nanocrystalline anatase forms (Figure 4a,b). Regardless of sample thickness, rutile nucleation starts at various temperatures. For thin samples with a thickness of approximately 0.7 to 1 micron, the more thermodynamically stable phase (anatase) is present at 400 °C (Figure 4a). In contrast, for thick samples (3.2 µm, Figure 4b), diffraction patterns related/specific to rutile are visible after annealing above 500 °C. All this can be attributed to the development of a grain boundary network. Smaller particles entail a higher degree of contact and a larger number of oxygen vacancy migration pathways; thus, they increase the probability of the formation of rutile nucleation sites. The results presented are similar to those obtained by Low et al. [47].
The rate of phase composition changes for a selected temperature of 500 °C for the sample obtained during 120 min of oxidation is presented in Figure 5a. After the temperature reaches 500 °C, a nanostructure in the anatase form with a small amount of rutile can be observed. Subsequent sequestration of the sample at a given temperature affects the growth of rutile grains. The increasing intensity of the rutile diffraction patterns and their gradual narrowing indicates changes in the number of crystallites and their size, from about 10 nm to 26 nm (Figure 5b).
For the reflex of anatase I(101), no significant changes are evident. This is likely related to the rate of phase growth. According to the report by Li et al. [12], rutile grows rapidly after nucleation, while anatase grains remain practically unchanged. Temperature controls heat and mass transport, which affects the growth of anatase particles (Figure 5c). When the size of the particles decreases, the degree of possible contact between them increases and it becomes easier to overcome the energy barrier (less activation energy) to undergo phase transformation [48,49].
Based on experimental data obtained using XRD for short reaction times, rutile phase formation occurs at the grain interface of anatase, where strain and disorders accumulate [50].
In phenomenological thermodynamics, the probability of a phase transition occurring is determined by the change in the selected thermodynamic function (Gibbs free energy ΔG, intrinsic energy ΔU, enthalpy ΔH, and free energy ΔF), which is determined by the relevant parameters (temperature, pressure, and number of moles). The contribution of the change in surface area is negligible. Such a procedure can be used for materials with a microcrystalline structure; however, it is unacceptable for nanomaterials. Additionally, the formation enthalpies G of formation ΔG of the polymorphic TiO2 varieties (brookite, anatase, and rutile) differ slightly under constant pressure and temperature conditions. This causes a change in surface energy on the anatase-to-rutile phase transition and can even reverse the direction of the transition.
From experimental work [11,12,13] and theoretical work [14,15], it appears that the sequence of transformations can be caused by small differences in surface energy. The change in enthalpy of the anatase-to-rutile transition process depends on the change in surface enthalpy γ and on the size of the specific surface area of the SSA:
For nanocrystalline titanium dioxide, ranges for the durability of individual phases as a function of the specific surface area of the materials were proposed according to calorimetric studies [13]. Brookite, as a metastable phase, can undergo an allotropic transformation to anatase (38 nm) or rutile (145 nm); this transformation is associated with a reduction in surface energy. The driving forces for the transformation of brookite-to-rutile are small; therefore, it is considered natural for large brucite grains to occur. This contrasts with anatase, where grain size is important.
The thermodynamic properties are closely related to grain size, and the more pronounced the differences between them are, the more the surface-to-volume ratio increases. Shape-related changes in surface energy are also expected. The more complex the form of the nanomaterial, the greater the value of the change in surface enthalpy; thus, it is smallest for 0D spherical nanoparticles, and it is largest for 3D systems [16].
It is worth emphasizing that the anatase-to-rutile transition shifts to a lower temperature when particle size decreases. Nevertheless, in our opinion, a particle diameter of about 10 nm seems to be critical; below this, a stable anatase phase becomes thermodynamically favored [8,11]. Chen et al. [51] analyzed the effect of calcination on the phase composition of titanium dioxide nanobelts [51]. They found that rutile nucleation is very likely due to the thermal fluctuation of atoms on the surface of anatase. Furthermore, for grains smaller than 11 nm, anatase is more thermodynamically stable, while rutile is stable when the particle size exceeds 35 nm. Once nucleation is initiated, the phase transition spreads through the particles. For samples obtained for longer reaction times, the nucleation of the second phase can be compared to the nucleation at the surface. First, anatase grain growth can be observed. During the reaction with hydrogen peroxide, the reconstruction of the structure takes place. These particles absorb more heat, enabling them to grow faster than the phase transformation expanse. After annealing at 300 °C, the crystallite size exceeds 10 nm. Rutile forms only after the thickness of anatase grains at a higher temperature (500 °C) exceeds that of nanostructured layers obtained after 15 min of reaction by more than 10–15 nm. Our results are highly consistent with those obtained by Zhang et al. [10,50]. The proposed transformation mechanism (in the bulk/surface region and in the outer/inner direction) is strongly affected by surface energy, potential barriers at particle contact, and the development of a network of grain boundaries. This may explain why anatase is favored during nanomaterials synthesis. On the other hand, nanostructures heated in air at 600 °C seem to be unaffected by the grain size effect. Nevertheless, this is in good agreement with the observations of Orendorz et al. [52], where, despite significant grain growth from 13 nm to 100 nm, the crystallites retained the anatase form.
2.2. Photoelectrochemical Application
Based on microstructural studies, flower-like nanostructures obtained after annealing at 600 °C in an Ar atmosphere were used to determine the effect of the formed multiphase heterojunction on activity in a photoelectrochemical (PEC) cell in which solar energy is converted to the chemical energy of hydrogen.
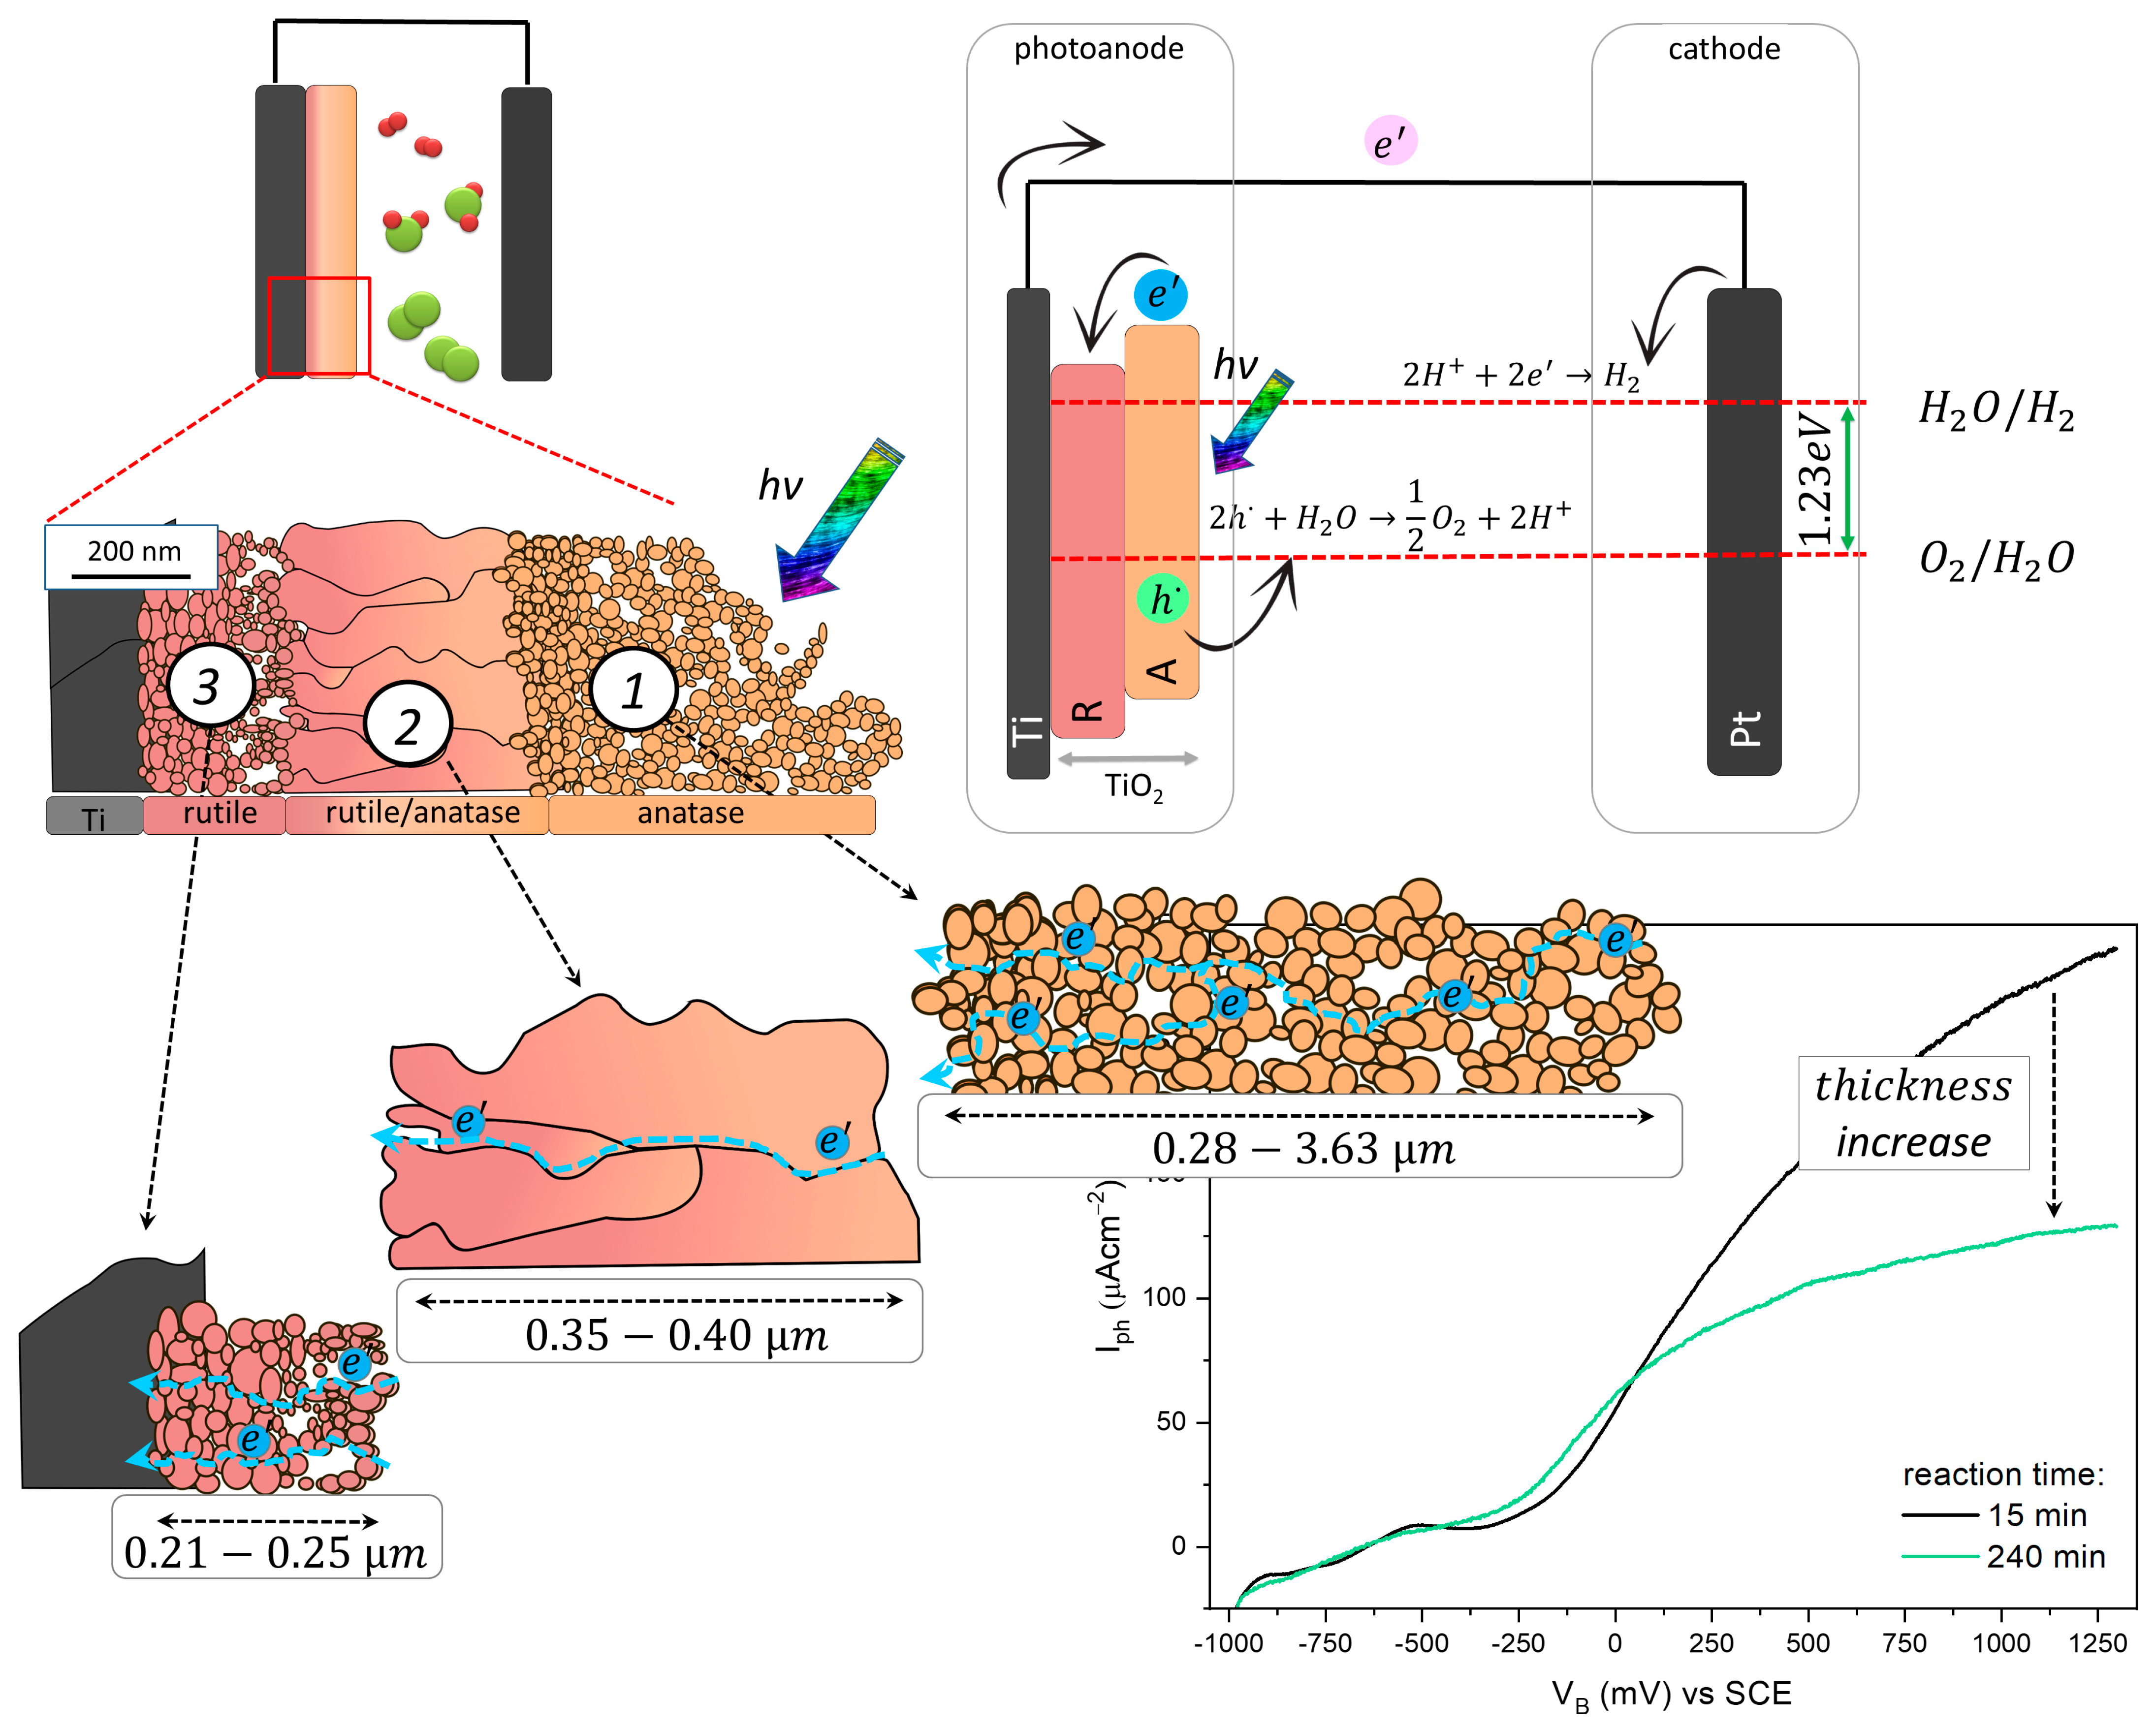
TEM cross-sectional images of TiO2 grown on Ti foils are shown in Figure 6. The flower-like TiO2 obtained for synthesis times of 240 min and annealing in an argon atmosphere at 600 °C demonstrates the presence of three types of layers with distinctly different microstructures. The layer formed on the Ti/oxide interface is composed of small spherical grains. The external porous layer is composed of small grains that form flakes/petals. In between these layers is an elongated crystal-like structure with intergranular boundaries perpendicular to the titanium substrate. However, it is only comparison of the results of structural properties (Figure 1, Figure 2 and Figure 3) using TEM that allows us to describe the photoelectrodes based on flower-like TiO2. The inner layer consists of 0-dimensional rutile grains (0D); this contrasts with the external layer, which consists of a three-dimensional anatase phase (3D). A mixture of anatase and rutile phases is observed for an intermediate layer.
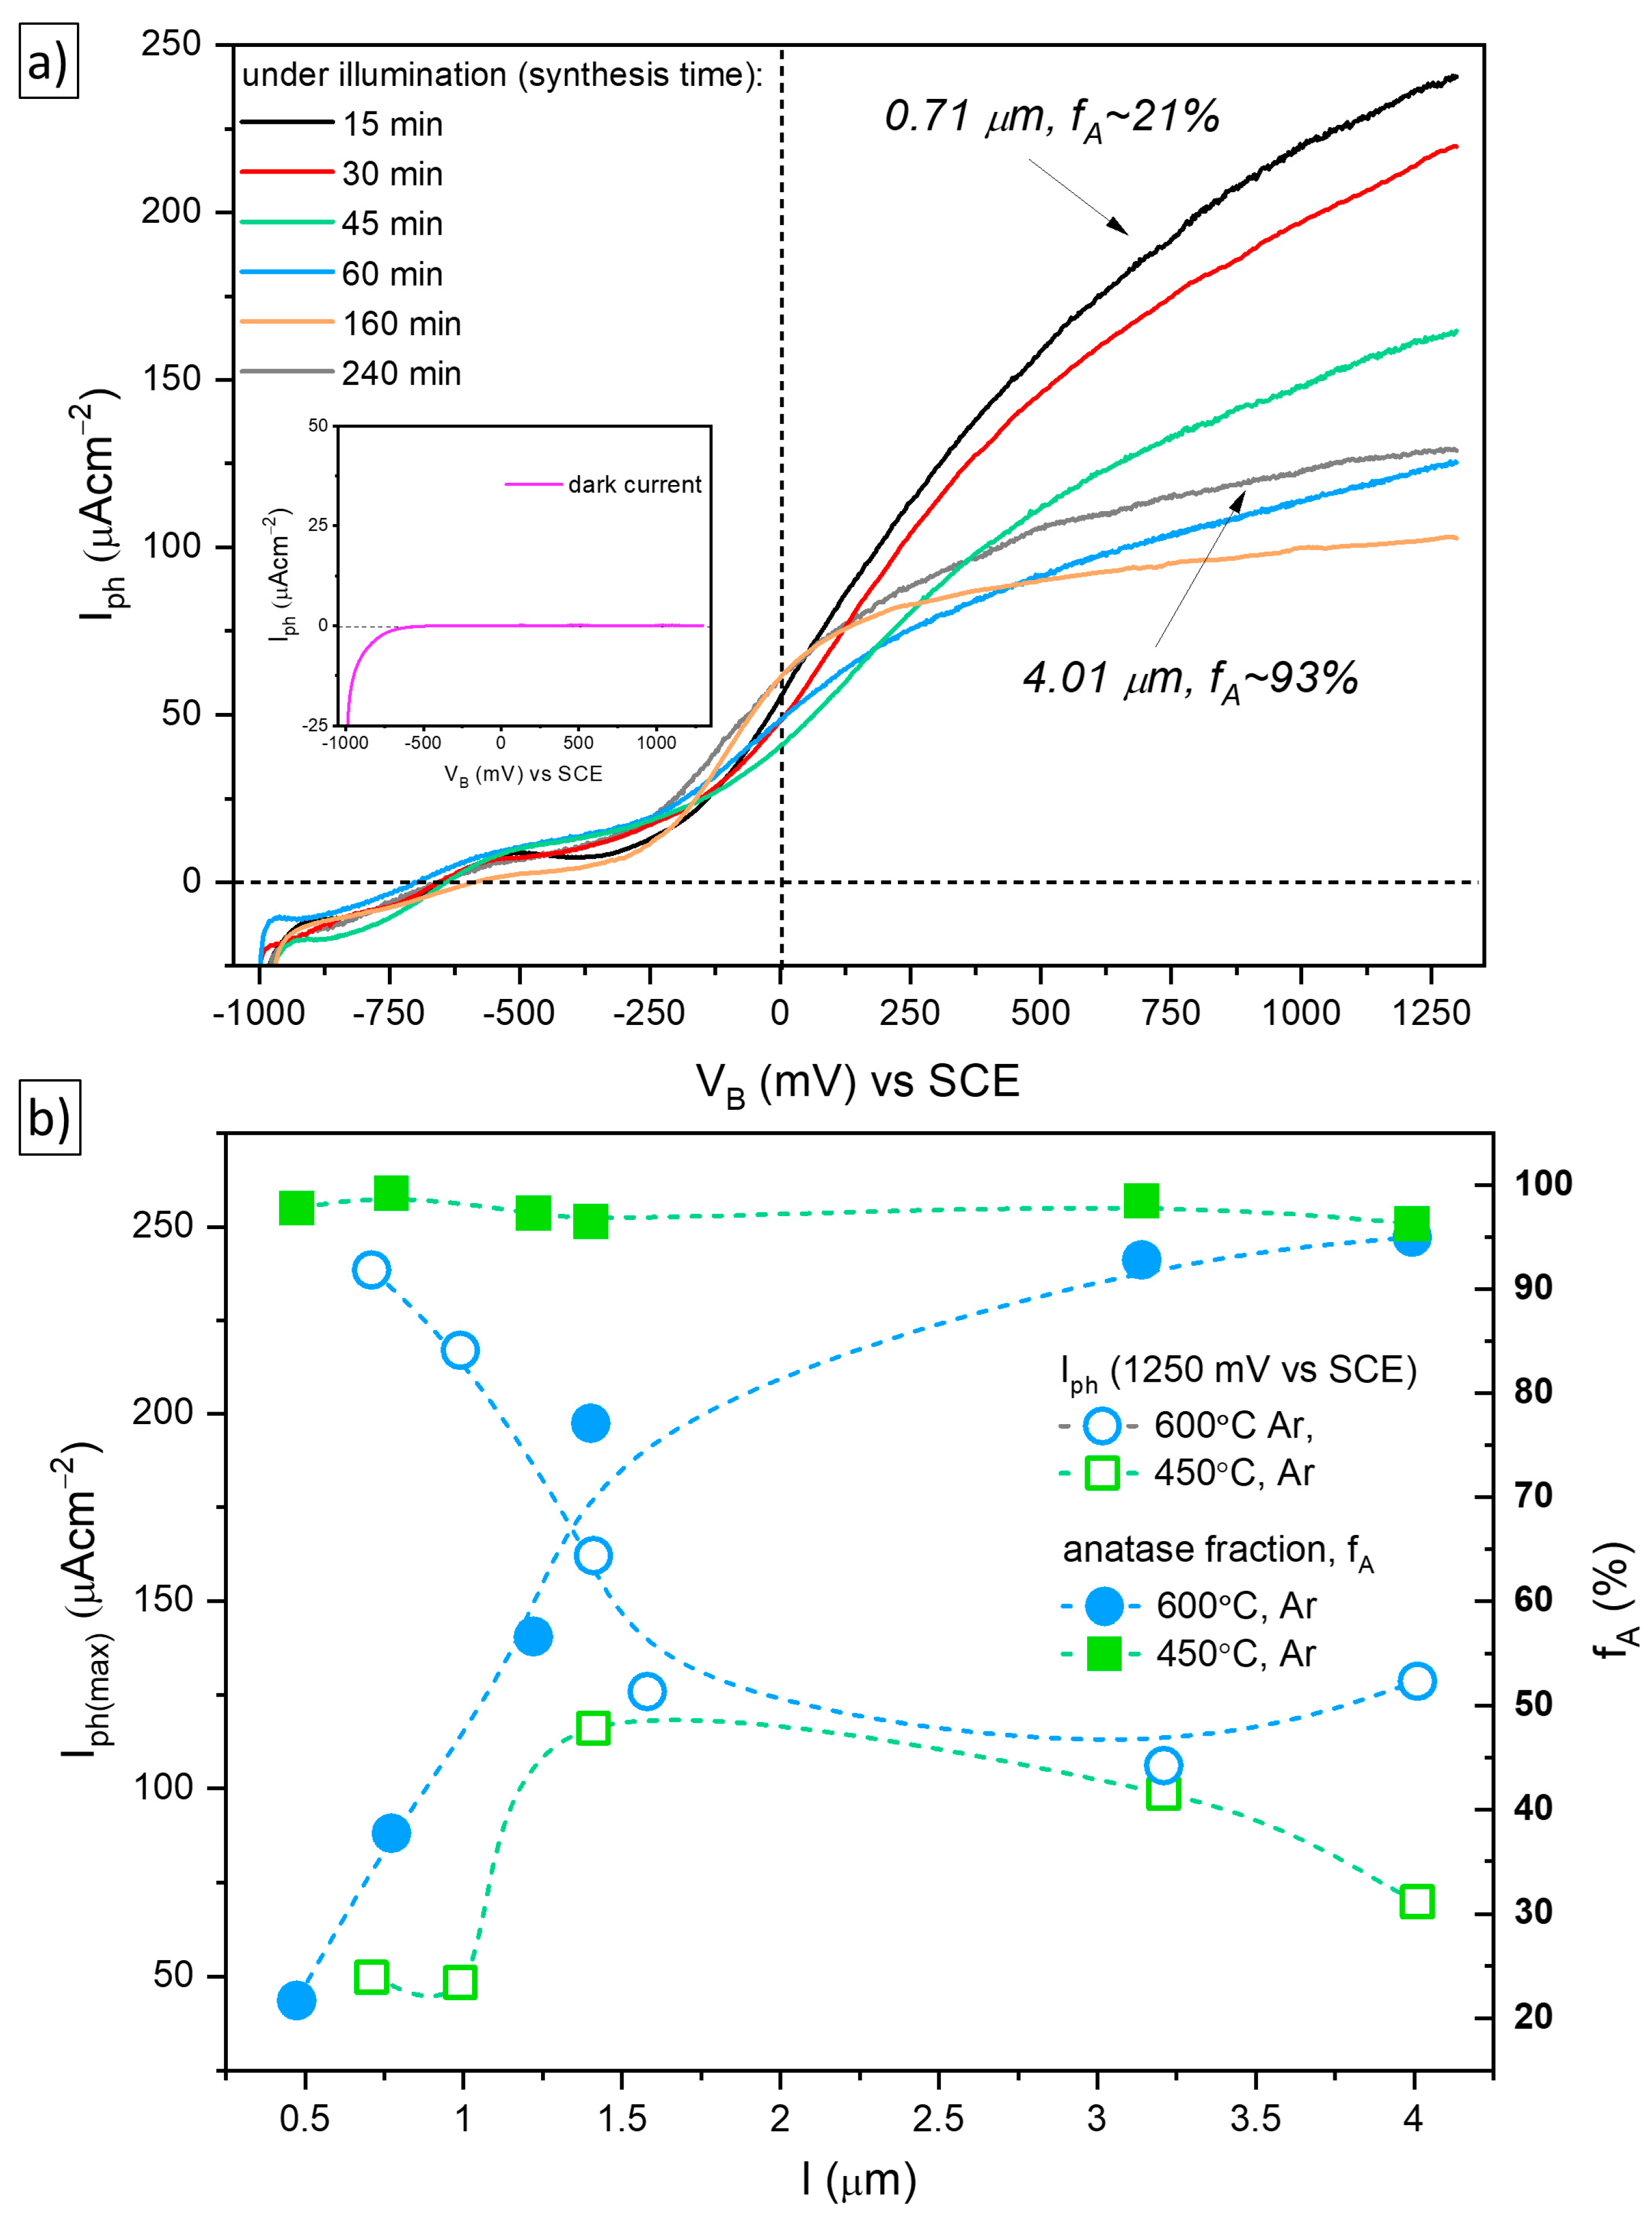
The photoelectrochemical properties of the TiO2 nanostructures were investigated based on current-voltage measurements in the dark and under illumination. Current densities (Iph) corresponding to white light are presented in Figure 7a as a function of VB versus SCE for nanostructures of TiO2 annealed in the Ar atmosphere at 600 °C. The characteristics of Iph-VB show a high value of the anodic current in contrast to the cathodic current; this confirms that electrodes based on flower-like TiO2 are classified as photoanodes [53]. The starting potential of the anodic current corresponds to the flat-band potential (Vfb) and is close to −640 mV. A negative value of Vfb is required to induce the photoelectrochemical process in the PEC without any electrical or chemical bias. For anodes synthesized for less than 160 min, high anodic photocurrent densities are achieved, but the plateau region is not observed. On the contrary, the anodic photocurrents recorded for titanium dioxide with the thickest sponge-like form (160, 240 min) are relatively low but reach a saturation level that is associated with fast electronic transfer through the photoanode-electrolyte interface. The dependence of photocurrent (at 1250 mV) on electrode thickness is illustrated in Figure 7b. The anatase fraction is also shown (right axis). As can be seen, both parameters are affected by anode thickness up to 1.5 μm, corresponding to a reaction time of 60 min. The photocurrents increased with decreasing photoanode thickness and reached the highest values for a thickness of about 0.75 µm and an anatase fraction of 21%. Photoanodes with the lower contribution of sponge-like TiO2 enable active interaction with the electrolyte, reducing the transport distance.
The thickness and phase composition of the anodes are important factors that have a strong influence on the photocurrent response. In our previous paper [35], the effect of the thickness of photoanodes based on 3D flower-like TiO2 was investigated. For TiO2 nanostructures annealed for 3 h in an argon atmosphere at 450 °C, the weight fraction of anatase was approximately the same for all samples (about 97–99%). Figure 7b presents changes in the photocurrent at 1250 mV for photoanodes prepared under these conditions. The photocurrent is shown to increase to a certain thickness of TiO2 (about 1.3 µm) and then decrease. Effects of the thickness of photoelectrodes in PEC and DSCC have been presented in various papers [54,55,56]. The authors had shown that when the thickness is above a critical value, microstructure plays a crucial role.
The H2 production rate can be calculated based on the photocurrent measured in the PEC [57,58] exposed to broadband solar irradiance; for example, air mass 1.5 under zero bias conditions. The H2 production rate r(H2) in mmol/(s·cm2) is expressed using the following equation:
where JSC is short circuit photocurrent density measured in the photoelectrochemical cell (mA/cm2), VB is electric bias (V), and ΔG is the Gibbs free energy (237 kJ mol−1).
Hydrogen evolution was calculated for PEC with photoelectrodes at VB = 0 V and illumined for 10 h. The amount of H2 obtained for photoelectrodes based on flower-like TiO2 and characterized by the highest values of photocurrent is close to 9–10 Δmmol/cm2.
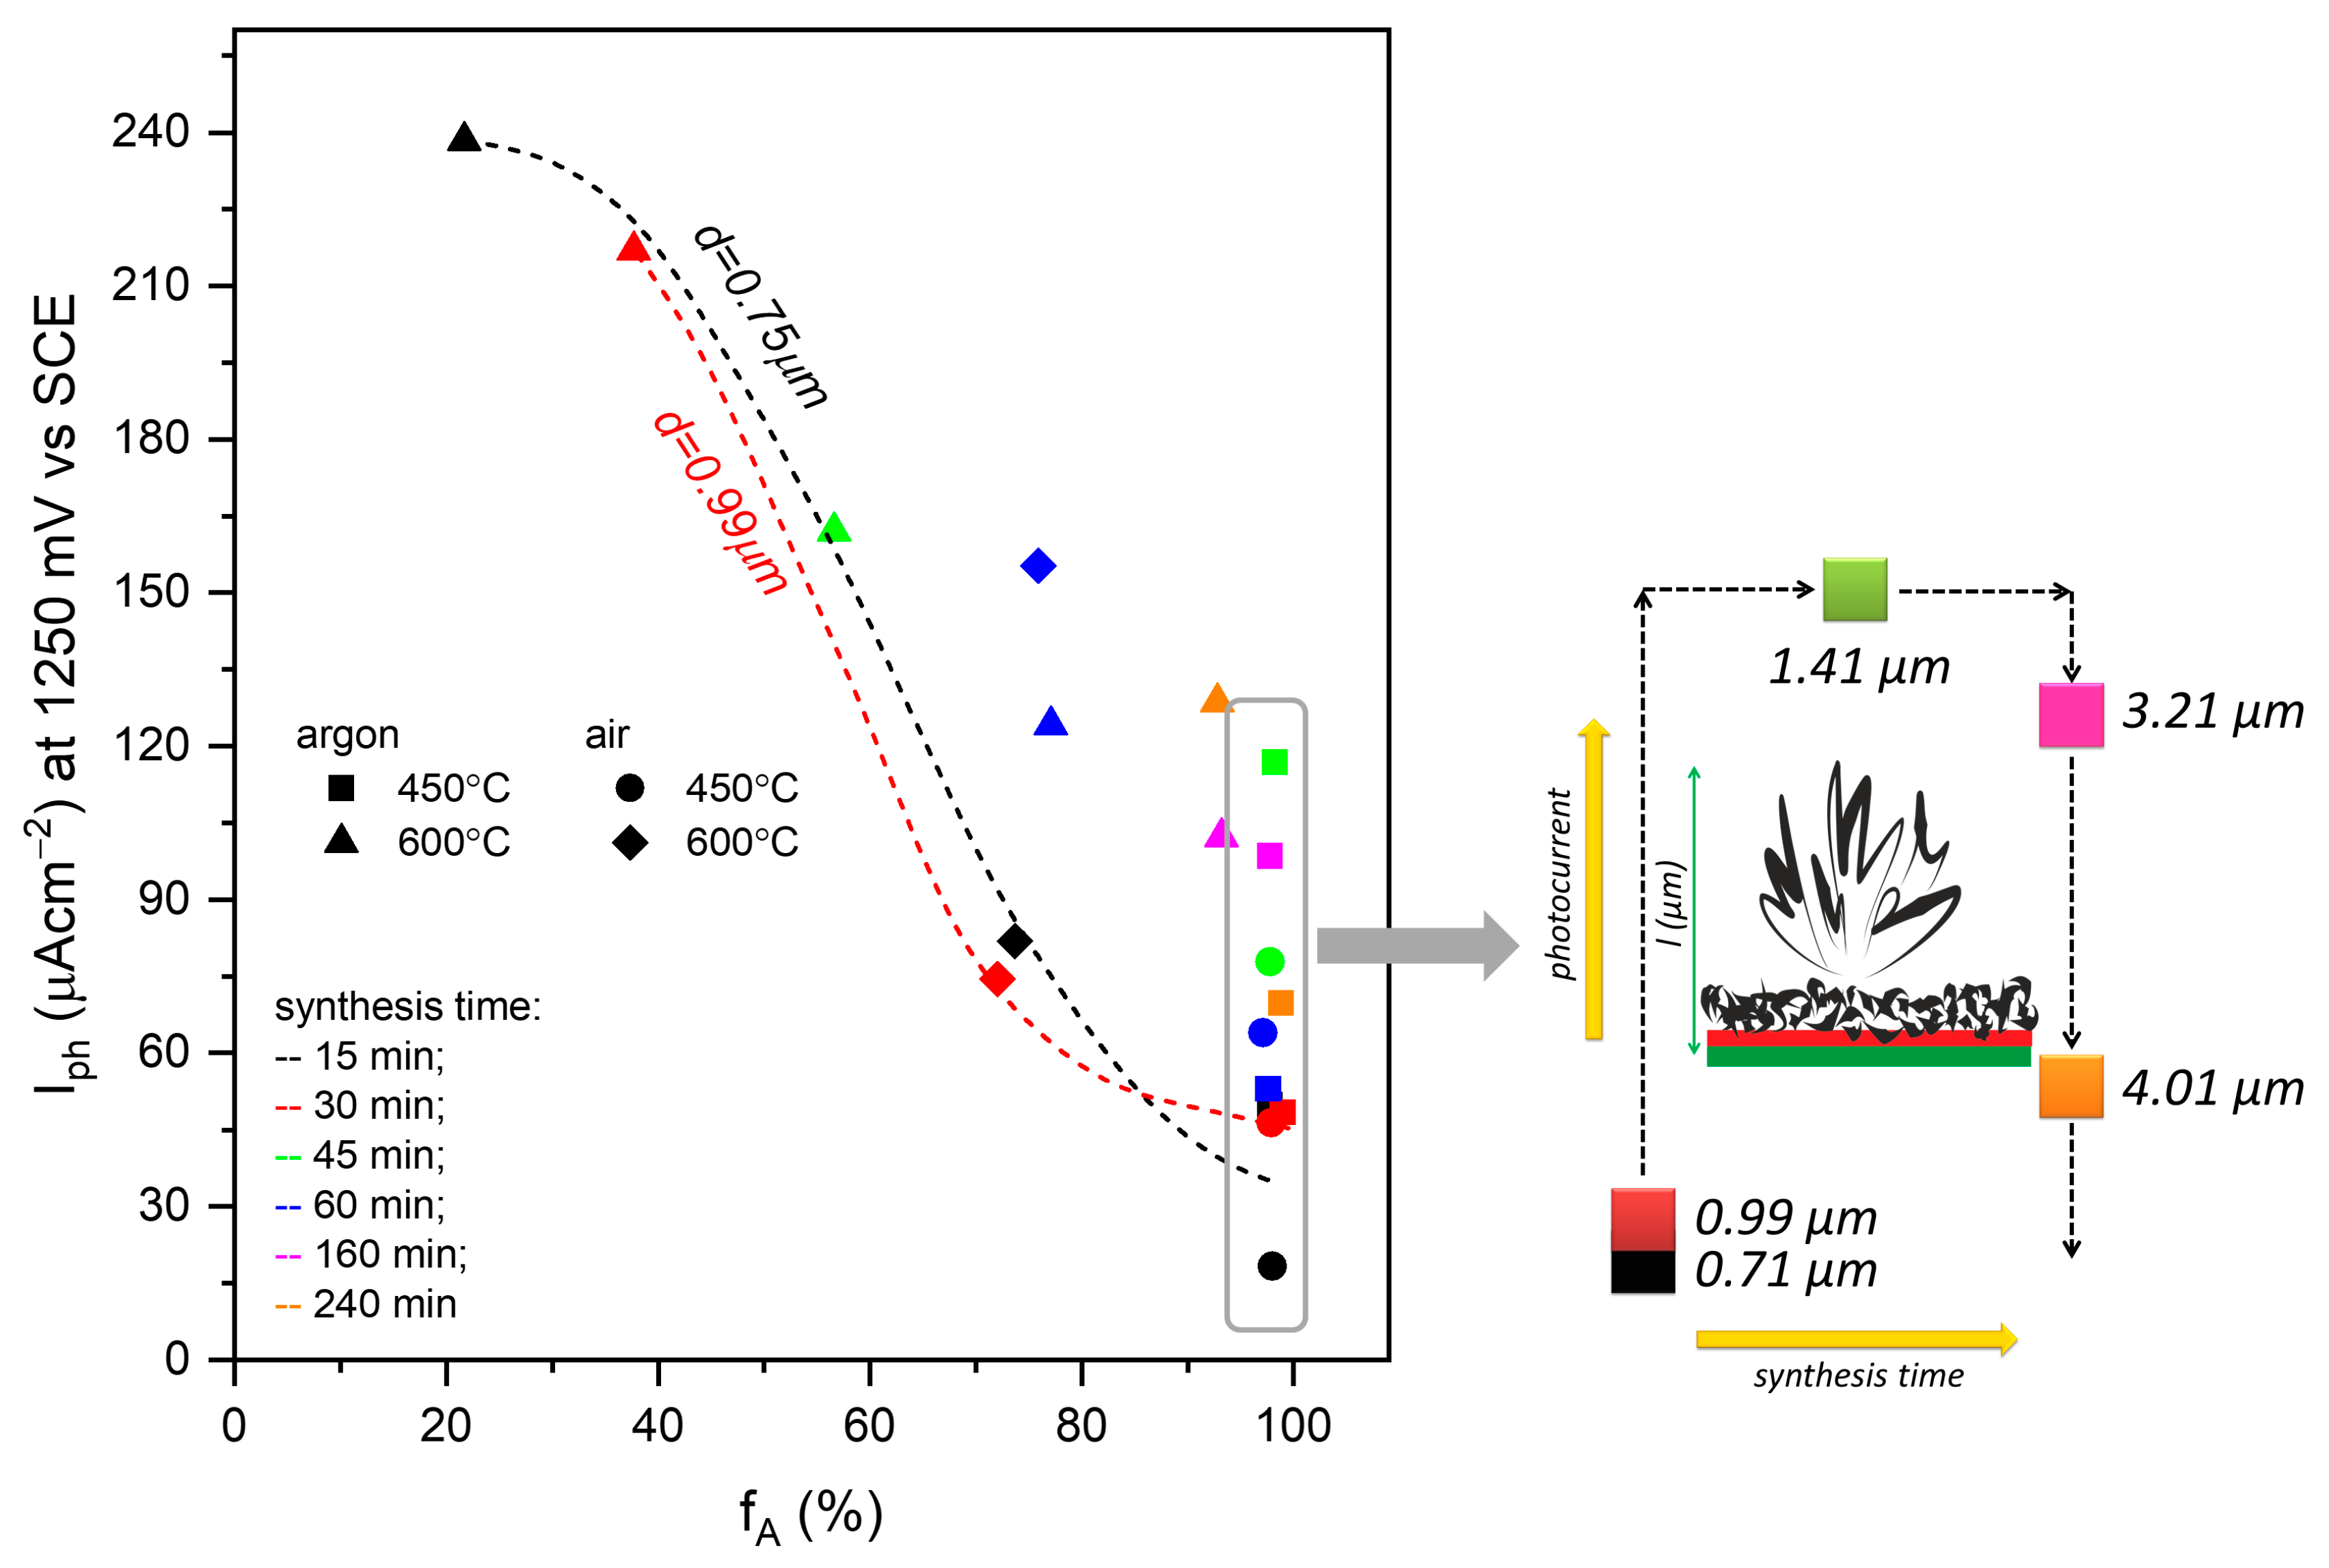
Figure 8 represents an overview of the photoelectrochemical results with modified photoanodes of flower-like TiO2 obtained during these studies. The values of the photocurrent at 1250 mV as a function of the anatase fraction for TiO2 photoanodes are illustrated. Different series of photoanodes, of different temperatures, different atmosphere annealing conditions, and different thicknesses are collected. The analysis of the results indicates that the most important parameter of the structure and microstructure of 3D flower-like TiO2 is the weight of the anatase fraction. The highest photocurrent values are observed for the TiO2 photoanode composed of 20–40% anatase and the associated thickness 0.75–1.0 µm.
The 3D flower-like TiO2 studied in this work is a very suitable example of the combination of microstructure modification with the existence of multiphase heterojunctions [59,60].
The results of studies reported in the literature show that the high photoelectrochemical or photocatalytic activity of titanium dioxide with different phases of the composition materials may be related to different mechanisms [5,36,61,62,63,64]. The first of these is described by the existence of synergistic effects between the TiO2, anatase, and rutile phases. One of the best-known illustrations is Evonik–Degussa TiO2 P25 (anatase to rutile ratio: 80/20), which is considered a reference material for photocatalytic reactions. Another approach is based on the different positions of the minimum of the conductivity bands of anatase and rutile in relation to the position of the hydrogen reduction level. In addition, it is also necessary to consider the differences in the values of the band gap. The proposed band alignment in multiphase anatase-rutile heterojunctions considers alternative possibilities. If the conduction band of anatase lies above the conduction band of rutile, then, because of illumination, electrons are transported to rutile. In the opposite case, the transport of photogenerated electrons goes to the anatase. In the case of the photodecomposition process of water in a PEC with an n-type photoanode, the position of the bands should allow the direct flow of electrons from the anode to the cathode via an external circuit. However, photoholes are involved in the oxygenation reaction of water at the anode surface.
The charge transport electrons for the photoanode is also shown in Figure 9. The flower-like architectures are constructed by different dimensionalities: 0D nanoparticles, 1D crystallite-like form, and 3D flower-like structures (see Figure 6). The light absorption occurs in the outer 3D layer of the photoelectrode composed of anatase nanoparticles. Subsequently, charge transport proceeds along the longitudinal direction in the 1D single-crystalline. The alignment of the band energy between rutile and anatase promotes further electron transfer. The porous outer 3D layer is characterized by a large specific surface area. However, the too-large thickness of the outer layer (from 0.28 up to 3.63 μm) limits the number of electrons that are transferred through the crystallite-like form. It is associated with slow diffusion through multiple trapping and detrapping in the boundaries of nanoparticles.
The band energy diagram for a semiconductor photoanode in the case of multiphase TiO2 heterostructures discussed in this work and the processes that take place in the photoelectrochemical (PEC) cell are presented in Figure 9. The conduction band minimum of anatase is above the conduction band minimum of rutile. Electrons and holes formed by absorption of a quantum of light in anatase are separated in space by moving in opposite directions. This kind of configuration is suitable for hydrogen production in PEC because electrons from the conduction band of anatase are efficiently transferred to the conduction band of rutile and the next via an external circuit to the cathode. The hydrogen is generated at the cathode in the reduction process and holes oxidize water at the anode surface. S. Lee et al. [64] studied the alignment of the band between anatase and rutile of photoelectrodes based on TiO2 nanotubes on the FTO substrate, where TiO2 nanoparticles were used as a glue layer. According to the authors, for both cases, it is possible to obtain a type II band alignment that allows water oxidation in the cell in which photogenerated electrons will flow from rutile to anatase or vice versa, improving electron-hole separation. This means that heterophase design offers significant opportunities to improve the performance of photoelectrodes with complex phase structure and microstructure.
3. Materials and Methods
3.1. Materials Preparation
Flower-like TiO2 nanostructures were obtained via a rapid chemical oxidation process at 80 °C. Briefly, titanium foils (Sigma Aldrich, St. Louis, MO, USA) were cleaned in acetone and ethanol, then etched in 35% hydrochloric acid (Avantor Performance Materials Poland S.A., Poland) for 2 min, washed in distilled water, and dried in an inert atmosphere (argon) at 100 °C for 30 min.
The pretreatment of titanium foils is crucial with regard to the synthesis of the flower-like structure. Etching aimed to remove the oxide layer formed naturally on the titanium foils. However, the exothermic reaction affects the locations of the titanium oxide crystallization sites [65].
Afterward, the samples were oxidized in 30% hydrogen peroxide (H2O2, Avantor Performance Materials Poland S.A., Gliwice, Poland) at 80 °C for various times (15–240 min). To improve crystallization, the obtained nanostructures were annealed at 450 °C and 600 °C in argon and air, respectively.
3.2. Characterization Techniques
The phase composition was analyzed by means of the (a) standard x-ray diffraction patterns (XRD, X’Pert MPD diffractometer), and (b) in situ measurement over the temperature range of 300 to 600 °C and in the 2θ range of 24 to 30°, with a step of 3 °C/min (HRD-HT, X’Pert MPD). The atmosphere was Ar + 5% O2.
The average crystallite size was determined using the Scherrer equation [66]. The weight of the anatase fraction (fA) was calculated as follows:
where IA and IR correspond to the intensity patterns of anatase (101) and rutile (110), respectively [67].
The morphology of the obtained nanostructured layers was examined using scanning electron microscopy (SEM, Nova NanoSEM 200 by FEI). TEM observations were carried out using an FEI Tecnai TF20 X-TWIN (FEG) microscope. The focused ion beam (FIB) technique (FEI Quanta 200 3D Dual Beam, FIB/SEM system) was used for thin film preparation.
The Raman spectra of TiO2 nanoflowers were recorded in the spectral range from 50 to 1000 cm−1 by means of WITec Alpha 300M and a spectrometer (λ = 488 nm).
The optical properties of samples were analyzed based on the spectral dependence of the total reflectance (Rtot) measured with a UV-ViS-NIR Jasco V-670 equipped with a 150 mm integrating sphere.
3.3. Photoelectrochemical Measurements
Photoelectrochemical measurements in the dark and under illumination were performed in a custom-made photoelectrochemical cell. Current-voltage (Iph-VB) characteristics were recorded in a three-electrode cell, with the TiO2-based sample as a working anode, a saturated calomel electrode (SCE) as a reference electrode, and Pt/Pt black foil as the cathode. Electrodes were immersed in 0.8M Na2SO4 solution (Avantor Performance Materials Poland S.A., Gliwice, Poland). A 450 W Osram Xe lamp (light intensity: 134 mW/cm2) with a Jobin Yvon TRIAX 180 (Horiba Scientific, Kioto, Japan) monochromator was used for the illumination of the photoanode. The parameters were recorded with an MTM ANKO (Kraków, Poland) potentiostat.
4. Conclusions
In the presented work, titanium dioxide nanoforms were obtained by combing two methods: chemical oxidation by means of H2O2 and thermal oxidation. Due to the nature of these two processes, the morphology of the obtained TiO2 nanostructures is very complex. The sponge-like form is produced via a reaction involving Ti foil and H2O2 at mild temperatures. The morphology of flower-like TiO2 is determined by reaction time, while temperature and annealing atmosphere affect phase composition. The anatase-to-rutile transition in the nanoscale is dependent not only on annealing conditions but also on the initial crystallite (grain) size and sample thickness. The critical size was determined to be 10 nm; below this value, anatase is the predominant form of titanium dioxide. The phase composition and microstructure of the photoanode material significantly affect the performance of the photoelectrochemical cell. The multiphase heterojunctions proposed for 3D flower-like TiO2 photoanodes in PEC suppose that the conduction band of anatase should be above rutile. In order to yield high photocurrents and an H2 production rate, the optimal weight of the anatase fraction (fA) of the electrode must be determined. In the case of nanostructured TiO2, thinner (less than 1.5 μm) electrodes should be used.
Supplementary Materials
The following supporting information can be downloaded at: https://www.mdpi.com/article/10.3390/catal13040671/s1, Figure S1: XRD data of obtained nanostructures at various reaction times, annealing atmosphere, and temperature annealed in (a) air and (b) argon atmosphere. Figure S2. Reflectance spectra Rdiff for 3D flower-like nanostructures after annealing in argon and the air at (a) 450 and (b) 600 °C. Table S1. Optical bandgap values for flower-like 3D nanostructures annealed at various conditions.
Author Contributions
Conceptualization, A.K. and M.R.; methodology, A.K. and M.R.; Raman spectroscopy measurements, P.J. and M.S.; XRD in-situ measurements, K.Ś.; validation, A.K. and M.R.; synthesis and PEC behavior investigation, A.K.; writing—original draft preparation, A.K. and M.R.; writing—review and editing, A.K. and M.R.; visualization, A.K. and M.R.; supervision, M.R.; project administration, M.R.; funding acquisition, A.K. and M.R.; All authors have read and agreed to the published version of the manuscript.
Funding
This research was supported by the program “Excellence initiative—research university” for the University of Science and Technology (M.R., A.K.)
Institutional Review Board Statement
Not applicable.
Informed Consent Statement
Not applicable.
Data Availability Statement
Not applicable.
Acknowledgments
The authors would like to thank Kinga Michalec for support.
Conflicts of Interest
The authors declare no conflict of interest.
References
- Fujishima, A.; Honda, K. Electrochemical photolysis of water at a semiconductor electrode. Nature 1972, 238, 37–38. [Google Scholar] [CrossRef]
- Li, J.; Wu, N. Semiconductor-based photocatalysts and photoelectrochemical cells for solar fuel generation: A review. Catal. Sci. Technol. 2015, 5, 1360–1384. [Google Scholar] [CrossRef]
- Sar, J.; Kolodziejak, K.; Wysmulek, K.; Orlinski, K.; Kusior, A.; Radecka, M.; Trenczek-Zajac, A.; Zakrzewska, K.; Pawlak, D.A.; Pawlak, D.A. Eutectic Composites for Photoelectrochemical Solar Cells (PSCs). In Photoelectrochemical Solar Cells; Scrivener Publishing LLC: Beverly, MA, USA, 2018; pp. 305–347. [Google Scholar]
- Tee, S.Y.; Win, K.Y.; Teo, W.S.; Koh, L.D.; Liu, S.; Teng, C.P.; Han, M.Y. Recent progress in energy-driven water splitting. Adv. Sci. 2017, 4, 1600337. [Google Scholar] [CrossRef] [Green Version]
- Marschall, R. Semiconductor composites: Strategies for enhancing charge carrier separation to improve photocatalytic activity. Adv. Funct. Mater. 2014, 24, 2421–2440. [Google Scholar] [CrossRef]
- Su, R.; Bechstein, R.; Sø, L.; Vang, R.T.; Sillassen, M.; Esbjörnsson, B.; Palmqvist, A.; Besenbacher, F. How the anatase-to-rutile ratio influences the photoreactivity of TiO2. J. Phys. Chem. C 2011, 115, 24287–24292. [Google Scholar] [CrossRef]
- Wahab, A.K.; Ould-Chikh, S.; Meyer, K.; Idriss, H. On the “possible” synergism of the different phases of TiO2 in photo-catalysis for hydrogen production. J. Catal. 2017, 352, 657–671. [Google Scholar] [CrossRef]
- Zhang, H.; Banfield, J.F. Understanding polymorphic phase transformation behavior during growth of nanocrystalline aggregates: Insights from TiO2. J. Phys. Chem. B 2000, 104, 3481–3487. [Google Scholar] [CrossRef]
- Hanaor, D.A.H.; Sorrell, C.C. Review of the anatase to rutile phase transformation. J. Mater. Sci. 2011, 46, 855–874. [Google Scholar] [CrossRef] [Green Version]
- Jing, Z.; Qian, X.; Meijun, L.; Zhaochi, F.; Can, L. UV raman spectroscopic study on TiO2. II. effect of nanoparticle size on the outer/inner phase transformations. J. Phys. Chem. C 2009, 113, 1698–1704. [Google Scholar] [CrossRef]
- Gilbert, B.; Zhang, H.; Huang, F.; Finnegan, M.P.; Waychunas, G.A.; Banfield, J.F. Special phase transformation and crystal growth pathways observed in nanoparticles. Geochem. Trans. 2003, 4, 20–27. [Google Scholar] [CrossRef]
- Li, W.; Ni, C.; Lin, H.; Huang, C.P.; Shah, S.I. Size dependence of thermal stability of TiO2 nanoparticles. J. Appl. Phys. 2004, 96, 6663–6668. [Google Scholar] [CrossRef] [Green Version]
- Ranade, M.R.; Navrotsky, A.; Zhang, H.Z.; Banfield, J.F.; Elder, S.H.; Zaban, A.; Borse, P.H.; Kulkarni, S.K.; Doran, G.S.; Whitfield, H.J. Energetics of nanocrystalline TiO2. Proc. Natl. Acad. Sci. USA 2001, 99, 6476–6481. [Google Scholar] [CrossRef] [PubMed] [Green Version]
- Lu, H.M.; Zhang, W.X.; Jiang, Q. Phase Stability of Nanoanatase. Adv. Eng. Mater. 2003, 5, 787–788. [Google Scholar] [CrossRef]
- Zhang, H.; Banfield, J.F. Thermodynamic analysis of phase stability of nanocrystalline titania. J. Mater. Chem. 1998, 8, 2073–2076. [Google Scholar] [CrossRef]
- Ariana, R. Electronic and optical properties of three phases of titanium dioxide: Rutile, anatase, and brookite. Phys. Rev. B 2016, 51, 13023. [Google Scholar] [CrossRef]
- Sang, L.; Zhao, Y.; Burda, C. TiO2 nanoparticles as functional building blocks. Am. Chem. Soc. 2014, 114, 9283–9318. [Google Scholar] [CrossRef] [PubMed]
- Bai, J.; Zhou, B. Titanium dioxide nanomaterials for sensor applications. Chem. Rev. 2014, 114, 10131–10176. [Google Scholar] [CrossRef] [PubMed]
- Hsu, Y.C.; Lin, H.C.; Chen, C.H.; Liao, Y.T.; Yang, C.M. Nonaqueous seeded growth of flower-like mixed-phase titania nanostructures for photocatalytic applications. J. Solid State Chem. 2010, 183, 1917–1924. [Google Scholar] [CrossRef]
- Hurum, D.C.; Agrios, A.G.; Gray, K.A.; Rajh, T.; Thurnauer, M.C. Explaining the enhanced photocatalytic activity of Degussa P25 mixed-phase TiO2 using EPR. J. Phys. Chem. B 2003, 107, 4545–4549. [Google Scholar] [CrossRef]
- Li, G.; Ciston, S.; Saponjic, Z.V.; Chen, L.; Dimitrijevic, N.M.; Rajh, T.; Gray, K.A. Synthesizing mixed-phase TiO2 nanocomposites using a hydrothermal method for photo-oxidation and photoreduction applications. J. Catal. 2008, 253, 105–110. [Google Scholar] [CrossRef]
- Sclafani, A.; Herrmann, J.M. Comparison of the photoelectronic and photocatalytic activities of various anatase and rutile forms of titania in pure liquid organic phases and in aqueous solutions. J. Phys. Chem. 1996, 100, 13655–13661. [Google Scholar] [CrossRef]
- Siah, W.R.; Lintang, H.O.; Shamsuddin, M.; Yuliati, L. High photocatalytic activity of mixed anatase-rutile phases on commercial TiO2 nanoparticles. IOP Conf. Ser. Mater. Sci. Eng. 2016, 107, 012005. [Google Scholar] [CrossRef]
- Zhang, J.; Chen, X.; Bai, Y.; Li, C.; Gao, Y.; Li, R.; Li, C. Boosting photocatalytic water splitting by tuning built-in electric field at phase junction. J. Mater. Chem. A 2019, 7, 10264–10272. [Google Scholar] [CrossRef]
- Boehme, M.; Ensinger, W. Mixed phase anatase/rutile titanium dioxide nanotubes for enhanced photocatalytic degradation of methylene-blue. Nano-Micro. Lett. 2011, 3, 236–241. [Google Scholar] [CrossRef] [Green Version]
- Tiwari, A.; Mondal, I.; Ghosh, S.; Chattopadhyay, N.; Pal, U. Fabrication of mixed phase TiO2 heterojunction nanorods and their enhanced photoactivities. Phys. Chem. Chem. Phys. 2016, 18, 15260–15268. [Google Scholar] [CrossRef] [PubMed]
- Luo, Y.; Liu, X.; Huang, J. Heterogeneous nanotubular anatase/rutile titania composite derived from natural cellulose substance and its photocatalytic property. CrystEngComm 2013, 15, 5586–5590. [Google Scholar] [CrossRef]
- Płacheta, K.; Kot, A.; Banas-Gac, J.; Zając, M.; Sikora, M.; Radecka, M.; Zakrzewska, K. Evolution of surface properties of titanium oxide thin films. Appl. Surf. Sci. 2023, 608, 155046. [Google Scholar] [CrossRef]
- Li, A.; Wang, Z.; Yin, H.; Wang, S.; Yan, P.; Huang, B.; Wang, X.; Li, R.; Zong, X.; Han, H.; et al. Understanding the anatase-rutile phase junction in charge separation and transfer in a TiO2 electrode for photoelectrochemical water splitting. Chem. Sci. 2016, 7, 6076–6082. [Google Scholar] [CrossRef] [PubMed] [Green Version]
- He, Z.; Cai, Q.; Fang, H.; Situ, G.; Qiu, J.; Song, S.; Chen, J. Photocatalytic activity of TiO2 containing anatase nanoparticles and rutile nanoflower structure consisting of nanorods. J. Environ. Sci. (China) 2013, 25, 2460–2468. [Google Scholar] [CrossRef]
- Meng, M.; Li, C.; Li, J.; Wu, J.; Feng, Y.; Sun, L.; Yuan, H.; Liu, K. 3D TiO2 nanotube arrays with anatase-rutile phase junction and oxygen vacancies for promoted photoelectrochemical water splitting. J. Phys. D. Appl. Phys. 2023, 56, 055502. [Google Scholar] [CrossRef]
- Wang, Q.; Fang, X.; Hao, P.; Ren, H.; Zhao, Y.; Huang, F.; Xie, J.; Cui, G.; Tang, B. Controllable fabrication of TiO2 anatase/rutile phase junctions by a designer solvent for promoted photocatalytic performance. Chem. Commun. 2020, 56, 11827–11830. [Google Scholar] [CrossRef] [PubMed]
- Zhou, J.; Tian, G.; Chen, Y.; Wang, J.Q.; Cao, X.; Shi, Y.; Pan, K.; Fu, H. Synthesis of hierarchical TiO2 nanoflower with anatase-rutile heterojunction as Ag support for efficient visible-light photocatalytic activity. Dalt. Trans. 2013, 42, 11242–11251. [Google Scholar] [CrossRef] [PubMed]
- Zhang, W.; He, H.; Tian, Y.; Lan, K.; Liu, Q.; Wang, C.; Liu, Y.; Elzatahry, A.; Che, R.; Li, W.; et al. Synthesis of uniform ordered mesoporous TiO2 microspheres with controllable phase junctions for efficient solar water splitting. Chem. Sci. 2019, 10, 1664–1670. [Google Scholar] [CrossRef] [Green Version]
- Kusior, A.; Wnuk, A.; Trenczek-Zajac, A.; Zakrzewska, K.; Radecka, M. TiO2 nanostructures for photoelectrochemical cells (PECs). Int. J. Hydrogen Energy 2015, 40, 4936–4944. [Google Scholar] [CrossRef]
- Radecka, M.; Kusior, A.; Trenczek-Zajac, A.; Zakrzewska, K. Oxide Nanomaterials for Photoelectrochemical Hydrogen Energy Sources; Elsevier Ltd.: London, UK, 2018; Volume 72, ISBN 9780128150771. [Google Scholar]
- Park, T.J.; Levchenko, A.A.; Zhou, H.; Wong, S.S.; Navrotsky, A. Shape-dependent surface energetics of nanocrystalline TiO2. J. Mater. Chem. 2010, 20, 8639–8645. [Google Scholar] [CrossRef]
- Peng, X.; Wang, J.; Thomas, D.F.; Chen, A. Tunable growth of TiO2 nanostructures on Ti substrates. Nanotechnology 2005, 16, 2389–2395. [Google Scholar] [CrossRef]
- Hardcastle, F.D.; Ishihara, H.; Sharma, R.; Biris, A.S. Photoelectroactivity and Raman spectroscopy of anodized titania (TiO2) photoactive water-splitting catalysts as a function of oxygen-annealing temperature. J. Mater. Chem. 2011, 21, 6337–6345. [Google Scholar] [CrossRef]
- Huang, J.H.; Wong, M.S. Structures and properties of titania thin films annealed under different atmosphere. Thin Solid Films 2011, 520, 1379–1384. [Google Scholar] [CrossRef]
- Mali, S.S.; Shinde, P.S.; Betty, C.A.; Bhosale, P.N.; Lee, W.J.; Patil, P.S. Nanocoral architecture of TiO2 by hydrothermal process: Synthesis and characterization. Appl. Surf. Sci. 2011, 257, 9737–9746. [Google Scholar] [CrossRef]
- Ma, W.; Lu, Z.; Zhang, M. Investigation of structural transformations in nanophase titanium dioxide by Raman spectroscopy. Appl. Phys. A Mater. Sci. Process. 1998, 66, 621–627. [Google Scholar] [CrossRef]
- Zhang, L.; Ding, Q.; Zhou, Y. Hydrothermal synthesis of anatase flower-like nanostructures for photocatalytic degradation of dye. Cryst. Res. Technol. 2011, 46, 1202–1206. [Google Scholar] [CrossRef]
- Qian, Y.; Chen, Q.; Chen, Z.; Fan, C.; Zhou, G. Preparation of ultrafine powders of TiO2 by hydrothermal H2O2 oxidation starting from metallic Ti. J. Mater. Chem. 1993, 3, 203–205. [Google Scholar] [CrossRef]
- Tengvall, P.; Elwing, H.; Lundström, I. Titanium gel made from metallic titanium and hydrogen peroxide. J. Colloid Interface Sci. 1989, 130, 405–413. [Google Scholar] [CrossRef]
- Tengvall, P.; Lundström, I.; Sjöqvist, L.; Elwing, H.; Bjursten, L.M. Titanium-hydrogen peroxide interaction: Model studies of the influence of the inflammatory response on titanium implants. Biomaterials 1989, 10, 166–175. [Google Scholar] [CrossRef]
- Low, J.M.; Curtain, B.; Philipps, M.; Liu, Z.Q.; Ionescu, M. High temperature diffraction study of in-situ crystallization of nanostructured TiO2 photocatalysts. J. Aust. Ceram. Soc. 2012, 48, 198–204. [Google Scholar]
- Zhang, H.; Banfield, J.F. New kinetic model for the nanocrystalline anatase-to-rutile transformation revealing rate dependence on number of particles. Am. Mineral. 1999, 84, 528–535. [Google Scholar] [CrossRef]
- Choudhury, B.; Choudhury, A. Local structure modification and phase transformation of TiO2 nanoparticles initiated by oxygen defects, grain size, and annealing temperature. Int. Nano Lett. 2013, 3, 55. [Google Scholar] [CrossRef] [Green Version]
- Zhang, J.; Li, M.; Feng, Z.; Chen, J.; Li, C. UV Raman spectroscopic study on TiO2-I. phase transformation at the surface and in the bulk. J. Phys. Chem. B 2006, 110, 927–935. [Google Scholar] [CrossRef] [PubMed]
- Chen, Q.; Liu, H.; Xin, Y.; Cheng, X. TiO2 nanobelts—Effect of calcination temperature on optical, photoelectrochemical and photocatalytic properties. Electrochim. Acta 2013, 111, 284–291. [Google Scholar] [CrossRef]
- Orendorz, A.; Brodyanski, A.; Lösch, J.; Bai, L.H.; Chen, Z.H.; Le, Y.K.; Ziegler, C.; Gnaser, H. Structural transformations in nanocrystalline anatase TiO2 films upon annealing in air. Surf. Sci. 2006, 600, 4347–4351. [Google Scholar] [CrossRef]
- Trenczek-Zajac, A.; Banas-Gac, J.; Radecka, M. TiO2@Cu2O n-n type heterostructures for photochemistry. Materials 2021, 14, 3725. [Google Scholar] [CrossRef]
- Radecka, M. TiO2 for photoelectrolytic decomposition of water. Thin Solid Films 2004, 451–452, 98–104. [Google Scholar] [CrossRef]
- Altowyan, A.S.; Shaban, M.; Abdelkarem, K.; El Sayed, A.M. The influence of electrode thickness on the structure and water splitting performance of iridium oxide nanostructured films. Nanomaterials 2022, 12, 3272. [Google Scholar] [CrossRef]
- Sengupta, D.; Das, P.; Mondal, B.; Mukherjee, K. Effects of doping, morphology and film-thickness of photo-anode materials for dye sensitized solar cell application—A review. Renew. Sustain. Energy Rev. 2016, 60, 356–376. [Google Scholar] [CrossRef]
- Fiechter, S.; Bogdanoff, P. Oxygen Evolution and Reduction Catalysts: Structural and Electronic Aspects of Transition Metal Based Compounds and Composites. In Photoelectrochemical Water Splitting. Materials, Processes and Architectures; The Royal Society of Chemistry: Cambridge, UK, 2013; ISBN 9781849737739. [Google Scholar]
- Trenczek-Zajac, A.; Banas, J.; Radecka, M. Photoactive TiO2/MoS2 electrode with prolonged stability. Int. J. Hydrogen Energy 2018, 43, 6824–6837. [Google Scholar] [CrossRef]
- Trenczek-Zajac, A.; Kusior, A.; Mazurków, J.; Michalec, K.; Synowiec, M.; Radecka, M. Interface design, surface-related properties, and their role in interfacial electron transfer. Part II: Photochemistry-related topics. Adv. Inorg. Chem. 2022, 79, 411–442. [Google Scholar] [CrossRef]
- Kusior, A.; Trenczek-Zajac, A.; Mazurków, J.; Michalec, K.; Synowiec, M.; Radecka, M. Interface design, surface-related properties, and their role in interfacial electron transfer. Part I: Materials-related topics. Adv. Inorg. Chem. 2022, 79, 373–409. [Google Scholar] [CrossRef]
- Lei, Y.; Yang, Y.; Zhang, P.; Zhou, J.; Wu, J.; Li, K.; Wang, W.; Chen, L. Controllable one-step synthesis of mixed-phase TiO2 nanocrystals with equivalent anatase/rutile ratio for enhanced photocatalytic performance. Nanomaterials 2021, 11, 1347. [Google Scholar] [CrossRef] [PubMed]
- Yaemsunthorn, K.; Kobielusz, M.; Macyk, W. TiO2 with tunable anatase-to-rutile nanoparticles ratios: How does the photoactivity depend on the phase composition and the nature of photocatalytic reaction? ACS Appl. Nano Mater. 2021, 4, 633–643. [Google Scholar] [CrossRef]
- Qiu, C.; Lin, J.; Shen, J.; Liu, D.; Zhang, Z.; Lin, H.; Wang, X. Regulation of the rutile/anatase TiO2 heterophase interface by Ni12P5 to improve photocatalytic hydrogen evolution. Catal. Sci. Technol. 2020, 10, 3709–3719. [Google Scholar] [CrossRef]
- Lee, S.; Cho, A.Y.; Rim, Y.S.; Park, J. Synergistic design of anatase-rutile TiO2 nanostructured heterophase junctions toward efficient photoelectrochemical water oxidation. Coatings 2020, 10, 557. [Google Scholar] [CrossRef]
- Trenczek-Zajac, A.; Banas, J. Pre-and post-oxidation treatment of titanium as a method of improving the response of TiO2-based photoanodes in PECs. Funct. Mater. Lett. 2016, 9, 1641004. [Google Scholar] [CrossRef]
- Patterson, A.L. The Scherrer formula for X-ray particle size determination. Phys. Rev. 1939, 56, 978–982. [Google Scholar] [CrossRef]
- Spurr, R.A.; Myers, H. Quantitative analysis of anatase-rutile mixtures with an X-Ray diffractometer. Anal. Chem. 1957, 29, 760–762. [Google Scholar] [CrossRef]
Figure 1.
The surface and cross-section SEM images of obtained 3D flower-like titanium dioxide nanostructures.
Figure 1.
The surface and cross-section SEM images of obtained 3D flower-like titanium dioxide nanostructures.

Figure 2.
The impact of reaction time on the amount of anatase fraction in different annealing atmospheres at 600 °C.
Figure 2.
The impact of reaction time on the amount of anatase fraction in different annealing atmospheres at 600 °C.

Figure 3.
The Raman spectra of the (a) as-obtained nanostructured layers, after annealing at (b) 450°C, and at 600° (c) in the air, and (d) argon atmosphere.
Figure 3.
The Raman spectra of the (a) as-obtained nanostructured layers, after annealing at (b) 450°C, and at 600° (c) in the air, and (d) argon atmosphere.

Figure 4.
XRD in situ measurement (300°-600°C) of TiO2 flower-like nanostructures obtained for 15 (a) and 240 min (b).
Figure 4.
XRD in situ measurement (300°-600°C) of TiO2 flower-like nanostructures obtained for 15 (a) and 240 min (b).

Figure 5.
XRD in situ kinetic phase transition at 500°C of TiO2 flower-like nanostructures obtained in 120 min synthesis process (a) with corresponding crystallite size changes (b). Growth of anatase and rutile crystallites as a function of the annealing temperature used, and the chemical oxidation time of the titanium foil (c).

Figure 6.
Cross section of the obtained flower-like nanostructure after 240 min titanium foil chemical oxidation and annealing at 600°C in Ar.
Figure 6.
Cross section of the obtained flower-like nanostructure after 240 min titanium foil chemical oxidation and annealing at 600°C in Ar.

Figure 7.
Characteristic of current vs voltage, Iph-VB for flower-like TiO2 nanostructures after annealing at 600°C in argon (a) and dependence of the photocurrent (at 1250 mV) and anatase fraction on the electrode thickness (b).
Figure 7.
Characteristic of current vs voltage, Iph-VB for flower-like TiO2 nanostructures after annealing at 600°C in argon (a) and dependence of the photocurrent (at 1250 mV) and anatase fraction on the electrode thickness (b).

Figure 8.
The photocurrent at 1250 mV vs anatase fraction fA for different flower-like TiO2 photoanodes.
Figure 8.
The photocurrent at 1250 mV vs anatase fraction fA for different flower-like TiO2 photoanodes.

Figure 9.
Schematic diagram of the processes that occur in PEC cells with a photoanode based on flower-like TiO2.
Figure 9.
Schematic diagram of the processes that occur in PEC cells with a photoanode based on flower-like TiO2.

Table 2.
Structural features of flower-like 3D nanostructures.
| t (min) | TiO2 Nanoflowers | |||||||||
|---|---|---|---|---|---|---|---|---|---|---|
| 450 °C | 600 °C | l (μm) | ||||||||
| Argon | Air | |||||||||
| dXRD (nm) | fA (%) | dXRD (nm) | fA (%) | dXRD (nm) | fA (%) | |||||
| Argon | Air | Anatase | Rutile | Anatase | Rutile | |||||
| 15 | 8 | 14 | 97–99 | 13 | 19 | 21.7 | 15 | 13 | 73.7 | 0.71 |
| 30 | 8 | 10 | 16 | 22 | 37.7 | 16 | 13 | 72.0 | 0.99 | |
| 45 | 10 | 11 | 14 | 20 | 56.6 | 17 | 15 | 77.2 | 1.40 | |
| 60 | 9 | 12 | 15 | 19 | 77.1 | 17 | 16 | 75.9 | 1.58 | |
| 120 | 12 | 17 | 17 | 88.7 | 19 | 16 | 83.5 | 2.30 | ||
| 160 | 13 | 18 | 12 | 92.8 | 3.21 | |||||
| 240 | 13 | 19 | 5 | 95.0 | 4.01 | |||||
1 t—reaction time, dXRD—crystallite size, fA—anatase weigh fraction, l—sample thickness.
Disclaimer/Publisher’s Note: The statements, opinions and data contained in all publications are solely those of the individual author(s) and contributor(s) and not of MDPI and/or the editor(s). MDPI and/or the editor(s) disclaim responsibility for any injury to people or property resulting from any ideas, methods, instructions or products referred to in the content. |
© 2023 by the authors. Licensee MDPI, Basel, Switzerland. This article is an open access article distributed under the terms and conditions of the Creative Commons Attribution (CC BY) license (https://creativecommons.org/licenses/by/4.0/).
Share and Cite
MDPI and ACS Style
Kusior, A.; Jeleń, P.; Sitarz, M.; Świerczek, K.; Radecka, M. 3D Flower-like TiO2 Nanostructures: Anatase-To-Rutile Phase Transformation and Photoelectrochemical Application. Catalysts 2023, 13, 671. https://doi.org/10.3390/catal13040671
AMA Style
Kusior A, Jeleń P, Sitarz M, Świerczek K, Radecka M. 3D Flower-like TiO2 Nanostructures: Anatase-To-Rutile Phase Transformation and Photoelectrochemical Application. Catalysts. 2023; 13(4):671. https://doi.org/10.3390/catal13040671
Chicago/Turabian StyleKusior, Anna, Piotr Jeleń, Maciej Sitarz, Konrad Świerczek, and Marta Radecka. 2023. "3D Flower-like TiO2 Nanostructures: Anatase-To-Rutile Phase Transformation and Photoelectrochemical Application" Catalysts 13, no. 4: 671. https://doi.org/10.3390/catal13040671
Note that from the first issue of 2016, this journal uses article numbers instead of page numbers. See further details here.